 Elena Herrmann1
 Wayne Young
 Douglas Rosendale
 Ralf Conrad
 Christian U. Riedel
 Markus Egert
- 1Faculty of Medical & Life Sciences, Institute of Precision Medicine, Furtwangen University, Villingen-Schwenningen, Germany
- 2AgResearch Ltd., Food Nutrition and Health Team, Grasslands Research Centre, Palmerston North, New Zealand
- 3The New Zealand Institute for Plant & Food Research Ltd., Palmerston North, New Zealand
- 4Department of Biogeochemistry, Max Planck Institute for Terrestrial Microbiology, Marburg, Germany
- 5Institute of Microbiology and Biotechnology, University of Ulm, Ulm, Germany
The impact of the intestinal microbiota on human health is becoming increasingly appreciated in recent years. In consequence, and fueled by major technological advances, the composition of the intestinal microbiota in health and disease has been intensively studied by high throughput sequencing approaches. Observations linking dysbiosis of the intestinal microbiota with a number of serious medical conditions including chronic inflammatory disorders and allergic diseases suggest that restoration of the composition and activity of the intestinal microbiota may be a treatment option at least for some of these diseases. One possibility to shape the intestinal microbiota is the administration of prebiotic carbohydrates such as resistant starch (RS). In the present study, we aim at establishing RNA-based stable isotope probing (RNA-SIP) to identify bacterial populations that are involved in the assimilation of RS using anaerobic in vitro fermentation of murine fecal material with stable [U13C] isotope-labeled potato starch. Total RNA from these incubations was extracted, processed by gradient ultracentrifugation and fractionated by density. 16S rRNA gene sequences were amplified from reverse transcribed RNA of high and low density fractions suspected to contain labeled and unlabeled RNA, respectively. Phylogenetic analysis of the obtained sequences revealed a distinct subset of the intestinal microbiota involved in starch metabolism. The results suggest Bacteroidetes, in particular genera affiliated with Prevotellaceae, as well as members of the Ruminococcacea family to be primary assimilators of resistant starch due to a significantly higher relative abundance in higher density fractions in RNA samples isolated after 2 h of incubation. Using high performance liquid chromatography coupled to isotope ratio mass spectrometry (HPLC-IRMS) analysis, some stable isotope label was recovered from acetate, propionate and butyrate. Here, we demonstrate the suitability of RNA-SIP to link specific groups of microorganisms with fermentation of a specific substrate. The application of RNA-SIP in future in vivo studies will help to better understand the mechanisms behind functionality of a prebiotic carbohydrate and its impact on an intestinal ecosystem with potential implications for human health.
Introduction
The human large bowel is a highly complex and dynamic ecosystem harboring an immense number of microorganisms (Riedel et al., 2014) and representing one of the most metabolically active sites in our body (Slavin, 2013). A balanced microbiota composition and associated metabolic activities have beneficial effects on host health and wellbeing (Topping and Clifton, 2001; Clemente et al., 2012). Although a remarkable variability in the composition of the intestinal microbiota across individuals is observed (Turnbaugh et al., 2010), the major phyla and the functionality encoded by this community are quite redundant (Turnbaugh et al., 2009; Human Microbiome Project, 2012). An essential function is the metabolic capacity to ferment complex dietary carbohydrates such resistant starch (RS) (Guarner and Malagelada, 2003). RS is defined as the fraction of food-derived starch that is resistant to digestion by host amylases in the upper digestive tract and transits intact to the large bowel, where it serves as a substrate for microbial growth and is transformed to short-chain fatty acids (SCFA; butyrate, propionate and acetate; Asp, 1992; Englyst et al., 1996). Besides several other functions, SCFAs are known to play a crucial role in host physiology (Koh et al., 2016; Morrison and Preston, 2016).
Several pathologies including chronic inflammatory diseases, allergies and colorectal cancer were shown to be associated with dysbiosis of the intestinal microbiota (Sekirov et al., 2010). On the other hand, administration of prebiotics such as RS may alleviate symptoms of inflammatory bowel disease (Jacobasch et al., 1999; Bassaganya-Riera et al., 2011) and reduce the risk for colorectal cancer (Hylla et al., 1998). Although the mechanisms behind these observations are not fully understood, it has been proposed that an increase in abundance of specific bacterial groups and their fermentation products following RS administration might mediate these effects (Zhang and Davies, 2016). For these reasons, application of RS may have clinical relevance in the treatment or prevention of these diseases (Holmes et al., 2012; Higgins and Brown, 2013). However, our understanding of the fate of ingested RS and the microbial populations utilizing RS in large intestine of humans and other (model) systems is rather limited.
Early cultivation-based studies described human gut bacteria able to grow on starch within the Bacteroidetes, Firmicutes, and Actinobacteria phyla, with a particular high number of isolates assigned to Bacteroides spp. (Salyers et al., 1977a,b). These results were supported by studies in different animal models showing increased levels of Bifidobacterium, Ruminococcus, Bacteroides, Lactobacillus, Eubacterium, Akkermansia, Allobaculum, Roseburia, and Prevotella upon administration of RS (Kleessen et al., 1997; Jacobasch et al., 1999; Silvi et al., 1999; Le Blay et al., 2003; Young et al., 2012; Tachon et al., 2013; Umu et al., 2015). Various of these organisms were shown to encode genes for starch utilization and may therefore be able to directly breakdown and utilize RS (Xu et al., 2003, 2007; Martens et al., 2009; Ze et al., 2015). Additionally, other groups of bacteria may show an increased abundance following administration of RS by cross-feeding on mono- and oligomers derived from RS-degradation by other bacteria or their metabolic end-products as shown in vitro (Belenguer et al., 2006; Ze et al., 2012; Rios-Covian et al., 2015). Collectively, these studies demonstrate the potential of RS to modify the composition of the intestinal microbiota.
With the advent of next-generation sequencing approaches targeting 16S rRNA gene sequences, profound insights into the diversity and dynamics of the colonic microbiota have been gained (Eckburg et al., 2005; Qin et al., 2010). However, approaches to profile the microbial composition solely based on sequencing of 16S rRNA genes lack the ability to directly link the microbiota to metabolic capacities, such as the assimilation of specific dietary fibers or (prebiotic) carbohydrates. A comprehensive analysis of the dynamics of prebiotic carbohydrate metabolism and of the mechanisms behind their impact on health and disease requires techniques that allow the identification of metabolically active groups of microorganisms within complex (intestinal) microbiotas.
Nucleic-acid based stable isotope probing (SIP) has become a valuable tool in environmental microbial ecology (Radajewski et al., 2000). This technique enables researchers to unravel the phylogeny of microorganisms that metabolize a specific, isotope-labeled (e.g., 13C) compound under in situ conditions (Boschker et al., 1998; Dumont and Murrell, 2005; Egert et al., 2006; Neufeld et al., 2007). Metabolically active microorganisms incorporate the stable isotope into biomass, including DNA and RNA. Selective recovery of labeled nucleic acids that allow phylogenetic analysis then facilitates identification of substrate-utilizing microorganisms. In particular, the use of RNA-SIP (Manefield et al., 2002b) provides advantages, as RNA is an indicator for cellular activity and, unlike DNA, is independent of cell division. Moreover, due to a greater synthesis rate of RNA, measurable amounts of 13C-labeled RNA in metabolically active organisms can be obtained in shorter time frames than DNA (Manefield et al., 2002a; Dumont and Murrell, 2005).
More recently, this methodology has also been introduced into the field of gut microbial ecology and was shown to be appropriate to study assimilation processes of simple and complex carbohydrates in situ (Egert et al., 2007; Kovatcheva-Datchary et al., 2009; Tannock et al., 2014; Young et al., 2015; Herrmann et al., 2017b). The purpose of this study was to establish RNA-SIP for identification of bacterial populations in murine feces involved in the assimilation of stable [U13C]-labeled potato starch, a source of RS, and to track the 13C label in the products of fermentation in an in vitro system using fecal samples of mice origin. We observed an incorporation of 13C into 16S rRNA after 2 h of incubation. Comparing 13C-labeled and unlabeled 16S rRNA pools revealed significant differences in their community structure. In addition, by monitoring specific fermentation products in culture supernatants using high performance liquid chromatography coupled to isotope ratio mass spectrometry (HPLC-IRMS), incorporation of the 13C-label into fermentation metabolites was observed, albeit at low amounts. Our study provides a basis for subsequent in vivo investigations, particularly in murine models, to address RS fermentation processes directly in the intestinal environment.
Materials and Methods
Collection and Cultivation of Murine Fecal Samples
Essentially, experiments were carried out as described previously (Herrmann et al., 2017b). In brief, fresh fecal pellets from eight healthy C57BL/6J mice were collected within 5 h of defecation. Since the aim of our study was to establish RNA-SIP for identification of murine fecal bacteria able to utilize RS instead of determining inter-individual variation in the populations of these bacteria, we opted for a pooling strategy. Animals were bred and housed at the animal facility of the University of Ulm in a specific pathogen-free (SPF) environment and given a standard laboratory diet with water ad libitum. Mice were routinely bred to maintain the colony of C57BL76 mice at the animal facility of the university and are not used for animal experimentation unless under a specific ethical approval for other studies. Collection of fecal samples from the cages does not constitute an invasive treatment, physical distress or even pain to animals and is thus not subject to ethics approval. Collected fecal pellets were pooled (total weight 1.9 g) and mixed with 12.7 mL of sterile, deoxygenated, and pre-warmed (37°C) M9 minimal medium (Smith and Levine, 1964) without glucose supplemented with 2 mg L−1 thiamin and 1 g L−1 casamino acids resulting in a 15% (w/v) fecal slurry (0 h, control). Deoxygenation of the medium prior to experiments was achieved by incubation in airtight jars under anaerobic conditions generated using AnaeroGen sachets (Merck, Darmstadt, Germany) 24 h prior to experiments. For each incubation, 1 mL of slurry material was diluted 1:2 with M9 minimal medium containing either 14.4 mg [12C] or 15 mg of uniformly (98%) labeled [U13C] potato starch, yielding a final concentration of 40 mM glucose unit equivalents and 7.5% (w/v) of fecal material. Both [12C] and [U13C]starch were obtained from the same manufacturer (IsoLife, Wageningen, Netherlands), were isolated from the same potato variety, and therefore presumably contained similar levels of RS. Diluted fecal material was incubated with the native [12C] or [U13C]potato starch in single 15-mL reaction tubes at 37°C for 2 h or 4 h in airtight jars under anaerobic conditions generated using AnaeroGen sachets (Merck, Darmstadt, Germany). AnaeroGen sachet will reduce the oxygen level in the jar to below 1% within 30 min (information by the supplier). Incubation times of 2 and 4 h were chosen on the basis of recent experiments from a previously published RNA-SIP study of our group with murine fecal slurries and labeled glucose as substrate (Herrmann et al., 2017b). The results of these preliminary experiments showed that even with an easily accessible substrate such as glucose, sampling times shorter than 2 h after addition of the substrate yielded only negligible amounts of labeled RNA. This indicates that the earliest time point for detection of bacteria that have incorporated the isotope label into RNA (and thus represent glucose utilizing bacteria) is 2 h. Based on these observations, 2 and 4 h were considered reasonable time points to identify RS-utilizing bacteria. Incubations for each condition (0 h, 2 h-12C, 2 h-13C, 4 h-12C, 4 h-13C) were carried out in technical duplicates using the same fecal slurry.
Nucleic Acid Extraction, Isopycnic Density Gradient Ultracentrifugation, Gradient Fractionation
Total RNA from each sample was extracted and residual genomic DNA was removed as described before (Herrmann et al., 2017b). After elution and quantification, absence of DNA was verified by PCR and total RNA was subsequently loaded into a cesium trifluoroacetate (CsTFA) centrifugation solution for density-dependent resolution by gradient ultracentrifugation following a previously published protocol (Herrmann et al., 2017a,b). Afterwards, gradients were fractionated and the buoyant density (BD) of each fraction was determined as previously described (Herrmann et al., 2017b). Briefly, CsTFA (average BD = 1.793 g mL−1) was loaded with ~700 ng RNA, filled into 8 mL Quick-Seal polypropylene tubes (BeckmanCoulter Inc., Krefeld, Germany) which were subsequently sealed. Sealed tubes were placed in an MLN-80 rotor in an Optima MAX-XP bench-top ultracentrifuge (both BeckmanCoulter Inc.) and subjected to ultracentrifugation at 123,100 × g (45,000 rpm) and 20°C for 67 h to establish density gradients. After centrifugation, density gradients were fractionated into 16 equal fractions (each 0.5 mL) by displacement with water from the top of the tube under a consistent flow rate of 1 mL min−1 using a syringe pump (World Precision Instruments, Berlin, Germany). BD of each fraction was determined by measuring the refraction of the solution using a refractometer (Reichert, Depew, NY, USA) and correlation to a previously established calibration curve. For subsequent analysis, RNA from each fraction was precipitated, washed and re-dissolved in nuclease-free water.
Reverse Transcription, Quantification of 16S rRNA in Gradient Fractions, 16S rRNA Amplicon Library Construction and Sequencing
The amount of bacterial 16S rRNA in each gradient fraction was determined by quantitative reverse transcription polymerase chain reaction (RT-qPCR) (Lueders et al., 2004) in a two-step assay. Total RNA in 10 μL of each gradient fraction, was reverse transcribed to complementary DNA (cDNA) using the SuperScript VILO cDNA Synthesis Kit (Life Technologies, Darmstadt, Germany) according to the manufacturer's protocol. The cDNA was then used as template in qPCR reactions with universal bacterial primers F_Bact 1369 (5′-CGG TGA ATA CGT TCC CGG-3′) and R_Prok1492 (5′-TAC GGC TAC CTT GTT ACG ACT T-3′) (Furet et al., 2009) on a Light-Cycler® 480 system (Roche, Mannheim, Germany). A PCR reaction of 25 μL contained 12.5 μL of 2x Maxima SYBR Green/ROX qPCR Master Mix (Life Technologies), 0.15 μL of each primer (50 μM; Metabion, Planegg/Steinkirchen, Germany), 0.25 μL bovine serum albumin (BSA; 20 mg mL−1; Roche), 9.95 μL of nuclease-free water and 2 μL of cDNA template. Amplification was carried out with the following thermal profile: 95°C for 10 min followed by 40 cycles of 95°C for 15 s (denaturation), 60°C for 30 s (annealing), and 72°C for 30 s (elongation). Serial dilutions of purified 16S rRNA gene amplicons of Escherichia coli K12 were used as an internal standard. Nucleic acid concentrations were calculated against the standard curve using the Light-Cycler® 480 software (version 1.5). To allow comparison between different gradients and samples, the 16S rRNA content in each fraction was normalized according to a procedure used by us (Herrmann et al., 2017b) and others (Lueders et al., 2004; Hatamoto et al., 2007). RNA content in different fractions is expressed as proportion (%) of the RNA content in the fraction of the same sample with the highest RNA concentration, which was set to 100%.
In order to identify the bacterial populations involved in RS assimilation, 16S rRNA gene amplicon libraries were constructed from the density-resolved and reverse-transcribed rRNA. Figures 1B–D shows the density fractions which were selected for sequencing. Gradient fractions 8–10 (Figures 1B–D) contained RNA in all preparations. Thus, they presumably represented unlabeled RNA and were designated “light” SIP fractions. A discernable amount of RNA in gradient fractions 3–5 (Figures 1B–D) were only obtained from the [U13C]starch incubations. These fractions presumably contained heavy, [13C]-labeled RNA of bacteria that actively metabolized labeled [U13C]starch and were designated “heavy” SIP fraction. Sequencing libraries of the respective density fractions were constructed from all incubations.
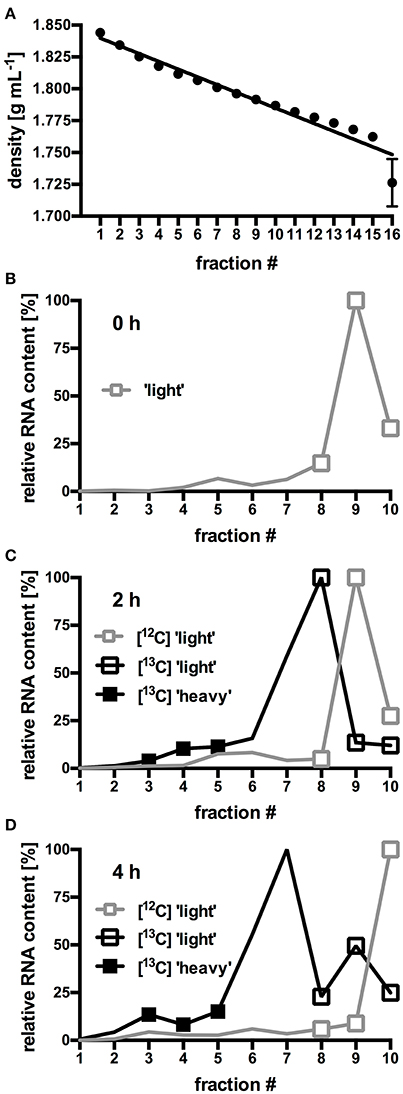
Figure 1. Buoyant density (BD) curves from isopycnic density gradients (A). Values represent mean and standard error (SEM) of 10 gradients. For each fraction, SEM was ≤0.02 g mL−1, error bars for fraction 1–15 are smaller than the symbols. (B–D) Relative amount of RNA in selected gradient fractions. RNA was isolated from fresh fecal slurry (0 h; B), and from slurries incubated with either [12C]starch or [13C]starch for 2 h (C) or 4 h (D). Values represent mean of duplicate incubations per gradient fraction. To facilitate comparison between different gradients, RNA content in each fraction was expressed as proportion (%) of the total amount of RNA found in the fraction containing the highest RNA concentration (Herrmann et al., 2017b). “Heavy” and “light” RNA from the fractions highlighted by symbols were selected for further analysis of microbiota composition by NGS.
Amplicon libraries representing the V3 and V4 regions of the bacterial 16S rRNA gene were prepared as previously described (Herrmann et al., 2017b). Briefly, 16S rRNA genes were amplified from cDNA of gradient fractions in a first PCR step using the locus-specific primer set S-D-Bact-0341-b-S-17 and S-D-Bact-0785-a-A-21 (Klindworth et al., 2013), to which overhang adaptor sequence tails were added. After purification of the obtained PCR products a second PCR step was performed to anneal unique dual-index barcodes with Illumina sequencing adaptors (Nextera XT index kit; Illumina, Eindhoven, Netherlands) to the amplicon target. The obtained 16S amplicon libraries were subjected to bead-purification using Agencourt AMPure XP beads (BeckmanCoulter Inc.) and size of the amplicons (~630 bp) was verified with a Bioanalyzer DNA 1000 chip (Agilent Technologies GmbH, Waldbronn, Germany). Quantities of each library were fluorometrically assessed using the Qubit dsDNA HS assay kit (Life Technologies). Finally, the uniquely indexed 16S amplicon libraries were pooled in equimolar amounts (4 nM) and sequenced in technical duplicates on an Illumina MiSeq platform (Illumina, Eindhoven, Netherlands) by Eurofins Genomic (Eurofins Genomic, Ebersberg, Germany) using the Illumina MiSeq 600 cycle Kit_V3 chemistry (2 x 300 bp PE; Illumina).
Sequencing Analysis and Statistics
Sequencing data were processed with QIIME 1.8 (Caporaso et al., 2010) as previously described (Herrmann et al., 2017b). To measure the bacterial diversity in the different density fractions, diversity analyses were performed using the core_diversity_analyses.py script. Faith's phylogenetic diversity estimate was calculated using the minimum number of reads (6397) across 10 iterations.
Statistical analyses of the sequencing data were performed using R 3.3.2 (R Core Team, 2015) to analyze the community structure represented by the cDNA of the 16S rRNA species present in the “heavy” and “light” fractions per time point and treatment; all presented results on the taxonomic composition were first averaged across the sequencing duplicates to obtain the community per fraction. Respective fractions were then averaged across both incubation duplicates (except for fraction 8, which is represented by only one incubation) and finally across the designated different density fractions (“heavy” and “light”), resulting in a total of seven different observation groups, each represented by three fractions (0 h “light,” 2 h [12C] “light,” 4 h [12C] “light,” 2 h [13C] “light,” 2 h [13C] “heavy,” 4 h [13C] “light,” and 4 h [13C] “heavy”).
Differences in the prevalence of bacterial taxa in the “light” SIP fractions during the course of the 12C-control incubations were assessed using non-parametric permutation ANOVA with time as factor. Differences in the prevalence of bacterial taxa between “heavy” and “light” SIP fractions of the [U13C]starch treatments were assessed using two-factor permutation ANOVA with time and density as factors. Both tests were implemented using the perm.anova function in the RVAideMemoire package for R (Hervé, 2015) with 1000 permutations. Adjustment of P-values for multiple testing was performed using the Benjamini & Hochberg false discovery rate (FDR) method, with FDR < 0.05 considered significant. Differences in alpha diversity were analyzed using two-factor ANOVA with incubation time and density as factors. Differences with a P-value < 0.05 were considered significant. Hierarchical cluster analysis of bacterial profiles was performed using distances calculated from centered Pearson's correlation and average linkage clustering.
All sequencing data were submitted to GenBank and are publicly available under the accession number PRJNA376059.
Profiling of Specific Fermentation Products during Starch Fermentation
Total concentration and 13C-enrichment of lactate, acetate, propionate, butyrate and isobutyrate stemming from bacterial fermentation in the fecal slurries were monitored using HPLC-C-IRMS (Thermoquest, Bremen, Germany) as described before (Conrad et al., 2007; Liu and Conrad, 2011).
Concentrations and retention times of acetate, propionate, butyrate and isobutyrate were determined by comparison with unlabeled standards. The isotopic signal of the 13C/12C ratio detected in the IRMS was calibrated with a CO2 gas standard, which was referenced against a methyl stearate working standard and calibrated at the Max Planck Institute for Biogeochemistry, Jena, Germany (courtesy W.A. Brand). The proportion of labeled SCFA was calculated as atom percent excess (APE). This was achieved by measuring concentration of 13C-labeled SCFA in untreated and [12C]starch-treated samples. Consistent with the natural abundance of 13C, a stable proportion of 1.08% of all SCFA in these samples was 13C-labeled. This value was subtracted from the percentage of labeled SCFA in samples of [U13C]starch incubations to obtain APE.
Results
RNA Recovery and PCR Amplification of 16S rRNA
In order to identify bacteria able to utilize RS, slurries prepared from fresh murine fecal pellets were incubated with [U13C]potato starch and incorporation of the 13C-label into bacterial RNA was determined. The fractionated centrifugation gradients showed decreasing average BDs (Figure 1A) ranging from 1.844 g mL−1 (fraction 1) to 1.726 g mL−1 (fraction 16) which indicated an adequately linear gradient formation.
In gradients containing only unlabeled [12C]RNA species originating from fresh fecal slurry (0 h; Figure 1B) and from slurries incubated with [12C]starch for 2 h (Figure 1C) and 4 h (Figure 1D), an almost identical RNA distribution pattern was observed: The bulk of the unlabeled RNA species was present in low density fractions (≤1.796 g mL−1; ≥fraction 8) with peak amounts detected in fraction 9 (1.792 g mL−1) after 0 h and 2 h of incubation and in fraction 10 (1.787 g mL−1) after 4 h of incubation. In gradients containing RNA extracted from fecal slurries incubated with the [U13C]starch, RNA content slightly shifted toward higher density fractions (≥1.796 g mL−1; ≤fraction 8) with the highest concentration accumulated in fraction 8 and 7 (1.796–1.801 g mL−1) after 2 and 4 h of incubation respectively (Figures 1C and D). Moreover, in these samples a second, smaller peak in RNA quantity was observed in fraction 3–5 (1.812–1.825 g mL−1).
Bacterial Structure of Fresh and Incubated Fecal Communities
Sequencing of the selected RNA-SIP fractions generated a total of 2,407,933 paired end sequences with an average of 32,985 sequences per sample (minimum 6,397, maximum 109,654, standard deviation 20,421). The obtained 16S rRNA gene sequences in the entire dataset were affiliated with nine phyla, 16 classes, 25 orders, 52 families and 98 genera.
“Light” fractions collected from the unlabeled [12C]starch fermentations were analyzed to show how the overall fecal community changed during the course of incubation. In line with a previous study using fecal slurries of animals housed in the same facility (Herrmann et al., 2017b), Firmicutes was the dominant phylum in fresh fecal content followed by Bacteroidetes and Proteobacteria (Table 1, 0 h). Verrucomicrobia, Actinobacteria, Tenericutes and Deferribacteres were detected at low frequencies, and 0.4% of the sequences remained unclassified. Clostridia was the most prevalent class with sequences affiliated to unclassified Lachnospiraceae, unclassified Clostridiales, Dorea and unclassified Ruminococcaceae dominating the community (Figure 2A, 0 h “light”). In almost equal relative frequencies, Bacilli and Bacteroidia were the second most dominant classes with Lactobacillus and unclassified Porphyromonadaceae as their most abundant representatives (Table 1 and Figure 2A). Structural changes in the bacterial community were observed over the course of incubation in the 12C-control fermentations (Table 1 and Figure 2A). A significant drop in Firmicutes (FDR = 0.02), mainly caused by reduction of the abundant unclassified Lachnospiraceae, was observed. This drop was accompanied by an increase in the relative abundances of the majority of the other taxa detected. The most prominent increase in abundance was observed for Bacteroidetes (FDR = 0.02) and Proteobacteria (FDR = 0.064). However, community profiles were still dominated by Firmicutes.
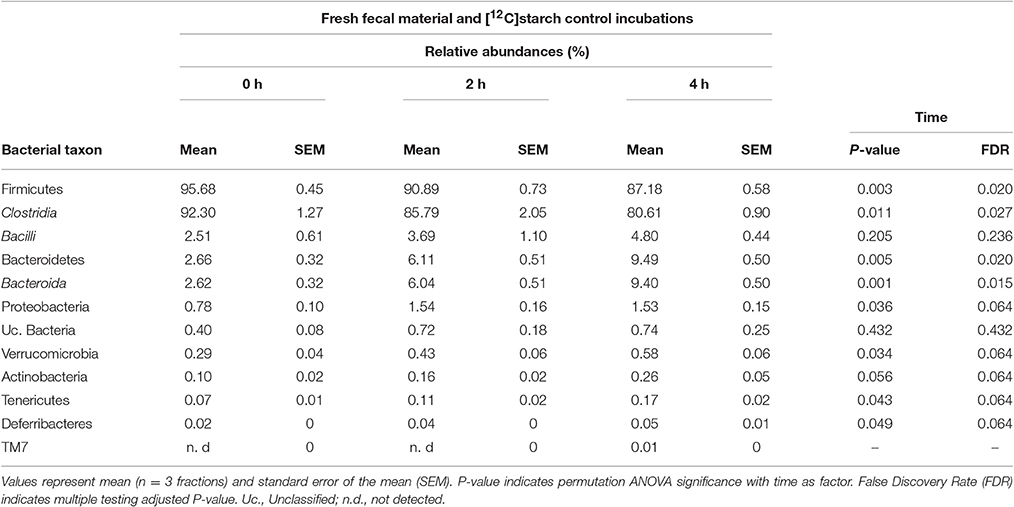
Table 1. Relative abundances of bacterial taxa represented by 16S rRNA gene amplicons in “light” RNA-SIP fractions obtained from fresh fecal slurry material (0 h) or after incubation with [12C]starch for 2 and 4 h.
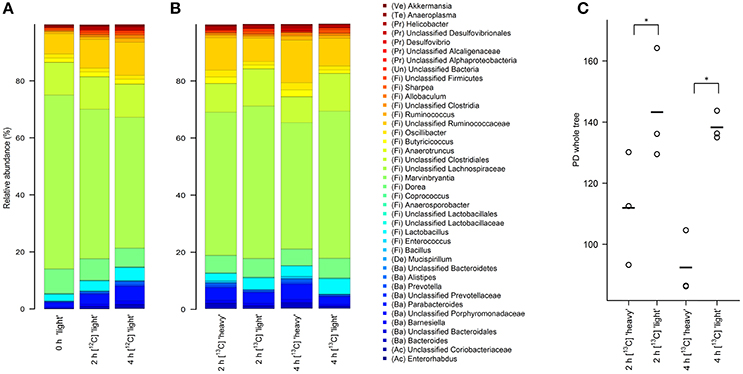
Figure 2. Stacked barplots showing the average bacterial microbiota composition represented by 16S rRNA gene amplicons in different density SIP fractions. RNA was isolated from fresh fecal content (0 h) or after 2 and 4 h of incubation in the presence of unlabeled [12C]starch (A) or isotope-labeled [U13C]starch (B). The 40 taxa with highest mean relative abundance across all samples are shown. (C) Faith's phylogenetic diversity estimate in “heavy” and “light” RNA fractions of the [U13C]starch fed communities after 2 and 4 h of incubation. *Indicates significance in complexity at p < 0.01 as calculated by two-factor ANOVA with time and density as factors.
Prolific Users of Resistant Starch Derived Carbon
As a first step toward the identification of bacterial populations involved in RS fermentation, community profiles in “heavy” and “light” density fractions of the 13C-fed cultures were analyzed for proportional differences of individual taxa (Wüst et al., 2011; Young et al., 2015). Previous studies have shown that the amount of 13C in RNA is directly linked to the bouyant density and RNA molecules with different proportions of 13C can be separated by density centrifugation and fractionation (Manefield et al., 2002b). Moreover, nucleic acid samples from RNA- and DNA-SIP experiments with increased BD also had an enrichment in 13C-contents, i.e., higher density fractions indeed contained 13C-labeled RNA/DNA, as measured independently by IRMS (Manefield et al., 2002a; Shao et al., 2014). We therefore considered it reasonable to assume that “heavy” fractions from samples incubated with [U13C]starch contained isotope labeled RNA. Sequencing profiles revealed a complex bacterial community structure consisting of many taxa in the “heavy” fractions after 2 and 4 h of incubation in the presence of [U13C]starch (Figure 2B). However, in these fractions alpha diversity was significantly (P < 0.01) lower compared to the corresponding “light” fractions at both time points (Figure 2C). Moreover, hierarchical clustering analysis showed bacterial profiles from the “heavy” fractions were clearly separated from the profile of the “light” fractions as well as a delineation between the “heavy” fractions of both time points (Figure 3).
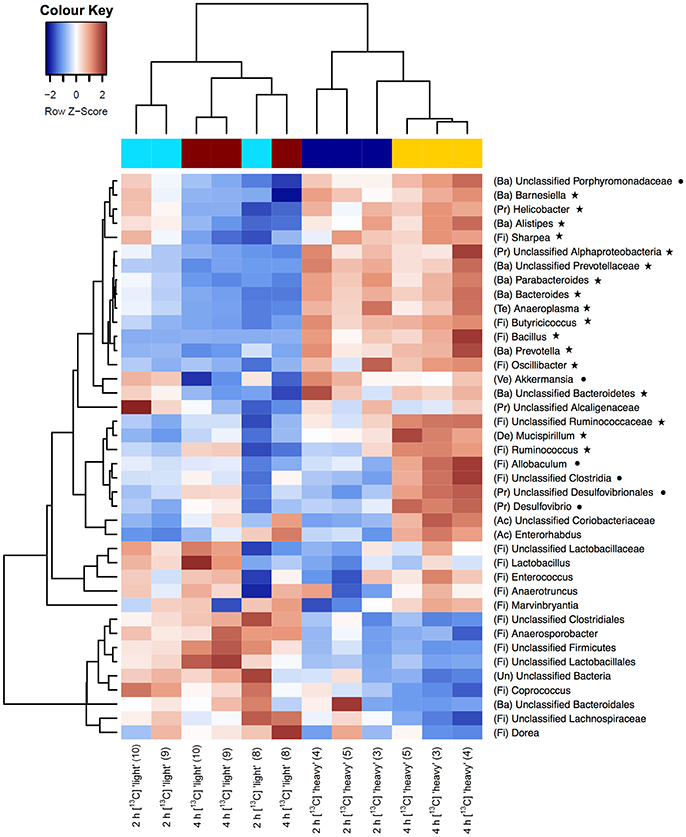
Figure 3. Heatmaps showing hierarchical clustering of bacterial community composition profiles of the 40 most abundant taxa represented by 16S rRNA gene amplicons per analyzed sample of the “heavy” and “light” SIP fractions. RNA was isolated from fecal slurries following incubation with [U13C]starch after 2 h or 4 h. Heatmap color (blue to dark red) displays the row scaled relative abundance of each taxon across all samples. The number in parentheses indicates the corresponding fraction number. Letters in parentheses preceding taxonomic labels indicate the phylum (Ac, Actinobacteria; Ba, Bacteroidetes; De, Deferribacteres; Fi, Firmicutes; Pr, Proteobacteria; Ve, Verrucomicrobia; Un, Unclassified). Symbols behind taxonomic labels indicate significant higher relative abundance at FDR ≤ 0.05 of taxa in “heavy” fractions compared with “light” fractions after 2 h (⋆) or 4 h (•).
At the phylum level, the relative abundance of Bacteroidetes was considerably increased in “heavy” SIP fractions (FDR = 0.003) compared with their “light” counterpart. Similarly, proportions of Proteobacteria were also enriched in “heavy” gradient fractions (FDR = 0.017), whereas a significant decrease in Firmicutes was detected (FDR = 0.005) (Table 2 and Supplementary Figure S1).
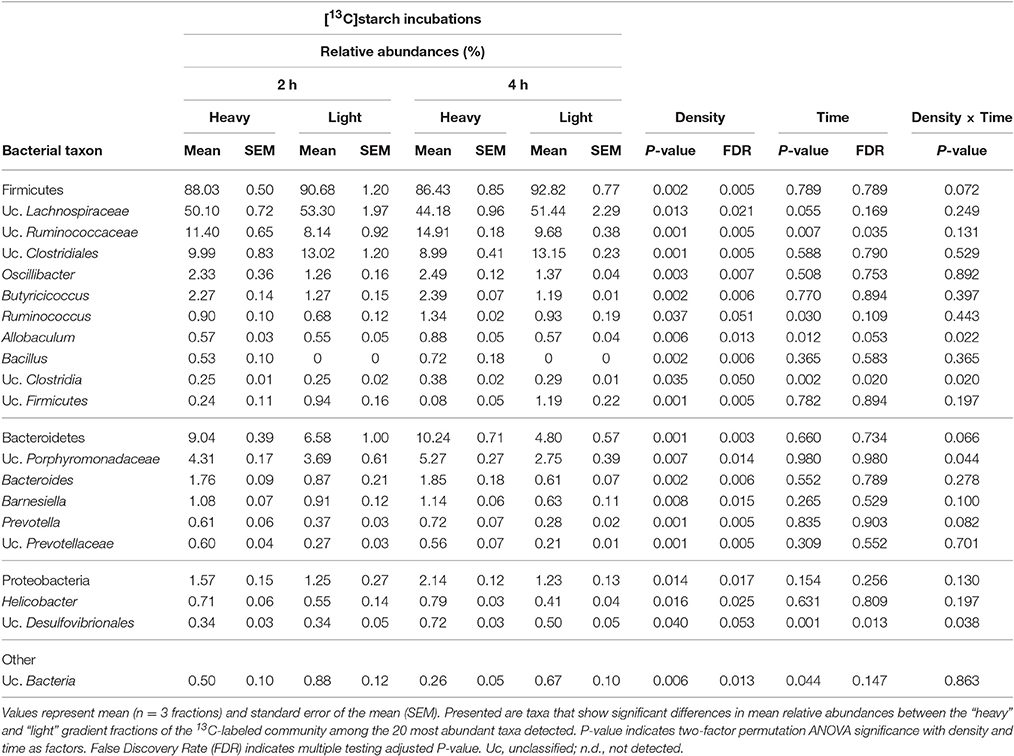
Table 2. Prevalence of bacterial taxa represented by 16S rRNA gene amplicons in “light” and “heavy” RNA-SIP fractions obtained from incubations with [13C]starch for 2 and 4 h.
Among the 40 most abundant taxa, identified at the lowest taxonomic level available, 23 showed a significantly increased prevalence in the “heavy” SIP fractions (FDR < 0.05) compared to the “light” fractions. After 2 h of incubation, the taxa that dominated the community were assigned to unclassified Ruminococcaceae, unclassified Prevotellaceae and Prevotella spp. (FDR = 0.005; Table 2 and Supplementary Figure S1). In addition, a diverse array of sequences affiliated with Butyricicoccus, Bacteroides, Bacillus (all FDR = 0.006), Oscillibacter (FDR = 0.007), Barnesiella (FDR = 0.015), Helicobacter (FDR = 0.025) and, to a lesser extent, Ruminococcus spp. (FDR = 0.051) showed increased relative abundances in the “heavy” fractions (Table 2). Moreover, unclassified Ruminococcaceae (FDR = 0.035) and, to a lesser extent, Ruminococcus (FDR = 0.109) increased in relative proportions between 2 and 4 h of incubation (Table 2).
Based on a significant interaction P-value obtained between density and time (all P ≤ 0.044), Allobaculum (FDR = 0.013), unclassified Porphyromonadaceae (FDR = 0.014), unclassified Clostridia (FDR = 0.05) and, to a lesser extent, unclassified Desulfovibrionales (FDR = 0.053) were detected in increased proportions in the “heavy” fractions after 4 h of incubation in the presence of the [U13C]starch (Table 2). The increase of these taxa was associated with a decrease in the relative abundance of unclassified Clostridiales, unclassified Firmicutes (both FDR = 0.005), unclassified Bacteria (FDR = 0.013), unclassified Lachnospiraceae (FDR = 0.021) and some minor abundant taxa (Table 2 and Supplementary Figure S1).
13C-Labeled Metabolite Production
HPLC-IRMS analysis was used to trace the 13C-label derived from the [U13C]starch into fermentation metabolites produced by the murine fecal microbiota from the same incubations as used for the RNA isolation. An almost identical pattern was observed in fermentations with [U13C]starch and [12C]starch with acetate (~12 mM), propionate (~4 mM), and butyrate (~2 mM) being the most abundant SCFA. The branched-chain SCFA (BCFA) iso-butyrate was also detected, albeit in lower amounts (Table 3). Interestingly, lactate (0.61 mM) was only detected in fresh fecal slurry at the start of the fermentation process. However, during the course of fermentation, no considerable changes in concentrations of SCFA could be observed (Table 3). Nevertheless, incorporation of the isotope-label from the [U13C]starch into the SCFA, expressed as atom percent excess (APE), could be detected consistently (Table 3). After 2 h, 0.95, 1.46, and 0.39% of labeled acetate, propionate and butyrate, respectively, was derived from RS. These proportions increased to, 2.00, 2.75, and 1.11%, respectively, after 4 h of incubation.
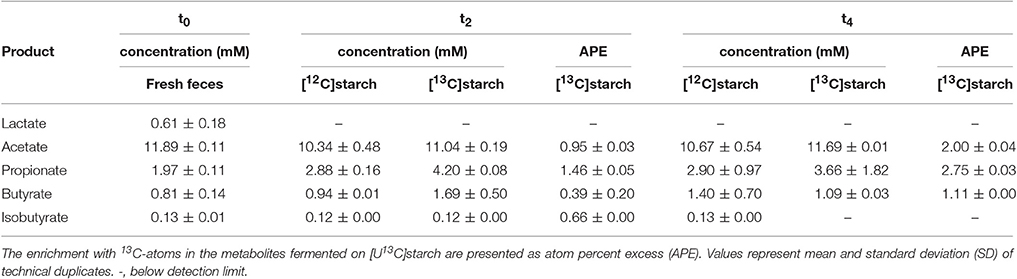
Table 3. Time profiles of concentration and relative 13C-enrichment of metabolites in fresh fecal slurry (0 h, t0) and 2 (t2) and 4 h (t4) after addition of either [12C]starch or [U13C]starch at a concentration equivalent to 40 mM of glucose.
Discussion
The consumption of complex carbohydrates, such as RS, is known to influence colonic function and to have an impact on host health and well-being (Nugent, 2005; Birt et al., 2013). In various animal studies, ingested RS induced changes in the composition of the intestinal microbiota. For example, increased levels of Bifidobacterium, Bacteroides, Lactobacillus, and Eubacterium as well as specific fermentation end products were observed (Kleessen et al., 1997; Jacobasch et al., 1999; Silvi et al., 1999; Bird et al., 2000; Le Blay et al., 2003; Young et al., 2012). However, in most cases a direct link between specific intestinal bacteria and utilization of a particular substrate in situ without the need for bulk enrichments has not been demonstrated. In the present study, we used RNA-SIP together with high throughput 16S rRNA sequencing and profiling of selected 13C-labeled metabolites to unravel the phylogenetic identity of bacteria implicated in intestinal fermentation of RS. Fermentation experiments were performed with a single slurry obtained by pooling and homogenizing fecal pellets of eight individual mice. While this approach may not allow to identify inter-individual variations in microbial populations in response to RS, it has been demonstrated that pooling of fecal samples for microbiota profiling does not result in a pathologically altered composition of the pooled community vs. non-pooled individual samples (Aguirre et al., 2014). Pooling fecal material can thus be considered a valid approach to identify RS-utilizing bacterial groups in in vitro fermentations.
Obtained density spectra of the gradients were similar to gradients from other RNA-SIP studies that separated isotope-labeled [13C]RNA from native molecules (Egert et al., 2007; Herrmann et al., 2017b). After 2 and 4 h of incubation with [U13C]starch, a second peak of higher density fractions containing RNA was detected, presumably containing RNA labeled upon assimilation of the [13C]starch (or its degradation products) by metabolically active members of the bacterial community. The fact that only a small fraction of the total RNA of these samples was found in higher density fractions may be explained by a majority of bacteria in the system that did not utilize the labeled substrate. In addition, the fecal inoculum itself represents a rich source of unlabeled substrates that further limit uptake, utilization and incorporation of labeled RS (Egert et al., 2006). Also, oxygen levels during the experiment may have had an impact on RS fermentation. Medium was deoxygenated prior to experiments and oxygen levels in the headspace should have been reduced to below 1% within 30 min, i.e. oxygen levels typically found in the lower intestinal tract of mice (He et al., 1999). Furthermore, residual oxygen may have been removed by facultative anaerobes such as Escherichia coli (Marteyn et al., 2011). However, the exact oxic conditions in the system are not known and it cannot be ruled out that the low level of labeled RNA is due to incomplete anaerobiosis and subsequent metabolic inactivity of strictly anaerobic bacteria.
Amplicon libraries constructed from labeled and unlabeled 16S rRNA revealed a bacterial community composition similar to that found in murine fecal material in previous studies (Lu et al., 2016; Rausch et al., 2016; Herrmann et al., 2017b). The lower diversity detected in the “heavy,” 13C-labeled fractions compared with the “light” fractions suggests that a distinct subset of the fecal microbiota was actively involved in starch assimilation and/or very rapidly obtained the label by cross-feeding on fermentation products of (primary) RS-utilizers.
Our results indicate that Prevotella, Bacteroides as well as members of the Ruminococcaceae were the most prolific starch assimilators in our system. These bacterial groups have been associated previously with degradation and utilization of RS in the gastrointestinal tract of ruminants and humans (Flint et al., 2008; Ze et al., 2012; Salonen et al., 2014). Moreover, our results are in good agreement with a previous RNA-SIP study using 13C-labeled potato starch as a substrate for a mixed fecal human microbiota, suggesting that the major assimilators were Ruminococcus bromii, Prevotella spp., and Eubacterium rectale (Kovatcheva-Datchary et al., 2009). The authors also observed increased levels of Bifidobacterium spp. in their human microbiota after addition of labeled starch. We only detected very low levels of Bifidobacterium spp., and they were not enriched in “heavy” RNA fraction. This might be explained by the lower abundance of bifidobacteria in the murine gastrointestinal tract compared to humans (Turroni et al., 2013; Duranti et al., 2014). Furthermore, two recent studies reported increased levels of multiple Ruminococcaceae phylotypes as well as E. rectale in obese men consuming RS (Walker et al., 2011; Salonen et al., 2014) and piglets fed RS responded with an enrichment of Prevotella-, Ruminococcus-, and Lachnospiraceae-affiliated phylotypes (Umu et al., 2015). These results support the idea that indeed members of the Prevotellaceae and Ruminococcaceae were the primary RS utilizers in our in vitro system. This is further corroborated by (meta)genomic analysis showing that many saccharolytic Bacteroidetes including human gut Bacteroides as well as ruminant Prevotella spp., are equipped with a starch “sequestration” and enzymatic degradation systems encoded by sus (starch utilization system) gene clusters (Xu et al., 2003, 2007; Martens et al., 2009). In a recent study, an amylolytic system was identified in the genome of R. bromii that appears to be organized in a starch degrading enzyme complex referred to as “amylosome” (Ze et al., 2015).
After 4 h of incubation, Allobaculum spp. and other bacterial groups increased in relative abundance in the “heavy” gradient fractions. Allobaculum was shown to consume mono- and disaccharides, but not starch for growth (Greetham et al., 2004). Thus, we hypothesize that in our system RS was hydrolyzed into mono- and disaccharides within the first 2 h by the enzymatic machinery of primary degraders, i.e., mostly Bacteroidetes. After 4 h of incubation, other secondary RS degrading bacteria, e.g., Allobaculum spp., were able to benefit from the increased availability of the RS-derived sugars and metabolites. This hypothesis is further supported by a very recent RNA-SIP experiment by our group using in vitro incubation of murine fecal slurries with [U13C]glucose, in which Allobaculum spp. were identified as the most efficient glucose assimilators (Herrmann et al., 2017b).
No marked changes in the concentration or proportions of the measured fermentation products were observed during the course of the experiments. The complete lack of lactate following addition of RS is in agreement with previous RNA-SIP studies showing no production of lactate upon [U13C]starch fermentation (Kovatcheva-Datchary et al., 2009). Propionate and butyrate seem to have increased slightly upon addition of RS. This would be in line with the observed changes in the microbial populations, i.e., an increase in Bacteroidetes (in our data set represented by unclassified Porphyromonadaceae) and the high abundance of members of the Lachnospiraceae family (Clostridium cluster XIVa) in all samples of this study. These organisms have previously been linked to formation of propionate and butyrate (Macfarlane and Macfarlane, 2003; Cotta and Foster, 2006; den Besten et al., 2013; Yang et al., 2013; Salonen et al., 2014). However, the overall low levels of 13C-labeled SCFA, the limited number of biological replicates, and a considerable technical variability in our measurements do not allow to draw strong mechanistic conclusions and further experiments are required. Nevertheless, we were able to consistently detect 13C-labeled SCFA at levels above those expected to occur due to naturally present 13C. This suggests that some of the [U13C] has been assimilated and fermented by the bacterial community. In a previous study by our group it was also shown that [U13C]glucose was fermented within 2 h with most of the label being recovered from lactate, acetate, propionate and butyrate (Herrmann et al., 2017b). The isotopic data obtained here showed that the 13C-content of the investigated metabolites was rather low, but continually increased during the course of incubation. The profound difference in label incorporation rates of RS relative to glucose indicates a slower assimilation of the [U13C]starch. A slower fermentation of potato starch compared with corn starch was also observed in a rat cecal microbiota (Morita et al., 2013) and in vitro with a pig cecal microbiota (Martin et al., 1998). Altogether, these results indicate that degradation and utilization of (labeled) RS was taking place in our in vitro system, albeit at very slow rates. So far, it is unclear why fermentation rates of potato starch are rather low. However, it has been suggested that the big granule size of the potato starch in relation to other types of starch, results in a more limited surface area for enzymes to attach (Tester et al., 2006; Rocha et al., 2010). To substantiate the hypothesis of a slow fermentation, further experiments with longer incubation times and measurements to quantify (remaining) [U13C]starch in the samples at different time points are needed. Additionally, incorporation of the label into metabolites not covered in this analysis, such as gases (carbon dioxide, methane), other organic acids (succinate and formate), alcohols (ethanol and methanol) as well as into biomass needs to be investigated.
In conclusion, we demonstrated the suitability of RNA-SIP to unravel the phylogenetic identity of bacteria involved in carbohydrate fermentation within a complex intestinal community of murine origin. We have shown that the Bacteroidetes, in particular members of the Prevotellaceae and Ruminococcaceae, were highly active after starch addition, thereby largely corroborating previous studies. In future studies, the presented in vitro approach will be transferred to an in vivo feeding trial to investigate degradation of RS in situ in an intact ecosystem inside the host.
Author Contributions
EH, CR, and ME conceived and designed the study. EH performed the experiments. EH, WY, and DR contributed to the analysis of the data. All authors wrote the manuscript and approved the final version of the article.
Funding
This study was partially funded by the “Innovative/Cooperative Projects” program of the German federal state of Baden-Württemberg (Project Präbio-SIP). The funders had no role in design of the study or analysis and interpretation of the data.
Conflict of Interest Statement
The authors declare that the research was conducted in the absence of any commercial or financial relationships that could be construed as a potential conflict of interest.
Acknowledgments
We are grateful to Peter Claus (Marburg) for the HPLC–IRMS analyses. We also thank colleagues from AgResearch Ltd and Plant & Food Research Ltd for additionally reviewing the manuscript.
Supplementary Material
The Supplementary Material for this article can be found online at: http://journal.frontiersin.org/article/10.3389/fmicb.2017.01331/full#supplementary-material
References
Aguirre, M., Ramiro-Garcia, J., Koenen, M. E., and Venema, K. (2014). To pool or not to pool? Impact of the use of individual and pooled fecal samples for in vitro fermentation studies. J. Microbiol. Methods 107, 1–7. doi: 10.1016/j.mimet.2014.08.022
Asp, N. G. (1992). Resistant starch. proceedings for the 2nd plenary meeting of EURESTA: European FLAIR concerted action no. 11 on physiological implications of the consumption of resistant starch in man. Crete, 29 May-2 June 1991. Eur. J. Clin. Nutr. 46 (suppl. 2), S1–S148.
Bassaganya-Riera, J., DiGuardo, M., Viladomiu, M., de Horna, A., Sanchez, S., Einerhand, A. W., et al. (2011). Soluble fibers and resistant starch ameliorate disease activity in interleukin-10-deficient mice with inflammatory bowel disease. J. Nutr. 141, 1318–1325. doi: 10.3945/jn.111.139022
Belenguer, A., Duncan, S. H., Calder, A. G., Holtrop, G., Louis, P., Lobley, G. E., et al. (2006). Two routes of metabolic cross-feeding between Bifidobacterium adolescentis and butyrate-producing anaerobes from the human gut. Appl. Environ. Microbiol. 72, 3593–3599. doi: 10.1128/AEM.72.5.3593-3599.2006
Bird, A. R., Brown, I. L., and Topping, D. L. (2000). Starches, resistant starches, the gut microflora and human health. Curr. Issues Intest. Microbiol. 1, 25–37.
Birt, D. F., Boylston, T., Hendrich, S., Jane, J. L., Hollis, J., Li, L., et al. (2013). Resistant starch: promise for improving human health. Adv. Nutr. 4, 587–601. doi: 10.3945/an.113.004325
Boschker, H. T. S., Nold, S. C., Wellsbury, P., Bos, D., de Graaf, W., Pel, R., et al. (1998). Direct linking of microbial populations to specific biogeochemical processes by 13C-labelling of biomarkers. Nature 392, 801–805.
Caporaso, J. G., Kuczynski, J., Stombaugh, J., Bittinger, K., Bushman, F. D., Costello, E. K., et al. (2010). QIIME allows analysis of high-throughput community sequencing data. Nat. Methods 7, 335–336. doi: 10.1038/nmeth.f.303
Clemente, J. C., Ursell, L. K., Parfrey, L. W., and Knight, R. (2012). The impact of the gut microbiota on human health: an integrative view. Cell 148, 1258–1270. doi: 10.1016/j.cell.2012.01.035
Conrad, R., Chan, O.-C., Claus, P., and Casper, P. (2007). Characterization of methanogenic Archaea and stable isotope fractionation during methane production in the profundal sediment of an oligotrophic lake (Lake Stechlin, Germany). Limnol. Oceanogr. 52, 1393–1406. doi: 10.4319/lo.2007.52.4.1393
Cotta, M., and Foster, R. (2006). “The family lachnospiraceae, including the genera butyrivibrio, lachnospira and roseburia,” in The Prokaryotes, eds M. Dworkin, S. Falkow, E. Rosenberg, K.-H. Schleifer, and E. Stackebrandt (New York, NY: Springer), 1002–1021.
den Besten, G., van Eunen, K., Groen, A. K., Venema, K., Reijngoud, D. J., and Bakker, B. M. (2013). The role of short-chain fatty acids in the interplay between diet, gut microbiota, and host energy metabolism. J. Lipid Res. 54, 2325–2340. doi: 10.1194/jlr.R036012
Dumont, M. G., and Murrell, J. C. (2005). Stable isotope probing - linking microbial identity to function. Nat. Rev. Microbiol. 3, 499–504. doi: 10.1038/nrmicro1162
Duranti, S., Turroni, F., Lugli, G. A., Milani, C., Viappiani, A., Mangifesta, M., et al. (2014). Genomic characterization and transcriptional studies of the starch-utilizing strain Bifidobacterium adolescentis 22L. Appl. Environ. Microbiol. 80, 6080–6090. doi: 10.1128/AEM.01993-14
Eckburg, P. B., Bik, E. M., Bernstein, C. N., Purdom, E., Dethlefsen, L., Sargent, M., et al. (2005). Diversity of the human intestinal microbial flora. Science 308, 1635–1638. doi: 10.1126/science.1110591
Egert, M., de Graaf, A. A., Maathuis, A., de Waard, P., Plugge, C. M., Smidt, H., et al. (2007). Identification of glucose-fermenting bacteria present in an in vitro model of the human intestine by RNA-stable isotope probing. FEMS Microbiol. Ecol. 60, 126–135. doi: 10.1111/j.1574-6941.2007.00281.x
Egert, M., de Graaf, A. A., Smidt, H., de Vos, W. M., and Venema, K. (2006). Beyond diversity: functional microbiomics of the human colon. Trends Microbiol. 14, 86–91. doi: 10.1016/j.tim.2005.12.007
Englyst, H. N., Kingman, S. M., Hudson, G. J., and Cummings, J. H. (1996). Measurement of resistant starch in vitro and in vivo. Br. J. Nutr. 75, 749–755.
Flint, H. J., Bayer, E. A., Rincon, M. T., Lamed, R., and White, B. A. (2008). Polysaccharide utilization by gut bacteria: potential for new insights from genomic analysis. Nat. Rev. Microbiol. 6, 121–131. doi: 10.1038/nrmicro1817
Furet, J. P., Firmesse, O., Gourmelon, M., Bridonneau, C., Tap, J., Mondot, S., et al. (2009). Comparative assessment of human and farm animal faecal microbiota using real-time quantitative PCR. FEMS Microbiol. Ecol. 68, 351–362. doi: 10.1111/j.1574-6941.2009.00671.x
Greetham, H. L., Gibson, G. R., Giffard, C., Hippe, H., Merkhoffer, B., Steiner, U., et al. (2004). Allobaculum stercoricanis gen. nov., sp. nov., isolated from canine feces. Anaerobe 10, 301–307. doi: 10.1016/j.anaerobe.2004.06.004
Guarner, F., and Malagelada, J. R. (2003). Gut flora in health and disease. Lancet 361, 512–519. doi: 10.1016/S0140-6736(03)12489-0
Hatamoto, M., Imachi, H., Ohashi, A., and Harada, H. (2007). Identification and cultivation of anaerobic, syntrophic long-chain fatty acid-degrading microbes from mesophilic and thermophilic methanogenic sludges. Appl. Environ. Microbiol. 73, 1332–1340. doi: 10.1128/AEM.02053-06
He, G., Shankar, R. A., Chzhan, M., Samouilov, A., Kuppusamy, P., and Zweier, J. L. (1999). Noninvasive measurement of anatomic structure and intraluminal oxygenation in the gastrointestinal tract of living mice with spatial and spectral EPR imaging. Proc. Natl. Acad. Sci. U.S.A. 96, 4586–4591.
Herrmann, E., Koch, P., Riedel, C. U., Young, W., and Egert, M. (2017a). Effect of rotor type on the separation of isotope-labeled and unlabeled Escherichia coli RNA by isopycnic density ultracentrifugation. Can. J. Microbiol. 63, 83–87. doi: 10.1139/cjm-2016-0483
Herrmann, E., Young, W., Rosendale, D., Reichert-Grimm, V., Riedel, C. U., Conrad, R., et al. (2017b). RNA-based stable isotope probing suggests Allobaculum spp. as particularly active glucose assimilators in a complex murine microbiota cultured in vitro. Biomed Res. Int. 2017:1829685. doi: 10.1155/2017/1829685
Hervé, M. (2015). RVAideMemoire: Diverse Basic Statistical and Graphical Functions. R package version 0.9-45-2.
Higgins, J. A., and Brown, I. L. (2013). Resistant starch: a promising dietary agent for the prevention/treatment of inflammatory bowel disease and bowel cancer. Curr. Opin. Gastroenterol. 29, 190–194. doi: 10.1097/MOG.0b013e32835b9aa3
Holmes, E., Kinross, J., Gibson, G. R., Burcelin, R., Jia, W., Pettersson, S., et al. (2012). Therapeutic modulation of microbiota-host metabolic interactions. Sci. Transl. Med. 4, 137rv6. doi: 10.1126/scitranslmed.3004244
Human Microbiome Project, C. (2012). Structure, function and diversity of the healthy human microbiome. Nature 486, 207–214. doi: 10.1038/nature11234
Hylla, S., Gostner, A., Dusel, G., Anger, H., Bartram, H. P., Christl, S. U., et al. (1998). Effects of resistant starch on the colon in healthy volunteers: possible implications for cancer prevention. Am. J. Clin. Nutr. 67, 136–142.
Jacobasch, G., Schmiedl, D., Kruschewski, M., and Schmehl, K. (1999). Dietary resistant starch and chronic inflammatory bowel diseases. Int. J. Colorectal Dis. 14, 201–211.
Kleessen, B., Stoof, G., Proll, J., Schmiedl, D., Noack, J., and Blaut, M. (1997). Feeding resistant starch affects fecal and cecal microflora and short-chain fatty acids in rats. J. Anim. Sci. 75, 2453–2462.
Klindworth, A., Pruesse, E., Schweer, T., Peplies, J., Quast, C., Horn, M., et al. (2013). Evaluation of general 16S ribosomal RNA gene PCR primers for classical and next-generation sequencing-based diversity studies. Nucleic Acids Res. 41:e1. doi: 10.1093/nar/gks808
Koh, A., De Vadder, F., Kovatcheva-Datchary, P., and Bäckhed, F. (2016). From dietary fiber to host physiology: short-chain fatty acids as key bacterial metabolites. Cell 165, 1332–1345. doi: 10.1016/j.cell.2016.05.041
Kovatcheva-Datchary, P., Egert, M., Maathuis, A., Rajilic-Stojanovic, M., de Graaf, A. A., Smidt, H., et al. (2009). Linking phylogenetic identities of bacteria to starch fermentation in an in vitro model of the large intestine by RNA-based stable isotope probing. Environ. Microbiol. 11, 914–926. doi: 10.1111/j.1462-2920.2008.01815.x
Le Blay, G. M., Michel, C. D., Blottiere, H. M., and Cherbut, C. J. (2003). Raw potato starch and short-chain fructo-oligosaccharides affect the composition and metabolic activity of rat intestinal microbiota differently depending on the caecocolonic segment involved. J. Appl. Microbiol. 94, 312–320. doi: 10.1046/j.1365-2672.2003.01836.x
Liu, F., and Conrad, R. (2011). Chemolithotrophic acetogenic H2/CO2 utilization in Italian rice field soil. ISME J. 5, 1526–1539. doi: 10.1038/ismej.2011.17
Lu, Y., Fan, C., Li, P., Lu, Y., Chang, X., and Qi, K. (2016). Short chain fatty acids prevent high-fat-diet-induced obesity in mice by regulating G protein-coupled receptors and gut microbiota. Sci. Rep. 6:37589. doi: 10.1038/srep37589
Lueders, T., Manefield, M., and Friedrich, M. W. (2004). Enhanced sensitivity of DNA- and rRNA-based stable isotope probing by fractionation and quantitative analysis of isopycnic centrifugation gradients. Environ. Microbiol. 6, 73–78. doi: 10.1046/j.1462-2920.2003.00536.x
Macfarlane, S., and Macfarlane, G. T. (2003). Regulation of short-chain fatty acid production. Proc. Nutr. Soc. 62, 67–72. doi: 10.1079/PNS2002207
Manefield, M., Whiteley, A. S., Griffiths, R. I., and Bailey, M. J. (2002a). RNA stable isotope probing, a novel means of linking microbial community function to phylogeny. Appl. Environ. Microbiol. 68, 5367–5373. doi: 10.1128/AEM.68.11.5367-5373.2002
Manefield, M., Whiteley, A. S., Ostle, N., Ineson, P., and Bailey, M. J. (2002b). Technical considerations for RNA-based stable isotope probing: an approach to associating microbial diversity with microbial community function. Rapid Commun. Mass Spectrom. 16, 2179–2183. doi: 10.1002/rcm.782
Martens, E. C., Koropatkin, N. M., Smith, T. J., and Gordon, J. I. (2009). Complex glycan catabolism by the human gut microbiota: the Bacteroidetes Sus-like paradigm. J. Biol. Chem. 284, 24673–24677. doi: 10.1074/jbc.R109.022848
Marteyn, B., Scorza, F. B., Sansonetti, P. J., and Tang, C. (2011). Breathing life into pathogens: the influence of oxygen on bacterial virulence and host responses in the gastrointestinal tract. Cell. Microbiol. 13, 171–176. doi: 10.1111/j.1462-5822.2010.01549.x
Martin, L., Dumon, H., and Champ, M. (1998). Production of short-chain fatty acids from resistant starch in a pig model. J. Sci. Food Agric. 77, 71–80.
Morita, T., Hino, S., Ito, A., Han, K. H., Shimada, K., and Fukushima, M. (2013). Slower fermentation rate of potato starch relative to high-amylose cornstarch contributes to the higher proportion of cecal butyrate in rats. Biosci. Microbiota Food Health 32, 149–156. doi: 10.12938/bmfh.32.149
Morrison, D. J., and Preston, T. (2016). Formation of short chain fatty acids by the gut microbiota and their impact on human metabolism. Gut Microbes 7, 189–200. doi: 10.1080/19490976.2015.1134082
Neufeld, J. D., Dumont, M. G., Vohra, J., and Murrell, J. C. (2007). Methodological considerations for the use of stable isotope probing in microbial ecology. Microb. Ecol. 53, 435–442. doi: 10.1007/s00248-006-9125-x
Nugent, A. P. (2005). Health properties of resistant starch. Br. Nutr. Foundat. Nutr. Bull. 30, 27–54. doi: 10.1111/j.1467-3010.2005.00481.x
Qin, J., Li, R., Raes, J., Arumugam, M., Burgdorf, K. S., Manichanh, C., et al. (2010). A human gut microbial gene catalogue established by metagenomic sequencing. Nature 464, 59–65. doi: 10.1038/nature08821
Radajewski, S., Ineson, P., Parekh, N. R., and Murrell, J. C. (2000). Stable-isotope probing as a tool in microbial ecology. Nature 403, 646–649. doi: 10.1038/35001054
Rausch, P., Basic, M., Batra, A., Bischoff, S. C., Blaut, M., Clavel, T., et al. (2016). Analysis of factors contributing to variation in the C57BL/6J fecal microbiota across German animal facilities. Int. J. Med. Microbiol. 306, 343–355. doi: 10.1016/j.ijmm.2016.03.004
R Core Team (2015). R: A Language and Environment for Statistical Computing. Vienna: R Foundation for Statistical Computing.
Riedel, C. U., Schwiertz, A., and Egert, M. (2014). “The stomach and small and large intestinal microbiomes,” in The Human Microbiota and Microbiome. Advances in Molecular and Cellu- lar Microbiology, Vol. 25, ed J. K. Marchesi (Wallingford: CABI), 1–19.
Rios-Covian, D., Gueimonde, M., Duncan, S. H., Flint, H. J., and de los Reyes-Gavilan, C. G. (2015). Enhanced butyrate formation by cross-feeding between Faecalibacterium prausnitzii and Bifidobacterium adolescentis. FEMS Microbiol. Lett. 362:fnv176. doi: 10.1093/femsle/fnv176
Rocha, T. D. S., Carneiro, A. P. D. A., and Franco, C. M. L. (2010). Effect of enzymatic hydrolysis on some physicochemical properties of root and tuber granular starches. Food Sci. Technol. 30, 544–551. doi: 10.1590/S0101-20612010000200039
Salonen, A., Lahti, L., Salojarvi, J., Holtrop, G., Korpela, K., Duncan, S. H., et al. (2014). Impact of diet and individual variation on intestinal microbiota composition and fermentation products in obese men. ISME J. 8, 2218–2230. doi: 10.1038/ismej.2014.63
Salyers, A. A., Vercellotti, J. R., West, S. E., and Wilkins, T. D. (1977a). Fermentation of mucin and plant polysaccharides by strains of Bacteroides from the human colon. Appl. Environ. Microbiol. 33, 319–322.
Salyers, A. A., West, S. E., Vercellotti, J. R., and Wilkins, T. D. (1977b). Fermentation of mucins and plant polysaccharides by anaerobic bacteria from the human colon. Appl. Environ. Microbiol. 34, 529–533.
Sekirov, I., Russell, S. L., Antunes, L. C., and Finlay, B. B. (2010). Gut microbiota in health and disease. Physiol. Rev. 90, 859–904. doi: 10.1152/physrev.00045.2009
Shao, Y., Arias-Cordero, E., Guo, H., Bartram, S., and Boland, W. (2014). In vivo Pyro-SIP assessing active gut microbiota of the cotton leafworm, Spodoptera littoralis. PLoS ONE 9:e85948. doi: 10.1371/journal.pone.0085948
Silvi, S., Rumney, C. J., Cresci, A., and Rowland, I. R. (1999). Resistant starch modifies gut microflora and microbial metabolism in human flora-associated rats inoculated with faeces from Italian and UK donors. J. Appl. Microbiol. 86, 521–530.
Slavin, J. (2013). Fiber and prebiotics: mechanisms and health benefits. Nutrients 5, 1417–1435. doi: 10.3390/nu5041417
Smith, H. O., and Levine, M. (1964). Two sequential repressions of DNA synthesis in the establishment of lysogeny by phage P22 and its mutants. Proc. Natl. Acad. Sci. U.S.A. 52, 356–363.
Tachon, S., Zhou, J., Keenan, M., Martin, R., and Marco, M. L. (2013). The intestinal microbiota in aged mice is modulated by dietary resistant starch and correlated with improvements in host responses. FEMS Microbiol. Ecol. 83, 299–309. doi: 10.1111/j.1574-6941.2012.01475.x
Tannock, G. W., Lawley, B., Munro, K., Sims, I. M., Lee, J., Butts, C. A., et al. (2014). RNA-stable-isotope probing shows utilization of carbon from inulin by specific bacterial populations in the rat large bowel. Appl. Environ. Microbiol. 80, 2240–2247. doi: 10.1128/AEM.03799-13
Tester, R. F., Qi, X., and Karkalas, J. (2006). Hydrolysis of native starches with amylases. Anim. Feed Sci. Technol. 130, 39–54. doi: 10.1016/j.anifeedsci.2006.01.016
Topping, D. L., and Clifton, P. M. (2001). Short-chain fatty acids and human colonic function: roles of resistant starch and nonstarch polysaccharides. Physiol. Rev. 81, 1031–1064.
Turnbaugh, P. J., Hamady, M., Yatsunenko, T., Cantarel, B. L., Duncan, A., Ley, R. E., et al. (2009). A core gut microbiome in obese and lean twins. Nature 457, 480–484. doi: 10.1038/nature07540
Turnbaugh, P. J., Quince, C., Faith, J. J., McHardy, A. C., Yatsunenko, T., Niazi, F., et al. (2010). Organismal, genetic, and transcriptional variation in the deeply sequenced gut microbiomes of identical twins. Proc. Natl. Acad. Sci. U.S.A. 107, 7503–7508. doi: 10.1073/pnas.1002355107
Turroni, F., Serafini, F., Foroni, E., Duranti, S., O'Connell Motherway, M., Taverniti, V., et al. (2013). Role of sortase-dependent pili of Bifidobacterium bifidum PRL2010 in modulating bacterium-host interactions. Proc. Natl. Acad. Sci. U.S.A. 110, 11151–11156. doi: 10.1073/pnas.1303897110
Umu, O. C., Frank, J. A., Fangel, J. U., Oostindjer, M., da Silva, C. S., Bolhuis, E. J., et al. (2015). Resistant starch diet induces change in the swine microbiome and a predominance of beneficial bacterial populations. Microbiome 3:16. doi: 10.1186/s40168-015-0078-5
Walker, A. W., Ince, J., Duncan, S. H., Webster, L. M., Holtrop, G., Ze, X., et al. (2011). Dominant and diet-responsive groups of bacteria within the human colonic microbiota. ISME J. 5, 220–230. doi: 10.1038/ismej.2010.118
Wüst, P. K., Horn, M. A., and Drake, H. L. (2011). Clostridiaceae and Enterobacteriaceae as active fermenters in earthworm gut content. ISME J. 5, 92–106. doi: 10.1038/ismej.2010.99
Xu, J., Bjursell, M. K., Himrod, J., Deng, S., Carmichael, L. K., Chiang, H. C., et al. (2003). A genomic view of the human-Bacteroides thetaiotaomicron symbiosis. Science 299, 2074–2076. doi: 10.1126/science.1080029
Xu, J., Mahowald, M. A., Ley, R. E., Lozupone, C. A., Hamady, M., Martens, E. C., et al. (2007). Evolution of symbiotic bacteria in the distal human intestine. PLoS Biol. 5:e156. doi: 10.1371/journal.pbio.0050156
Yang, J., Martinez, I., Walter, J., Keshavarzian, A., and Rose, D. J. (2013). In vitro characterization of the impact of selected dietary fibers on fecal microbiota composition and short chain fatty acid production. Anaerobe 23, 74–81. doi: 10.1016/j.anaerobe.2013.06.012
Young, W., Egert, M., Bassett, S. A., and Bibiloni, R. (2015). Detection of sialic acid-utilising bacteria in a caecal community batch culture using RNA-based stable isotope probing. Nutrients 7, 2109–2124. doi: 10.3390/nu7042109
Young, W., Roy, N. C., Lee, J., Lawley, B., Otter, D., Henderson, G., et al. (2012). Changes in bowel microbiota induced by feeding weanlings resistant starch stimulate transcriptomic and physiological responses. Appl. Environ. Microbiol. 78, 6656–6664. doi: 10.1128/AEM.01536-12
Ze, X., Ben David, Y., Laverde-Gomez, J. A., Dassa, B., Sheridan, P. O., Duncan, S. H., et al. (2015). Unique organization of extracellular amylases into amylosomes in the resistant starch-utilizing human colonic Firmicutes bacterium Ruminococcus bromii. MBio 6, e01058–e01015. doi: 10.1128/mBio.01058-15
Ze, X., Duncan, S. H., Louis, P., and Flint, H. J. (2012). Ruminococcus bromii is a keystone species for the degradation of resistant starch in the human colon. ISME J. 6, 1535–1543. doi: 10.1038/ismej.2012.4
Keywords: resistant starch, gut microbiota, RNA-SIP, Bacteroidetes, Prevotellaceae, Ruminococcaceae, HPLC-IRMS
Citation: Herrmann E, Young W, Rosendale D, Conrad R, Riedel CU and Egert M (2017) Determination of Resistant Starch Assimilating Bacteria in Fecal Samples of Mice by In vitro RNA-Based Stable Isotope Probing. Front. Microbiol. 8:1331. doi: 10.3389/fmicb.2017.01331
Received: 05 April 2017; Accepted: 30 June 2017;
Published: 24 July 2017.
Edited by:
Michael Gänzle, University of Alberta, CanadaReviewed by:
Clarissa Schwab, ETH Zurich, SwitzerlandDouglas Morrison, University of Glasgow, United Kingdom
Copyright © 2017 Herrmann, Young, Rosendale, Conrad, Riedel and Egert. This is an open-access article distributed under the terms of the Creative Commons Attribution License (CC BY). The use, distribution or reproduction in other forums is permitted, provided the original author(s) or licensor are credited and that the original publication in this journal is cited, in accordance with accepted academic practice. No use, distribution or reproduction is permitted which does not comply with these terms.
*Correspondence: Christian U. Riedel, Y2hyaXN0aWFuLnJpZWRlbEB1bmktdWxtLmRl