- 1Tobacco Research Institute of Chinese Academy of Agricultural Sciences, Qingdao, China
- 2Tobacco Pest Integrated Management Key Laboratory of China Tobacco, Qingdao, China
Phytophthora nicotianae is one of the most destructive plant pathogens affecting a variety of plants, causing black shank of tobacco, among several other devastating diseases. Herein, we assembled the mitochondrial genome of P. nicotianae and analyzed its gene content and genome structure, performed comparative mitochondrial genomics analysis, and assessed phylogenetic relationships among oomycetes species. The circular mitogenome is 37,561 bp long, with 38 protein-coding genes, 25 transfer RNA (tRNA) genes, and 2 ribosomal RNA genes (rrnl and rrns). The mitochondrial genome showed a biased A/T usage versus G/C. The overall gene content and size of the P. nicotianae mitogenome are identical to those of other published Phytophthora mitogenomes. Interestingly, collinearity analysis using an existing ∼10 k inversion region (including 11 genes and 8 tRNAs) revealed that Phytophthora andina, Phytophthora infestans, Phytophthora mirabilis, Phytophthora ipomoeae, and Phytophthora phaseoli differed from Phytophthora nicotianae, Phytophthora sojae, Phytophthora ramorum, and Phytophthora polonica. Moreover, inverted repeat regions were found to be absent among species of the Peronosporales when compared with species from the Pythiales and Saprolegniales. A phylogenomic investigation based on 29 protein-coding genes demonstrated that Phytophthora is monophyletic, and placed P. nicotianae close to the clade including P. mirabilis, P. ipomoeae, P. andina, P. infestans, and P. phaseoli. Furthermore, we discovered six new candidate DNA molecular markers (rpl6, atp8, nad11, rps2, rps3, and rps4) based on these mitogenomes that would be suitable for species identification in the oomycetes, which have the same identification level as the whole mitogenome and ribosomal DNA sequences. These new molecular markers can not only provide a quick preview of the species without mitogenome information, but will also help to gain better understanding of the oomycetes pathogens and developing treatment or monitoring strategies.
Introduction
Phytophthora nicotianae is an important destructive plant pathogen, which causes root, stem, and crown rots, as well as fruit and foliar blights, in over 301 agronomic and horticultural plants (Panabières et al., 2016). For example, it can cause black shank in cultivated tobacco and significantly decrease the crop yield, leading to catastrophic economic losses (van Jaarsveld et al., 2002; Falcón-Rodríguez et al., 2011). This pathogen can cause disease by releasing oospores or chlamydospores into the soil. The morphological characteristics of the sporangia of P. nicotianae are an ovoid/spherical shape with an average size of 46.4 × 37.8 pm, and the average size of the chlamydospores is approximately 19–42 pm (Blaya et al., 2015). Further research has revealed multiple physiological races of P. nicotianae (races 0, 1, 2, and 3) worldwide (Apple, 1962). Races 0 and 1 have also been identified in the tobacco-growing areas of China. P. nicotianae has been extensively studied from several aspects to date, including its pathology and comprehensive strategies for the prevention of devastating outbreaks (Csinos, 1999; Judelson and Roberts, 1996; Bowers and Locke, 2004). For example, strategies recommended for managing black shank include applying chemicals and using resistant tobacco varieties (Speight, 1994; Qu et al., 2016). Moreover, comparative morphological and molecular characterization studies of P. nicotianae have also been conducted (Smith et al., 1986; Cooke et al., 2000). Phylogenetic analysis revealed that P. nicotianae is closely related to diatoms and brown algae, which is contrast to the results obtained through morphological and physiological identification (Cooke et al., 2000). In general, molecular phylogenetic studies to determine the relationships among Phytophthora species and related members of the oomycetes mainly based on the internal transcribed spacer (ITS) region of nuclear ribosomal DNA (rDNA) have been used to explore the relationships, especially for distinguishing morphologically similar species among Phytophthora and some other species at the genus level (Crawford et al., 1996). Blair et al. (2008) conducted a comprehensive analysis of the relationships among 82 Phytophthora species utilizing seven loci from available databases. However, most of these previous molecular studies have explored the relationships among Phytophthora species using only one or a few genetic loci (Blair et al., 2008).
Recently, the mitogenome, which represents the entire mitochondrial genome including both the coding and non-coding regions, was used for resolving evolutionary relationships between organisms whose morphological and biochemical characters are often limited or difficult to obtain because of small genome size, high copy numbers, and rapid evolutionary rates (Chen and Hebert, 1999). Consequently, the number of oomycete mitogenomes (Phytophthora, Pythium, Thraustotheca, Saprolegnia, and Achlya) that have been partially or completely sequenced has been steadily increasing in recent years (Grayburn et al., 2004; Avila-Adame et al., 2006; Martin et al., 2007; O’Brien et al., 2014; Tangphatsornruang et al., 2016). These published sequences have the potential to speed up the development of the classification, evolution, genetics, breeding, and engineering of the corresponding mycetes. With respect to Phytophthora species, eight complete mitogenomes have been sequenced thus far. The mitochondrial genome of Phytophthora infestans was used to investigate its evolution and population genetics (Gavino and Fry, 2002). In addition, comparative genomic analysis was performed among P. infestans, P. ramorum, and P. sojae mitochondrial genomes to illustrate their evolutionary relationships (Martin et al., 2007). Although the nuclear genome of P. nicotianae has been sequenced to illustrate its infection mechanisms and coevolution with host plants (Liu et al., 2016), knowledge of its complete mitogenome is still lacking. In addition, the mitogenome and mitochondrial genes can be considered effective markers for evolutionary studies because their evolutionary rates are 5–10 times higher than those of nuclear DNA (Brown et al., 1979). To expand the pool of available molecular markers from the oomycetes mitochondrial genome, it is necessary to establish the phylogeny of the genus Phytophthora using available mitogenomic data and identify new phylogenetically informative molecular markers that can be used to identify a greater number of Phytophthora species.
Accordingly, the objectives of this study were to sequence the complete mitogenome of P. nicotianae, provide a thorough description of its genome features, discuss the phylogenetic relationships and evolutionary traits among species of the oomycetes based on the sequenced mitogenomes, and determine novel molecular markers that would be suitable for identification studies. The current study will provide valuable reference information for gaining further understanding of mitogenome evolution in related species.
Materials and Methods
Culture and Collection
The highly virulent P. nicotianae strain JM1 was isolated from infected leaves of Nicotiana benthamiana in Jimo, Qingdao, Shandong Province. The mycelium was cultivated at 25°C on clarified V8 agar (von Broembsen and Deacon, 1996). The cultivated mycelium was washed using sterilized distilled water and then dried with filter paper before use.
DNA Sequencing and Assembly
Total genomic DNA from the mycelium was extracted using a Qiagen DNEasy Plant Mini Kit according to the manufacturer’s instructions (Qiagen, Valencia, CA, United States). The sequencing libraries were generated using IlluminaTruseqTM DNA Sample Preparation Kit (Illumina, San Diego, CA, United States) following the manufacturer’s instructions. First, 2 μg genomic DNA was fragmented using the S220-series ultrasonicator (Covaris, Woburn, MA, United States). Then, exonuclease/polymerase was added to convert the overhangs into blunt ends. The 3′ ends of DNA fragments were adenylated and ligated to Illumina PE adapter oligonucleotides. Fragments of approximately 650 bp were then separated with AMPure Beads (Agencourt Bioscience, Beverly, MA, United States). The products were purified using QIAquick PCR Purification Kit (Qiagen) and amplified using Illumina PCR Primer for 10 cycles. After purification, the PCR products were quantified using the Agilent Bioanalyzer 2100 system. Finally, the library was sequenced with the Illumina HiSeq 2000 sequencing system. The overall 2G raw reads were quality trimmed, and adapters were removed using the FastQC software with default parameters (version 0.11.5) (Andrews, 2017). Reads with hits to the mitochondrial genomes from previously published Phytophthora studies were extracted using a local blast search (1e5). These reads were then assembled with the CLC Genomics workbench with default parameters (version 4.7.1). Next, conserved contigs (occupying 75% of the total length of the mitogenome) were used to extend the remaining sequences using PRICE with default parameters (version 3.0) (Ruby et al., 2013). Finally, the topological ring of this mitogenome was detected by Bandage with default parameters1 (Wick et al., 2015).
Identification and Annotation of the Mitochondrial Genome
The mitogenome was annotated with DOGMA2 (Wyman et al., 2004), followed by application of NCBI ORF finder3. Transfer RNA (tRNA) genes were identified by tRNAscan-SE (version 1.23) (Schattner et al., 2005). 23S and 16S rRNA genes were annotated based on similarity of the reference Phytophthora mitochondrial rRNA sequence. The circular mitochondrial genome map was drawn using OGDRAW4 (Lohse et al., 2013). The relative synonymous codon usage of protein-coding genes (PCGs) was calculated using CodonW (Peden, 1999). The complete mitochondrial genome of P. nicotianae is available under GenBank accession number KY851301.
Analyses of Gene Evolutionary Rates and Molecular Marker Selection
To estimate the nature of evolutionary selection on the common genes shared in the Peronosporales, the genes involved in ATP-synthase complex subunits (complex IV and complex III subunits), electron transport complex I subunits, and the large and small subunits of ribosomal proteins were chosen to calculate the ratio of non-synonymous (dN) to synonymous (dS) substitutions. These genes were aligned using MEGA 6.0 according to codons (parameters: Gap opening penalty:10; Gap extension penalty:0.2; Delay divergent cutoff:30%). Then, the dN/dS ratio was calculated using DnaSP ver. 5 (Librado and Rozas, 2009). Usually, the synonymous sites (dS) are saturated in the closely related species, and thus the non-synonymous substitution sites (dN) are suitable for measuring evolutionary rates. Therefore, the dN values and their standard deviations were calculated. Then the genes in higher dN value (0.02 < dN < 0.5) and wider standard deviation (higher than the 50% of the 29 genes) are more likely to provide better resolution in lower level phylogenies and discriminate between short distance species like subspecies. To further confirm the identification of these candidate genes, we conducted phylogenetic analyses using candidate genes after conducting model tests. The rDNA results were used as reference for comparison with the mitogenome results to select the final gene markers for species identification of oomycetes.
Comparative Analysis of the Mitogenome
The mitogenome of P. nicotianae was compared to previously published mitogenomes of the oomycetes. For the comparison of gene content and orders, the genetic context of each mitogenome was extracted using a perl script5, and visualized in a vector graph. For synteny comparison, the mitogenomes of 13 species in the oomycetes were downloaded from GenBank, and together with the P. nicotianae (Supplementary Table S1) mitogenome completed in the present study were parsed through pairwise blast results among members of the oomycetes using Mauve software with default parameters (Darling et al., 2004). The invert repeat structure was detected using the blastn program against the sequence itself and visualized in Circoletto6 (Darzentas, 2010).
Phylogenetic Analyses
To infer the phylogenetic position of P. nicotianae, we chose 13 oomycete mitogenome sequences available in GenBank. We conducted separate phylogenetic analyses for individual genes and the combined mitochondrial DNA datasets. The dataset of 29 PCGs present in the 14 mitochondrial genomes (including species of Phytophthora, Pythium, Thraustotheca, Saprolegnia, and Achlya) were used for phylogenetic analysis based on both maximum likelihood (ML) and Bayesian inference (BI) methods. Individual genes of 14 species were aligned using MEGA 6.0 one by one and then formed the final alignment. The nucleotide substitution model was selected using jModelTest (V2.1.4) (Posada, 2008). ML analysis was performed using RAxML version 8.1.2 (Stamatakis, 2014) with the GTR + I + G model. Bootstrap analysis was conducted with 1000 replications in the ML method. Bayesian analyses were performed using MrBayes (Ronquist et al., 2012) and run for 1,000,000 generations, with the initial 20% of trees discarded as burn-in. Moreover, phylogenetic analyses were also conducted with rDNA sequences from same taxa using BI approaches under the optimized nucleotide evolutionary models (Supplementary Table S2). For these parameters, “p-inv” represents the proportion of invariant sites among the selected sequences. “Gammaeshape” represents a two-parameter family of continuous probability distributions and “Kappa” represents the substitution parameters among the selected sequences.
Results
Genome Size and Organization
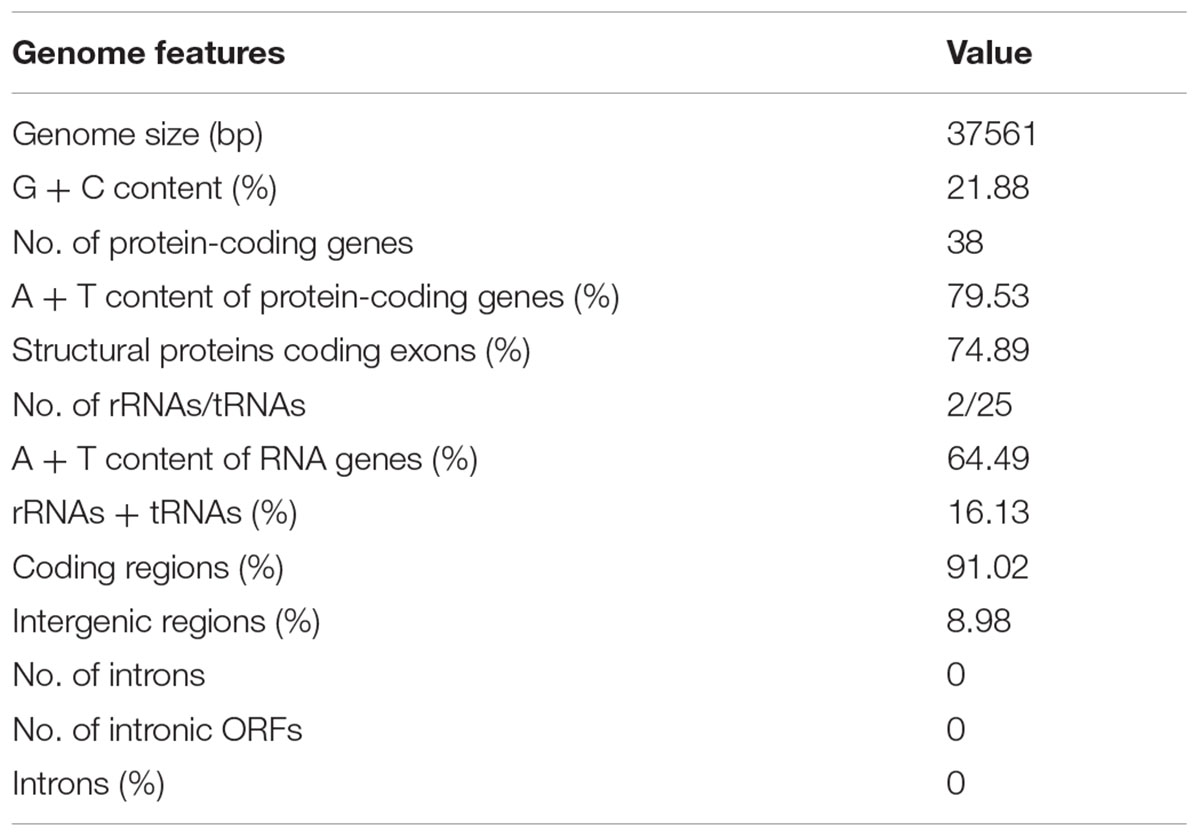
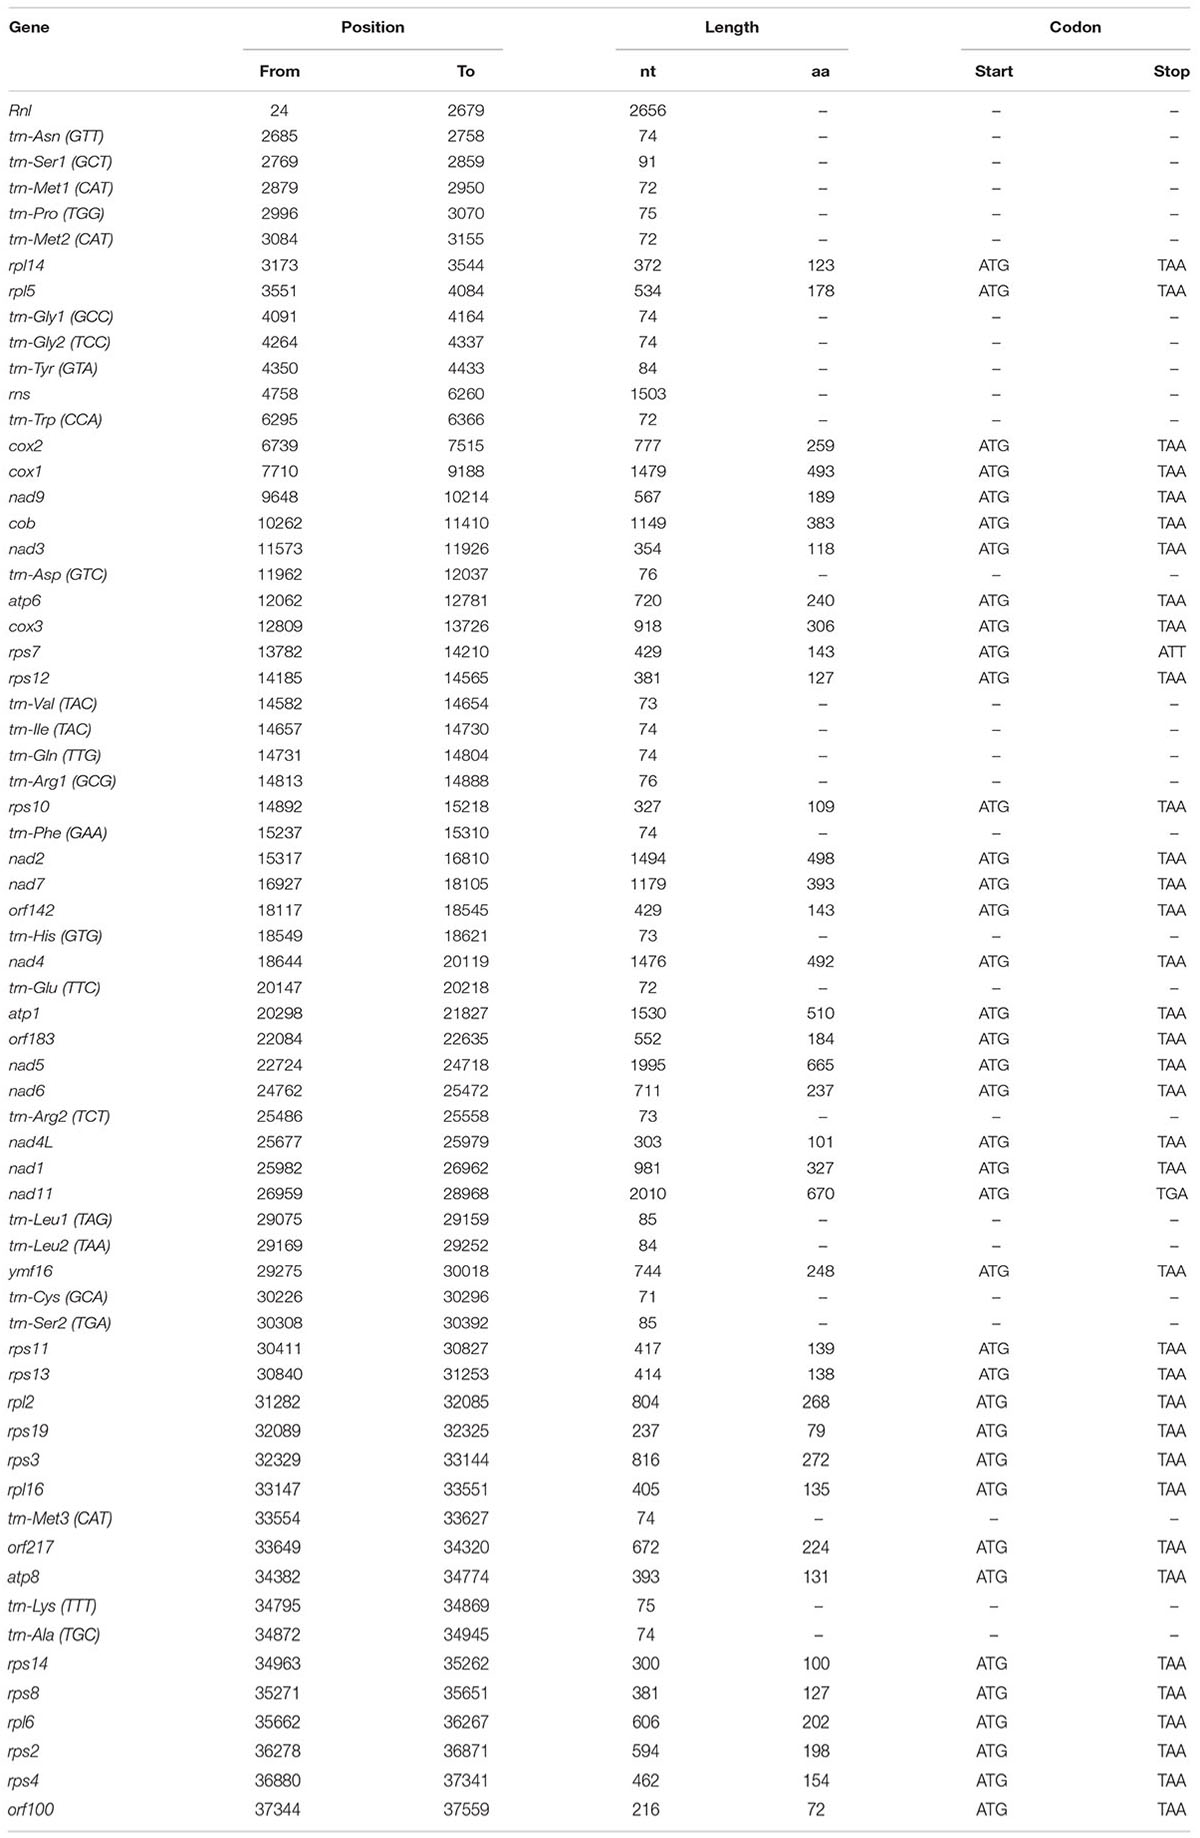
The complete sequence of the P. nicotianae mitochondrial genome was mapped as a 37,561-bp long circular molecule (with approximately 1000-fold coverage) (Figure 1). Approximately 91.02% of the genome comprises the coding region. We identified 38 PCGs, 25 tRNA genes, and 2 rRNA genes (rrnL and rrnS), which are located on both strands. All the PCGs start with the typical ATG codon and terminate with either TAA or TAG. No intron or overlap was found in these genes. The P. nicotianae mitochondrial genome contains 1,901 bp within tRNA genes, with a G + C content of 37.82%. Individual tRNAs range in length from 71 bp [trn-Cys (GCA)] to 91 bp [trn-Ser1 (GCT)] in length. The two rRNA genes in the mitochondrial genome, rrnL and rrnS, are 2,656 bp and 1,503 bp in length, with an G + C content of 33.25% and 35.46%, spectively (Tables 1,2).
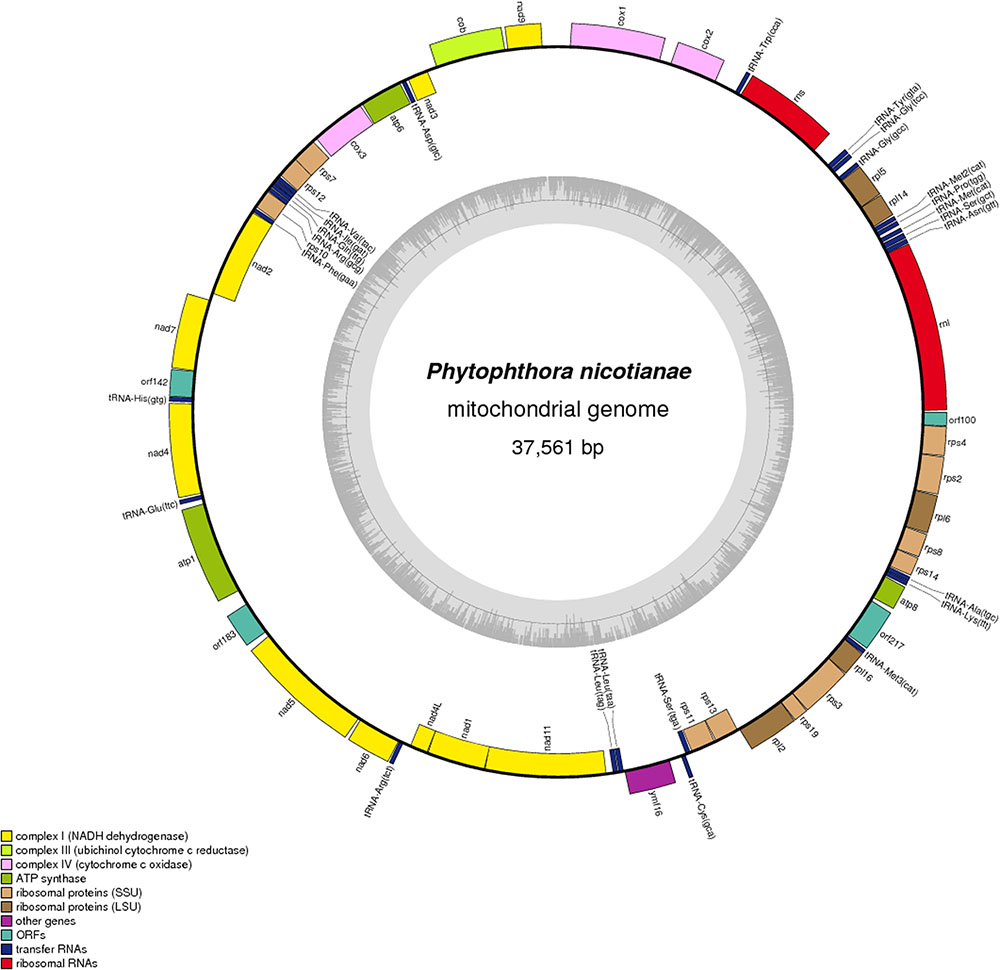
FIGURE 1. Circular map of the mitochondrial genome of Phytophthora nicotianae. Protein coding genes, tRNA and rRNA are shown on the outer ring. Genes encoded on both strands. The inner ring shows GC density.
The P. nicotianae mitochondrial genome shows very strong A/T bias in nucleotide composition relative to the G + C content (A + T content of 78.12%), which is typical of oomycete mitochondrial genomes (Table 1). Analysis of the codon usage showed that Ile, Leu, and Phe are the most frequently encoded amino acids in the P. nicotianae mitochondrial genome. Hence, ATT (Ile), TTA (Leu), and TTT (Phe) are the most frequent codons, which contribute to the high A + T content observed in this mitochondrial genome (Figure 2).
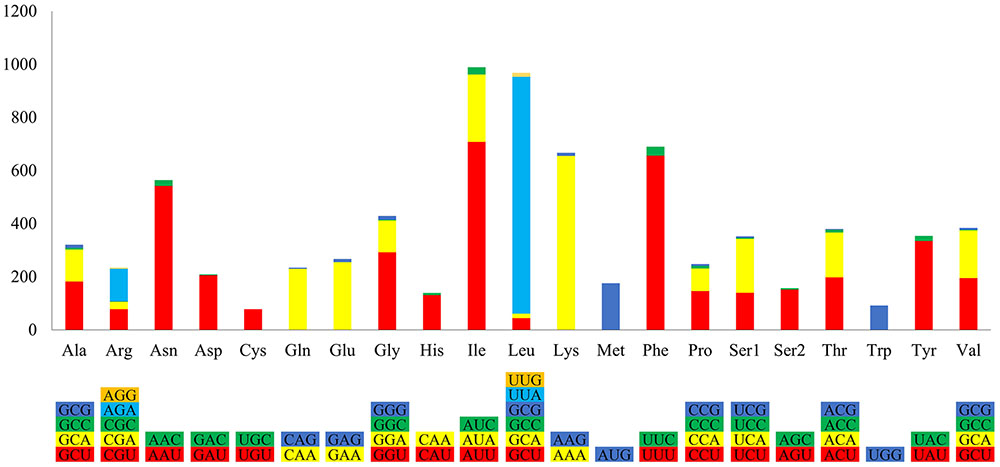
FIGURE 2. Relative synonymous codon usage of the mitochondrial genome in P. nicotianae. Colorful columns represent the codon usage of the genes in P. nicotianae. The height of columns represents the frequency of utilization of a certain codon.
Gene Content and Structure Comparison
The gene content of P. nicotianae was compared to those of 13 other species in the oomycetes (including species from the three orders Peronosporales, Pythiales, and Saprolegniales), with available mitochondrial genomes information. The genome size of the P. nicotianae mitogenome is 37,561 bp, which is similar to that of other Phytophthora species (e.g., 37,957 bp for P. infestans and 37,874 bp for P. andina). The gene content of the P. nicotianae mitogenome is identical to that of the published Phytophthora mitogenomes. They all have 35 common PCGs. Some small differences in gene contents were observed only in open reading frames (ORFs). For example, six ORFs (orf79, orf32, orf142, orf244, orf217, and orf100) were found in P. mirabilis, P. andina, P. infestans, P. ipomoeae, and P. phaseoli, whereas P. sojae, P. ramorum, P. nicotianae, and P. polonica contained 12, 9, 4, and 6 predicted ORFs, respectively. Overall, this comparative study demonstrated that the gene composition and orders are highly conserved among species in Phytophthora mitogenomes. This phenomenon was also observed in the Pythiales mitogenomes, whereas major differences in gene content were observed for the Saprolegniales sequences. The genome size in the Pythiales was greater than that for species from the Peronosporales because of duplication events that occurred in the nad6, cob, nad9, atp9, rpl5, rpl14, rnl, rps4, rps2, rpl6, rps8, rps14, atp8, rpl16, rps3, rps19, rpl2, rps13, rps11, and SecY genes. In addition, the gene content in the Peronosporales was compared with that of the Saprolegniales, which showed that the genes rnl, rns, nad5, rps7, and rps12 were doubled in Saprolegniales species (Figure 3).
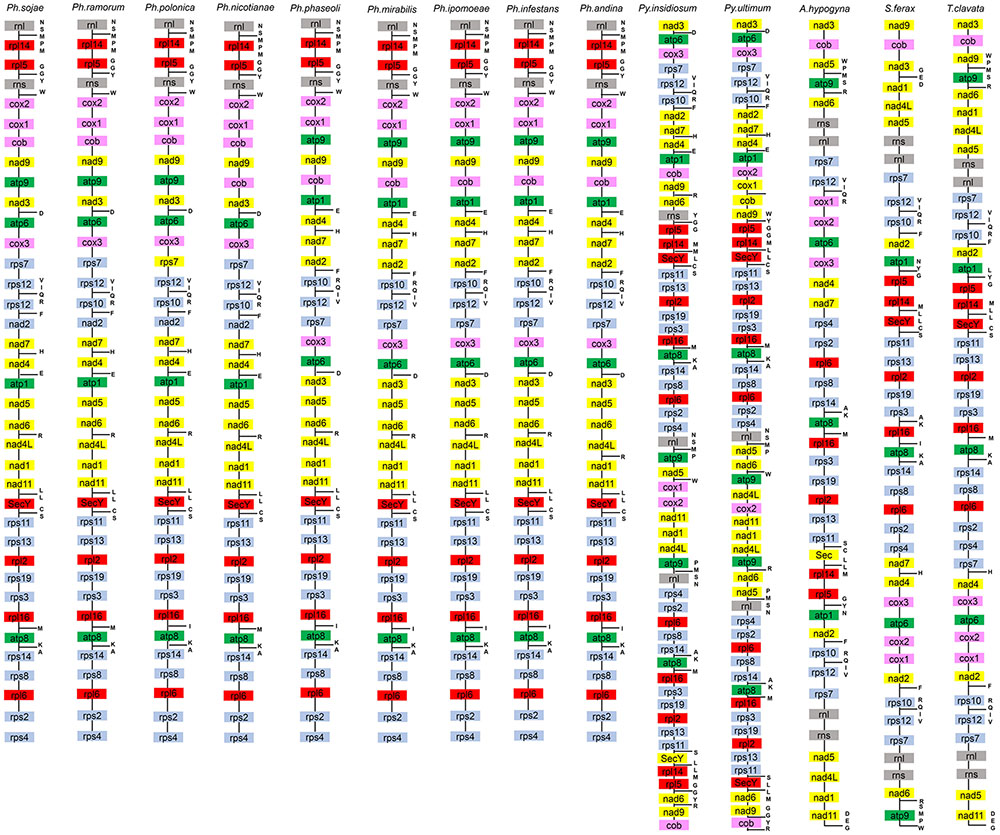
FIGURE 3. Mitochondrial gene orders of 14 species from the Oomycetes. Gene orders and contents of 14 species are listed from top to bottom. Genes in different colors represent different functions. tRNA which can comprise amino acids are listed on the right of gene contents.
Comparison of the genome structures of the 14 mitogenomes from the Oomycetes showed that, despite their evolutionary distance, the genomes shared 12 modules (syntenic regions) in the Peronosporales. Interestingly, collinearity analysis using a ∼10 k inversion region (including 11 genes: nad3, atp6, cox3, rps7, rps12, rps10, nad2, nad7, orf142, nad4, and atp1; and 8 tRNAs: tRNA-Asp, tRNA-Val, tRNA-Ile, tRNA-Gln, tRNA-Arg, tRNA-Phe, tRNA-His, tRNA-Glu) revealed that P. andina, P. infestans, P. mirabilis, P. ipomoeae, and P. phaseoli differed from P. nicotianae, P. sojae, P. ramorum, and P. polonica. Moreover, our study showed that, unlike species from the Pythiales and Saprolegniales, inverted repeat (IR) regions were absent among species in the Peronosporales. The species in the Pythiales and the Saprolegniales have large IR regions, which contributed to expanding their genome sizes. The Pythiales species shared six modules, whereas the Saprolegniales species had 14 gene modules (Figure 4). Synteny comparison revealed that the IR regions were absent from species in the Peronosporales. However, according to blastn against the sequence itself, a shorter repeat region of about 2,300 bp was found in P. ramorum. The IR regions in Pythium insidiosum and Pythium ultimum were 36,530 and 43,898 bp, occupying 66.43 and 73.54% of the whole sequences, respectively. The repeat regions in the Saprolegniales ranged from 15,542 to 18,848 bp (Figure 5).
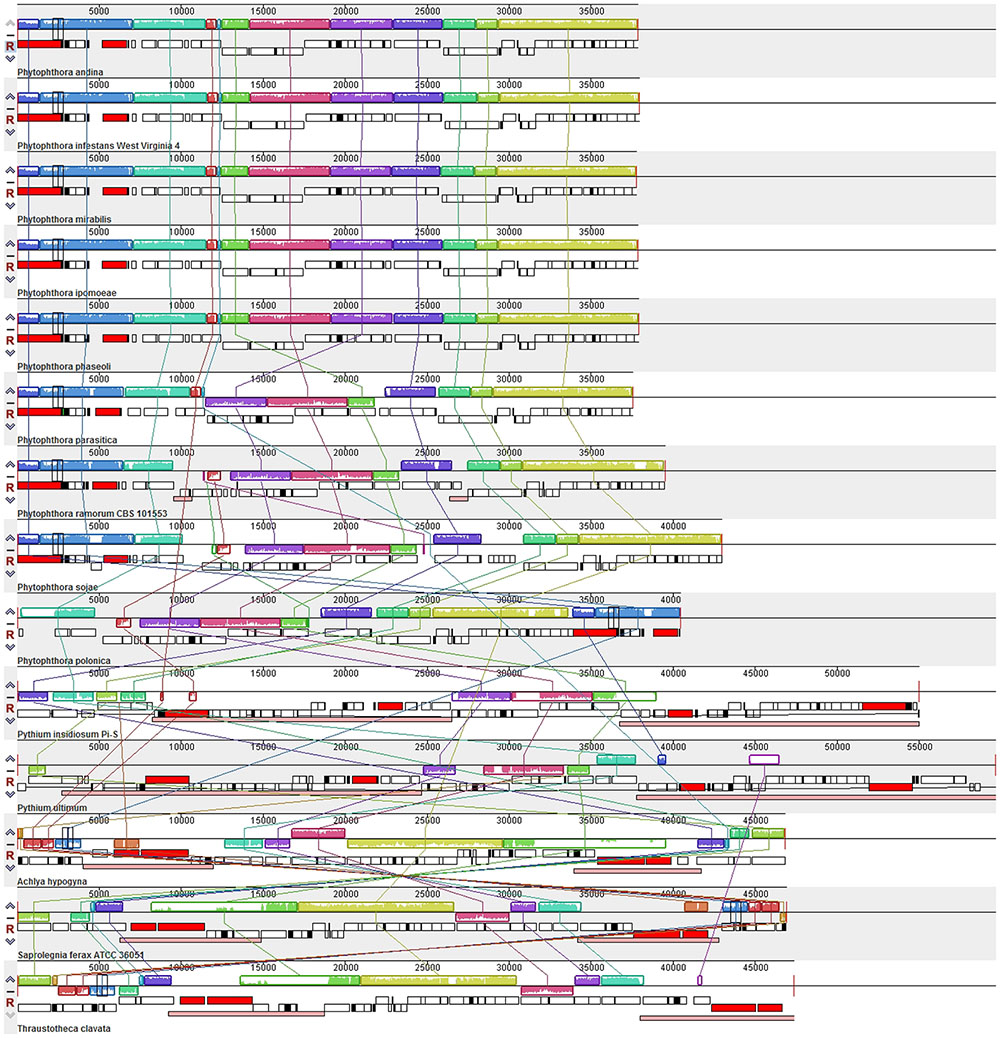
FIGURE 4. Collinearity analysis of the genome structures of 14 mitogenomes from the Oomycetes. Collinear blocks among 14 species are identified by MAUVE. Links between these collinear blocks are indicated by the thin colored lines.
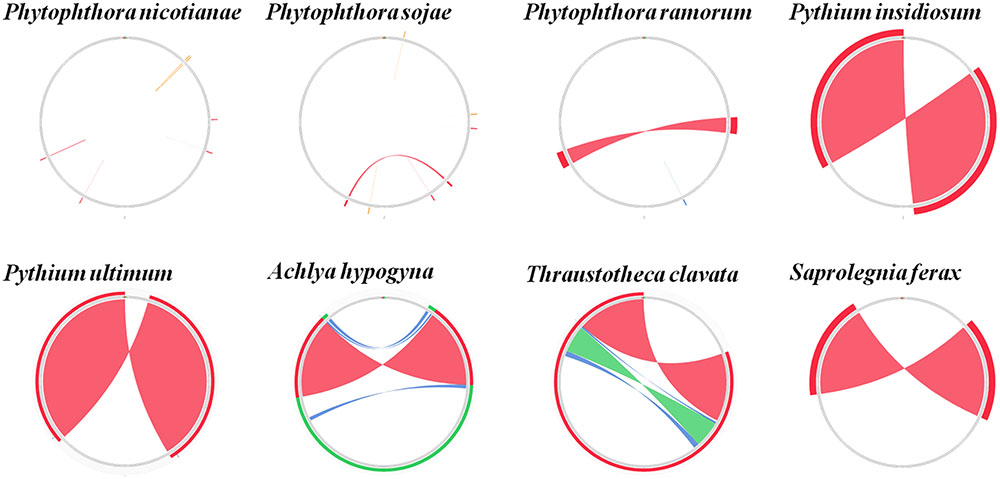
FIGURE 5. Comparison of inverted repeat regions in oomycetes species. There were no repeat regions in P. nicotianae and P. sojae. Repeat regions of 1.1 kb repeat regions were found in P. amorum. Reverted repeat regions of 18.3, 22, 7.7, 9.4, and 8.6 kb reverted repeat regions were found in P. insidiosum, P. ultimum, A. hypogyna, T. clavata, and S. ferax. These repeat regions were detected by blasting against the sequences themselves. The colors represent alignment scores and can reflect he similarity of sequences: red (≥200), green (50–80,) and blue (40–50).
Evolutionary Rates of Common Genes in the Peronosporales
To determine the nature of the evolutionary selection pressure in Peronosporales species, we calculated the evolutionary rate of 29 genes, and simultaneously chose candidate genes that could serve as molecular markers for identification based on variation of their evolutionary rates. The analysis showed that the dN/dS ratio changed from 0.016 to 0.448, suggesting that these genes underwent negative selection pressure in the process of evolution. The highest dN/dS ratio was found in atp8 (0.448), followed by rps10 (0.314) and rpl6 (0.273). However, the lowest of dN/dS ratios were detected for rps12, nad7, and nad4L (0.016, 0.033, and 0.034, respectively). The overall value of dN/dS in ribosomal genes was higher than that for the other genes (Figures 6A,B). In generally, the synonymous mutation rate (dN) and its variation range (i.e., standard deviation) can be used to determine the genetic evolutionary rate, especially for genes that are under purification selection. Therefore, the value of dN, and the correlations between dN and their interquartile ranges (IQRs) for individual genes were calculated. The value of dN ranged from 0.006 to 0.064, meeting the criteria for DNA barcoding (dN < 0.5) (Janouškovec et al., 2013). dN and IQR were found to be highly correlated (R2 = 0.95) (Figure 6C). Genes with higher dN values and wider standard deviations are more likely to provide better resolution in lower-level phylogenies for discrimination between more closely related taxa such as subspecies. To find suitable target molecular markers, we sorted these genes into several bins according to their dN values, (high dN value range from 0.02 to 0.06: rpl6, rps10, atp8, nad11, rps11, rps2, rps3, nad9, rps14 and rps4; medium dN value range from 0.01 to 0.02: rps8, rpl2, nad6, nad2, atp6, cox3, rpl16, cob, rpl14, nad7, cox2, nad5 and cox1; low dN value range from 0.006 to 0.01: nad3, nad4, rps12, nad1, atp1 and nad4L). Therefore, the genes in higher dN value (0.02 < dN < 0.5) were chosen as the candidates. Meanwhile, the genes with wider standard deviation (higher than the 50% of the 29 genes) were also selected, including the genes atp6, atp8, cox3, nad2, nad6, nad9, nad11, rpl2, rpl6, rps2, rps3, rps4, rps8, rps10, rps11 and rps14. Overall, rpl6, rps10, atp8, nad11, rps11, rps2, rps3, nad9, and rps4 were chosen as suitable molecular markers for the identification of species in the Peronosporales (Figure 6D). Based on these results, rpl6, rps10, atp8, nad11, rps11, rps2, rps3, nad9, and rps4 were chosen as the molecular markers for the identification of species in the Peronosporales.
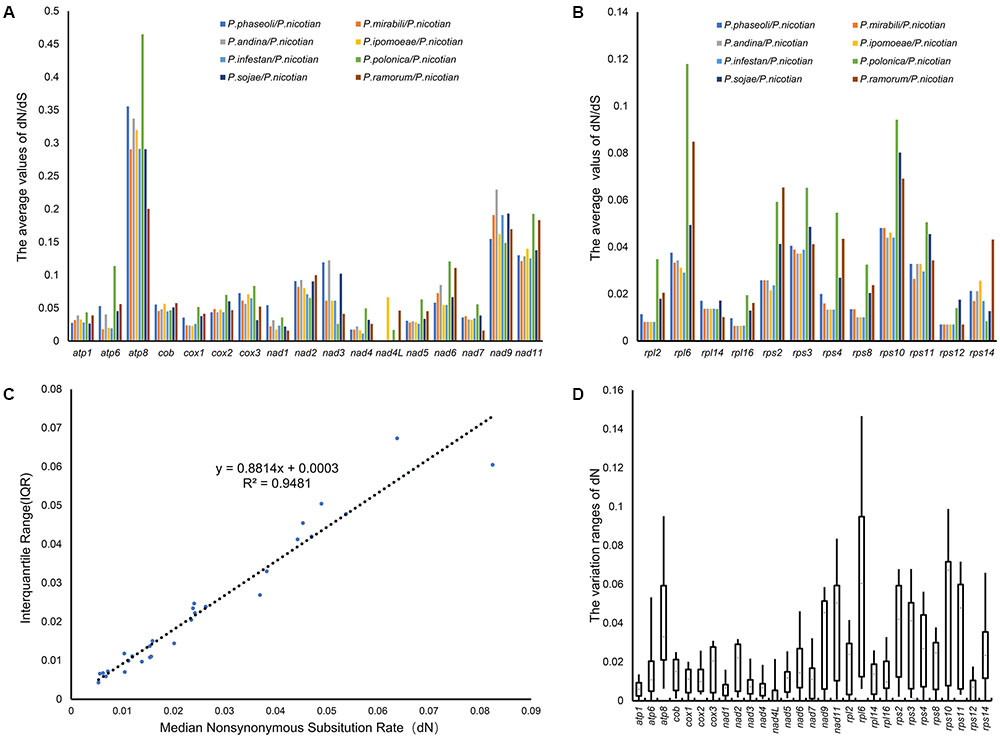
FIGURE 6. Evolutionary rates of common genes in the Peronosporales. (A,B) dN/ds ratio of pair-wise comparison among the nine species in the Peronosporales. (C) dN values and their standard deviations. (D) The Box-plot of dN values.
Phylogenomic Analyses
To trace the evolutionary position of the P. nicotianae specimen analyzed, we reconstructed phylogenies within the Oomycetes on an aligned data matrix that included 14 taxa and 29 mitochondrial PCGs with a total length of 24,244 bp. The ML and Bayesian trees revealed consistent phylogenetic relationships. Our results supported the monophyly of all orders studied herein. The phylogenomic investigation demonstrated that Phytophthora is monophyletic, and P. nicotianae was positioned close to the clade including P. mirabilis, P. ipomoeae, P. andina, P. infestans, and P. phaseoli with high bootstrap support (100%), which was confirmed in the Bayesian topology (value of 1). The species in the Pythiales were sister to all other species in the Peronosporales, and the species in the Saprolegniales clustered in a clade at the root of the Oomycetes tree (Figure 7). Moreover, the phylogenetic relationships based on rDNA in our analyses corresponded with the mitogenome results (Figure 8). In addition, for further confirmation, we conducted separate phylogenetic analyses for the candidate marker genes indicated above based on their optimization models. Our results identified six new DNA molecular markers (rpl6, atp8, nad11, rps2, rps3, and rps4) for oomycetes species identification based on these mitogenomes, which showed the same identification ability as the whole mitogenome and rDNA sequences (Supplementary Figures S1–S6).
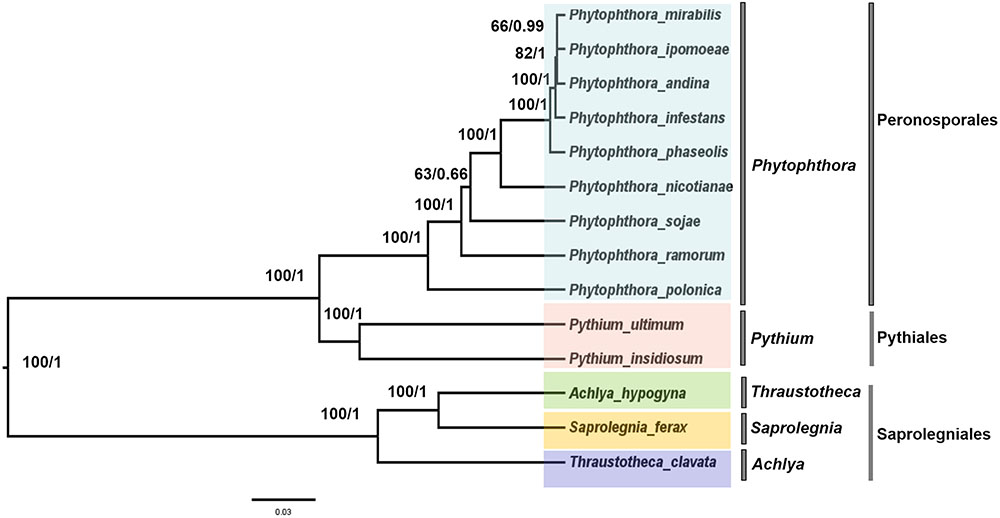
FIGURE 7. Phylogenetic analysis of oomycetes species based on 29 common mitochondrial DNA sequences. ML and Bayesian trees were constructed based on 24,244 nucleic acids. Bootstrap values (first value) and Bayesian inference (second value) are presented above the branches.
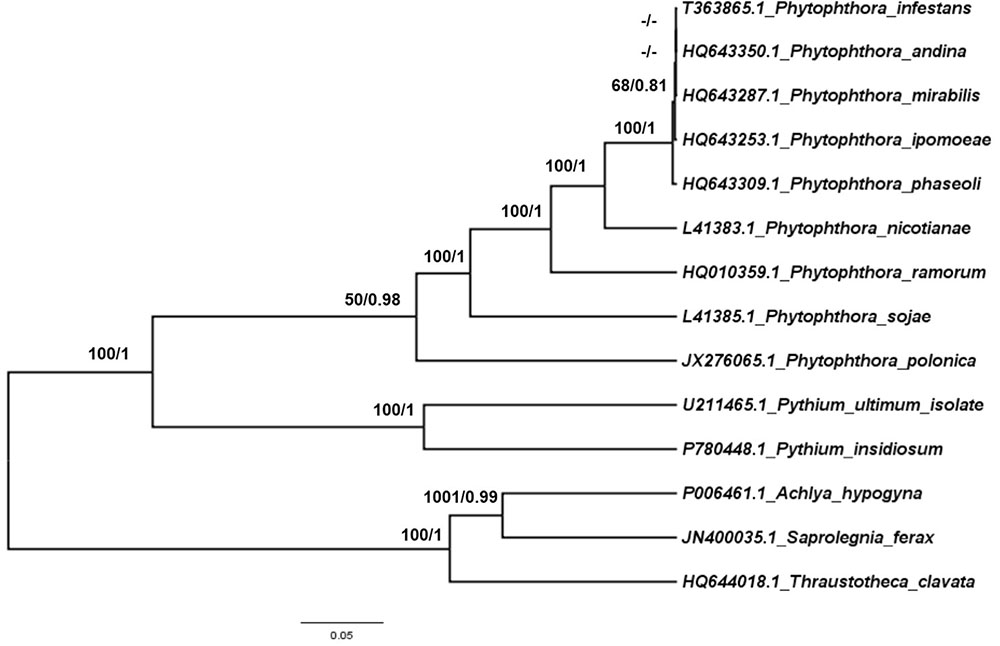
FIGURE 8. Phylogenetic analysis of oomycetes species based on rDNA mitochondrial DNA sequences. ML and Bayesian trees were constructed based on rDNA mitochondrial DNA sequences. Bootstrap values (first value) and Bayesian inference (second value) are presented above the branches. Numbers at nodes are likelihood bootstrap values > 50% and posterior probabilities > 0.60 and maximum are shown.
Discussion
Mitogenome Content and Features of Oomycetes Species
We assembled the complete mitochondrial genomes of P. nicotianae and performed a comparative mitochondrial genomic analysis using other previously published oomycete mitochondrial genomes. The comparison illustrated that P. nicotianae is highly similar to other Phytophthora species with respect to genome size, GC% content, and gene content. However, all the genomes are smaller than those of the related oomycete species in the Pythiales (P. insidiosum, 54,989 bp; P. ultimum, 59,689 bp) (Lévesque et al., 2010; Tangphatsornruang et al., 2016) and in the Saprolegniales (Saprolegnia ferax, 46,930 bp; Achlya hypogyna, 46,840 bp; Thraustotheca clavata, 47382 bp) (O’Brien et al., 2014). All the mitogenomes of Phytophthora have a compact gene arrangement, with 35 predicted PCGs, 2 rRNAs, and a set of 25 tRNAs specifying 19 amino acids (Paquin et al., 1997; Avila-Adame et al., 2006; Martin and Richardson, 2007). The overall gene content comparison study demonstrated that the gene components in mitogenomes are highly conserved among species in Phytophthora. However, the gene contents of the species in the Pythiales and Saprolegniales are larger than those in the species from the Peronosporales because of duplication events (O’Brien et al., 2014).
Genome Structure Comparison
Comprehensive comparison of the complete mitochondrial genomes of nine species in the Peronosporales, two species in the Pythiales, and three species in the Saprolegniales was performed to confirm the presence of the genomic rearrangements. Usually, the expansion and contraction of IR regions can cause gene duplications. Our study demonstrated that the IR expansion could have induced more gene duplication and genome expansion events in the Pythiales and Saprolegniales compared with the Peronosporales. In general, there is no IR detected in the genus Phytophthora. We found small IR regions of about 2.3 kb in the P. ramorum mitochondrial genome, which is consistent with an earlier study (Martin and Richardson, 2007). In contrast, IR regions were found in the Pythiales and Saprolegniales. The IR region can increase the gene dosage of ribosomal components (Bock and Knoop, 2012), and the presence of larger IRs in these genomes might serve to stabilize the genome (Hudspeth et al., 1983). This can be ascribed to the stability of IRs to intramolecular homologous recombination, the only effect of which is to reverse the order of the unique sequences between the arms of the repeat regions (Adelberg and Bergquist, 1972). Among the species in the Oomycetes, the IR is an ancestral feature. However, the reason for the IR loss in the Peronosporales is unclear. Thus, it is proposed that IR regions are not conserved and may not be an essential part of the mitochondrial genome. During their evolution, the species in the Peronosporales might have lost the IR regions in response to tremendous environmental pressure. The presence of IR regions might indicate that they represent hotspots for rearrangement (Martin and Richardson, 2007). For the structure comparison in the Peronosporales, collinearity analysis revealed that P. andina, P. infestans, P. mirabilis, P. ipomoeae, and P. phaseoli differed from P. nicotianae, P. sojae, P. ramorum, and P. polonica over a 12 k inversion region containing 11 genes and 8 tRNAs. The IR regions occurred on different strands. We deduced that this inverted structure is formed during the process of IR loss. Collinearity analysis classified these species into two different groups, consistent with their phylogenetic relationships based on whole mitogenomes. Therefore, analysis of gene structure appears to be a reliable approach to determine phylogenetic relationships in the Oomycetes. Based on the collinearity and phylogenetic relationship analyses, we speculated that the nine species of Phytophthora should be divided into two different groups, or perhaps even two genera; however, this hypothesis warrants further in-depth investigation for confirmation.
Molecular Markers Selection Based on the Mitogenomes
The genus Phytophthora includes a large diversity of devastating plant pathogens, which pose serious threats to agriculture and food production (Judelson and Blanco, 2005). Owing to their significant economic importance, molecular genetics and genomics research on Phytophthora species has been increasing (Govers and Gijzen, 2006). Individual genes—multiple loci from both the nuclear and mitochondrial genomes—have been used to explore the relationships among morphologically analogous Phytophthora species (Crawford et al., 1996). ITS regions have been confirmed as valuable molecular markers to determine evolutionary distance because they contain large number of variable sites (Cooke et al., 2000; Kroon et al., 2004; Feliner and Rosselló, 2007). Blair et al. (2008) presented a genus-wide phylogeny for 82 Phytophthora species using 7 of the most informative loci. Recent molecular analyses have substantially increased our understanding of the phylogenetic relationships among Phytophthora species (Cooke et al., 2000; Martin and Tooley, 2003). In this study, we present the phylogenetic analysis of rDNA, candidate genes, and whole mitogenomes of 14 species in the Oomycetes from the Pythiales, Saprolegniales, and Peronosporales. Our phylogenetic tree based on whole mitochondrial genomes has thus improved the current understanding regarding evolution of the oomycetes, and has unraveled several mitochondrial DNA genes that are suitable for use as molecular markers in future studies. The whole mitogenome can establish a well-resolved phylogeny of species in the Oomycetes. The multicopy nature of mitochondrial genomes in organisms make them appropriate sources of molecular marker identification. We estimated the evolutionary rates (dN/dS) of common genes among species in the Peronosporales to identify the candidate genes to serve as species identification markers. The results showed that these genes underwent pure selection pressure in the process of evolution. That is to say, the synonymous sites (dS) are saturated among these species and thus non-synonymous substitution sites (dN) are suitable for measuring evolutionary rates. Genes with higher dN values and wider standard deviations are more likely to provide better resolution in lower level phylogenies and discriminate between more closely related taxa such as subspecies. Moreover, we used the rDNA as reference for comparison with the mitogenome results to select the final gene markers for species identification of oomycetes. In other words, the genes showing similar resolution as rDNA and mitochondrial genomes were selected as the new molecular markers. Overall, rpl6, rps10, atp8, nad11, rps11, rps2, rps3, nad9, and rps4 were chosen as suitable molecular markers for the identification of species in the Peronosporales. The newly determined DNA molecular markers from the mitogenome can enrich the species identification for interpreting the evolutionary history of species in the Oomycetes. Thus, in future phylogenetic analyses, these newly determined DNA molecular markers can be used, together with the available nuclear DNA markers, especially for rare species or those from which mitochondrial genomes are hard to retrieve. Moreover, for unsequenced mitochondrial genomes, such molecular markers can provide a quick preview of their likely phylogenetic relationships. These markers can further serve as a useful guide for detecting oomycetes pathogens and developing treatment or monitoring strategies.
Conclusion
In our study, we presented a comprehensive investigation of the mitochondrial genome of P. nicotianae. The phylogeny based on the concatenated mitogenome data supports that P. nicotianae belongs to the Phytophthora. Comparative analyses suggest that the mitochondrial genome in Phytophthora is highly conserved except for an existing unique inversion region. Furthermore, we identified some useful molecular markers for molecular investigations to aid in species delimitation in the Oomycetes.
Author Contributions
CZ and ZZ conceived and designed the project. XY performed the experiments. XY drafted and revised the manuscript. XY and CF analyzed and interpreted the data. All authors have read and approved the final manuscript.
Funding
This work was supported by the Agricultural Science and Technology Innovation Program of China (ASTIP-TRIC07).
Conflict of Interest Statement
The authors declare that the research was conducted in the absence of any commercial or financial relationships that could be construed as a potential conflict of interest.
Supplementary Material
The Supplementary Material for this article can be found online at: http://journal.frontiersin.org/article/10.3389/fmicb.2017.01484/full#supplementary-material
FIGURE S1 | Phylogenetic analysis of oomycetes species based on atp8 gene.
FIGURE S2 | Phylogenetic analysis of oomycetes species based on rpl16 gene.png.
FIGURE S3 | Phylogenetic analysis of oomycetes species based on nad11 gene.
FIGURE S4 | Phylogenetic analysis of oomycetes species based on rps2 gene.
FIGURE S5 | Phylogenetic analysis of oomycetes species based on rps4 gene.
FIGURE S6 | Phylogenetic analysis of oomycetes species based on rps3 gene.
Footnotes
- ^http://rrwick.github.io/Bandage/
- ^http://dogma.ccbb.utexas.edu/
- ^http://www.ncbi.nlm.nih.gov/gorf/gorf.html
- ^http://ogdraw.mpimp-golm.mpg.de/
- ^https://github.com/rayrock01/Extract_gene.pl
- ^http://tools.bat.infspire.org/circoletto/
References
Adelberg, E. A., and Bergquist, P. (1972). The stabilization of episomal integration by genetic inversion: a general hypothesis. Proc. Natl. Acad. Sci. U.S.A. 69, 2061–2065. doi: 10.1073/pnas.69.8.2061
Andrews, S. (2017). FastQC: A Quality Control Tool for High Throughput Sequence Data. Available at: http://www.bioinformatics.babraham.ac.uk/projects/fastqc. [accessed March 30, 2017].
Apple, J. L. (1962). Physiological specialization within Phytophthora parasitica var. nicotianae. Phytopathology 52, 351–354.
Avila-Adame, C., Gómez-Alpizar, L., Zismann, V., Jones, K. M., Buell, C. R., and Ristaino, J. B. (2006). Mitochondrial genome sequences and molecular evolution of the Irish potato famine pathogen, Phytophthora infestans. Curr. Genet. 49, 39–46. doi: 10.1007/s00294-005-0016-3
Blair, J. E., Coffey, M. D., Park, S. Y., Geiser, D. M., and Kang, S. (2008). A multi-locus phylogeny for Phytophthora utilizing markers derived from complete genome sequences. Fungal Genet. Biol. 45, 266–277. doi: 10.1016/j.fgb.2007.10.010
Blaya, J., Lacasa, C., Lacasa, A., Martínez, V., Santísima-Trinidad, A. B., Pascual, J. A., et al. (2015). Characterization of Phytophthora nicotianae isolates in southeast Spain and their detection and quantification through a real-time TaqMan PCR. J. Sci. Food Agric. 95, 1243–1251. doi: 10.1002/jsfa.6813
Bock, R., and Knoop, V. (2012). Genomics of Chloroplasts and Mitochondria. Dordrecht: Springer. doi: 10.1007/978-94-007-2920-9
Bowers, J. H., and Locke, J. C. (2004). Effect of formulated plant extracts and oils on population density of Phytophthora nicotianae in soil and control of Phytophthora blight in the greenhouse. Plant Dis. 88, 11–16. doi: 10.1094/PDIS.2004.88.1.11
Brown, W. M., George, M Jr, and Wilson, A. C. (1979). Rapid evolution of animal mitochondrial DNA. Proc. Natl. Acad. Sci. U.S.A. 76, 1967–1971. doi: 10.1073/pnas.76.4.1967
Chen, J. Z., and Hebert, P. D. N. (1999). Intra-individual sequence diversity and hierarchical approach to the study of mitochondrial DNA mutations. Mutat. Res. 434, 205–217. doi: 10.1016/S0921-8777(99)00029-4
Cooke, D. E., Drenth, A., Duncan, J. M., Wagels, G., and Brasier, C. M. (2000). A molecular phylogeny of Phytophthora and related oomycetes. Fungal Genet. Biol. 30, 17–32. doi: 10.1006/fgbi.2000.1202
Crawford, A. R., Bassam, B. J., Drenth, A., MacLean, D. J., Irwin, J. A. G., et al. (1996). Evolutionary relationships among Phytophthora species deduced from rDNA sequence analysis. Mycol. Res. 100, 437–443. doi: 10.1016/S0953-7562(96)80140-7
Csinos, S. (1999). Stem and root resistance to tobacco black shank. Plant Dis. 83, 777–780. doi: 10.1094/PDIS.1999.83.8.777
Darling, A. C., Mau, B., Blattner, F. R., and Perna, N. T. (2004). Mauve: multiple alignment of conserved genomic sequence with rearrangements. Genome Res. 14, 1394–1403. doi: 10.1101/gr.2289704
Darzentas, N. (2010). Circoletto: visualizing sequence similarity with Circos. Bioinformatics 26, 2620–2621. doi: 10.1093/bioinformatics/btq484
Falcón-Rodríguez, A. B., Costales, D., Cabrera, J. C., and Martínez-Téllez, M. A. (2011). Chitosan physico–chemical properties modulate defense responses and resistance in tobacco plants against the oomycete Phytophthora nicotianae. Pestic. Biochem. Physiol. 100, 221–228. doi: 10.1016/j.pestbp.2011.04.005
Feliner, G. N., and Rosselló, J. A. (2007). Better the devil you know? Guidelines for insightful utilization of nrDNA ITS in species-level evolutionary studies in plants. Mol. Phylogenet. Evol. 44, 911–919. doi: 10.1016/j.ympev.2007.01.013
Gavino, P. D., and Fry, W. E. (2002). Diversity in and evidence for selection on the mitochondrial genome of Phytophthora infestans. Mycologia 94, 781–793. doi: 10.1080/15572536.2003.11833172
Govers, F., and Gijzen, M. (2006). Phytophthora genomics: the plant destroyers’ genome decoded. Mol. Plant Microbe Interact. 19, 1295–1301. doi: 10.1094/MPMI-19-1295
Grayburn, W. S., Hudspeth, D. S., Gane, M. K., and Hudspeth, M. E. (2004). The mitochondrial genome of Saprolegnia ferax: organization, gene content and nucleotide sequence. Mycologia 96, 981–989. doi: 10.1080/15572536.2005.11832898
Hudspeth, M. E., Shumard, D. S., Bradford, C. J., and Grossman, L. I. (1983). Organization of Achlya mtDNA: a population with two orientations and a large inverted repeat containing the rRNA genes. Proc. Natl. Acad. Sci. U.S.A 80, 142–146. doi: 10.1073/pnas.80.1.142
Janouškovec, J., Liu, S. L., Martone, P. T., Carré, W., Leblanc, C., Collén, J., et al. (2013). Evolution of red algal plastid genomes: ancient architectures, introns, horizontal gene transfer, and taxonomic utility of plastid markers. PLoS ONE 8:e59001. doi: 10.1371/journal.pone.0059001
Judelson, H. S., and Blanco, F. A. (2005). The spores of Phytophthora: weapons of the plant destroyer. Nat. Rev. Microbiol. 3, 47–58. doi: 10.1038/nrmicro1064
Judelson, H. S., and Roberts, S. (1996). Effects of calcium on germination and further zoospore release from zoospore cysts of Phytophthora parasitica. Mycol. Res. 100, 1498–1504. doi: 10.1016/S0953-7562(96)80085-2
Kroon, L. P., Bakker, F. T., van den Bosch, G. B., Bonants, P. J., and Flier, W. G. (2004). Phylogenetic analysis of Phytophthora species based on mitochondrial and nuclear DNA sequences. Fungal Genet. Biol. 41, 766–782. doi: 10.1016/j.fgb.2004.03.007
Lévesque, C. A., Brouwer, H., Cano, L., Hamilton, J. P., Holt, C., Huitema, E., et al. (2010). Genome sequence of the necrotrophic plant pathogen Pythium ultimum reveals original pathogenicity mechanisms and effector repertoire. Genome Biol. 11:R73. doi: 10.1186/gb-2010-11-7-r73
Librado, P., and Rozas, J. (2009). DnaSP v5: a software for comprehensive analysis of DNA polymorphism data. Bioinformatics 25, 1451–1452. doi: 10.1093/bioinformatics/btp187
Liu, H., Ma, X., Yu, H., Fang, D., Li, Y., Wang, X., et al. (2016). Genomes and virulence difference between two physiological races of Phytophthora nicotianae. Gigascience 5, 3. doi: 10.1186/s13742-016-0108-7
Lohse, M., Drechsel, O., Kahlau, S., and Bock, R. (2013). OrganellarGenomeDRAW—a suite of tools for generating physical maps of plastid and mitochondrial genomes and visualizing expression data sets. Nucleic Acids Res. 41, W575–W581. doi: 10.1093/nar/gkt289
Martin, F. N., Bensasson, D., Tyler, B. M., and Boore, J. L. (2007). Mitochondrial genome sequences and comparative genomics of Phytophthora ramorum and P. sojae. Curr. Genet. 51, 285–296. doi: 10.1007/s00294-007-0121-6
Martin, F. N., and Richardson, P. (2007). “Mitochondrial genomics in the genus Phytophthora with a focus on Phytophthora ramorum,” in Proceedings of the Sudden Oak Death Third Science Symposium, Santa Rosa, CA.
Martin, F. N., and Tooley, P. W. (2003). Phylogenetic relationships of Phytophthora ramorum, P. nemorosa, and P. pseudosyringae, three species recovered from areas in California with sudden oak death. Mycol. Res. 107, 1379–1391. doi: 10.1017/S0953756203008785
O’Brien, M. A., Misner, I., and Lane, C. E. (2014). Mitochondrial genome sequences and comparative genomics of Achlya hypogyna and Thraustotheca clavata. J. Eukaryot. Microbiol. 61, 146–154. doi: 10.1111/jeu.12092
Panabières, F., Ali, G. S., Allagui, M. B., Dalio, R. J. D., Gudmestad, N. C., Kuhn, M. L., et al. (2016). Phytophthora nicotianae diseases worldwide: new knowledge of a long-recognised pathogen. Phytopathol. Mediterr. 55, 20–40.
Paquin, B., Laforest, M. J., Forget, L., Roewer, I., Wang, Z., Longcore, J., et al. (1997). The fungal mitochondrial genome project: evolution of fungal mitochondrial genomes and their gene expression. Curr. Genet. 31, 380–395. doi: 10.1007/s002940050220
Posada, D. (2008). jModelTest: phylogenetic model averaging. Mol. Biol. Evol. 25, 1253–1256. doi: 10.1093/molbev/msn083
Qu, T., Shao, Y., Csinos, A. S., and Ji, P. (2016). Sensitivity of Phytophthora nicotianae from tobacco to fluopicolide, mandipropamid, and oxathiapiprolin. Plant Dis. 100, 2119–2125. doi: 10.1094/PDIS-04-16-0429-RE
Ronquist, F., Teslenko, M., van der Mark, P., Ayres, D. L., Darling, A., Höhna, S., et al. (2012). MrBayes 3.2: efficient Bayesian phylogenetic inference and model choice across a large model space. Syst. Biol. 61, 539–542. doi: 10.1093/sysbio/sys029
Ruby, J. G., Bellare, P., and Derisi, J. L. (2013). PRICE: software for the targeted assembly of components of (Meta) genomic sequence data. G3 (Bethesda) 3, 865–880. doi: 10.1534/g3.113.005967
Schattner, P., Brooks, A. N., and Lowe, T. M. (2005). The tRNAscan-SE, snoscan and snoGPS web servers for the detection of tRNAs and snoRNAs. Nucleic Acids Res. 33, W686–W689. doi: 10.1093/nar/gki366
Smith, D., Coulson, G. E., and Morris, G. J. (1986). A comparative study of the morphology and viability of hyphae of Penicillium expansum and Phytophthora nicotianae during freezing and thawing. Microbiology 132, 2013–2021. doi: 10.1099/00221287-132-7-2013
Speight, G. (1994). Distribution of Phytophthora parasitica var. nicotianae races and their sensitivity to metalaxyl in Georgia. Plant Dis. 78, 471–474. doi: 10.1094/PD-78-0471
Stamatakis, A. (2014). RAxML version 8: a tool for phylogenetic analysis and post-analysis of large phylogenies. Bioinformatics 30, 1312–1313. doi: 10.1093/bioinformatics/btu033
Tangphatsornruang, S., Ruang-Areerate, P., Sangsrakru, D., Rujirawat, T., Lohnoo, T., Kittichotirat, W., et al. (2016). Comparative mitochondrial genome analysis of Pythium insidiosum and related oomycete species provides new insights into genetic variation and phylogenetic relationships. Gene 575, 34–41. doi: 10.1016/j.gene.2015.08.036
van Jaarsveld, E., Wingfield, M. J., and Drenth, A. (2002). Effect of metalaxyl resistance and cultivar resistance on control of Phytophthora nicotianae in tobacco. Plant Dis. 86, 362–366. doi: 10.1094/PDIS.2002.86.4.362
von Broembsen, S. L., and Deacon, J. W. (1996). Effects of calcium on germination and further zoospore release from zoospore cysts of Phytophthora parasitica. Mycol. Res. 100, 1498–1504. doi: 10.1016/S0953-7562(96)80085-2
Wick, R. R., Schultz, M. B., Zobel, J., and Holt, K. E. (2015). Bandage: interactive visualisation of de novo genome assemblies. Bioinformatics 31, 3350–3352. doi: 10.1093/bioinformatics/btv383
Keywords: Phytophthora nicotianae, mitochondrial genome, comparative genomics, phylogenetic relationship, molecular markers
Citation: Yuan X, Feng C, Zhang Z and Zhang C (2017) Complete Mitochondrial Genome of Phytophthora nicotianae and Identification of Molecular Markers for the Oomycetes. Front. Microbiol. 8:1484. doi: 10.3389/fmicb.2017.01484
Received: 07 April 2017; Accepted: 24 July 2017;
Published: 08 August 2017.
Edited by:
Michael Thomas-Poulsen, University of Copenhagen, DenmarkReviewed by:
Biswapriya Biswavas Misra, Texas Biomedical Research Institute, United StatesBishwo N. Adhikari, Agricultural Research Service (USDA), United States
Pepijn Wilhelmus Kooij, Royal Botanic Gardens, Kew, United Kingdom
Copyright © 2017 Yuan, Feng, Zhang and Zhang. This is an open-access article distributed under the terms of the Creative Commons Attribution License (CC BY). The use, distribution or reproduction in other forums is permitted, provided the original author(s) or licensor are credited and that the original publication in this journal is cited, in accordance with accepted academic practice. No use, distribution or reproduction is permitted which does not comply with these terms.
*Correspondence: Chengsheng Zhang, emhjaGVuZ3NoZW5nQDEyNi5jb20= Zhongfeng Zhang, emhhbmd6aG9uZ2ZlbmdAY2Fhcy5jbg==
 Xiaolong Yuan
 Chao Feng
 Zhongfeng Zhang
 Chengsheng Zhang