Abstract
Natural, also referred to as spontaneous wine fermentations, are carried out by the native microbiota of the grape juice, without inoculation of selected, industrially produced yeast or bacterial strains. Such fermentations are commonly initiated by non-Saccharomyces yeast species that numerically dominate the must. Community composition and numerical dominance of species vary significantly between individual musts, but Saccharomyces cerevisiae will in most cases dominate the late stages of the fermentation and complete the process. Nevertheless, non-Saccharomyces species contribute significantly, positively or negatively, to the character and quality of the final product. The contribution is species and strain dependent and will depend on each species or strain’s absolute and relative contribution to total metabolically active biomass, and will therefore, be a function of its relative fitness within the microbial ecosystem. However, the population dynamics of multispecies fermentations are not well understood. Consequently, the oenological potential of the microbiome in any given grape must, can currently not be evaluated or predicted. To better characterize the rules that govern the complex wine microbial ecosystem, a model yeast consortium comprising eight species commonly encountered in South African grape musts and an ARISA based method to monitor their dynamics were developed and validated. The dynamics of these species were evaluated in synthetic must in the presence or absence of S. cerevisiae using direct viable counts and ARISA. The data show that S. cerevisiae specifically suppresses certain species while appearing to favor the persistence of other species. Growth dynamics in Chenin blanc grape must fermentation was monitored only through viable counts. The interactions observed in the synthetic must, were upheld in the natural must fermentations, suggesting the broad applicability of the observed ecosystem dynamics. Importantly, the presence of indigenous yeast populations did not appear to affect the broad interaction patterns between the consortium species. The data show that the wine ecosystem is characterized by both mutually supportive and inhibitory species. The current study presents a first step in the development of a model to predict the oenological potential of any given wine mycobiome.
Introduction
The alcoholic fermentation of grape must, whether inoculated or not with commercial starter cultures, is initiated by a complex yeast community comprising a high proportion of oxidative and weakly fermentative yeasts (Jolly et al., 2003a; Ghosh et al., 2015; Wang et al., 2015). These species are rapidly outgrown by strongly fermentative yeasts that dominate the middle and end of fermentation (Pretorius et al., 1999; Jolly et al., 2003b; Zott et al., 2008; Bagheri et al., 2015; Ghosh et al., 2015; Setati et al., 2015; Wang et al., 2015; Morgan, 2016; Portillo et al., 2016; Tristezza et al., 2016). The growth and metabolic activity of these yeast species are influenced by physicochemical conditions that prevail during the fermentation process including the rapid depletion of nutrients and oxygen and the accumulation of ethanol (Sainz et al., 2003; Mendoza et al., 2009). However, beyond such environmental or chemical factors, ecological interactions between yeast species will primarily determine the wine fermentation dynamics and the outcome of the fermentation process (Nissen and Arneborg, 2003; Pina et al., 2004; Sadoudi et al., 2012; Renault et al., 2013; Morales et al., 2015; Wang et al., 2015; Shekhawat et al., 2017). For many years, research evaluated interactions between strains of S. cerevisiae, the main wine fermenting yeast, with a focus on killer toxin-producing strains (Branco et al., 2014; Williams et al., 2015; Albergaria and Arneborg, 2016; Pérez-Torrado et al., 2017). However, with the growing interest in non-Saccharomyces yeast species and the commercialization of a few species for use as co-inoculants in controlled mixed starter fermentations, attention has turned toward evaluating yeast–yeast interactions holistically (Ciani and Comitini, 2015; Albergaria and Arneborg, 2016; Ciani et al., 2016; Wang et al., 2016). Undoubtedly, wine microbial consortia are difficult to scrutinize. Consequently, some studies have employed simplified models in which the interaction between two species mainly S. cerevisiae and non-Saccharomyces species were investigated (Andorra et al., 2011; Wang et al., 2014; Englezos et al., 2015; Shekhawat et al., 2017). Several aspects, including inoculum ratio, the timing of inoculation of S. cerevisiae, cell-cell contact and production of inhibitory metabolites, have been investigated in order to decipher the mechanisms underlying yeast–yeast interactions during wine fermentation (Gobbi et al., 2013; Branco et al., 2014, 2015; Izquierdo Cañas et al., 2014; Kemsawad et al., 2015; Lencioni et al., 2016). Despite these efforts, the overall interactions among wine yeast species in a fermentation modulated by multiple species remain unclear.
Synthetic microbial consortia composed of a subset of culturable strains that simulate the natural community and preserve the indigenous interactions shaped by co-adaptation/evolution, provide a tractable model system with reduced complexity (De Roy et al., 2014; Ponomarova and Patil, 2015), which makes it easier to study interspecific interactions (Jagmann and Philipp, 2014; Jiang et al., 2017). Such a model system also opens opportunities to employ methods inapplicable to complex systems, e.g., species quantitation can easily be done with selective plating, quantitative PCR, fluorescent in situ hybridization (FISH), and flow cytometry (Xufre et al., 2006; Grube and Berg, 2009; Zott et al., 2010; Ponomarova and Patil, 2015). These methods have been applied successfully to monitor population dynamics in wine fermentation. However, they are not without limitations. For instance, FISH and qPCR, require species-specific probes and primers whereas, flow cytometry requires prior knowledge of initial microbial population in order to label different species (Deere et al., 1998; Malacrinò et al., 2001; Prakitchaiwattana et al., 2004; Hierro et al., 2006a; Xufre et al., 2006; Andorrà et al., 2010a,b; Zott et al., 2010). In contrast, Automated Ribosomal Intergenic Spacer Analysis (ARISA), which mainly relies on the heterogeneity of the ITS1-5.8S rRNA-ITS2 gene, has been used successfully in several ecological studies (Brežná et al., 2010; Kraková et al., 2012; Ghosh et al., 2015). Like other methods, ARISA may also introduce bias since it is unable to differentiate live and dead cells. However, ARISA is an efficient and rapid tool that can provide a snapshot of the population dynamics (Hierro et al., 2006a; Ramette, 2009; Brežná et al., 2010; Kraková et al., 2012; O’Sullivan et al., 2013; Cangelosi and Meschke, 2014; Ženišová et al., 2014; Ghosh et al., 2015).
The current study aimed to evaluate the application of a multi-species yeast consortium as a tool to investigate population dynamics and yeast–yeast interactions in wine fermentation. The constructed model consortium resembles natural wine yeast consortia in so far as comprising species with different fermentative capacities (i.e., weakly fermentative, medium fermentation capacity and strongly fermentative). Moreover, the consortium was formulated based on species that have been encountered and found in sometimes dominant numbers in grape musts from different South African wine regions and cultivars (Jolly et al., 2003a; Weightman, 2014; Bagheri et al., 2015; Ghosh et al., 2015; Morgan, 2016). The model consortium was evaluated in synthetic must in the presence and absence of S. cerevisiae, as well as in a real grape juice that differed significantly from the synthetic must. To allow for a rapid and accurate monitoring of the population dynamics, ARISA was optimized and assessed for its suitability and reliability as a tool to semi-quantitatively monitor yeast dynamics in the model consortium.
The data show that S. cerevisiae strongly and specifically suppresses certain non-Saccharomyces yeast species, while also favoring the persistence of other species. The findings suggest that the complex modulation of the yeast ecosystem by S. cerevisiae will influence the outcome of wine fermentation by selectively changing the contribution of non-Saccharomyces species.
Materials and Methods
Yeast Strains and Culture Conditions
Sixteen yeast isolates obtained from the culture collection of the Institute for Wine Biotechnology (IWBT) and two commercial yeast species, S. cerevisiae Lalvin EC1118 (Lallemand, Canada) and Torulaspora delbrueckii BIODIVA (Lallemand, Canada) were used in this study (Table 1). The yeast stock cultures were maintained in 20% (v/v) glycerol at -80°C and were streaked out on Wallerstein Laboratory Nutrient agar (WLN) (Sigma–Aldrich, Spain) when required. The plates were incubated at 30°C for 3–5 days.
Table 1
| Species | Strains number | ITS Size (bp) |
|---|---|---|
| Hanseniaspora uvarum (Hu) | Y1104 | 747 |
| Hanseniaspora vineae (Hv) | Y980 | 740 |
| Hanseniaspora opuntiae (Ho) | Y866 | 748 |
| Pichia terricola (Pt) | Y974 | 419 |
| Issatchenkia orientalis (Io) | Y1130 | 490 |
| Starmerella bacillaris (Sb) | Y975 | 458 |
| Candida apicola (Cap) | Y957 | 457 |
| Candida azyma (Ca) | Y979 | 436 |
| Candida parapsilosis (Cp) | Y842 | 522 |
| Candida glabrata (Cg) | Y800 | 884 |
| Torulaspora delbrueckii (Td) | BIODIVA | 797 |
| Rhodotorula glutinis (Rg) | Y824 | 614 |
| Rhodosporidium diobovatum (Rd) | Y840 | 618 |
| Kazachstania aerobia (Ka) | Y845 | 751 |
| Lachancea thermotolerans (Lt) | Y973 | 675 |
| Saccharomyces cerevisiae (Sc) | EC1118 | 842 |
| Wickerhamomyces anomalus (Wa) | Y934 | 618 |
| Metschnikowia pulcherrima (Mp) | Y981 | 377 |
Strains used in this study and their ITS1-5.8S rRNA-ITS2 gene sizes.
Automated Ribosomal Intergenic Spacer Analysis (ARISA)
Single colonies of each yeast species were inoculated into 5 mL YPD broth (10 g/L yeast extract, 20 g/L peptone and, 20 g/L glucose) and incubated for 16 h at 30°C. Two milliliters of cultures were centrifuged at 5630 × g for 10 min to collect the cells. Genomic DNA was extracted using the method described by Sambrook and Russell (2006). DNA concentration was determined spectrophotometrically, using the NanoDrop®ND-1000 (NanoDrop Technologies Inc., Wilmington, DE, United States). The ITS1-5.8S rRNA-ITS2 gene was amplified using the carboxy-fluorescein labeled ITS1 primer (5′-6-FAM- TCC GTA GGT GAA CCT TGC GG-3′) and ITS4 (5′- TCC GTA GGT GAA CCTTGC GG-3′) in a 25 μL reaction, containing 50 ng DNA, 1U Takara Ex Taq, DNA polymerase (TaKaRa Bio Inc., Olsu, Shiga, Japan), 1 × Taq buffer, 0.25 μM of each primer, 400 μM dNTP mix and 1 mM MgCl2. The PCR reaction was performed under the following conditions: an initial denaturation of 3 min at 94°C, followed by 40 cycles of denaturation at 94°C for 30 s, annealing at 54°C for 30 s, extension at 72°C for 45 s and a final extension step of 72°C for 10 min (Slabbert et al., 2010). Three independent PCR reactions were performed. The PCR products were excised from the gel and purified using the ZymocleanTM Gel DNA Recovery Kit Short Protocol (Zymo Research Corporation, Irvine, CA, United States). The ARISA fragments were separated by capillary electrophoresis at the Stellenbosch University Central Analytical Facility on an ABI 3010x Genetic Analyzer (Applied Biosystems) with a ROX 1.1 labeled size standard (75-1121 base pairs). ARISA profiles were analyzed using Genemapper software version 4.1 (Applied Biosystems). Only fragments with peak area larger than 0.5% of the total fluorescence were considered for further analysis. A bin size of 3 bp for species with ITS region below 700 and 5 bp for species with ITS region above 700 bp, was employed to minimize the inaccuracies in the ARISA analysis (Slabbert et al., 2010). The relative abundance of each peak was calculated by dividing individual peak area with the total peak areas for the respective sample.
Micro-Fermentations
Fermentation in Synthetic Grape Must
Eight yeast species viz. Metschnikowia pulcherrima, Pichia terricola, Starmerella bacillaris, Candida parapsilosis, Wickerhamomyces anomalus, Lachancea thermotolerans, Hanseniaspora vineae, and S. cerevisiae were selected to establish a consortium based on (i) their frequent occurrence in grape juices from SA and other wine producing regions, (ii) easy and consistent resolution in ARISA, and (iii) easy morphological detection on WL agar (Jolly et al., 2003a; Combina et al., 2005; Di Maro et al., 2007; Lopandic et al., 2008; Romancino et al., 2008; Salinas et al., 2009; Sun et al., 2009; Suzzi et al., 2012; Weightman, 2014; Maturano et al., 2015; Morgan, 2016). Fermentations were carried out, by inoculating the selected yeast species, in synthetic grape juice medium (pH 3.5) adapted from Bely et al. (1990) and Henschke and Jiranek (1993). The medium contained 200 g/L sugars (100 g/L glucose and 100 g/L fructose) and 300 mg/L assimilable nitrogen (460 mg/L NH4Cl and 180 mg/L amino acids). Five hundred milliliters of the juice was dispensed into 500 mL Erlenmeyer flasks, fitted with CO2 traps. The juice was inoculated with the NS-Sc (non-Saccharomyces-Saccharomyces) consortium comprising of 7 non-Saccharomyces yeast species (M. pulcherrima, P. terricola, S. bacillaris, C. parapsilosis, W. anomalus, L. thermotolerans, and H. vineae), each inoculated at 106 cells/mL and S. cerevisiae at 103 cells/mL, and the NS (non-Saccharomyces) consortium which only consisted of the seven non-Saccharomyces yeasts. The fermentations were performed at 25°C with no agitation. Fermentations were monitored by weighing the flasks regularly to measure CO2 loss. Furthermore, samples were collected regularly to determine sugar concentrations using Fourier Transform Infra-Red Spectroscopy on the Foss Wine scan 2000 (Rhine Ruhr, Denmark). Samples were withdrawn at 2-day intervals and yeast population dynamics was monitored by direct plating on WLN agar and ARISA.
Real Must Fermentation
Fifty liters of clarified Chenin blanc grape juice was obtained from a commercial cellar. The chemical composition of juice was measured, using spectroscopy technique by Foss wine scan 2000 (Rhine Ruhr, Denmark). The yeast community composition of the juice was determined by serial dilution and direct plating on WL-agar, followed by identification through ITS-5.8S rRNA amplification, RFLP, and sequencing as described in Bagheri et al. (2015). Subsequently, 1.5 L Chenin blanc grape juice was dispensed into 2 L fermentation bottles. Three sets of fermentations were performed: (i) spontaneous (ii) Sc-inoculated fermentation (at 103 cells/mL, S. cerevisiae EC1118), and (iii) NS-Sc consortium inoculated (7 non-Saccharomyces at 106 cells/mL vs. S. cerevisiae at 103 cells/mL). The fermentations were performed in triplicate, at 25°C, and without SO2 addition. The fermentations were weighed daily to monitor CO2 release and samples were withdrawn at 2-day intervals to monitor population dynamics. The residual sugar at the end of fermentation was measured. The fermentations were considered complete when residual sugars in wine were less than 2 g/L and the yeast population dynamics was monitored by direct plating on WLN agar.
Statistical Analysis
The DNA extraction, ARISA analysis, and fermentations were performed in triplicate. The values were presented as means ± SD. The differences between treatments were determined using analysis of variance (ANOVA) with the statistical software Statistica version 13.0 (StatSoft Inc., Tulsa, OK, United States). The differences were considered significant should the p-values were equal or less than 0.05. For multivariate data analysis, the Principal Component Analysis was performed, using XLSTAT in Microsoft®Excel (2016).
Results
Selection of Yeast Species for the Consortium
Eighteen yeast species commonly isolated from South African grape musts (Jolly et al., 2003a; Weightman, 2014; Bagheri et al., 2015; Morgan, 2016), were initially evaluated for DNA extractability and resolvability in ARISA analysis. The ARISA profile of the mixed community only revealed 13 peaks (Figure 1). An overlap between Rhodotorula glutinis (614 bp), R. diobovatum (618 bp) and W. anomalus (618 bp) was observed. Similarly, H. uvarum (747 bp), H. opuntiae (748 bp), and Kazachstania aerobia (751 bp), as well as S. bacillaris (458 bp) and C. apicola (458 bp) co-migrated and could not be resolved. Consequently, eight species (M. pulcherrima, P. terricola, S. bacillaris, C. parapsilosis, W. anomalus, L. thermotolerans, H. vineae, and S. cerevisiae), which could be reliably resolved in ARISA, and could be distinguished based on their colony morphology on WLN agar, were selected to establish a model consortium. The efficiency of DNA extraction method and ARISA on the consortium was evaluated. In addition, standard curves of optical density (OD600nm) vs. colony forming units (CFU/mL) were established for each species (data not shown). A cell suspension containing approximately each at 105 CFU/mL was prepared. Total genomic DNA was extracted from the mixed culture and ARISA was performed. Similar peak heights and peak areas were observed for all species, suggesting that the DNA extraction method and ARISA were efficient for all of them (Figure 2).
FIGURE 1
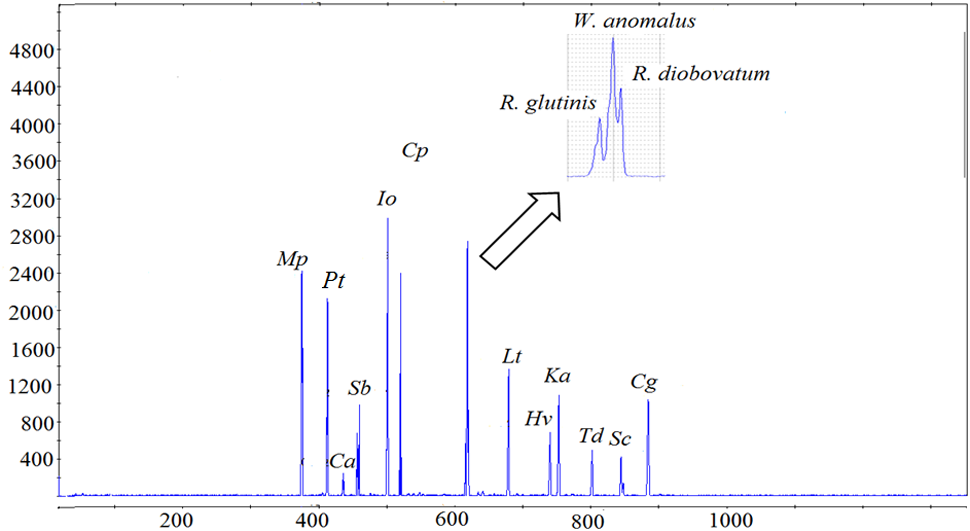
Electropherogram of a mixed culture of 18 yeast species, generated via PCR amplification with ITS1F-ITS4 primers. The x-axis represents the fragment size (bp) and the y-axis represents the relative fluorescence intensity. The following abbreviations were used for names of yeast species. Mp, Metschnikowia pulcherrima; Pt, Pichia terricola; Ca, Candida azyma; Sb, Starmerella bacillaris; Io, Issatchenkia orientalis; Cp, Candida parapsilosis; Lt, Lachancea thermotolerans; Hv, Hanseniaspora vineae; Ka, Kazachstania aerobia; Td, Torulaspora delbrueckii; Sc, Saccharomyces cerevisiae; Cg, Candida glabrata.
FIGURE 2
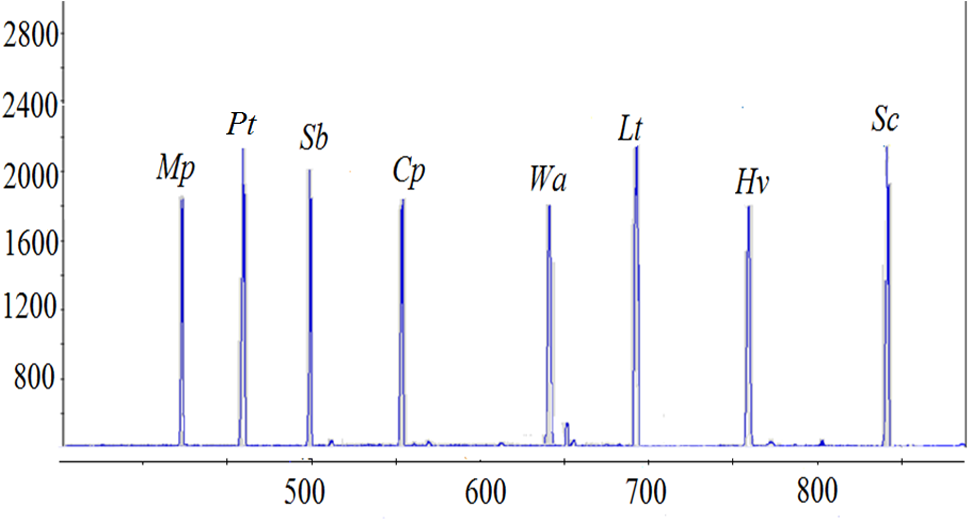
Quantitative validation between the ARISA peaks of eight selected yeast species and CFU/mL. All yeast species were inoculated at 105 CFU/mL. The x-axis represents the fragment size (bp) and the y-axis represents the relative fluorescence intensity.
Validation of ARISA in the Model Consortium
The detection limit of ARISA was investigated in different inoculation scenarios, representing low and high levels of selected yeast species (Table 2). The data indicated that when all species were inoculated at the same level, they could be detected even at 103 CFU/mL while, in a situation where one species was significantly higher in concentration (≥106 CFU/mL), other species could be detected if present at 104 CFU/mL but not at 103 CFU/mL (Supplementary Figure S1). Therefore, the detection limit of ARISA was defined as the lowest cell concentration (104 CFU/mL) that resulted in a positive signal and fluorescence intensity above 50 relative fluorescence units (RFU).
Table 2
| Yeast species | A | B | C |
|---|---|---|---|
| H. vineae | 103 | 104 | 103 |
| S. bacillaris | 103 | 104 | 103 |
| C. parapsilosis | 103 | 104 | 103 |
| P. terricola | 103 | 104 | 103 |
| L. thermotolerans | 103 | 106 | 103 |
| W. anomalus | 103 | 104 | 103 |
| M. pulcherrima | 103 | 104 | 103 |
| S. cerevisiae | 103 | 104 | 106 |
Yeast inoculum combinations used to determine ARISA detection limits.
To test the repeatability and reliability of ARISA for monitoring the yeast dynamics throughout the fermentation, three independent DNA extractions were performed from a sample in which the yeasts were mixed in different concentrations. In each case, similar peak profiles were observed for triplicates with minor variations in peak intensities (Supplementary Figure S2).
For better quantification of the individual yeast species, standard curves correlating colony forming units and peak areas were established. Strong linear correlation between CFU/mL and ARISA peak area, with an R2 value of ≈0.9 was observed, for individual yeast species (Figure 3). However, at lower biomass, the correlation between peak area and viable counts was non-linear.
FIGURE 3
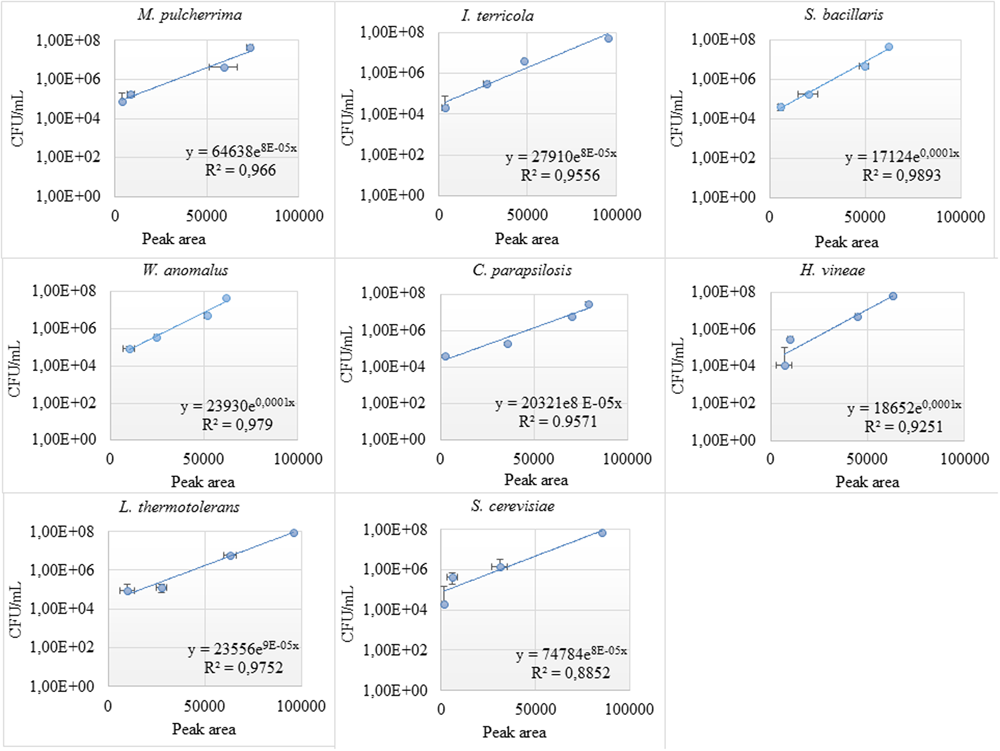
Standard curves of individual yeast species in the consortium. The correlation between the colony forming unit and peak area (bp) was investigated at different dilutions (103–107 CFU/mL) for individual yeast species in the consortium.
Fermentation in Synthetic Grape Juice
Fermentation and Growth Kinetics
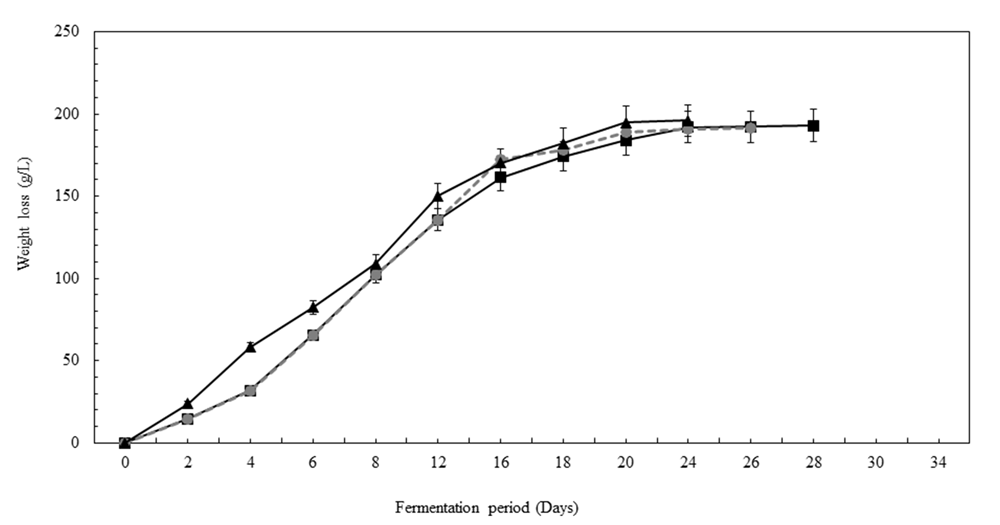
The applicability of the consortium and ARISA as a model was tested in the synthetic grape juice fermentation, inoculated with NS-Sc and NS only. The two sets of fermentations displayed distinct kinetics, with the NS-Sc fermentation reaching dryness (residual sugar < 2 g/L) within 21 days, while the fermentation with the NS consortium was sluggish and still had a total of 88 g/L residual sugar by day 30 (Figure 4). The NS fermentation got stuck at this level since the residual sugar was found to be the same after 40 days.
FIGURE 4
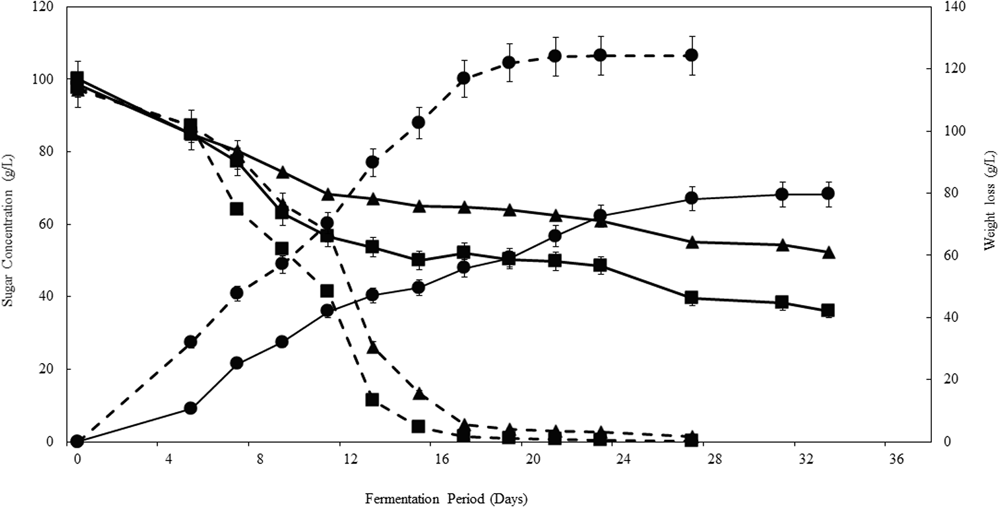
Progress curves showing the kinetics of fermentations performed in the synthetic must. Fermentation performed with NS-Sc consortium is indicated with broken lines while fermentation with NS consortium is indicated with solid lines. Glucose (■), fructose (▲) and CO2 release (●) were monitored throughout fermentation.
Yeast Population Dynamics in Synthetic Grape Juice
Comparison of ARISA and viable counts from the NS-Sc fermentation revealed similar trends in the relative abundance of the individual species in the early stage of fermentation (Figure 5). However, in the middle and final fermentation stages, ARISA consistently showed higher levels of S. cerevisiae and lower levels of H. vineae than direct plating (Supplementary Table S1). In addition, M. pulcherrima and P. terricola were detectable by ARISA until the end of fermentation while, they could not be observed and enumerated on agar plates.
FIGURE 5
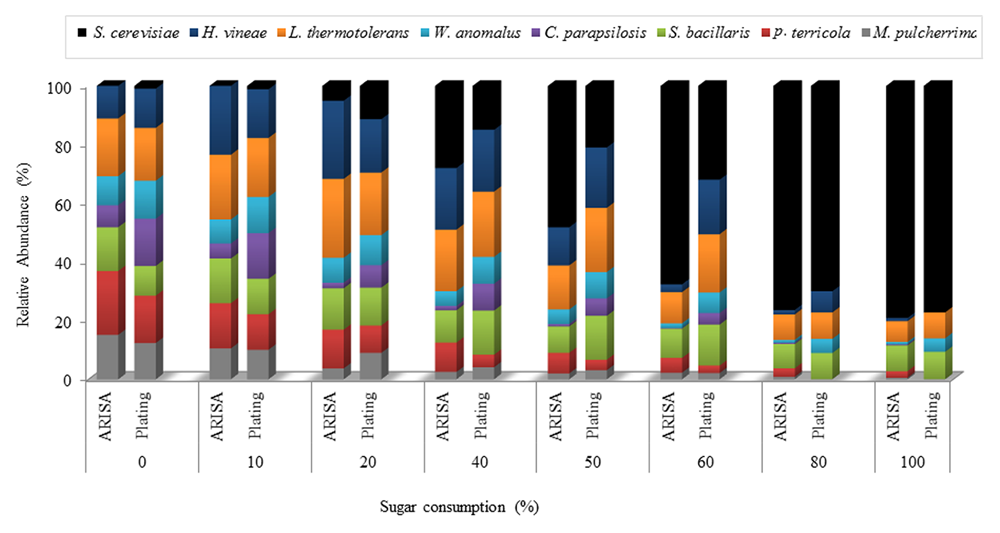
Relative abundance of yeast species throughout the NS-Sc fermentation in synthetic grape must. Yeast population dynamics were monitored using ARISA and plating methods.
Analysis of the yeast dynamics in the NS-Sc fermentation by standard plating on WLN agar revealed an initial increase in the population of non-Saccharomyces species until 10% of the sugar was consumed. The individual non-Saccharomyces species reached up to 107–108 CFU/mL and maintained viability at these levels for a brief period, before starting to decline. P. terricola and C. parapsilosis, dropped below detection by 50% sugar consumption, whereas M. pulcherrima and H. vineae were below detection after 70 and 90% sugar consumption, respectively (Figure 6). In contrast, the population of S. cerevisiae increased steadily from 103 CFU/mL to 4.37 × 10⁴ CFU/mL (20% sugar consumption) where the population of all non-Saccharomyces species declined to 106 CFU/mL. When S. cerevisiae reached to 6.47 × 10⁴, a decline in the population of W. anomalus (3.70 × 10⁵), P. terricola (3.10 × 10⁵) and M. pulccherrima (1.90 × 10⁵) was observed whereas, the population of C. parapsolosis, H. vineae, S. bacillaris, and L. thermotolerans remained at 106 CFU/mL. Finally, S. cerevisiae dominated the fermentation and reached to 7.19 × 10⁷ CFU/mL. L. thermotolerans (8.40 × 10⁴), S. bacillaris (8.03 × 10⁴), and W. anomalus (1.10 × 10⁴) remained viable until the end of fermentation.
FIGURE 6
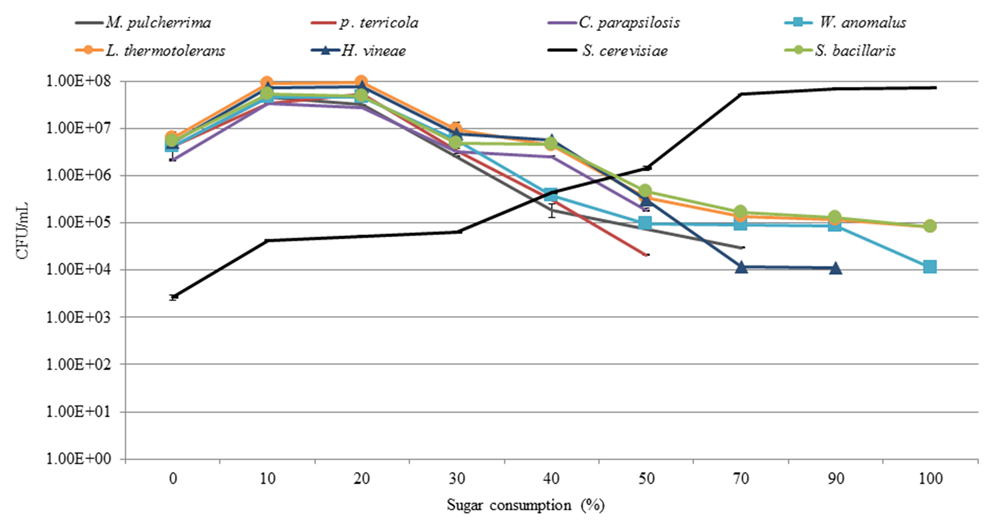
Growth profiles of yeast population throughout NS-Sc fermentation in the synthetic must.
In the NS fermentation, the levels of S. bacillaris, P. terricola, and L. thermotolerans increased moderately and maintained dominance until 40% of the sugar was consumed while, M. pulcherrima and C. parapsilosis declined steadily from the onset of fermentation. Using the standard curves constructed as described in the previous section, the population of S. bacillaris, P. terricola, and L. thermotolerans was estimated to be 1.48 × 10⁵, 5.33 × 10⁵, and 2.82 × 10⁵ CFU/mL, respectively, whereas the population of M. pulcherrima and C. parapsilosis was 1.22 × 10³ and 1.69 × 10³ CFU/mL. The population of H. vineae at 40% sugar consumption was estimated to be 2.07 × 10³ CFU/mL.
After 50% of the sugar was consumed, only four species (L. thermotolerans, S. bacillaris, P. terricola, and W. anomalus) were detected, with W. anomalus, accounting for 65% of the population. The population of L. thermotolerans, S. bacillaris, P. terricola, and W. anomalus based on the standard curves were 2.74 × 10⁵, 5.58 × 10⁴, 2.77 × 10⁴, and 7.23 × 10⁶ CFU/mL, respectively. The fermentation got stuck at 60% of sugar consumption and W. anomalus was the only detectable yeast at this stage (Figure 7). The level of W. anomalus based on the standard curve was estimated to be 9.67 × 10⁶ CFU/mL by 60% of sugar consumption in NS fermentation while S. cerevisiae reached up to 7.19 × 10⁷ CFU/mL by the end of the NS-Sc fermentation.
FIGURE 7
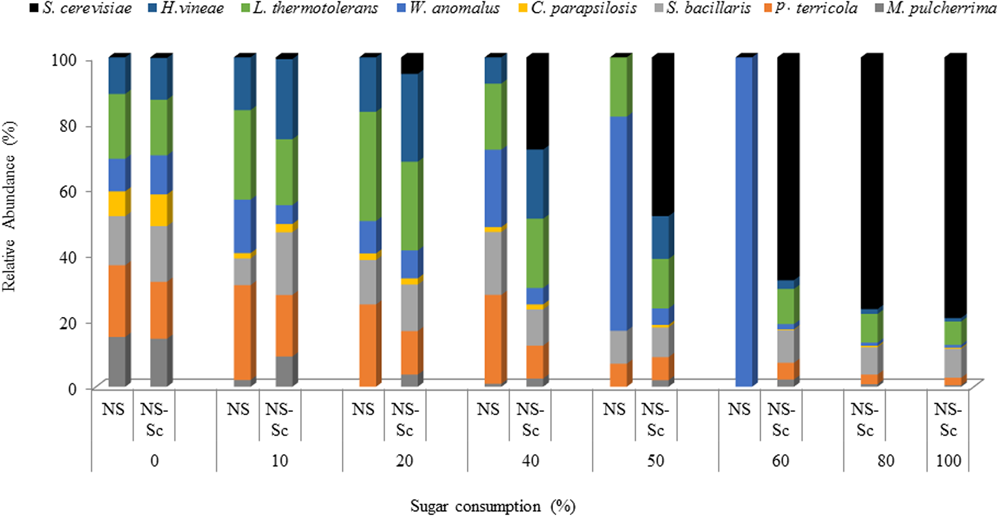
Relative abundance of yeast species during fermentations performed with NS-Sc and NS. Yeast population dynamics was monitored using ARISA.
Chemical Parameters and Yeast Diversity in Chenin Blanc Juice
The Chenin blanc juice used in the current study was at 21.7 °Brix with a total acidity of 3.23 g/L, pH 3.37 and a yeast assimilable nitrogen (YAN) of 195 mg/L. Sugar content and YAN concentration were higher in Chenin blanc juice compared to the synthetic must (Table 3). One hundred and eighty four yeast isolates obtained from the Chenin blanc juice were identified and revealed that the initial indigenous yeast population comprised M. pulcherrima (2.39 × 10³ CFU/mL), H. uvarum (4.21 × 10³ CFU/mL), L. thermotolerans (2.70 × 10³ CFU/mL), W. anomalus (3.34 × 10³ CFU/mL) and S. cerevisiae (4.85 × 10³ CFU/mL).
Table 3
| Chemical parameter | Chenin blanc juice | Synthetic grape juice |
|---|---|---|
| Sugar (°Brix) | 21.7 | 20 |
| YAN (mg/L) | 195 | 300 |
| pH | 3.37 | 3.5 |
Chemical parameters of Chenin blanc compared to the synthetic grape juice.
Chenin Blanc Fermentations
A comparison of the spontaneous fermentation, the Sc-inoculated, and the NS-Sc inoculated fermentations, revealed that the Sc fermentation was the fastest and reached dryness in 24 days, followed by the spontaneous fermentation at 26 days, while, NS-Sc fermentation took 28 days to reach dryness (Figure 8).
FIGURE 8
Progress curves displaying the kinetics of spontaneous fermentation (●), fermentation inoculated with Sc ( ), and fermentation inoculated with NS-Sc consortium (
 ).
).
The spontaneous fermentation of the juice was characterized by an initial increase in the yeast population from ≈103 CFU/mL to 6.27 × 10⁵ CFU/mL, by 10% sugar consumption. Subsequently, a decline in some non-Saccharomyces species was observed; amongst them, W. anomalus and M. pulcherrima declined rapidly and could not be detected by 30% sugar consumption, while H. uvarum persisted until 50% of the sugar was consumed. In contrast, L. thermotolerans increased in growth up to 2.3 × 10⁶ CFU/mL at 50% sugar consumption and persisted until the end of fermentation. The indigenous S. cerevisiae (IND-Sc) increased from ≈103CFU/mL to a maximum of 1.82 × 10⁸ CFU/mL (Figure 9A). Similar trends were observed in the Sc-inoculated fermentation. However, W. anomalus only grew up to 4 × 10⁴ CFU/mL and H. uvarum persisted until 40% sugar consumption (Figure 9B). In addition, L. thermotolerans only reached a maximum of 8 × 10⁵ CFU/mL. Within the S. cerevisiae population, IND-Sc and EC1118 displayed similar growth patterns. However, IND-Sc persisted at a higher level, reaching a maximum of 2.1 × 10⁸ CFU/mL, while EC1118 reached 4.5 × 10⁷ CFU/mL (Figure 9B). When the NS-Sc consortium was inoculated, H. uvarum (the only indigenous non-Saccharomyces yeast that was not part of the consortium), grew from 4.4 × 10³ to 6.20 × 10⁴ CFU/mL by 10% sugar consumption followed by a steady decline until it could not be detected by 50% sugar consumption (Figure 9C). Amongst the remainder of the non-Saccharomyces yeasts which were inoculated at ≈106 CFU/mL, P. terricola and C. parapsilosis declined below detection after 10% sugar consumption, followed by M. pulcherrima and W. anomalus by 28% sugar consumption. In contrast, H. vineae declined gradually until 78% sugar consumption; S. bacillaris persisted at 106 CFU/mL until 78% sugar consumption before dropping to 8 × 10⁴ CFU/mL at the end of fermentation, while, L. thermotolerans persisted at 106 CFU/mL until the end of fermentation. The S. cerevisiae population behaved in a similar way as observed in the S. cerevisiae inoculated fermentation, albeit at 10 times less cell concentrations. For instance, IND-Sc reached a maximum of 3.2 × 10⁷ CFU/mL, while EC1118 reached 6.9 × 10⁶ CFU/mL.
FIGURE 9
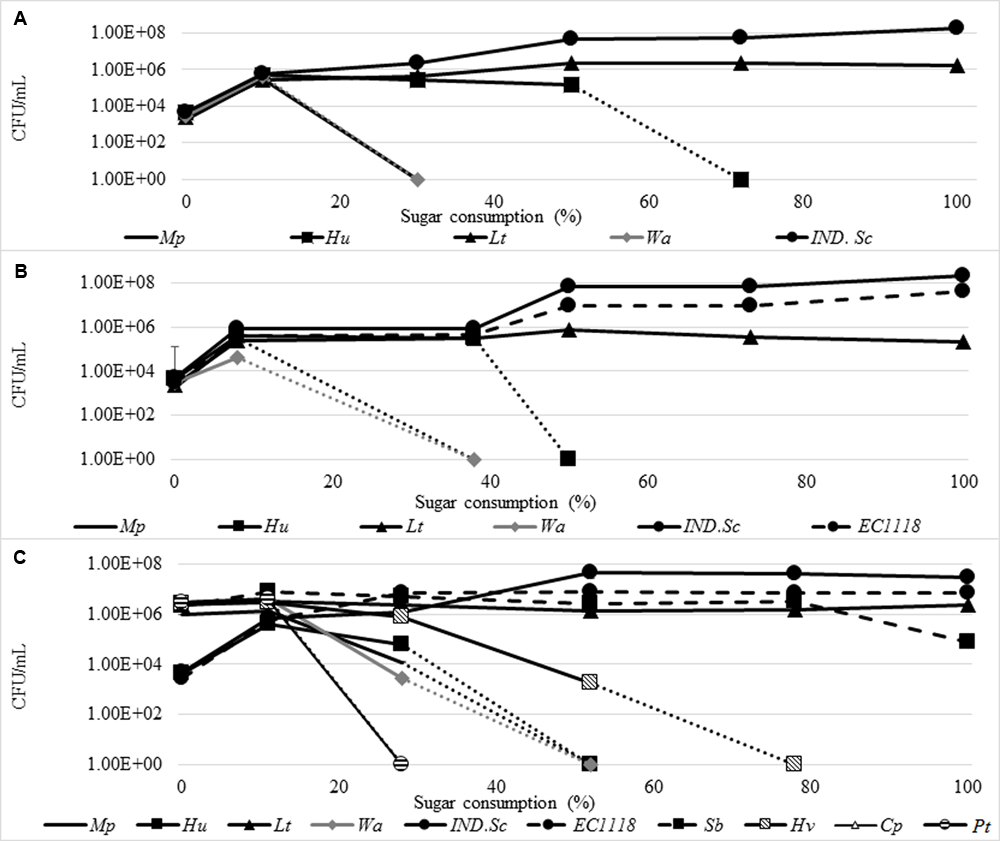
Yeast population dynamics in Chenin blanc spontaneous fermentation (A), S. cerevisiae inoculated fermentation (B) and NS-Sc consortium fermentation (C). The following abbreviations were used for names of yeast species. Mp, M. pulcherrima; It, P. terricola; Sb, S. bacillaris; Cp, C. parapsilosis; Lt, L. thermotolerans; Hv, H. vineae; Hu, H. uvarum; IND.Sc, Indigenous S. cerevisiae.
Discussion
The current study aimed to establish and validate a model system for reliable monitoring and prediction of the temporal trajectories of yeast populations within the wine fermentation ecosystem. To this end, a yeast consortium comprising S. cerevisiae and seven non-Saccharomyces yeast species of varying fermentative capacities was constructed. These yeast species are all regularly encountered in SA grape juices, and some species have sometimes been detected in significant numbers. Furthermore, all of these non-Saccharomyces species have been isolated in countries with several wine producing regions such as Italy, France, Argentina, China, and Brazil (Jolly et al., 2003a; Combina et al., 2005; Di Maro et al., 2007; Lopandic et al., 2008; Romancino et al., 2008; Salinas et al., 2009; Sun et al., 2009; Suzzi et al., 2012; Tofalo et al., 2012; Weightman, 2014; Maturano et al., 2015; Morgan, 2016). These yeast species also differed in their ITS1-5.8S rRNA-ITS2 gene sizes, which made ARISA a suitable method to monitor their dynamics. Our data show that in this semi-complex consortium, the detection limit of ARISA could be as low as 103 CFU/mL when all species are present at low levels. However, at lower biomass (103-4 CFU/mL) larger deviations were observed, possibly due to the bias introduced by DNA extraction or preferential amplification in PCR (Giraffa, 2004; Ramette, 2009). Furthermore, in a typical wine fermentation scenario where dominant taxa grow up to 107-8 CFU/mL, minor taxa would not be detected below 104 CFU/mL. ARISA is also unable to differentiate between strains of the same species, limiting its ability to monitor strain-specific dynamics. However, species-specific interactions of significantly contributing species can be easily detected and quantified (Ramette, 2009; Ženišová et al., 2014; Ghosh et al., 2015; Setati et al., 2015). The limits are similar to those obtained for FISH (Xufre et al., 2006) and PCR-DGGE (Prakitchaiwattana et al., 2004) and they are less sensitive than qPCR (102 CFU/mL) and flow cytometry (103 CFU/mL) methods (Malacrinò et al., 2001; Hierro et al., 2006a,b; Zott et al., 2010). However, ARISA does not require species-specific primers and is less technically demanding than qPCR and flow cytometry. Overall, ARISA generated similar growth patterns for individual yeast species in the consortium as observed with viable counts. However, some discrepancies were observed in the middle and final stage of fermentation. These discrepancies might reflect biases and limitation in both methods. For instance, plating method might show bias against cells in a VBNC state and injured population (Divol and Lonvaud-Funel, 2005; Renouf et al., 2007) while ARISA is unable to differentiate between live and dead cells (Xie et al., 2007; O’Sullivan et al., 2013). Consequently, an overestimation of most of the species (e.g., M. pulcherrima, P. terricola, H. vineae, L. thermotolerans, S. bacillaris, and S. cerevisiae) by one order of magnitude was evident with ARISA compared to the plating method. The data in the current study suggest that up to 3% of dead cells could possibly be detected by ARISA. Similarly, Salinas et al., (2009) indicated that qPCR overestimate the number of live cells in average one order higher compared to microscopy analysis, which according to Hierro et al. (2006a) could represent up to 1% of the dead cells.
Our study showed that the yeast species constituting the consortium responded differently to the wine fermentation ecosystem, and the behavior of the non-Saccharomyces species was differentially influenced by the presence of S. cerevisiae. The data showed that in the absence of S. cerevisiae, some non-Saccharomyces species such as M. pulcherrima and C. parapsilosis experienced a decline from the onset of fermentation whereas, species such as S. bacillaris, P. terricola, and L. thermotolerans experienced a moderate increase followed by a steady decline in the absolute numbers by the middle of fermentation. On the contrary, W. anomalus suppressed the rest of non-Saccharomyces species and increased in cell concentration back to the initial inoculum level. This suggests that W. anomalus can withstand the chemical milieu created in the early stages of the fermentation better than the other yeast species and may utilize the nitrogen released by dead cells. In contrast, in the presence of S. cerevisiae, specifically, this yeast declines early in fermentation, suggesting that S. cerevisiae creates an unconducive environment, which suppresses W. anomalus. Indeed, an antagonistic interaction between S. cerevisiae and W. anomalus, has been proposed in other fermentation ecosystems (Ye et al., 2014). S. cerevisiae may inhibit other organisms through a variety of mechanisms including the production of short chain fatty acids and glycoproteins (killer toxin), and the specific antagonism exerted by S. cerevisiae modulates the ecosystem (Vannette and Fukami, 2014; Boynton and Greig, 2016). Conversely, other yeast species such as M. pulcherrima, P. terricola, and C. parapsilosis consistently declined in the early stages of the fermentation, both in the presence and in the absence of S. cerevisiae, suggesting that the decline could be due to another factor such as oxygen limitation. Several studies have shown that the growth and survival rate of M. pulcherrima and C. parapsilosis was markedly enhanced in aerated fermentations (Oh et al., 1998; Rossignol et al., 2009; Morales et al., 2015; Shekhawat et al., 2017). Furthermore, in the presence of S. cerevisiae, L. thermotolerans, and S. bacillaris could survive until late fermentation. The survival of L. thermotolerans until end of the fermentation has been shown previously (Gobbi et al., 2013). In addition, S. bacillaris strains are typically fructophilic and therefore preferentially utilize fructose, which is less preferred by S. cerevisiae. Interestingly, our study revealed that H. vineae survives better in the presence S. cerevisiae suggesting a positive interaction between the two yeasts. Such an interaction is perhaps not coincidental since other studies have shown that in nutrient-rich conditions, co-fermentations using strains of these two species often reflect a significant contribution of H. vineae to wine aroma and flavor (Viana et al., 2011; Medina et al., 2013).
Based on our current findings, we can infer that the mutualism (S. cerevisiae and H. vineae) and antagonism (S. cerevisiae and W. anomalus) observed in the wine ecosystem, could be a species-specific interaction that occurs as a result of the presence of S. cerevisiae. However, the strength of the mutualism or antagonism in the wine consortium may vary between different strains of one species requires further investigation. Indeed, species-specific patterns throughout the wine fermentation process are probable and comprehensible. For instance, it is well established that some species decline rapidly by early or mid-fermentation (Cryptococcus carnescens, Aureobasidium pullulans, P. terricola, and M. pulcherrima), others repeatedly persist until late fermentation (S. bacillaris, L. thermotolerans, T. delbrueckii) regardless of the strain variability (Jemec et al., 2001; Sun et al., 2009; Cordero-Bueso et al., 2011; Bezerra-Bussoli et al., 2013; Gobbi et al., 2013; Milanović et al., 2013; Bagheri et al., 2015).
One of the goals of the current study was to establish a consortium that would serve as a representative model to predict yeast dynamics in wine fermentation. In order to validate the suitability of this consortium, it was used as an inoculum in Chenin blanc must and the dynamics was monitored throughout the fermentation. Interestingly, four of the yeast species (M. pulcherrima, L. thermotolerans, W. anomalus, and S. cerevisiae) which form part of the consortium were also present in the natural yeast community of the Chenin blanc must, confirming once more the representative nature of our consortium. Our study shows that all the species in the consortium could compete with the native yeast species in a non-sterilized must. While we were unable to differentiate between the indigenous strains and inoculated strains (e.g., W. anomalus), the population dynamics observed were similar to those described for the synthetic grape juice, suggesting species, and not strain specific drivers of interactions. This is further supported by the fact that the dynamics were preserved although the environmental conditions, including nitrogen and sugar levels, differed consoderably between the two matrices (Supplementary Table S2). We also observed that the indigenous S. cerevisiae population displayed better growth than the EC1118 inoculated strain although they were at similar levels at the beginning of the fermentation, further indicating that the selective drivers were species and not strain-dependent. Our data show that the consortium constructed in the current study serves as a viable and robust model to assess yeast population dynamics during wine fermentation since the matrix did not have a considerable influence on the dynamics as such. We suggest that the yeast dynamics observed in the current study is mainly due to species-specific interactions and the selective pressure applied by S. cerevisiae to other species. Our data suggest that inoculation with S. cerevisiae favors the persistence of some non-Saccharomyces species in wine fermentation whereas; it clearly suppresses the growth and contribution of other non-Saccharomyces species.
The dynamics of the wine ecosystem is driven by a multitude of positive and negative yeast–yeast interactions. The main challenge in microbial ecology is to link microbial composition to function. Here, we demonstrate that a model consortium approach can be used as a tool to predict the microbial behavior in a complex natural environment. Such a model consortium can be easily perturbed under well-controlled conditions in order to gain a deep understanding of the effect of environmental parameters on yeast–yeast interactions. In-depth insight on yeast–yeast interactions may allow us to manipulate the microbial community and enhance the population of the beneficial microbes or suppress the population of undesirable yeast species. The study presents a first step in the development of a model to predict the oenological potential of any given wine mycobiome.
Statements
Author contributions
FB and MS conceptualized the study. BB, FB, and MS designed the experimental layout. BB performed the experiments, analyzed the data and wrote the first draft of the manuscript. BB, FB, and MS edited subsequent drafts, read and approved the final manuscript.
Funding
This work was funded by the National Research Foundation (NRF) [grant number 101998] and The Wine Industry Network for Expertise and Technology (Winetech) SU IWBT 16/02. Opinions expressed and conclusions arrived at are those of the authors and are not necessarily to be attributed to the funding agencies.
Conflict of interest
The authors declare that the research was conducted in the absence of any commercial or financial relationships that could be construed as a potential conflict of interest.
Supplementary material
The Supplementary Material for this article can be found online at: https://www.frontiersin.org/articles/10.3389/fmicb.2017.01988/full#supplementary-material
References
1
Albergaria H. Arneborg N. (2016). Dominance of Saccharomyces cerevisiae in alcoholic fermentation processes: role of physiological fitness and microbial interactions.Appl. Microbiol. Biotechnol.1002035–2046. 10.1007/s00253-015-7255-0
2
Andorrà I. Berradre M. Rozès N. Mas A. Guillamón J. M. Esteve-Zarzoso B. (2010a). Effect of pure and mixed cultures of the main wine yeast species on grape must fermentations.Eur. Food Res. Technol.231215–224. 10.1007/s00217-010-1272-0
3
Andorrà I. Esteve-Zarzoso B. Guillamón J. M. Mas A. (2010b). Determination of viable wine yeast using DNA binding dyes and quantitative PCR.Int. J. Food Microbiol.144257–262. 10.1016/j.ijfoodmicro.2010.10.003
4
Andorra I. Monteiro M. Esteve-Zarzoso B. Albergaria H. Mas A. (2011). Analysis and direct quantification of Saccharomyces cerevisiae and Hanseniaspora guilliermondii populations during alcoholic fermentation by fluorescence in situ hybridization, flow cytometry and quantitative PCR.Food Microbiol.281483–1491. 10.1016/j.fm.2011.08.009
5
Bagheri B. Bauer F. F. Setati M. E. (2015). The diversity and dynamics of indigenous yeast communities in grape must from vineyards employing different agronomic practices and their influence on wine fermentation.S. Afr. J. Enol. Vitic.36243–251.
6
Bely M. Sablayrolles J. M. Barre P. (1990). Automatic detection of assimilable nitrogen deficiencies during alcoholic fermentation in oenological conditions.J. Ferment. Bioeng.70246–252. 10.1016/0922-338X(90)90057-4
7
Bezerra-Bussoli C. Baffi M. A. Gomes E. Da-Silva R. (2013). Yeast diversity isolated from grape musts during spontaneous fermentation from a Brazilian Winery.Curr. Microbiol.67356–361. 10.1007/s00284-013-0375-9
8
Boynton J. P. Greig D. (2016). Species richness influences wine ecosystem function through a dominant species.Fungal Ecol.2261–72. 10.1016/j.dib.2016.05.038
9
Branco P. Francisco D. Chambon C. Hébraud M. Arneborg N. Almeida M. G. et al (2014). Identification of novel GAPDH-derived antimicrobial peptides secreted by Saccharomyces cerevisiae and involved in wine microbial interactions.Appl. Microbiol. Biotechnol.98843–853. 10.1007/s00253-013-5411-y
10
Branco P. Viana T. Albergaria H. Arneborg N. (2015). Antimicrobial peptides (AMPs) produced by Saccharomyces cerevisiae induce alterations in the intracellular pH, membrane permeability and culturability of Hanseniaspora guilliermondii cells.Int. J. Food Microbiol.205112–118. 10.1016/j.ijfoodmicro.2015.04.015
11
Brežná B. Ženišová K. Chovanová K. Chebeòová V. Kraková L. Kuchta T. et al (2010). Evaluation of fungal and yeast diversity in Slovakian wine-related microbial communities.Antonie Van Leeuwenhoek98519–529. 10.1007/s10482-010-9469-6
12
Cangelosi G. A. Meschke J. S. (2014). Dead or alive: molecular assessment of microbial viability.Appl. Environ. Microbiol.805884–5891. 10.1128/AEM.01763-14
13
Ciani M. Capece A. Comitini F. Canonico L. Siesto G. Romano P. (2016). Yeast interactions in inoculated wine fermentation.Front. Microbiol.7:555. 10.3389/fmicb.2016.00555
14
Ciani M. Comitini F. (2015). Yeast interactions in multi-starter wine fermentation.Curr. Opin. Food Sci.11–6. 10.1016/j.cofs.2014.07.001
15
Combina M. Elía A. Mercado L. Catania C. Ganga A. Martinez C. (2005). Dynamics of indigenous yeast populations during spontaneous fermentation of wines from Mendoza, Argentina.Int. J. Food Microbiol.99237–243. 10.1016/j.ijfoodmicro.2004.08.017
16
Cordero-Bueso G. Arroyo T. Serrano A. Tello J. Aporta I. Vélez M. D. et al (2011). Influence of the farming system and vine variety on yeast communities associated with grape-berries.Int. J. Food Microbiol.145132–139. 10.1016/j.ijfoodmicro.2010.11.040
17
De Roy K. Marzorati M. Van den Abbeele P. Van de Wiele T. Boon N. (2014). Synthetic microbial ecosystems: an exciting tool to understand and apply microbial communities.Environ. Microbiol.161472–1481. 10.1111/1462-2920.12343
18
Deere D. Jian S. Vesey G. Bell P. Bissinger P. Veal D. (1998). Flow cytometry and cell sorting for yeast viability assessment and cell selection.Yeast14147–160. 10.1002/(SICI)1097-0061(19980130)14
19
Di Maro E. Ercolini D. Coppola S. (2007). Yeast dynamics during spontaneous wine fermentation of the Catalanesca grape.Int. J. Food Microbiol.117201–210. 10.1016/j.ijfoodmicro.2007.04.007
20
Divol B. Lonvaud-Funel A. (2005). Evidence for viable but non-culturable yeasts in botrytis-affected wine.J. Appl. Microbiol.9985–93. 10.1111/j.1365-2672.2005.02578.x
21
Englezos V. Rantsiou K. Torchio F. Rolle L. Gerbi V. Cocolin L. (2015). Exploitation of the non-Saccharomyces yeast Starmerella bacillaris (synonym Candida zemplinina) in wine fermentation: physiological and molecular characterizations.Int. J. Food Microbiol.19933–40. 10.1016/j.ijfoodmicro.2015.01.009
22
Ghosh S. Bagheri B. Morgan H. H. Divol B. Setati M. E. (2015). Assessment of wine microbial diversity using ARISA and cultivation-based methods.Ann. Microbiol.651833–1840. 10.1007/s13213-014-1021-x
23
Giraffa G. (2004). Studying the dynamics of microbial populations during food fermentation.FEMS Microbiol. Rev.28251–260. 10.1016/j.femsre.2003.10.005
24
Gobbi M. Comitini F. Domizio P. Romani C. Lencioni L. Mannazzu I. et al (2013). Lachancea thermotolerans and Saccharomyces cerevisiae in simultaneous and sequential co-fermentation: a strategy to enhance acidity and improve the overall quality of wine.Food Microbiol.33271–281. 10.1016/j.fm.2012.10.004
25
Grube M. Berg G. (2009). Microbial consortia of bacteria and fungi with focus on the lichen symbiosis.Fungal Biol. Rev.2372–85. 10.1016/j.fbr.2009.10.001
26
Henschke P. A. Jiranek V. (1993). “Yeasts metabolism of nitrogen compounds,” inWine Microbiology and Biotechnologyed.FleetG. H. (Chur: Harwood Academic) 77–164.
27
Hierro N. Esteve-Zarzoso B. González Á. Mas A. Guillamón J. M. (2006a). Real-time quantitative PCR (QPCR) and reverse transcription-QPCR for detection and enumeration of total yeasts in wine.Appl. Environ. Microbiol.727148–7155. 10.1128/AEM.00388-06
28
Hierro N. González Á Mas A. Guillamón J. M. (2006b). Diversity and evolution of non-Saccharomyces yeast populations during wine fermentation: effect of grape ripeness and cold maceration.FEMS Yeast Res.6102–111. 10.1111/j.1567-1364.2005.00014.x
29
Izquierdo Cañas P. M. Esteban C. Romero G. Heras J. M. Mónica M. González F. (2014). Influence of sequential inoculation of Wickerhamomyces anomalus and Saccharomyces cerevisiae in the quality of red wines.Eur. Food Res. Technol.239279–286. 10.1007/s00217-014-2220-1
30
Jagmann N. Philipp B. (2014). Design of synthetic microbial communities for biotechnological production processes.J. Biotechnol.184209–218. 10.1016/j.jbiotec.2014.05.019
31
Jemec K. P. Cadez N. Zagorc T. Bubic V. Zupec A. Raspor P. (2001). Yeast population dynamics in five spontaneous fermentations of Malvasia must.Food Microbiol.18247–259. 10.1006/fmic.2001.0396
32
Jiang L.-L. Zhou J.-J. Quan C.-S. Xiu Z.-L. (2017). Advances in industrial microbiome based on microbial consortium for biorefinery.Bioresour. Bioprocess.411. 10.1186/s40643-017-0141-0
33
Jolly N. P. Augustyn O. P. H. Pretorius I. S. (2003a). The occurrence of non-Saccharomyces cerevisiae yeast species over three vintages in four vineyards and grape musts from four production regions of the Western Cape, South Africa.S. Afr. J. Enol. Vitic.2463–69.
34
Jolly N. P. Augustyn O. P. H. Pretorius I. S. (2003b). The effect of Non-Saccharomyces yeasts on fermentation and wine quality.S. Afr. J. Enol. Vitic.2455–62.
35
Kemsawad V. Branco P. Almeida M. G. Caldeira J. Albergaria H. Arneborg N. (2015). Cell-to-cell contact and antimicrobial peptides play a combined role in the death of Lachancea thermotolerans during mixed-culture alcoholic fermentation with Saccharomyces cerevisiae.FEMS Microbiol. Lett.3621–8. 10.1093/femsle/fnv103
36
Kraková L. Chovanová K. Selim S. A. Šimonovičová A. Puškarová A. Maková A. et al (2012). A multiphasic approach for investigation of the microbial diversity and its biodegradative abilities in historical paper and parchment documents.Int. Biodeterior. Biodegrad.70117–125. 10.1016/j.ibiod.2012.01.011
37
Lencioni L. Romani C. Gobbi M. Comitini F. Ciani M. Domizio P. (2016). Controlled mixed fermentation at winery scale using Zygotorulaspora florentina and Saccharomyces cerevisiae.Int. J. Food Microbiol.23436–44. 10.1016/j.ijfoodmicro.2016.06.004
38
Lopandic K. Tiefenbrunner W. Gangl H. Mandl K. Berger S. Leitner G. et al (2008). Molecular profiling of yeasts isolated during spontaneous fermentations of Austrian wines.FEMS Yeast Res.81063–1075. 10.1111/j.1567-1364.2008.00385.x
39
Malacrinò P. Zapparoli G. Torriani S. Dellaglio F. (2001). Rapid detection of viable yeasts and bacteria in wine by flow cytometry.J. Microbiol. Methods45127–134. 10.1016/S0167-7012(01)00243-3
40
Maturano Y. P. Mestre M. V. Esteve-Zarzoso B. Nally M. C. Lerena M. C. Toro M. E. et al (2015). Yeast population dynamics during pre-fermentative cold soak of Cabernet Sauvignon and Malbec wines.Int. J. Food Microbiol.19923–32. 10.1016/j.ijfoodmicro.2015.01.005
41
Medina K. Boido E. Fariña L. Gioia O. Gomez M. E. Barquet M. et al (2013). Increased flavour diversity of Chardonnay wines by spontaneous fermentation and co-fermentation with Hanseniaspora vineae.Food Chem.1412513–2521. 10.1016/j.foodchem.2013.04.056
42
Mendoza L. M. De Nadra M. C. M. Bru E. Farıas M. E. (2009). Influence of wine-related physicochemical factors on the growth and metabolism of non-Saccharomyces and Saccharomyces yeasts in mixed culture.J. Ind. Microbiol. Biotechnol.36229–237. 10.1007/s10295-008-0489-4
43
Milanović V. Comitini F. Ciani M. (2013). Grape berry yeast communities: Influence of fungicide treatments.Int. J. Food Microbiol.161240–246. 10.1016/j.ijfoodmicro.2012.12.019
44
Morales P. Rojas V. Quirós M. Gonzalez R. (2015). The impact of oxygen on the final alcohol content of wine fermented by a mixed starter culture.Appl. Microbiol. Biotechnol.993993–4003. 10.1007/s00253-014-6321-3
45
Morgan H. H. (2016). Investigating the Effect of Leaf Removal on the Grape-Associated Microbiome Through Culture-Dependent and Independent Approaches.Master’s thesis, Stellenbosch UniversityStellenbosch.
46
Nissen P. Arneborg N. (2003). Characterization of early deaths of non-Saccharomyces yeasts in mixed cultures with Saccharomyces cerevisiae.Arch. Microbiol.180257–263. 10.1007/s00203-003-0585-9
47
Oh D. Kim S. Kim J. (1998). Increase of xylitol production rate by controlling redox potential in Candida parapsilosis.Biotechnol. Bioeng.58440–444. 10.1002/(SICI)1097-0290(19980520)58:4<440::AID-BIT11>3.0.CO;2-F
48
O’Sullivan D. J. Giblin L. McSweeney P. L. H. Sheehan J. J. Cotter P. D. (2013). Nucleic acid-based approaches to investigate microbial-related cheese quality defects.Front. Microbiol.4:1. 10.3389/fmicb.2013.00001
49
Pérez-Torrado R. Rantsiou K. Perrone B. Navarro-Tapia E. Querol A. Cocolin L. (2017). Ecological interactions among Saccharomyces cerevisiae strains: insight into the dominance phenomenon.Sci. Rep.7:43603. 10.1038/srep43603
50
Pina C. Couto J. A. António J. Hogg T. (2004). Inferring ethanol tolerance of Saccharomyces and non-Saccharomyces yeasts by progressive inactivation.Biotechnol. Lett.261521–1527. 10.1023/B:BILE.0000044456.72347.9f
51
Ponomarova O. Patil K. R. (2015). Metabolic interactions in microbial communities: untangling the Gordian knot.Curr. Opin. Microbiol.2737–44. 10.1016/j.mib.2015.06.014
52
Portillo M. del C. Mas A. (2016). Analysis of microbial diversity and dynamics during wine fermentation of Grenache grape variety by high-throughput barcoding sequencing.LWT Food Sci. Technol.72317–321. 10.1016/j.lwt.2016.05.009
53
Prakitchaiwattana C. J. Fleet G. H. Heard G. M. (2004). Application and evaluation of denaturing gradient gel electrophoresis to analyse the yeast ecology of wine grapes.FEMS Yeast Res.4865–877. 10.1016/j.femsyr.2004.05.004
54
Pretorius I. S. Van der Westhuizen T. J. J. Augustyn O. P. H. (1999). Yeast Biodiversity in Vineyards and Wineries and its importance to the South African wine industry-a review.S. Afr. J. Enol. Vitic.2061–75.
55
Ramette A. (2009). Quantitative community fingerprinting methods for estimating the abundance of operational taxonomic units in natural microbial communities.Appl. Environ. Microbiol.752495–2505. 10.1128/AEM.02409-08
56
Renault P. E. Albertin W. Bely M. (2013). An innovative tool reveals interaction mechanisms among yeast populations under oenological conditions.Appl. Microbiol. Biotechnol.974105–4119. 10.1007/s00253-012-4660-5
57
Renouf V. Claisse O. Lonvaud-Funel A. (2007). Inventory and monitoring of wine microbial consortia.Appl. Microbiol. Biotechnol.75149–164. 10.1007/s00253-006-0798-3
58
Romancino D. P. Di Maio S. Muriella R. Oliva D. (2008). Analysis of non-Saccharomyces yeast populations isolated from grape musts from Sicily (Italy).J. Appl. Microbiol.1052248–2254. 10.1111/j.1365-2672.2008.03894.x
59
Rossignol T. Kobi D. Jacquet-Gutfreund L. Blondin B. (2009). The proteome of a wine yeast strain during fermentation, correlation with the transcriptome.J. Appl. Microbiol.10747–55. 10.1111/j.1365-2672.2009.04156.x
60
Sadoudi M. Tourdot-Maréchal R. Rousseaux S. Steyer D. Gallardo-Chacón J. J. Ballester J. et al (2012). Yeast-yeast interactions revealed by aromatic profile analysis of Sauvignon Blanc wine fermented by single or co-culture of non-Saccharomyces and Saccharomyces yeasts.Food Microbiol.32243–253. 10.1016/j.fm.2012.06.006
61
Sainz J. Pizarro F. Perez- Correa J. R. Agosin E. (2003). Modeling of yeast metabolism and process dynamics in batch fermentation.Biotechnol. Bioeng.81818–828. 10.1002/bit.10535
62
Salinas F. Garrido D. Ganga A. Veliz G. Martínez C. (2009). TaqMan real-time PCR for the detection and enumeration of Saccharomyces cerevisiae in wine.Food Microbiol.26328–332. 10.1016/j.fm.2008.12.001
63
Sambrook J. Russell D. W. (2006). Rapid Isolation of Yeast DNA.Cold Spring Harbor, NY: Cold Spring Harbor Laboratory.
64
Setati M. E. Jacobson D. Bauer F. F. (2015). Sequence-based analysis of the Vitis vinifera L. cv Cabernet sauvignon grape must mycobiome in three South African vineyards employing distinct agronomic systems.Front. Microbiol.6:1358. 10.3389/fmicb.2015.01358
65
Shekhawat K. Bauer F. F. Setati M. E. (2017). Impact of oxygenation on the performance of three non-Saccharomyces yeasts in co-fermentation with Saccharomyces cerevisiae.Appl. Microbiol. Biotechnol.1012479–2491. 10.1007/s00253-016-8001-y
66
Slabbert E. Van Heerden C. J. Jacobs K. (2010). Optimisation of automated ribosomal intergenic spacer analysis for the estimation of microbial diversity in fynbos soil.S. Afr. J. Sci.1061–4. 10.4102/sajs.v106i7/8.329
67
Sun H. Ma H. Hao M. Pretorius I. S. Chen S. (2009). Identification of yeast population dynamics of spontaneous fermentation in Beijing wine region, China.Ann. Microbiol.5969–76. 10.1007/BF03175601
68
Suzzi G. Schirone M. Sergi M. Marianella R. M. Fasoli G. Aguzzi I. et al (2012). Multistarter from organic viticulture for red wine Montepulciano d’Abruzzo production.Front. Microbiol.3:135. 10.3389/fmicb.2012.00135
69
Tofalo R. Schirone M. Torriani S. Rantsiou K. Cocolin L. Perpetuini G. et al (2012). Diversity of Candida zemplinina strains from grapes and Italian wines.Food Microbiol.2918–26. 10.1016/j.fm.2011.08.014
70
Tristezza M. Tufariello M. Capozzi V. Spano G. Mita G. Grieco F. (2016). The oenological potential of Hanseniaspora uvarum in simultaneous and sequential co-fermentation with Saccharomyces cerevisiae for industrial wine production.Front. Microbiol.7:670. 10.3389/fmicb.2016.00670
71
Vannette L. R. Fukami T. (2014). Historical contingency in species interactions: towards niche-based predictions.Ecol. Lett.17115–124. 10.1111/ele.1220
72
Viana F. Belloch C. Vallés S. Manzanares P. (2011). Monitoring a mixed starter of Hanseniaspora vineae-Saccharomyces cerevisiae in natural must: impact on 2-phenylethyl acetate production.Int. J. Food Microbiol.151235–240. 10.1016/j.ijfoodmicro.2011.09.005
73
Wang C. Esteve-Zarzoso B. Cocolin L. Mas A. Rantsiou K. (2015). Viable and culturable populations of Saccharomyces cerevisiae, Hanseniaspora uvarum and Starmerella bacillaris (synonym Candida zemplinina) during Barbera must fermentation.Food Res. Int.78195–200. 10.1016/j.foodres.2015.10.014
74
Wang C. Esteve-Zarzoso B. Mas A. (2014). Monitoring of Saccharomyces cerevisiae, Hanseniaspora uvarum, and Starmerella bacillaris (synonym Candida zemplinina) populations during alcoholic fermentation by fluorescence in situ hybridization.Int. J. Food Microbiol.1911–9. 10.1016/j.ijfoodmicro.2014.08.014
75
Wang C. Mas A. Esteve-Zarzoso B. (2016). The interaction between Saccharomyces cerevisiae and non-Saccharomyces yeast during alcoholic fermentation is species and strain specific.Front. Microbiol.7:502. 10.3389/fmicb.2016.00502
76
Weightman C. J. (2014). Characterization of Chenin Blanc Wines Produced by Natural Fermentation and Skin Contact?: Focus on the Application of Rapid Sensory Profiling Method.Master’s thesis, Stellenbosch UniversityStellenbosch.
77
Williams K. M. Liu P. Fay J. C. (2015). Evolution of ecological dominance of yeast species in high-sugar environments.Evolution (N. Y).692079–2093. 10.1111/evo.12707
78
Xie G. Li W. Lu J. Cao Y. Fang H. Zou H. et al (2007). Isolation and Identification of representative fungi from Shaoxing rice wine wheat Qu using a polyphasic approach of Culture-based and molecular-based methods.J. Inst. Brew.113272–279. 10.1002/j.2050-0416.2007.tb00287.x
79
Xufre A. Albergaria H. Inácio J. Spencer-Martins I. Gírio F. (2006). Application of fluorescence in situ hybridisation (FISH) to the analysis of yeast population dynamics in winery and laboratory grape must fermentations.Int. J. Food Microbiol.108376–384. 10.1016/j.ijfoodmicro.2006.01.025
80
Ye M. Yue T. Yuan Y. (2014). Effects of sequential mixed cultures of Wickerhamomyces anomalus and Saccharomyces cerevisiae on apple cider fermentation.FEMS Yeast Res.14873–882. 10.1111/1567-1364.12175
81
Ženišová K. Chovanová K. Chebeňová-Turcovská V. Godálová Z. Kraková L. Kuchta T. et al (2014). Mapping of wine yeast and fungal diversity in the Small Carpathian wine-producing region (Slovakia): evaluation of phenotypic, genotypic and culture-independent approaches.Ann. Microbiol.641819–1828. 10.1007/s13213-014-0827-x
82
Zott K. Claisse O. Lucas P. Coulon J. Lonvaud-Funel A. Masneuf-Pomarede I. (2010). Characterization of the yeast ecosystem in grape must and wine using real-time PCR.Food Microbiol.27559–567. 10.1016/j.fm.2010.01.006
83
Zott K. Miot-Sertier C. Claisse O. Lonvaud-Funel A. Masneuf-Pomarede I. (2008). Dynamics and diversity of non-Saccharomyces yeasts during the early stages in winemaking.Int. J. Food Microbiol.125197–203. 10.1016/j.ijfoodmicro.2008.04.001
Summary
Keywords
yeast consortium, population dynamics, yeast interactions, wine fermentation, ARISA
Citation
Bagheri B, Bauer FF and Setati ME (2017) The Impact of Saccharomyces cerevisiae on a Wine Yeast Consortium in Natural and Inoculated Fermentations. Front. Microbiol. 8:1988. doi: 10.3389/fmicb.2017.01988
Received
12 July 2017
Accepted
27 September 2017
Published
16 October 2017
Volume
8 - 2017
Edited by
Gustavo Cordero-Bueso, University of Cádiz, Spain
Reviewed by
Braulio Esteve-Zarzoso, Universitat Rovira i Virgili, Spain; Joao Fernando Drumonde-Neves, University of the Azores, Portugal
Updates
Copyright
© 2017 Bagheri, Bauer and Setati.
This is an open-access article distributed under the terms of the Creative Commons Attribution License (CC BY). The use, distribution or reproduction in other forums is permitted, provided the original author(s) or licensor are credited and that the original publication in this journal is cited, in accordance with accepted academic practice. No use, distribution or reproduction is permitted which does not comply with these terms.
*Correspondence: Mathabatha E. Setati, setati@sun.ac.za
This article was submitted to Food Microbiology, a section of the journal Frontiers in Microbiology
Disclaimer
All claims expressed in this article are solely those of the authors and do not necessarily represent those of their affiliated organizations, or those of the publisher, the editors and the reviewers. Any product that may be evaluated in this article or claim that may be made by its manufacturer is not guaranteed or endorsed by the publisher.