 Li Shao
 Zongxin Ling
 Deying Chen1
 Lanjuan Li
- 1State Key Laboratory for Diagnosis and Treatment of Infectious Diseases, Collaborative Innovation Center for Diagnosis and Treatment of Infectious Diseases, The First Affiliated Hospital, School of Medicine, Zhejiang University, Hangzhou, China
- 2Pharmaceutical Informatics Institute, College of Pharmaceutical Sciences, Zhejiang University, Hangzhou, China
Early detection and effective interventions for liver cirrhosis (LC) remain an urgent unmet clinical need. Inspired from intestinal disorders in LC patients, we investigated the associations between gut microbiome and disease progression based on a raw metagenomic dataset of 47 healthy controls, 49 compensated, and 46 decompensated LC patients from our previous study, and a metabolomic dataset of urine samples from the same controls/patients using ultra-performance liquid chromatography/mass spectrophotometry system. It was found that the combination and relative abundance of gut microbiome, the inter-microbiome regulatory networks, and the microbiome-host correlation patterns varied during disease progression. The significant reduction of bacteria involved in fermentation of plant cell wall polysaccharides and resistant starch (such as Alistipes sp. HG5, Clostridium thermocellum) contributed to the reduced supply of energy sources, the disorganized self-feeding and cross-feeding networks and the thriving of some opportunistic pathogens in genus Veillonella. The marked decrease of butyrate-producing bacteria and increase of Ruminococcus gnavus implicated in degradation of elements from the mucus layer provided an explanation for the impaired intestinal barrier function and systematic inflammation in LC patients. Our results pave the way for further developments in early detection and intervention of LC targeting on gut microbiome.
Introduction
Cirrhosis is an advanced liver disease with high mortality and morbidity resulting from multiple liver injuries. Determined as the 14th most common cause of death worldwide and fourth most frequent in central Europe, the morbidity and mortality rates due to cirrhosis continue to increase in more developed countries (Tsochatzis et al., 2014). Initially regarded as a single disease entity leading to death, cirrhosis is now increasingly accepted as a dynamic process with the 1 year mortality rate ranging from 1 to 57% for patients at distinct clinical prognostic stages (Tsochatzis et al., 2014). Therefore, development of early interventions to stabilize disease progression and to avoid or delay decompensation of patients is of vital importance. However, chronic liver disease is notoriously asymptomatic in most cases until the occurrence of clinical decompensation. Moreover, few clinical examinations are currently available for diagnosis of cirrhosis, except liver biopsy, which is not applicable to all patients and can lead to various complications in 2–3% patients (Schuppan and Afdhal, 2008). Therefore, clarification of the mechanisms underlying disease progression and identification of appropriate clinical factors that could be utilized as targets for disease monitoring and treatment remain an urgent medical requirement.
Increasing evidence supports the significant association of gut dysbiosis with various kinds of diseases, such as diabetes (Marino et al., 2017), obesity (Bouter et al., 2017), and colorectal cancer (Yu et al., 2017). The liver receives most of its blood supply from the intestine through portal vein and is therefore one of the organs predominantly exposed to potential toxic factors originating from the gut (Llorente and Schnabl, 2015). The gut microbiome has been shown to be involved in the induction and promotion of liver damage in early-stage liver disease (Yan et al., 2011). Enteric dysbiosis, particularly translocation of bacteria and their products through the gut epithelial barrier, plays an important role in the progression and complications of end-stage liver cirrhotic conditions (Lachar and Bajaj, 2016). Previous metagenomic research by our group further confirmed significant dysbiosis of the gut microbiome in LC patients (Qin et al., 2014). Thus, gut microbiome presents a potential target for manipulation to understand and monitor LC progression.
Obligate metabolic interactions exist in natural bacterial communities (Pande and Kost, 2017). Bacteria commonly release metabolites into the external environment, which form an ecological niche benefiting auxotrophic cells that have lost the ability to autonomously produce the corresponding metabolites (Pande and Kost, 2017). The mammalian gut microbiota interacts extensively with the host through metabolic exchange and co-metabolism of substrates, which is implicated in the etiology of many human diseases (Nicholson et al., 2005). These findings indicate critical roles of low molecular weight metabolites of gut microbiome in communicating among bacteria and between bacteria and hosts. Therefore, integrated metabolomic and metagenomic analyses could provide significant advantages in delineating the dynamics and mechanisms of gut microbiome in LC progression. To date, meta-omics-based research has demonstrated considerable benefits in various disease types, including pediatric nonalcoholic fatty liver disease (Del Chierico et al., 2017) and late-onset sepsis in preterm neonates (Stewart et al., 2017).
Several investigations have confirmed dysbiosis of gut microbiome in LC patients (Betrapally et al., 2016; Tilg et al., 2016). However, the contributions of gut microbiome in LC progression, and the feasibility of prevention and early intervention targeting on gut microbiome remain to be established. Based on the huge quantity of metagenomic data already generated for a large number of healthy controls and LC patients and the collection and deposition of urine samples from the same controls/patients in our previous study (Qin et al., 2014), we investigated the dynamics, cross-talk and roles of gut microbiome during clinical progression of LC. The results of this study should pave the way for further researches focusing on monitoring and controlling LC targeting on gut microbiome.
Materials and Methods
Study Design
A meta-omics-based study was conducted to investigate the dynamics and roles of gut microbiome in clinical development of LC. The study design was subdivided into four steps (Figure 1A). First, appropriate sets of healthy controls and LC patients with comparable ages were selected from the populations included in our previous study (Qin et al., 2014). Raw metagenomic sequencing data and urine samples from the same healthy controls and/or patients were retrieved, and metabolites in urine samples were analyzed via ultra-performance liquid chromatography/mass spectrum (UPLC/MS) technology. The resulting metabolomic and raw metagenomic datasets generated previously were subsequently processed. Two sets of differential taxa (sets 1 and 2) were obtained using different protocols, as shown Figure 1A. The dynamics of gut microbiome were then profiled from taxa set 1 using a conventional protocol. Finally, differential taxa common in two protocols were selected and used to investigate the inter-microbiome and microbiome–metabolite cross-talk during LC progression. Potential functions associated with the common taxa were also evaluated.
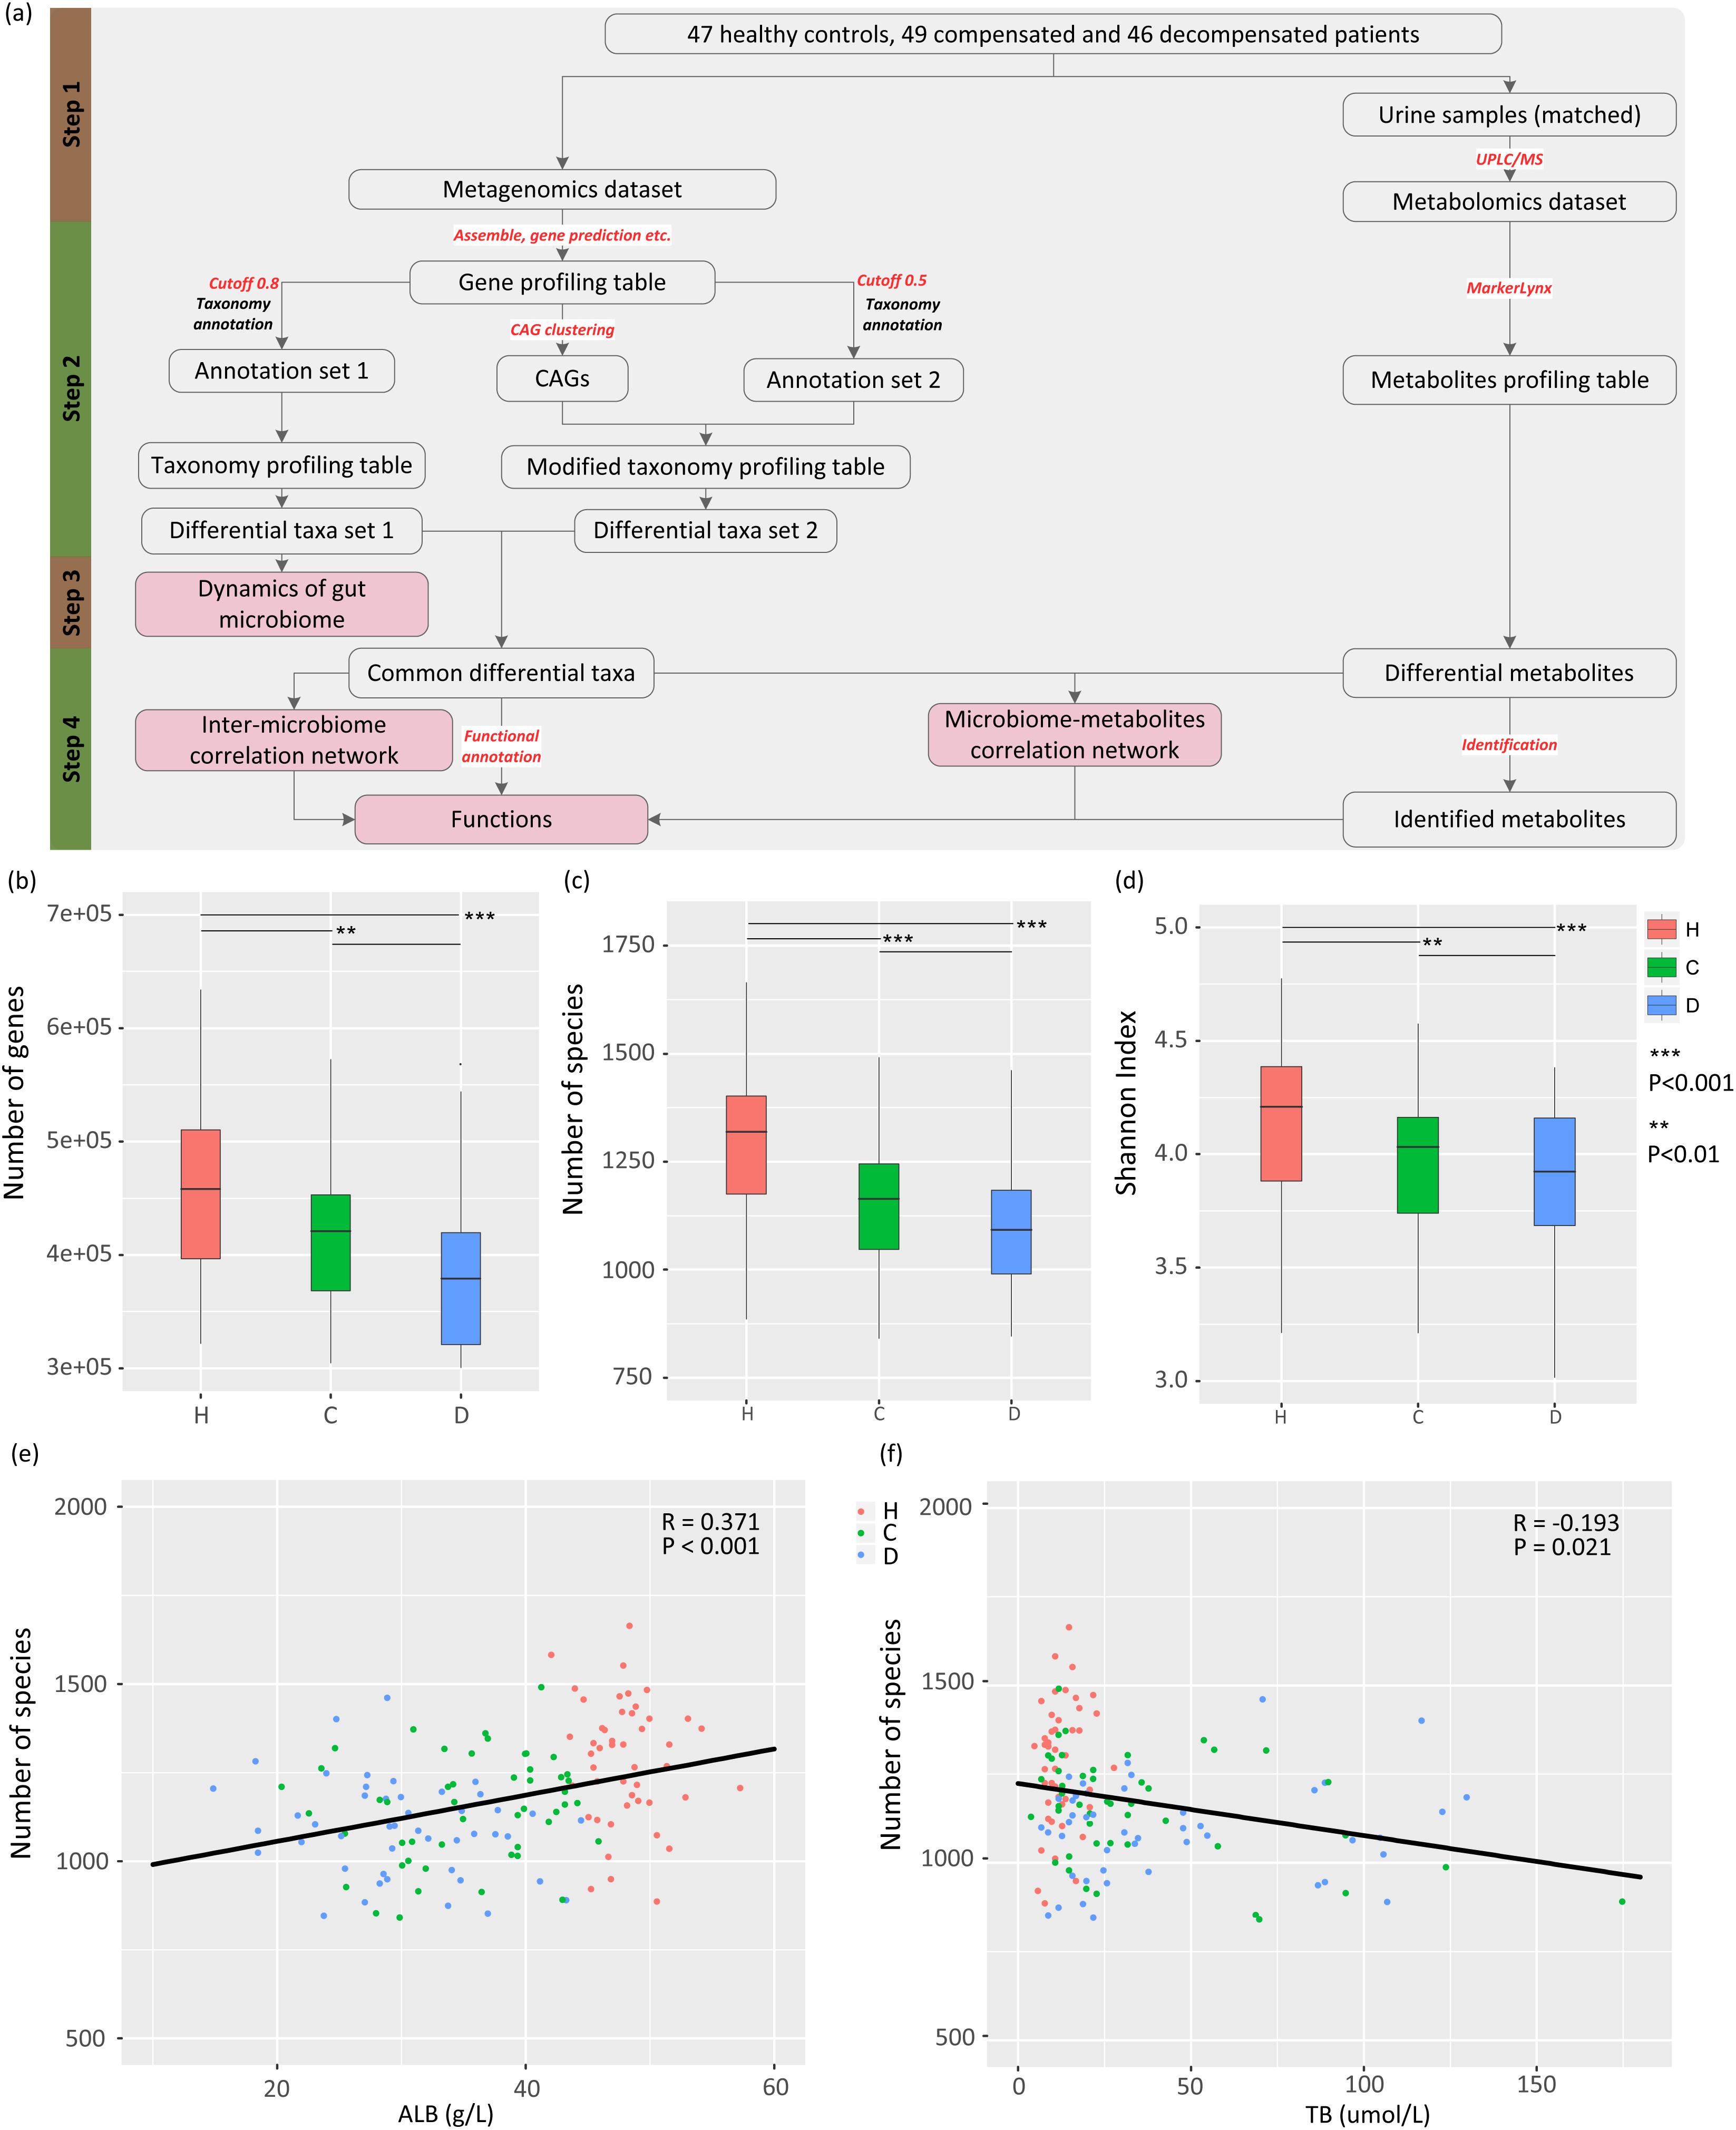
Figure 1. Study design, and associations between gut microbiome and disease progression. (A) Schematic diagram of the study design. (B) Boxplot of microbial gene richness in healthy controls, compensated and decompensated patients. (C) Boxplot of microbial richness in healthy controls, compensated and decompensated patients. (D) Boxplot of the Shannon index in healthy controls, compensated and decompensated patients. (E) Correlations between microbial richness and albumin. (F) Correlations between microbial richness and total bilirubin.
Description of Samples and the Metagenomic Sequencing Dataset
The raw dataset generated from our previous research (Qin et al., 2014) (ERP005860) was used in this study, which contained paired-end metagenomic sequencing reads for the gut microbiome from fresh stool samples obtained from 123 patients with LC resulting from various kinds of liver injuries and 114 healthy volunteers. In that study, the morning urine samples from the same healthy controls or LC patients were also obtained if available at the same day when stool samples were collected, and were stored at -80°C degrees immediately. In this study, only the metagenomic sequencing reads of LC patients and healthy volunteers with comparable ages were selected. To remove potential confounding factors to the best possible extent, samples with fewer than 11 M sequences were removed. Cirrhotic patients were further classified as “compensated” and “decompensated” according to previously defined principles (Bajaj et al., 2012), resulting in a dataset comprising 47 healthy counterparts (H), 49 compensated (C), and 46 decompensated (D) cirrhotic patients with average ages of 45.34 ± 1.22, 47.69 ± 1.39, and 51.41 ± 1.60 years, respectively. The age was further confirmed not to be a confounding factor in comparisons between healthy controls and compensated patients (HvsC, P = 0.21), and between compensated and decompensated patients (CvsD, P = 0.08). Detailed information for all participants is provided in a previous report (Qin et al., 2014) and Supplementary Table S1, which also illustrates the availability of urine samples. Our experiments were approved by the Ethics Committee of the First Affiliated Hospital, School of Medicine, Zhejiang University (Zhejiang, China). Informed written consent was obtained from each patient prior to enrollment.
Construction of a Nonredundant Gene Catalog
Illumina raw paired-end sequencing reads were processed with the MOCAT (Kultima et al., 2012) software package. Briefly, raw sequencing reads were initially filtered using FastX software1 with a quality cutoff of 20, and reads shorter than 30 bp discarded. High-quality reads were subjected to human contamination screening. Reads that passed screening were assembled into scaftigs using SOAPdenovo v2.04 (Luo et al., 2012). Genes were predicted from scaftigs longer than 500 bp using MetaGeneMark v3.38 (Besemer and Borodovsky, 1999; Zhu et al., 2010). Redundant genes were removed using CD-HIT (Li and Godzik, 2006) with a cutoff of 90% overlap and 95% identity (no gaps allowed). Finally, cluster representatives shorter than 100 bp were discarded, resulting in 2,332,123 nonredundant genes as the reference gene catalog.
Quantification of Reference Gene Abundance
High-quality reads that passed human contamination screening were mapped to the reference gene catalog using SOAPaligner v2.21 packed in MOCAT (Kultima et al., 2012) with the following options: –M 4 (find best hits), –l 30 (seed length), –r l (random assignment of multiple hits) and –v 5 (maximum number of mismatches). Mapped reads were subsequently filtered using a cutoff of length 30 bp and 95% identity. The gene length-normalized base counts were calculated using the soap.coverage script2. For each sample, 11 M reads (Le Chatelier et al., 2013) were randomly drawn (without replacement) and mapped to the gene catalog to form a downsized depth or abundance matrix.
Taxonomical Annotation and Abundance Calculation
Catalog genes were assigned taxonomical annotations based on sequence similarity to a database of predicted protein coding genes from 8942 publicly available genomes in the National Center for Biotechnology Information (NCBI, release 196) by MyTaxa (Luo et al., 2014). A likelihood cutoff of 0.8 was applied to determine the taxonomical annotation for the query sequence. The relative abundance of a taxon was calculated as the total relative abundance of genes annotated.
Construction of Co-abundant Gene Groups and Calculation of Abundance
The canopy-based clustering (Le Chatelier et al., 2013) algorithm with default settings was utilized to generate co-abundant gene groups (CAG) from the reference gene abundance profile across all individuals. MyTaxa (Luo et al., 2014) with a likelihood cutoff of 0.5 was used to determine the taxonomical annotations of genes in each CAG. Only clusters containing more than 50 genes annotated to the same species were retained for further analysis. The abundance of retained CAG was calculated as the mean abundance signal of all genes in each cluster.
α-Diversity and Gene Count
α-Diversity (within-sample diversity) was calculated from the gene profile of each sample according to the Shannon index as described previously (Qin et al., 2012). In a survey of gene counts, only those with at least one mapped read were considered present (Le Chatelier et al., 2013).
Gene Functional Classification and Ortholog Group Abundance Profiling
Functional annotation for target genes was achieved with SUPER-FOCUS (Silva et al., 2016). Default settings of parameters were utilized, such as maximum E-value 1e-5, minimum 60% identity, and minimum alignment length of 15 amino acids. For cases where more than one best hit was found per query sequence, subsystems for all the best hits were retained.
Urine Metabolomic Analysis and Data Pre-processing
One hundred and seventeen urine samples from the healthy volunteers (n = 42) and LC patients (39 compensated and 36 decompensated patients) selected from the above metagenomic analysis procedure were studied in this study. All samples were thawed on ice, vortexed and centrifuged at 14,000 × g for 15 min at 4°C. Equal volumes of supernatant (10 μL) from all samples were pooled to obtain quality control (QC) samples. The remaining clear supernatant was placed in UPLC vials for chromatographic separation using a Waters (Milford, MA, United States) ACQUITY UPLC system equipped with an ACQUITY UPLC BEH C18 analytical column. Mass spectrometry was performed on a Waters Q-TOF Premier mass spectrometer in the negative ESI mode. QC samples were injected every six samples throughout the analytical process. The raw UPLC-MS data were processed by MarkerLynx Applications Manager (version 4.1, Waters, Milford, MA, United States), which detected, integrated and normalized the intensities of the peaks to the sum of peaks within the sample, and generated a multivariate dataset based on the retention time, m/z value and signal intensities of the peaks. After partial least squares discriminant analysis (PLS-DA), the differential metabolites were firstly identified by searching MS/MS spectra in the HMDB database3. The metabolites that can be preliminarily identified would then be confirmed by corresponding metabolic standards. The metabolite standards methyladenosine, cinnamic acid, phenyllactic acid, decenoylcarnitine, methyluric acid, and alpha-N-phenylacetyl-L-glutamine were purchased from Sigma-Aldrich (St. Louis, MO, United States).
Statistical Analysis
Univariate clinical data are presented as means and standard error of the mean (SEM), and compared between groups by Welch’s t-test. Permutational multivariate analysis of variance (PERMANOVA) (Bray–Curtis distance and 9999 permutations for the hypothesis test) and principal co-ordinate analysis (PCoA) based on Bray–Curtis distance were utilized to assess the association between disease progression and gut microbiome. Associations between microbial richness and continuous variables measured clinically were evaluated based on Pearson correlation coefficient. Differences in the relative abundance of taxa and CAGs were identified using LefSe (Segata et al., 2011) with P < 0.05 and log-score > 2. Principal component analysis (PCA) and partial least squares discriminant analysis (PLS-DA) of the metabolomics dataset was conducted using SIMCA-P+ 12.0 (Umetrics AB, Sweden) software, and metabolites with variable importance in the projection (VIP) value larger than 1.5 were considered significant. The co-occurrence networks for significant correlations based on permutation analysis (P < 0.01) were constructed using the SparCC algorithm (Friedman and Alm, 2012), and visualized by Cytoscape 3.4.0 (Shannon et al., 2003). Differential functions with corrected P values less than 0.01 were identified using two-tailed Wilcoxon rank-sum test combined with Benjamini-Hochberg correction (false discovery rate < 0.05). All statistical analyses were conducted using R software (version 3.3.2) unless stated otherwise.
Results
Gut Microbial Dysbiosis Is Associated With LC Progression
To delineate the gut microbiome variations associated with LC progression, we retrieved 142 samples from the metagenomic shotgun sequencing data obtained previously (Qin et al., 2014) and acquired taxonomy information using MyTaxa with a likelihood cutoff of 0.8. Microbial gene richness, microbial richness and species diversity decreased significantly (P < 0.01) in compensated patients compared to healthy volunteers, and decreased further from compensation to decompensation stages (Figures 1B–D). The number of genes and species, Shannon index for each sample are specified in Supplementary Table S2. PERMANOVA analysis further confirmed significant dysbiosis of gut microbiota in compensated (P < 0.001) and decompensated patients (P < 0.001) relative to healthy controls, while the variation of gut microbiome during the progression from compensated to decompensated stage was not as marked (P = 0.117). A scatter plot on the first three axes of PCoA based on all species (Supplementary Figure S1) further confirmed these findings. Moreover, prominent correlations were observed between microbial richness and clinical indices (Supplementary Table S3), such as albumin (ALB) and total bilirubin (TB) (Figures 1E,F). Our results clearly indicate that gut microbial dysbiosis is related to disease progression.
Alterations in the Gut Microbiome During LC Progression
The relative abundance profiles at the phylum, genus and species levels were further compared. Among the most abundant phyla, Proteobacteria and Spirochaetes were enriched in patients and controls, respectively, while these alterations in abundance were not so apparent between compensation and decompensation stages (Figure 2A). Twenty-two genera from phyla Firmicutes, Bacteroidetes, Proteobacteria, and Spirochaetes (Figure 2B), including Alistipes, Odoribacter, Eubacterium, and Ruminococcus, were significantly downregulated, while five (Veillonella, Streptococcus, Lactobacillus, Megasphaera and Haemophilus) were upregulated in compensated and decompensated patients, compared to healthy controls. It is worth noting that the prominent downregulation of Tannerella and Bilophila and upregulation of Veillonella continued during disease progression from compensation to decompensation stage.
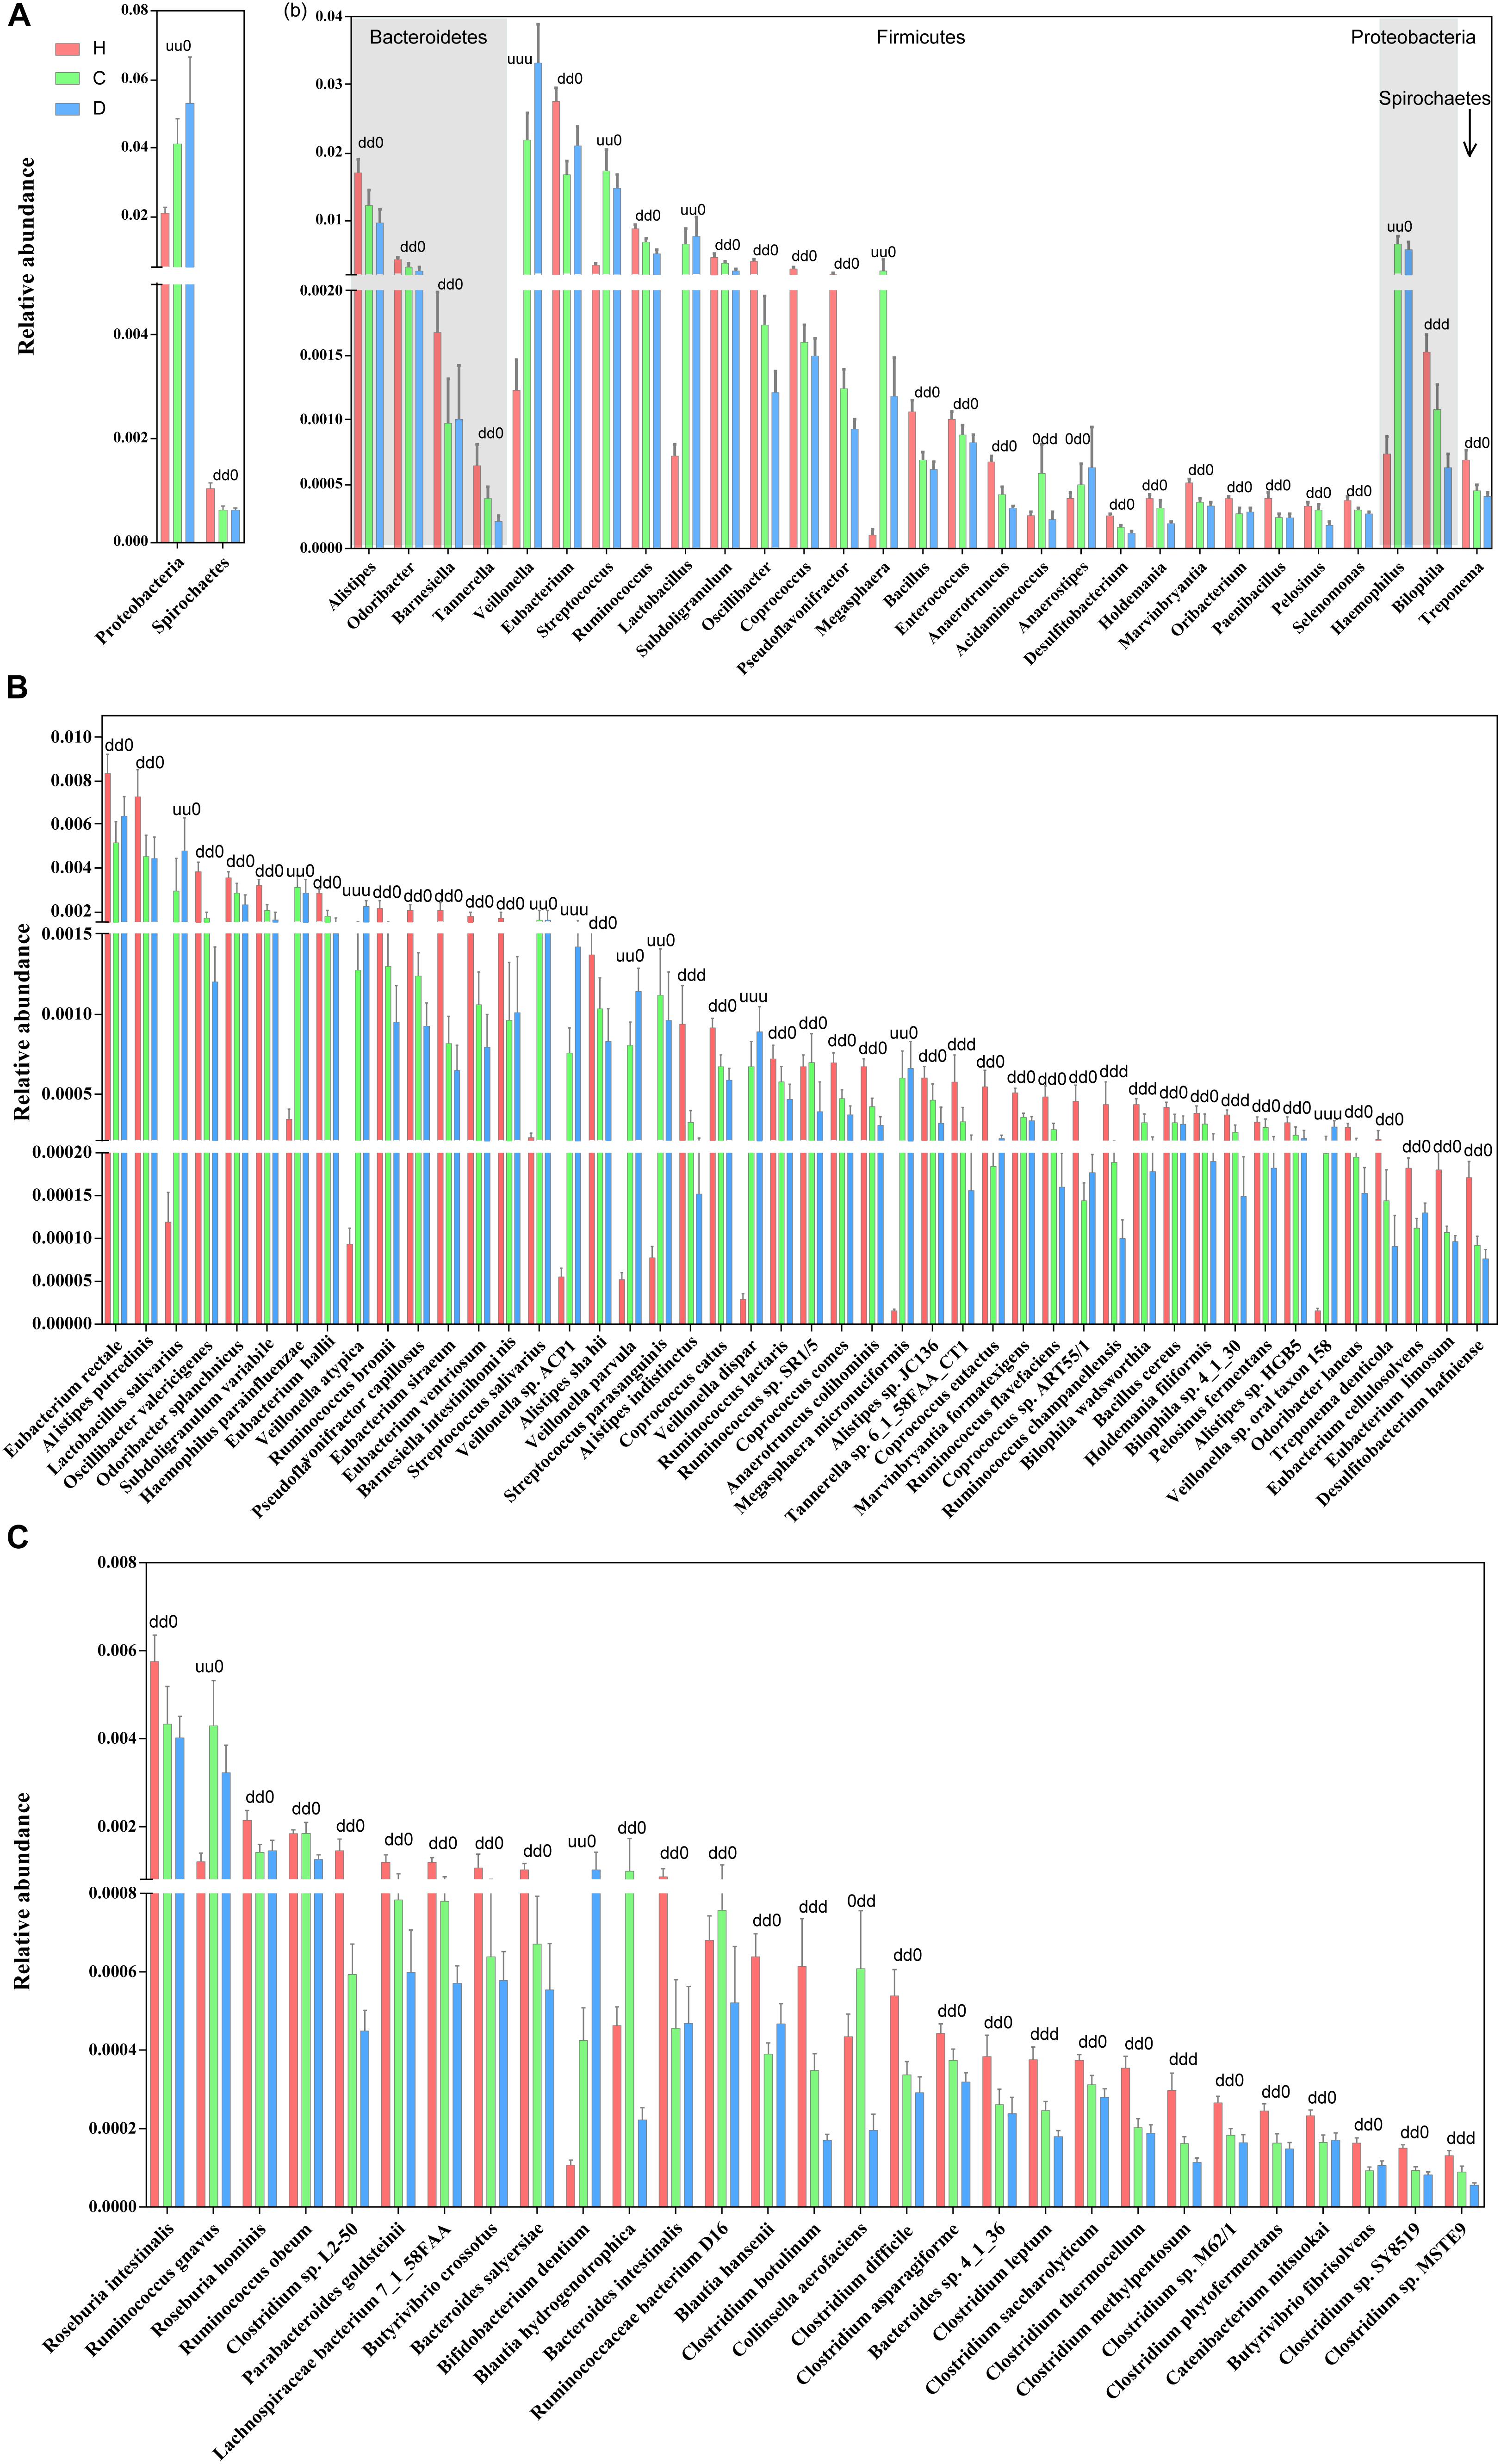
Figure 2. Boxplots of differential gut microbiomes. (A) Relative abundance of differential phyla. (B) Relative abundance of differential genera. (C) Relative abundance of species demonstrating similar alterations with the corresponding genus in both compensated and decompensated patients, compared to healthy controls. (D) Relative abundance of species demonstrating different alterations with the corresponding genus in both compensated and decompensated patients, compared to healthy controls. A combination of three characters, “u,” “d,” and “0,” represents the status of compensated and decompensated patients compared to healthy controls and variations during sequential progression from the compensation to decompensation stage. “u,” “d,” and “0” signify significant upregulation and downregulation and no significant variations, respectively.
Close inspection revealed that a total of 75 species from phyla Actinobacteria, Bacteroidetes, Firmicutes, Proteobacteria, and Spirochaetes altered drastically during disease progression. Among these, 46 species (Figure 2C) demonstrated similar alterations with corresponding genus in both compensated and decompensated patients, compared to healthy controls, including 31 with decreased (such as Eubacterium rectale, Alistipes putredinis, Alistipes shahii, and Coprococcus eutactus) and 6 with increased (Haemophilus parainfuenzae, Streptococcus salivarius, Lactobacillus salivarius, and Veillonella parvula) abundance. Among the remaining 29 species (Figure 2D), 27 including Roseburia intestinalis, Clostridium sp. L2-50 and Bacteroides intestinalis decreased, while increased levels of Ruminococcus gnavus and Bifidobacterium dentium were observed in both compensated and decompensated patient groups. During disease progression from compensation to decompensation, Alistipes indistinctus, Bilophila wadsworthia, Bilophila sp. 4_1_30, Ruminococcus champanellensis, Tannerella sp. 6_1_58FAA_CT1, Clostridium botulinum, Clostridium leptum, Clostridium methylpentosum and Clostridium sp. MSTE9 were further downregulated while Veillonella atypica, Veillonella sp. ACP1, Veillonella dispar, and Veillonella sp. oral taxon 158 were further upregulated. These results support the theory that alterations in the gut microbiome occur in association with liver cirrhosis progression.
Alterations in Inter-Microbiome Interactions During LC Progression
Inspired by the finding that gut microbiomes potentially act in niche–specific relationships (Nakatsu et al., 2015), we further evaluated inter-microbiome interactions during LC progression. Considering the latent bias involved in library construction, sequencing, and data processing procedures (Goodrich et al., 2014), two protocols were combined to obtain a subset of reliable differential species. Concisely, microbial genes were clustered in to CAG clusters, and those containing more than 50 genes annotated as the same species were retained. The resulting differential species overlapped with those obtained previously were selected for further analysis. Supplementary Figures S2A,B illustrates the phylogenetic tree of the final 30 differential species and the relative abundance using the CAG-based protocol. In total, 21 species, including E. rectale, A. shahii, and R. intestinalis, were downregulated, while 9, including Veillonella sp. ACP1, V. atypical, and V. dispar, were upregulated in compensated and decompensated patients, compared to healthy controls.
We next inferred all pairwise inter-microbiome correlations in each group of samples. As shown in Figure 3A and Supplementary Table S4, the interactions within the healthy control group were the most extensive and evenly distributed. Broad negative regulatory interactions (53 out of 114 edges) were observed between control-enriched and LC-enriched species. The number of connections was sharply decreased in compensated patients (57 edges) as compared to healthy controls (114 edges). The ratio of negative versus positive edges in compensated patients (17/40) was also significantly lower than that of healthy controls (53/61) (P < 0.05). On the other hand, the strength of some interactions, especially the positive associations among LC-enriched V. parvula, Veillonella sp. ACP1, V. atypica, V. dispar, S. salivarius, B. dentium, and H. parainfluenzae, was drastically enhanced in compensated patients (0.496 ± 0.034) as compared to healthy controls (0.196 ± 0.018) (Supplementary Table S5, P < 0.001). During the progression from compensation (57 edges) to decompensation (40 edges), a number of connections were further weakened and/or lost. Most significantly, the negative regulations associated with R. gnavus and L. salivarius totally disappeared in decompensated patients. These results collectively demonstrate that inter-microbiome interactions altered markedly during disease progression. In conclusion, gut microbial dysbiosis should be evaluated not only for diversity and abundance of microbes but also for inter-microbiome cross-talk.
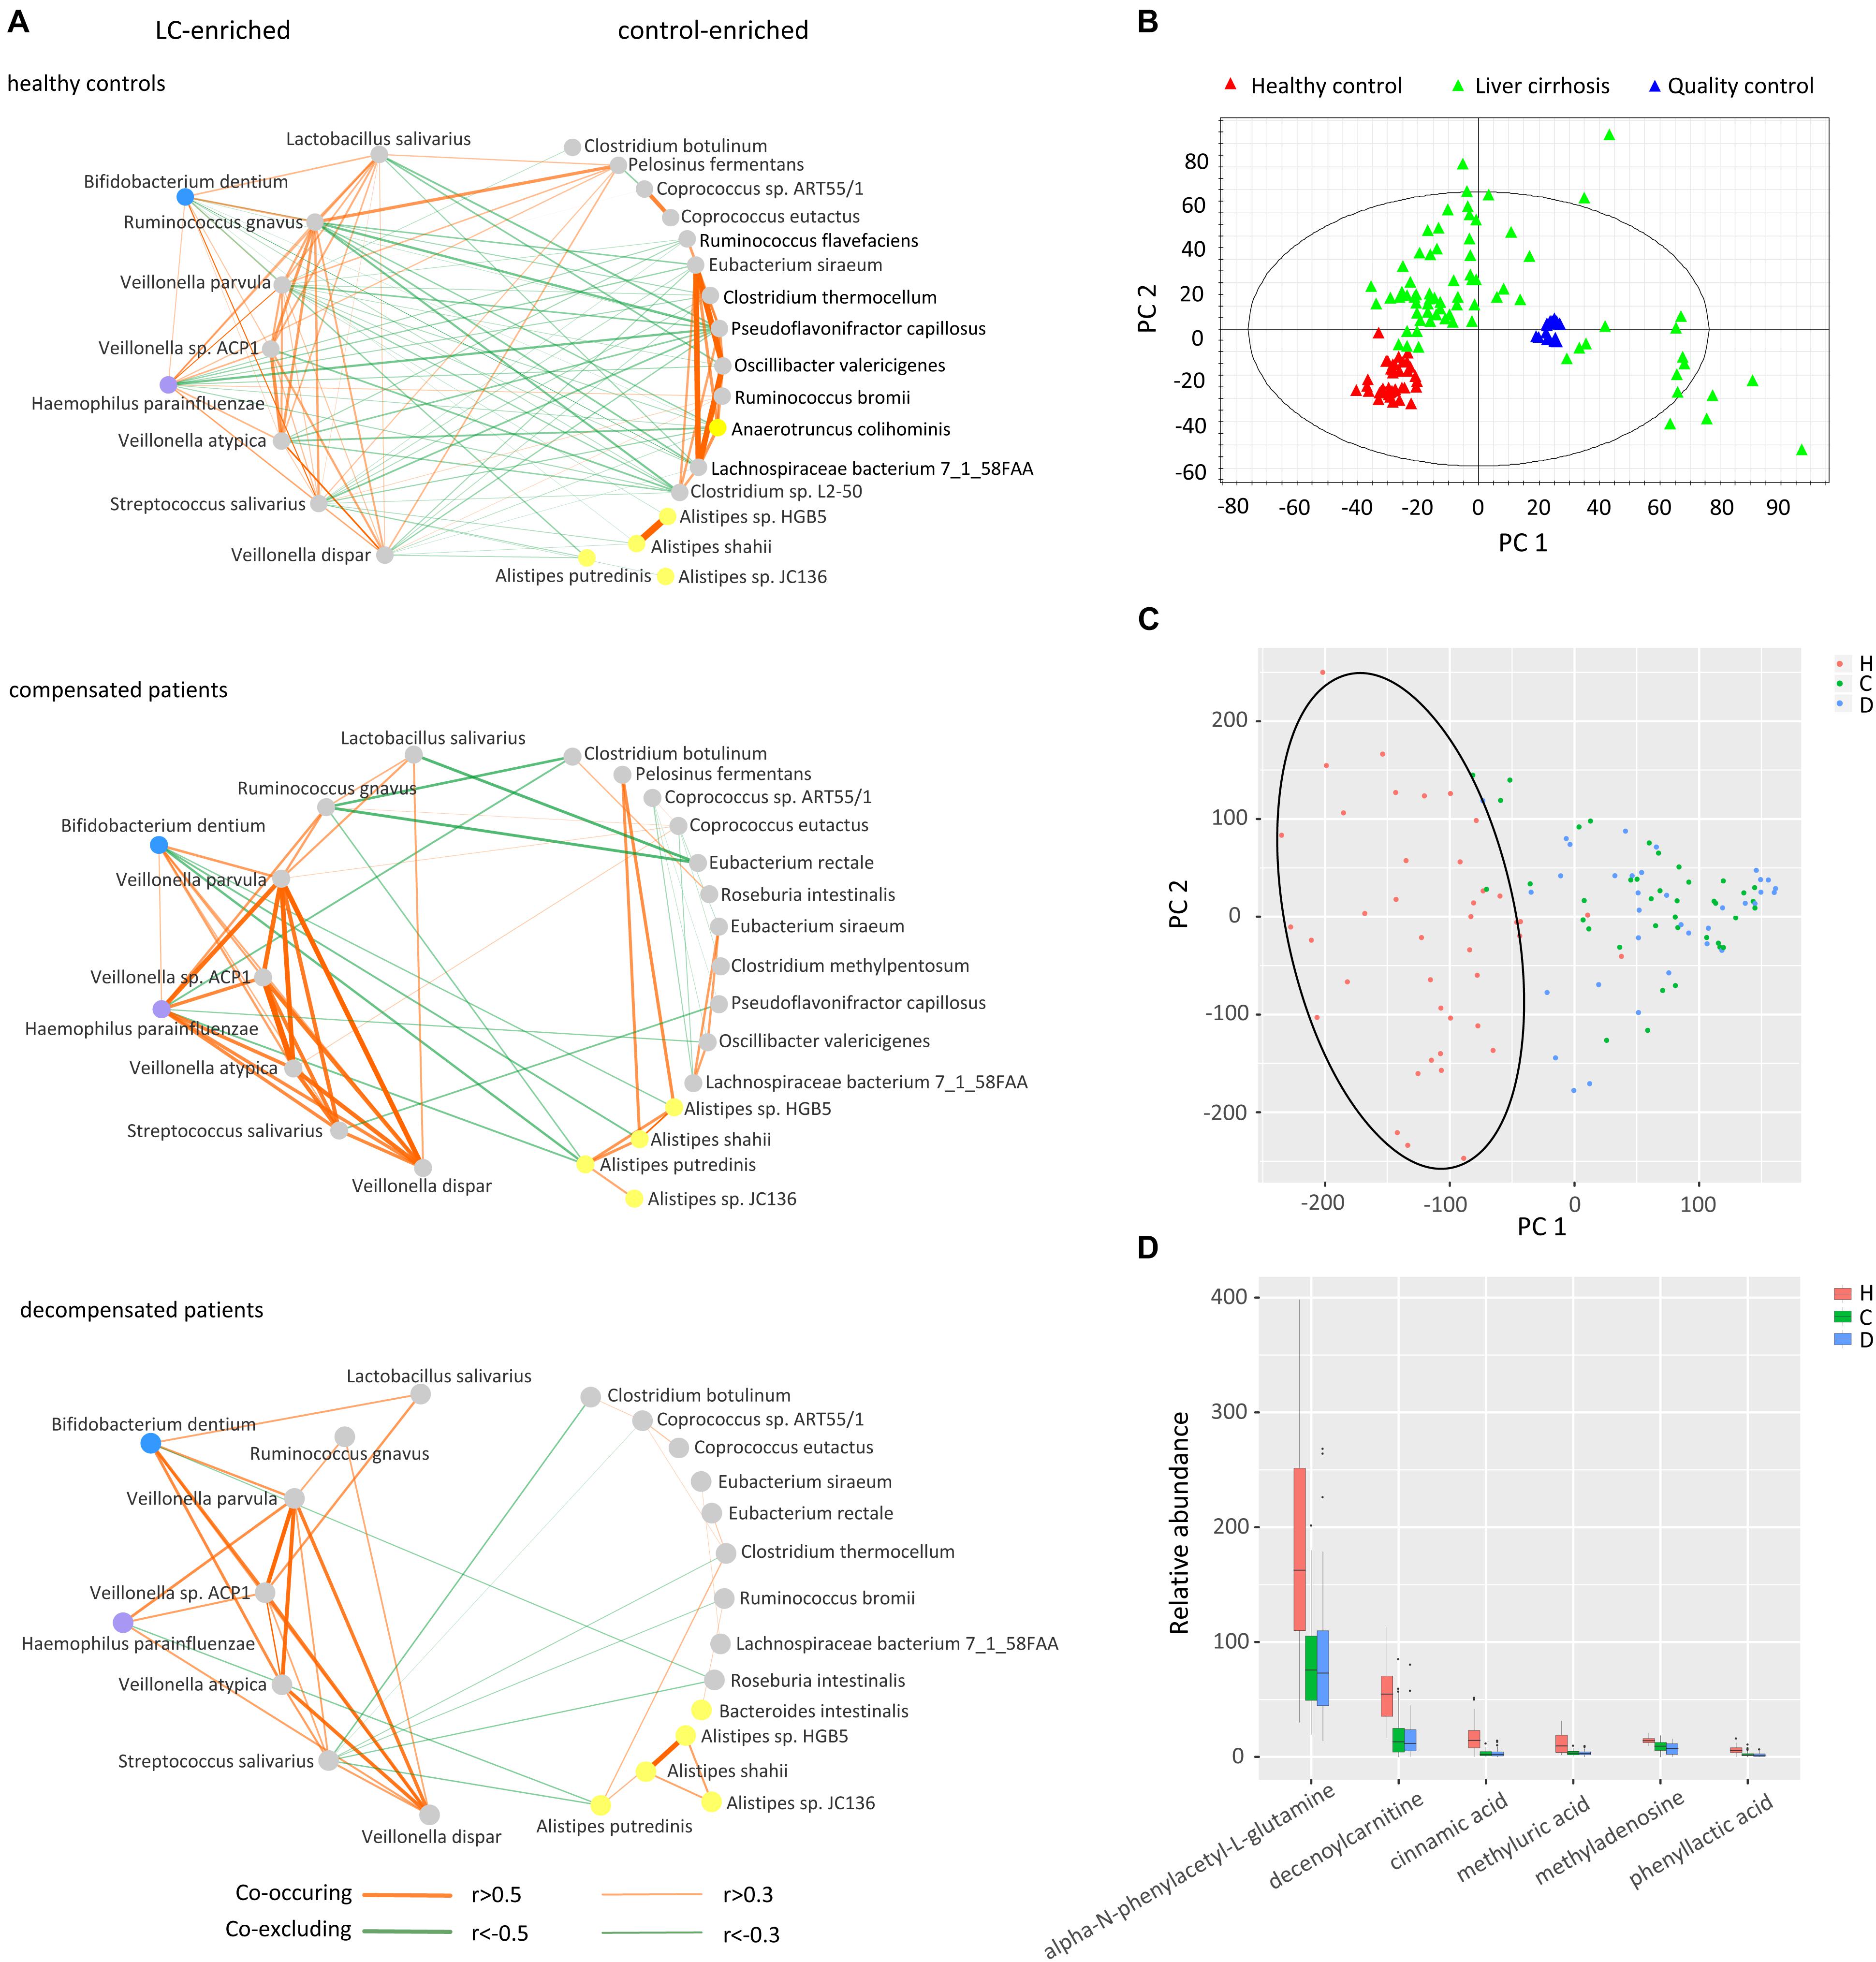
Figure 3. Cross-talk of gut microbiome, score plots of urine metabolites in principal component analysis, and relative abundance of identified metabolites. (A) Correlation networks of the gut microbiome in healthy controls, compensated and decompensated patients. Red and green lines represent positive and negative regulatory networks. Nodes filled with gray, yellow, blue, and purple represent species from the phyla Firmicutes, Bacteroidetes, Actinobacteria, and Proteobacteria, respectively. (B) Score plot of healthy controls, liver cirrhotic patients and quality control samples based on raw metabolomic data without filtering. (C) Score plot of healthy controls, compensated and decompensated patients based on 75 differential metabolites. (D) Relative abundance of the six metabolites identified in healthy controls, compensated and decompensated patients.
Alterations in Microbiome-Metabolite Correlations During LC Progression
The gut microbiome may share metabolites and regulate host metabolism (Pande and Kost, 2017). Accordingly, we further evaluated whether altered inter–microbiome interactions are associated with metabolite exchange by examining the metabolic states of healthy controls and LC patients. As shown in the score plot of PCA based on a total of 10012 peaks (Figure 3B), aggregation of QC samples confirmed the reliability of the metabolomic dataset. After trimming peaks that were absent in 30% samples, 75 metabolites with a VIP value > 1.5 were selected by PLS-DA to be differed among healthy volunteers, compensated and decompensated LC patients. The score plot of PCA based on the 75 metabolites further illustrated that the metabolic state of LC patients was distinct from that of healthy controls while the difference between compensated and decompensated patients was far less significant (Figure 3C). We further identified and confirmed six metabolites by searching MS/MS spectra in the HMDB database4 and comparing with those of corresponding standards. The relative abundance of the six metabolites is illustrated in Figure 3D. Detailed information on retention time, molecular weight and VIP value for each of the metabolites is provided in Supplementary Table S6. MS/MS spectra of the six identified metabolites in samples and standards are shown in Supplementary Figure S3.
We further evaluated the interactions between gut microbiome and urine metabolites in each sample group. Extensive correlations were observed in healthy controls, while the number of associations was markedly lower in both compensated and decompensated patients (Figure 4). Upon separation of the microbiome into control-enriched and LC-enriched components that were down- and up-regulated, respectively, in LC patients relative to healthy controls, several interesting findings were obtained. Most surprisingly, most correlations between control-enriched microbiome and urine metabolites were negative for healthy controls, while nearly all those for the LC-enriched microbiome were positive. During disease progression, different patterns were observed for control- and LC-enriched species. For control-enriched species, the number of connections decreased gradually, especially members of the genus Alistipes, which only retained minimal connections in decompensated patients. For LC-enriched species, the pattern changed from most positive correlations in healthy controls to most negative correlations in decompensated patients in addition to a reduced number of connections.
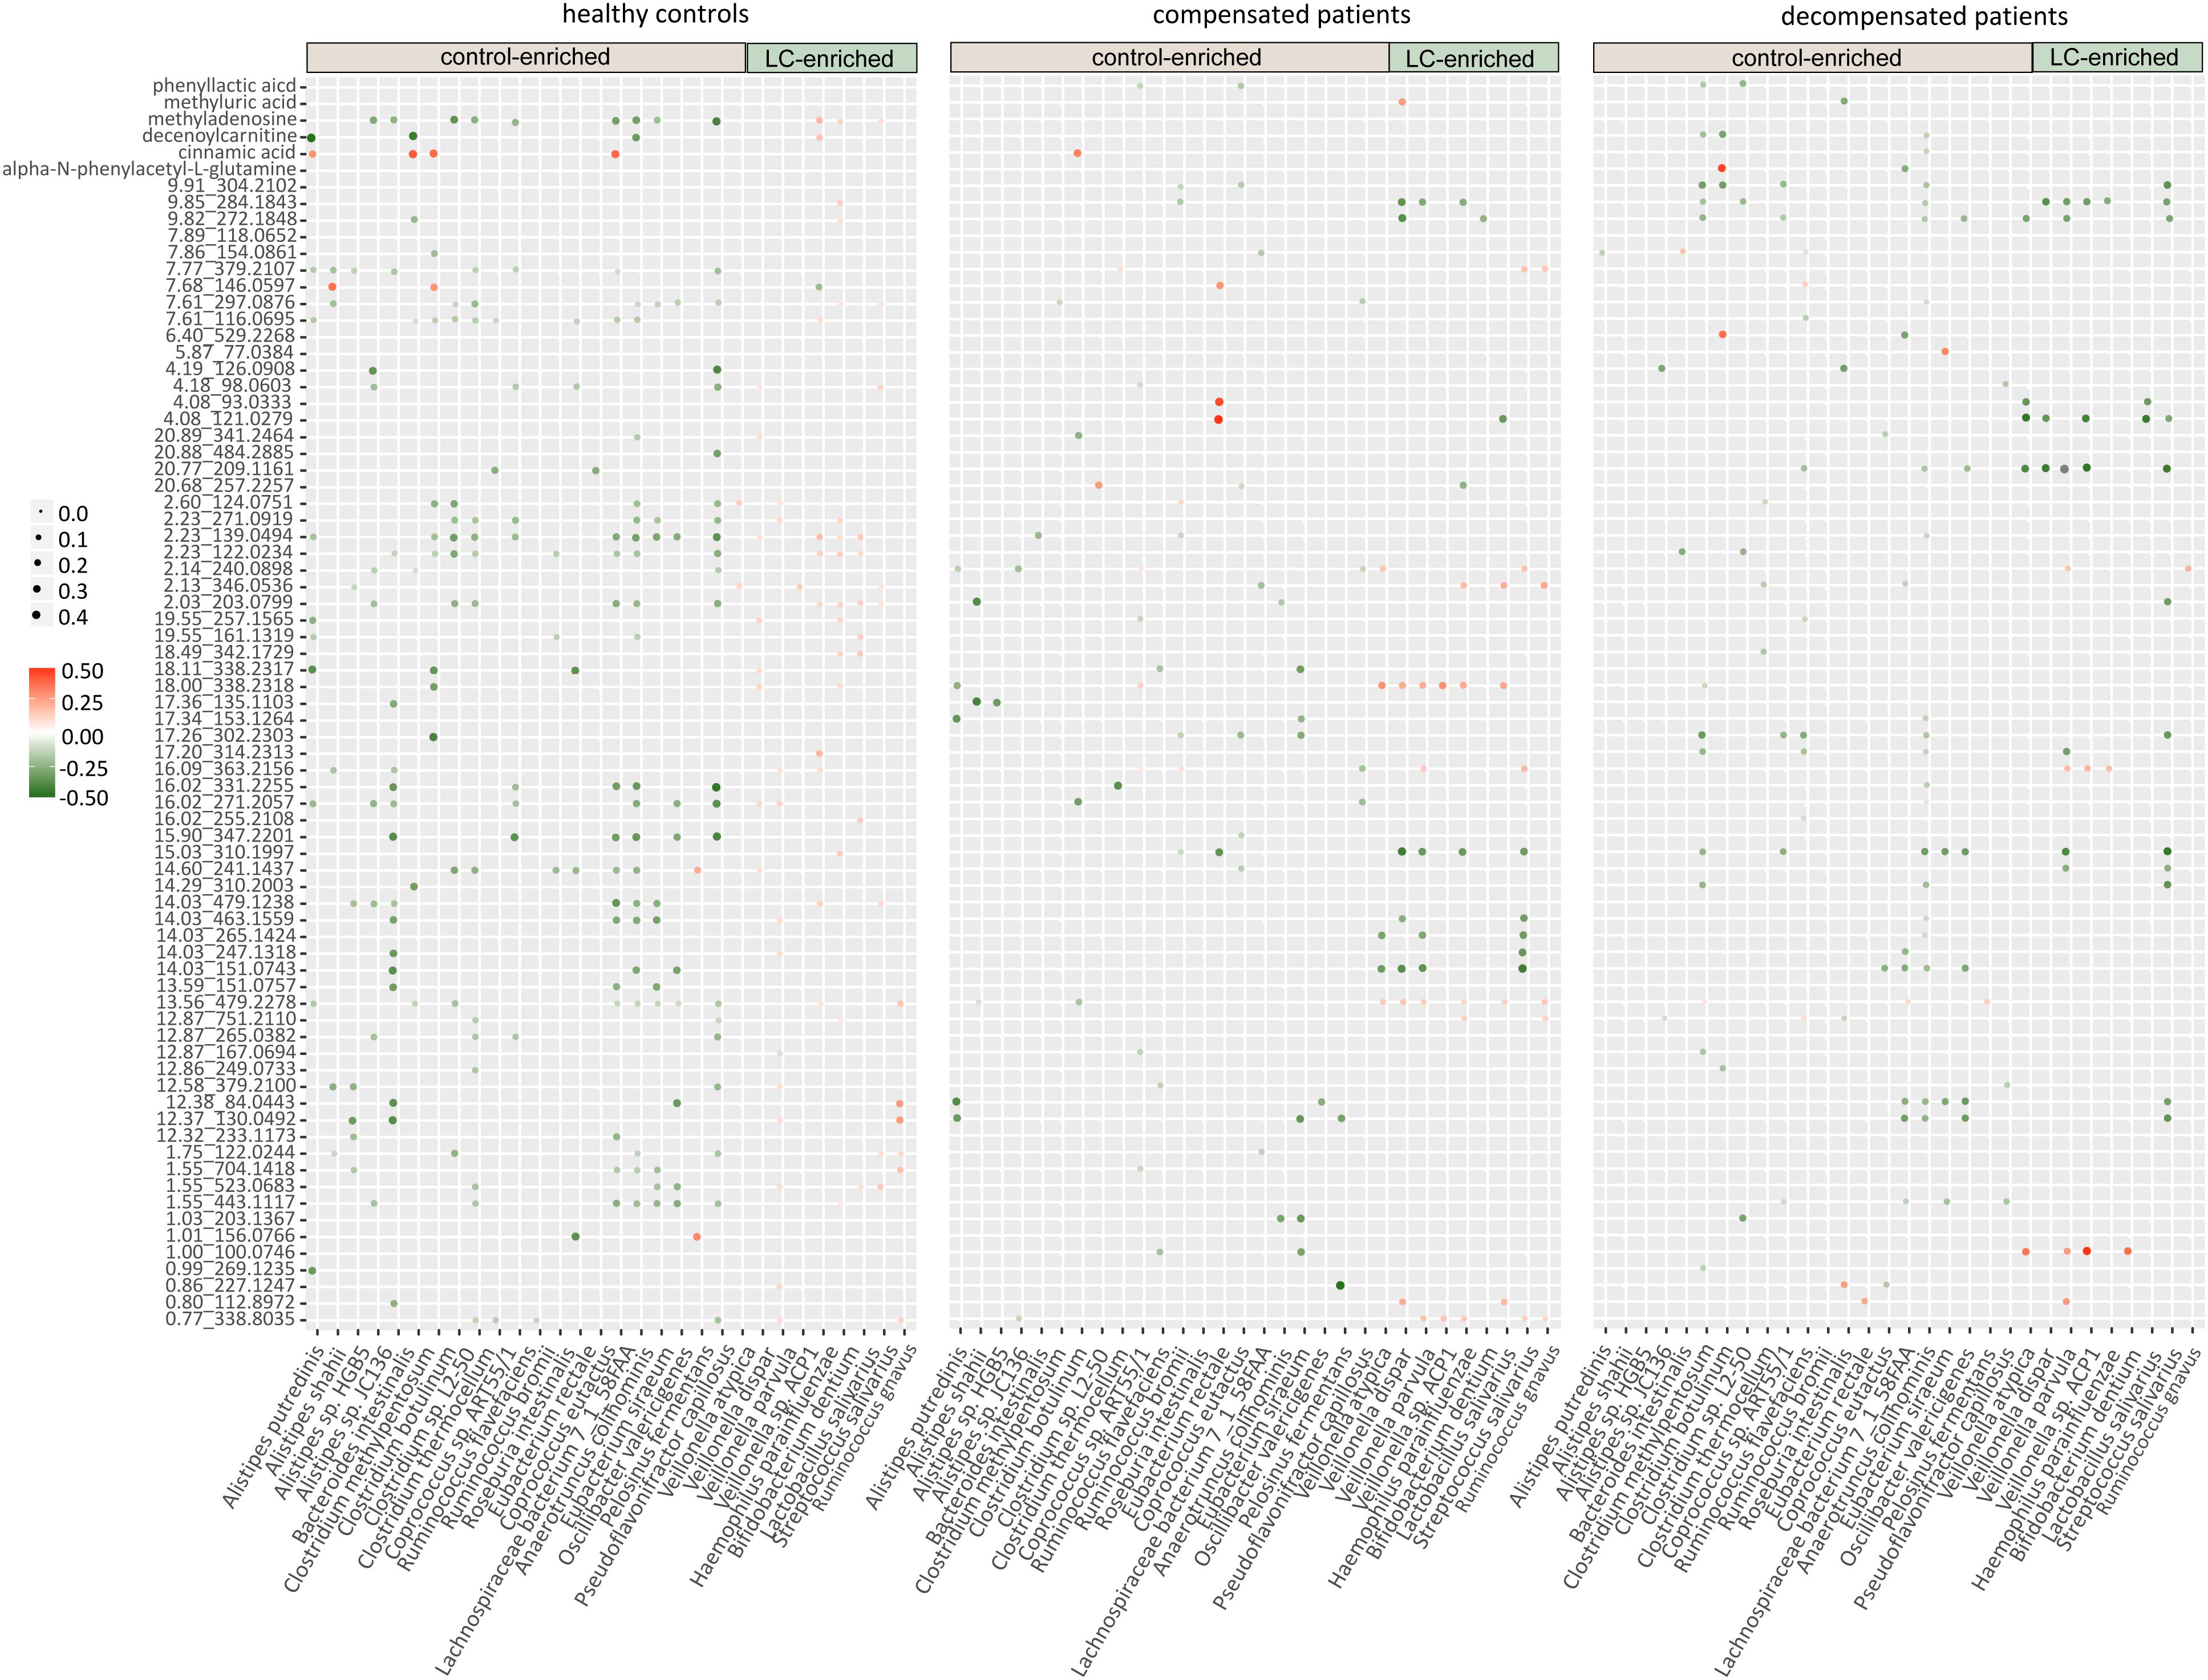
Figure 4. Heatmaps of correlations between the gut microbiome and urine metabolites in healthy controls, compensated and decompensated patients.
The extensive connections for healthy control-enriched species conformed to high microbial diversity and indicated sharing of metabolites, while the reduced number of connections in compensated and decompensated patients may be associated with downregulation of the corresponding species and thus metabolic capability. The positive correlations observed for LC-enriched species in healthy controls indicates the co-existence of pathogenic species in low abundance in healthy state. The patterns and strength of these connections altered in compensated and decompensated patients probably due to the newly formed niches resulting from microbial dysbiosis. Such phenomenon may either be an underlying reason or result of disordered intestinal microbiota. However, our results clearly support the theory that microbiome–metabolite interactions are altered in association with gut microbial dysbiosis during disease progression.
Modified Functions of Gut Microbiome During LC Progression
Functions of genes involved in the 30 differential species were further evaluated based on the SEED database (Silva et al., 2016). Significant variations were observed in multiple functions at various levels during LC progression (Figure 5 and Supplementary Figure S4). The ability of microbiome to degrade plant cell wall polysaccharides was reduced during disease progression, as evident from the decreased function cellulosome complexes, intricate multi-enzyme machines designed by microorganisms for efficient degradation of plant cell wall polysaccharides (Doi and Kosugi, 2004). Meanwhile, tricarboxylate transporter and functions associated with respiration, including respiratory complex I, anaerobic respiratory reductases, ATP synthases and sodium ion-coupled energetics, reduced during disease progression. Functions associated with CO2 uptake and fixation and acetyl-CoA fermentation to butyrate were additionally suppressed. With regard to amino acids and derivatives, functions including branched-chain amino acids synthesis, arginine biosynthesis extended, alanine biosynthesis, and urea decomposition decreased, whereas functions such as threonine and homoserine biosynthesis and histidine biosynthesis increased in compensated and decompensated LC patients. Downregulation was observed for functions protein folding, inteins, bacterial translation initiation and translation termination factors, bacterial ribosome small subunit (SSU) and large subunit (LSU), and lipoprotein biosynthesis. Moreover, functions associated with DNA metabolism, such as replication and recombination, were downregulated, while stress responses (including oxidative stress, osmoregulation, periplasmic stress response and others) were upregulated. Detailed information on functions is provided in Supplementary Table S7.
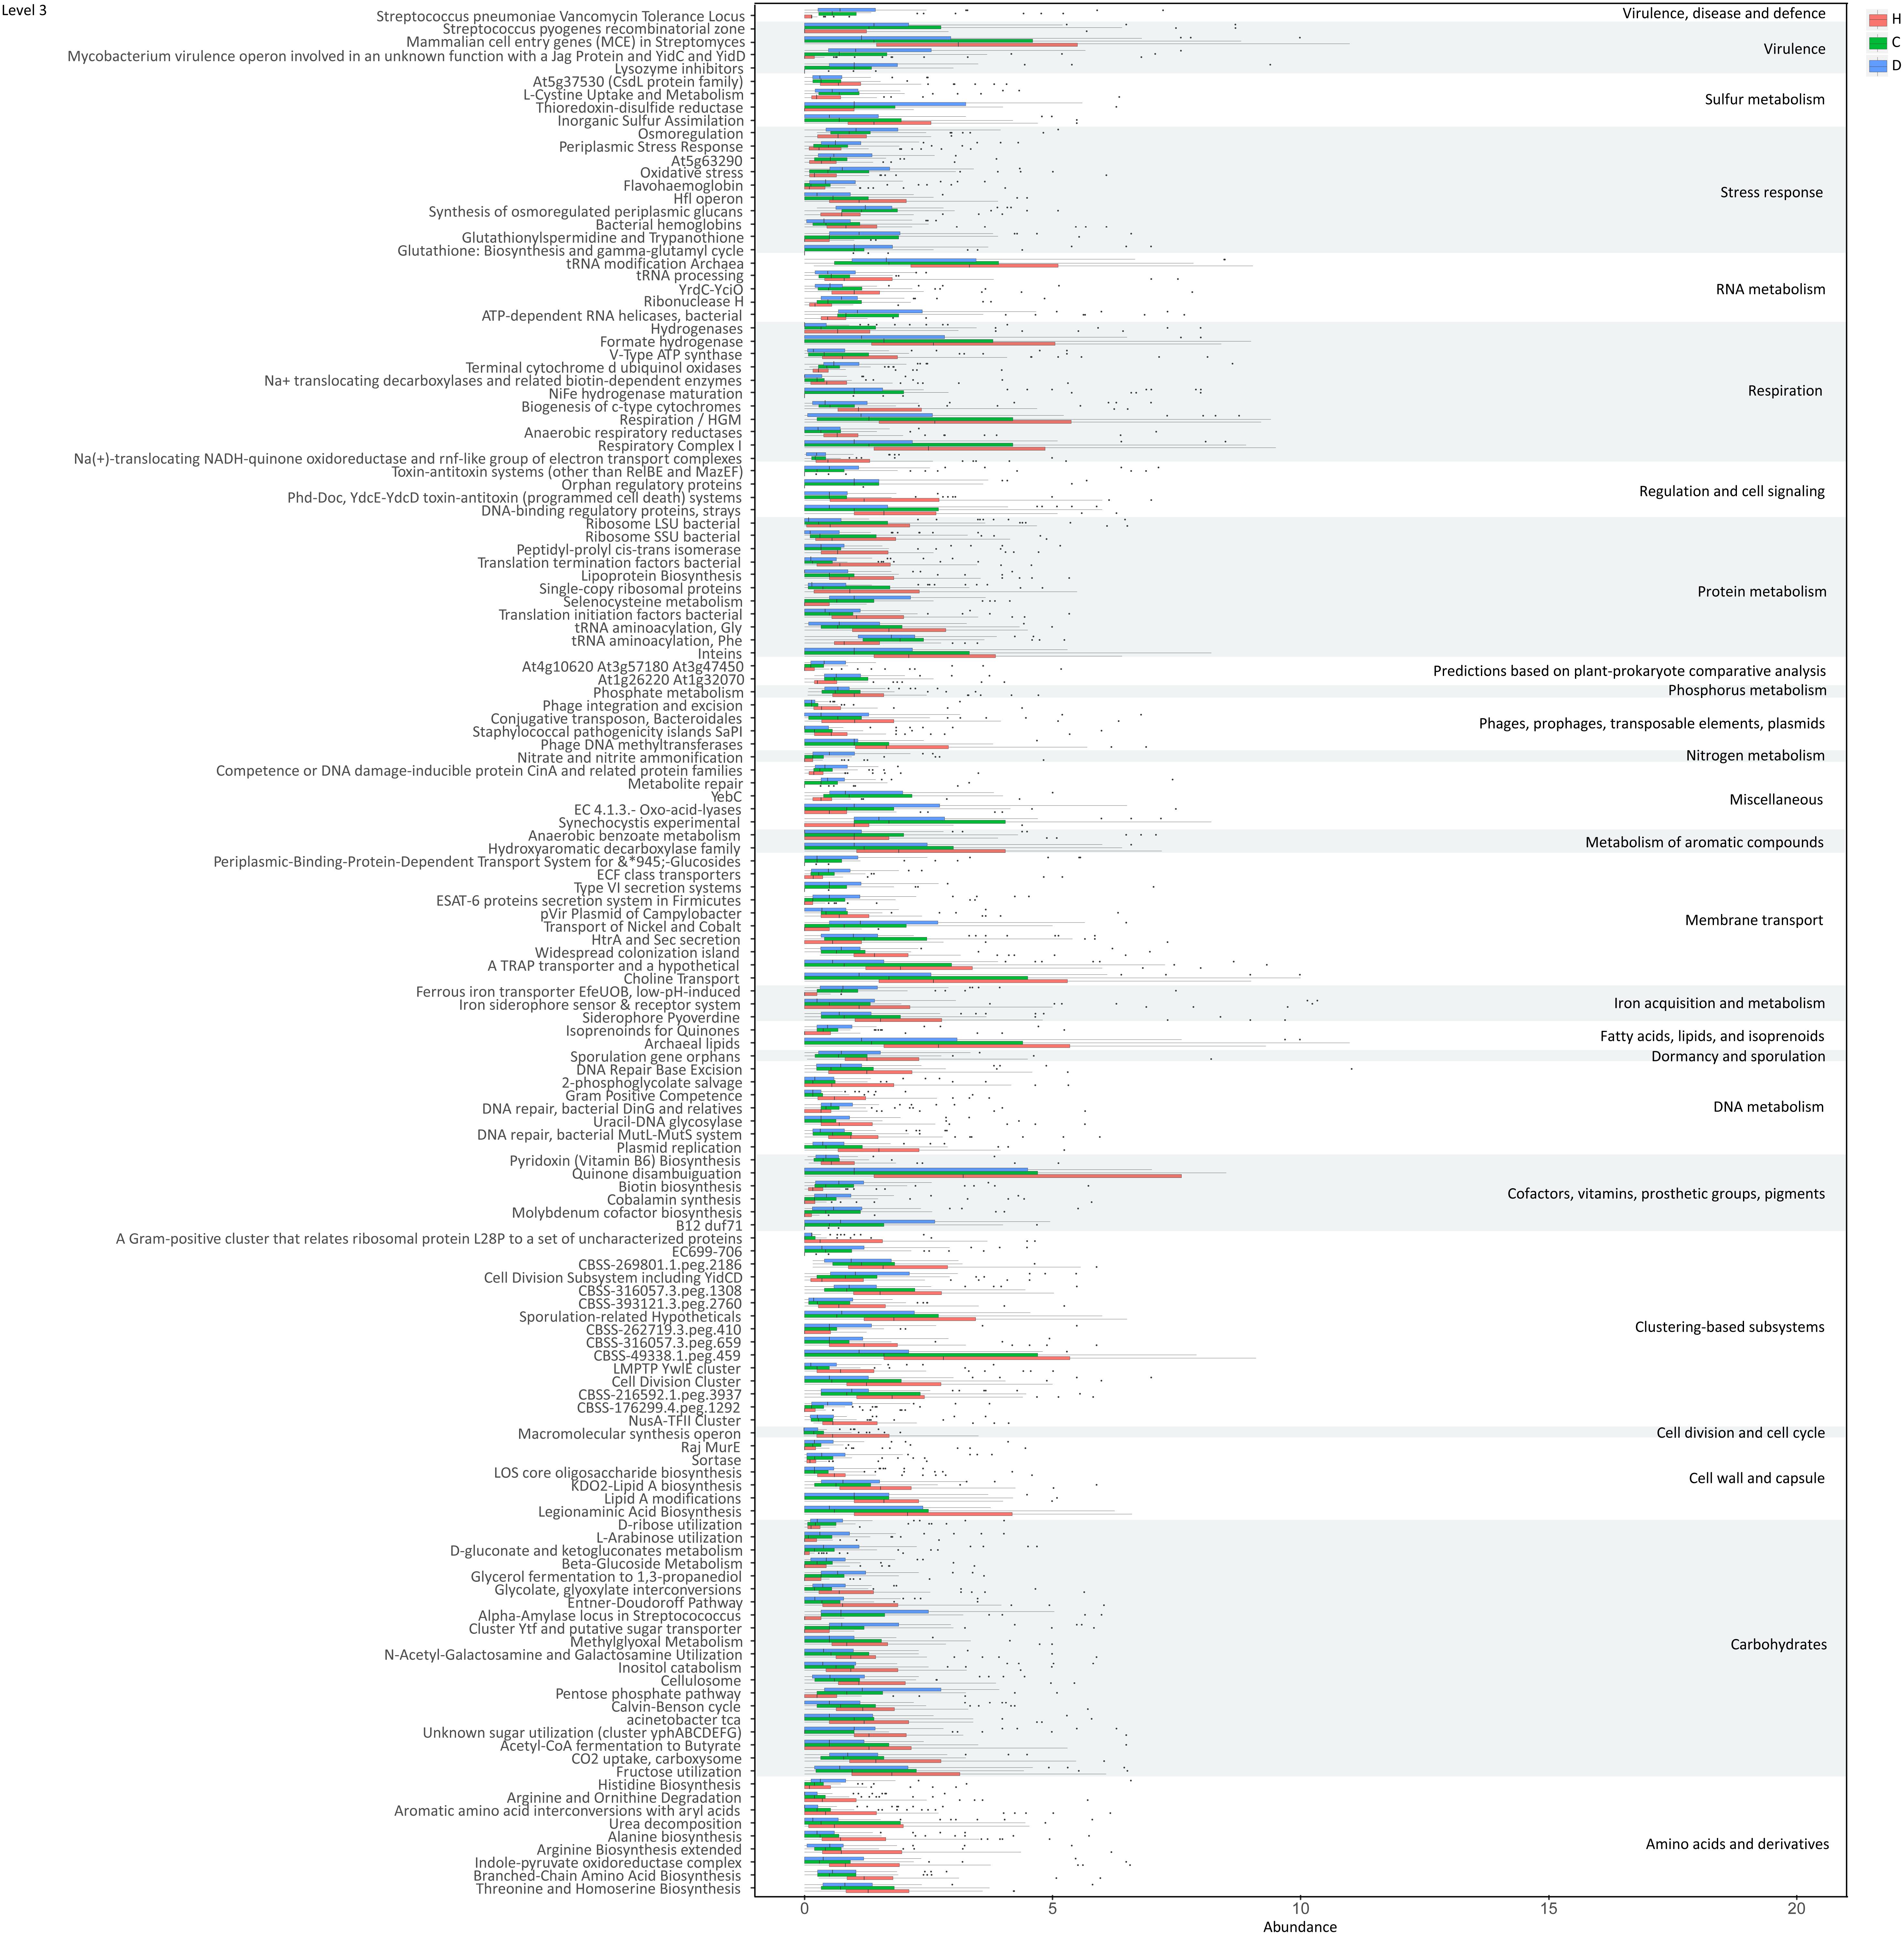
Figure 5. Functions varied during liver cirrhosis progression at level 3.
Discussion
We conducted a meta-omics-based study to evaluate the dynamics and potential roles of gut microbiome in LC progression. It is found that gut microbial gene richness, microbial richness and species diversity decreased, and that patterns of gut microbiome varied during disease progression. Moreover, significant correlations were observed between microbial richness and clinical indices ALB and TB (factors associated with liver function). Thus, we propose that gut microbiome is associated with LC progression.
Our results indicate impaired capability of biomass fermentation in cirrhotic patients, from the gradual decrease of multiple species that can ferment plant cell wall polysaccharides and resistant starch (Xu et al., 2012), and of function cellulosome (Doi and Kosugi, 2004; Figure 5). On the other hand, sugar biomass can be fermented by bacteria with phenylalanine ammonia lyase to phenylalanine as the intermediate and further deaminated to cinnamic acid (Masuo et al., 2016) or decarboxylated to phenylethylamine (Supplementary Figure S5). Phenylethylamine is subsequently metabolized to phenylacetyl-CoA in liver and kidney and subsequently conjugates with glutamine to form phenylacetylglutamine (Aronov et al., 2011). Moreover, glucose, a sugar biomass fermentation intermediate, can be fermented by bacteria with D-phenyllactate reductase to phenylpyruvate and further converted to cinnamic acid by specific species, such as Clostridium sporogenes (Masuo et al., 2016). Thus, the sequential decrease in the urine metabolites cinnamic acid, phenylacetylglutamine, and phenyllactic acid (Figure 3D) further confirmed impaired sugar biomass fermentation during LC progression (Figure 6).
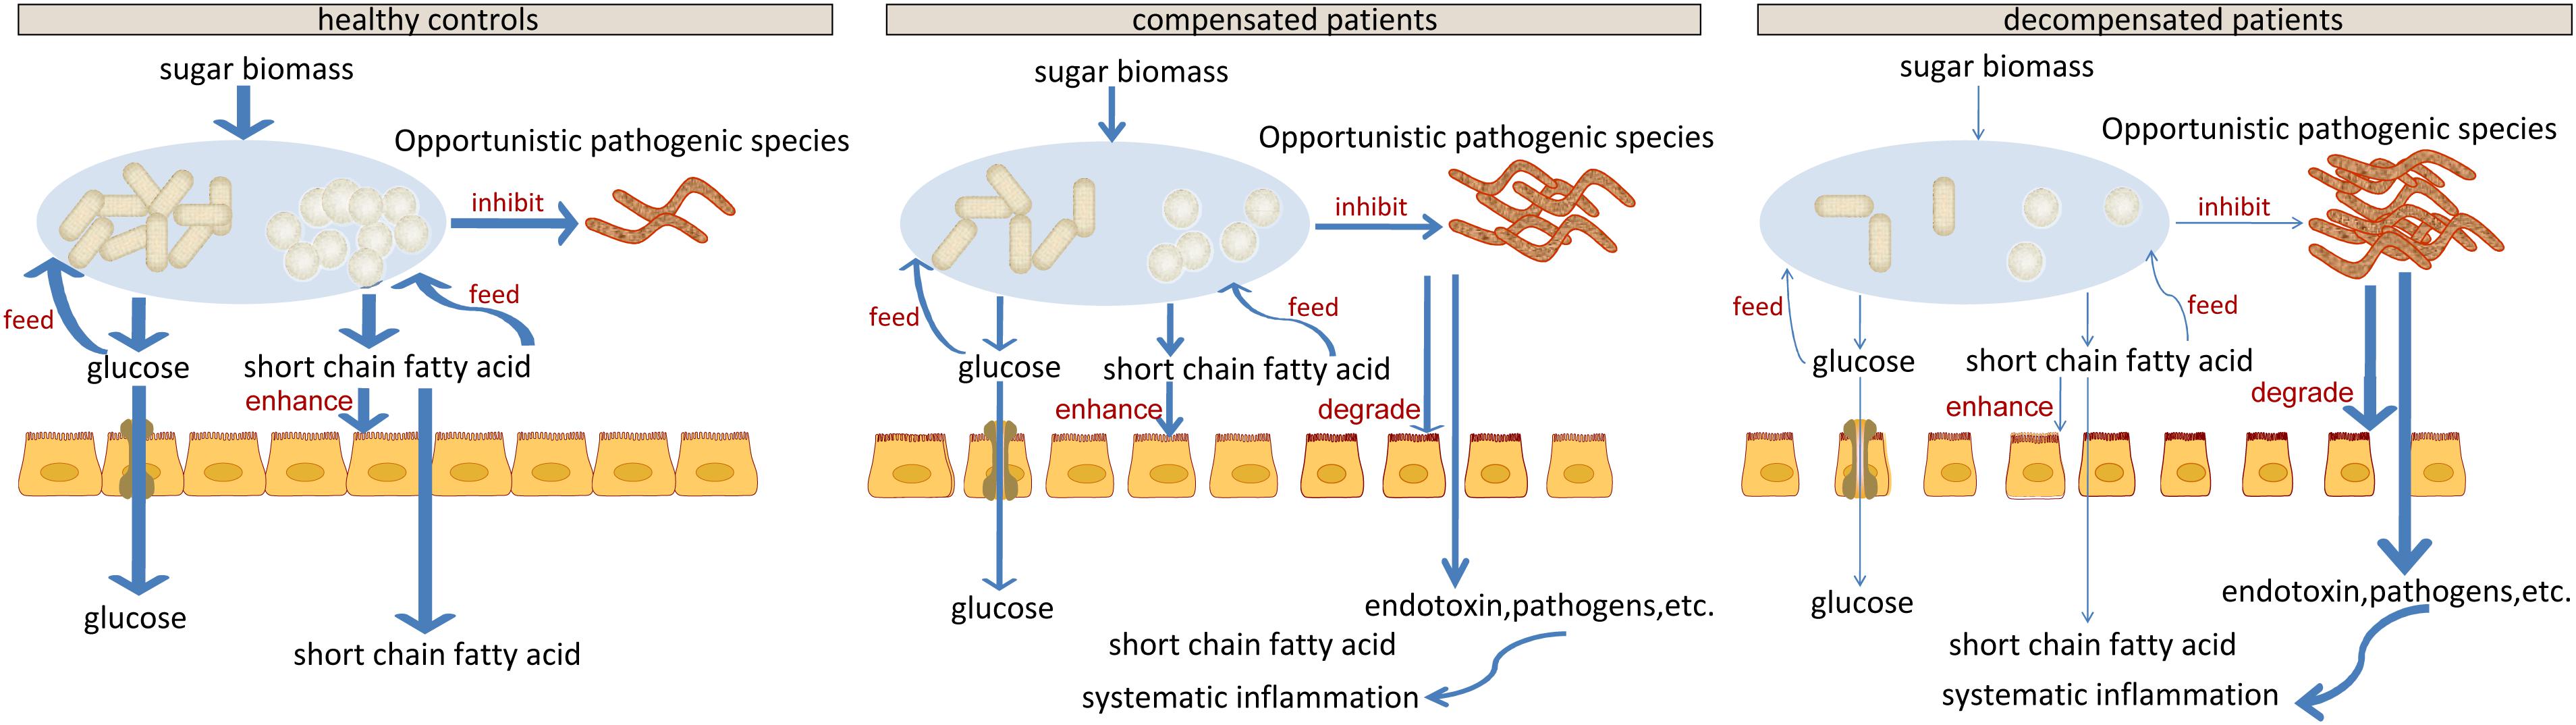
Figure 6. Schematic diagram showing the potential roles of gut microbiota constituents during liver cirrhosis progression.
Cell-wall polysaccharide and resistant starch generate a variety of metabolites by microbiome, such as glucose and short-chain fatty acids (SCFA). Similar to glucose, SCFAs are also reported to act as energy sources for hosts and play important roles in intestinal homeostasis (Riviere et al., 2015). The gradual decrease in respiration and tricarboxylate transporter-associated functions during LC progression (Figures 5 and Supplementary Figure S4) implied that the impaired sugar biomass fermentation in patients contributed to the reduced supply of the above energy sources, which further contributed to the disorganized self-feeding and cross-feeding networks among microbiota (Figure 3A). The continuous increase in urinary methyladenosine, a modified nucleoside reflecting RNA degradation in the organism (Scorrano et al., 2010), in compensated and decompensated patients might be suggestive of breakdown of microbiota during disease progression. Conversely, some opportunistic pathogens, including V. atypica, V. dispar, V. parvula, and V. sp. ACP1, thrived during LC progression, which may be explained by reduced suppressive regulations by other dominant bacteria that are downregulated in these patients (Figure 6).
Recent studies suggest that degradation and fermentation of carbohydrates into SCFAs in cross–feeding relationships between microbial groups determine the level of permeability (Chung et al., 2016). Among the SCFAs produced in the human colon, butyrate has drawn the most attention as it is an essential energy source for colon epithelial cells and benefits intestinal barrier function (Kelly et al., 2015). Data from this study showed that butyrate-producing bacteria, such as E. rectale, C. eutacus, and Anaerotruncus colihominis, as well as the function acetyl-CoA fermentation to butyrate (Figure 5) are markedly downregulated in LC patients, compared to healthy controls, while R. gnavus, implicated in the degradation of elements from the mucus layer (Graziani et al., 2016), is upregulated. Moreover, it is reported that the gut microbiota resorts to host-secreted mucus glycoproteins as a nutrient source during dietary fiber deficiency, leading to erosion of the colonic mucus barrier (Desai et al., 2016). Thus, reduced biomass fermentation may provide an explanation for impaired intestinal barrier function in LC (Scarpellini et al., 2010; Du Plessis et al., 2013). Under these circumstances, increased infiltration of endotoxins and pathogens from the gut to the peripheral circulation is always accompanied by systematic inflammation (Arroyo et al., 2014). Another report showed that butyrate regulates the proliferation and activation of regulatory T cells in the colon and increases the capacity of regulatory T cells to suppress proliferation of effector CD4+ cells in mice (Nylund et al., 2015). Therefore, reduction of biomass fermentation and the resulting reduced butyrate supply may also be responsible for exacerbation of the infection.
In agreement with the reported increase in bacterial translocation in cirrhotic patients, B. dentium, an opportunistic pathogen that mainly inhabits the oral cavity (Xu et al., 2012), and H. parainfluenzae residing primarily in the human upper respiratory tract (Young and Hood, 2013) increased during disease progression. Surprisingly, L. salivarius, and S. salivarius levels also increased during disease progression in the current study. Treatment with dead L. salivarius has been shown to decrease intestinal permeability and endotoxin-induced inflammation in diabetic patients (Chung et al., 2016). S. salivarius affects immune responses by inhibiting inflammatory pathways activated by pathogens (Kaci et al., 2014), and low molecular-weight metabolites in the culture supernatants of S. salivarius are reported to exert in vitro anti-inflammatory activity in intestinal epithelial as well as immune cells (Kaci et al., 2011). Therefore, the increase in these two bacteria may indicate upregulated stress response in LC patients, consistent with the upregulation of various functions associated with stress response during disease progression (Figure 5 and Supplementary Figure S4).
Conclusion
Our data implied a direct link between microbiome changes and LC via metabolites. The metabolic capability of gut microbiome, which played important roles in maintaining the homeostasis of gut microbial system, the normal intestinal barrier function and the immune homeostasis of host, contributed to LC progression. However, due to the limitations of current sequencing and data processing techniques, only partial roles of the gut microbiome have been proposed. With the development of the above techniques, future studies focusing on global microbial system without pre-filtering may provide a more comprehensive picture of roles of gut microbiome, such as the immune response triggered by changes in the microbiota, in LC progression. Detailed resolution of the communication network in gut microbiome may aid in identifying key bacteria, which may be manipulated to slow down and/or reverse the development of LC.
Availability of Data and Materials
The metagenomic datasets used during the current study are available from the in the European Bioinformatics Institute European Nucleotide Archive under accession number ERP005860 (https://www.ebi.ac.uk/ena/data/view/PRJEB6337).
Author Contributions
LL, ZL, and LS conceived and designed the experiments. ZL, DC, and FY performed the experiments. LS and YL analyzed the data. LS and ZL wrote the paper and edited the manuscript. The final manuscript was read and approved by all authors.
Funding
The present study was funded by grants from the National Natural Science Foundation of China (Nos. 31500678, 31870839, 81771724, 31700800, and 81790633) and a supportive project from Beijing Institute of Biomedical Engineering.
Conflict of Interest Statement
The authors declare that the research was conducted in the absence of any commercial or financial relationships that could be construed as a potential conflict of interest.
Acknowledgments
We thank all the participants who recruited patients in this study.
Supplementary Material
The Supplementary Material for this article can be found online at: https://www.frontiersin.org/articles/10.3389/fmicb.2018.03166/full#supplementary-material
FIGURE S1 | Scatter plot of healthy controls, compensated and decompensated patients on the first three axes of PCoA analysis. (A) Scatter plot of healthy controls and compensated patients. (B) Scatter plot of healthy controls and decompensated patients. (C) Scatter plot of compensated and decompensated patients. (D) Scatter plot of healthy controls, compensated and decompensated patients.
FIGURE S2 | Illustration of the final 30 differential species. (A) Circular representations of taxonomic and phylogenetic trees of the final 30 differential species. (B) Relative abundance of the above 30 species in healthy controls, compensated and decompensated patients based on co-abundant gene clustering analysis.
FIGURE S3 | MS/MS spectra of six identified metabolites in samples (A) and standards (B).
FIGURE S4 | Functions varied during liver cirrhosis progression at level 1 (A) and level 2 (B).
FIGURE S5 | Schematic illustration of specific pathways in sugar biomass fermentation.
TABLE S1 | Detailed clinical information for all patients and healthy volunteers.
TABLE S2 | Detailed information on microbial gene richness, gene richness, and Shannon index for each sample.
TABLE S3 | Detailed information on the correlation analysis between microbial richness and clinical indices.
TABLE S4 | Detailed information on edges of the inter-microbiome correlation networks in each group.
TABLE S5 | Detailed information on some edges enhanced in compensated patients as compared to healthy controls.
TABLE S6 | Detailed information on retention time, molecular weight and VIP value for 75 differential metabolites.
TABLE S7 | Detailed information on functional annotations in various levels.
Footnotes
- ^ http://hannonlab.cshl.edu/fastx_toolkit
- ^ http://soap.genomics.org.cn/down/soap.coverage.tar.gz
- ^ http://www.hmdb.ca/
- ^ http://www.hmdb.ca/
References
Aronov, P. A., Luo, F. J., Plummer, N. S., Quan, Z., Holmes, S., Hostetter, T. H., et al. (2011). Colonic contribution to uremic solutes. J. Am. Soc. Nephrol. 22, 1769–1776. doi: 10.1681/ASN.2010121220
Arroyo, V., Garcia-Martinez, R., and Salvatella, X. (2014). Human serum albumin, systemic inflammation, and cirrhosis. J. Hepatol. 61, 396–407. doi: 10.1016/j.jhep.2014.04.012
Bajaj, J. S., O’leary, J. G., Reddy, K. R., Wong, F., Olson, J. C., Subramanian, R. M., et al. (2012). Second infections independently increase mortality in hospitalized patients with cirrhosis: the North American consortium for the study of end-stage liver disease (NACSELD) experience. Hepatology 56, 2328–2335. doi: 10.1002/hep.25947
Besemer, J., and Borodovsky, M. (1999). Heuristic approach to deriving models for gene finding. Nucleic Acids Res. 27, 3911–3920. doi: 10.1093/nar/27.19.3911
Betrapally, N. S., Gillevet, P. M., and Bajaj, J. S. (2016). Changes in the intestinal microbiome and alcoholic and nonalcoholic liver diseases: causes or effects? Gastroenterology 150, 1745–1755. doi: 10.1053/j.gastro.2016.02.073.
Bouter, K. E., Van Raalte, D. H., Groen, A. K., and Nieuwdorp, M. (2017). Role of the gut microbiome in the pathogenesis of obesity and obesity-related metabolic dysfunction. Gastroenterology 152, 1671–1678. doi: 10.1053/j.gastro.2016.12.048
Chung, P. H., Wu, Y. Y., Chen, P. H., Fung, C. P., Hsu, C. M., and Chen, L. W. (2016). Lactobacillus salivarius reverse diabetes-induced intestinal defense impairment in mice through non-defensin protein. J. Nutr. Biochem. 35, 48–57. doi: 10.1016/j.jnutbio.2016.05.013
Del Chierico, F., Nobili, V., Vernocchi, P., Russo, A., Stefanis, C., Gnani, D., et al. (2017). Gut microbiota profiling of pediatric nonalcoholic fatty liver disease and obese patients unveiled by an integrated meta-omics-based approach. Hepatology 65, 451–464. doi: 10.1002/hep.28572
Desai, M. S., Seekatz, A. M., Koropatkin, N. M., Kamada, N., Hickey, C. A., Wolter, M., et al. (2016). A dietary fiber-deprived gut microbiota degrades the colonic mucus barrier and enhances pathogen susceptibility. Cell 167, 1339–1353. doi: 10.1016/j.cell.2016.10.043.
Doi, R. H., and Kosugi, A. (2004). Cellulosomes: plant-cell-wall-degrading enzyme complexes. Nat. Rev. Microbiol. 2, 541–551. doi: 10.1038/nrmicro925
Du Plessis, J., Vanheel, H., Janssen, C. E., Roos, L., Slavik, T., Stivaktas, P. I., et al. (2013). Activated intestinal macrophages in patients with cirrhosis release NO and IL-6 that may disrupt intestinal barrier function. J. Hepatol. 58, 1125–1132. doi: 10.1016/j.jhep.2013.01.038
Friedman, J., and Alm, E. J. (2012). Inferring correlation networks from genomic survey data. PLoS Comput. Biol. 8:e1002687. doi: 10.1371/journal.pcbi.1002687
Goodrich, J. K., Di Rienzi, S. C., Poole, A. C., Koren, O., Walters, W. A., Caporaso, J. G., et al. (2014). Conducting a microbiome study. Cell 158, 250–262. doi: 10.1016/j.cell.2014.06.037
Graziani, F., Pujol, A., Nicoletti, C., Dou, S., Maresca, M., Giardina, T., et al. (2016). Ruminococcus gnavus E1 modulates mucin expression and intestinal glycosylation. J. Appl. Microbiol. 120, 1403–1417. doi: 10.1111/jam.13095
Kaci, G., Goudercourt, D., Dennin, V., Pot, B., Dore, J., Ehrlich, S. D., et al. (2014). Anti-inflammatory properties of Streptococcus salivarius, a commensal bacterium of the oral cavity and digestive tract. Appl. Environ. Microbiol. 80, 928–934. doi: 10.1128/AEM.03133-13
Kaci, G., Lakhdari, O., Dore, J., Ehrlich, S. D., Renault, P., Blottiere, H. M., et al. (2011). Inhibition of the NF-kappaB pathway in human intestinal epithelial cells by commensal Streptococcus salivarius. Appl. Environ. Microbiol. 77, 4681–4684. doi: 10.1128/AEM.03021-10
Kelly, C. J., Zheng, L., Campbell, E. L., Saeedi, B., Scholz, C. C., Bayless, A. J., et al. (2015). Crosstalk between microbiota-derived short-chain fatty acids and intestinal epithelial hif augments tissue barrier function. Cell Host Microbe 17, 662–671. doi: 10.1016/j.chom.2015.03.005
Kultima, J. R., Sunagawa, S., Li, J., Chen, W., Chen, H., Mende, D. R., et al. (2012). MOCAT: a metagenomics assembly and gene prediction toolkit. PLoS One 7:e47656. doi: 10.1371/journal.pone.0047656
Lachar, J., and Bajaj, J. S. (2016). Changes in the microbiome in cirrhosis and relationship to complications: hepatic encephalopathy, spontaneous bacterial peritonitis, and sepsis. Semin. Liver Dis. 36, 327–330. doi: 10.1055/s-0036-1593881
Le Chatelier, E., Nielsen, T., Qin, J., Prifti, E., Hildebrand, F., Falony, G., et al. (2013). Richness of human gut microbiome correlates with metabolic markers. Nature 500, 541–546. doi: 10.1038/nature12506
Li, W., and Godzik, A. (2006). Cd-hit: a fast program for clustering and comparing large sets of protein or nucleotide sequences. Bioinformatics 22, 1658–1659. doi: 10.1093/bioinformatics/btl158
Llorente, C., and Schnabl, B. (2015). The gut microbiota and liver disease. Cell Mol. Gastroenterol. Hepatol. 1, 275–284. doi: 10.1016/j.jcmgh.2015.04.003
Luo, C., Rodriguez, R. L., and Konstantinidis, K. T. (2014). MyTaxa: an advanced taxonomic classifier for genomic and metagenomic sequences. Nucleic Acids Res. 42, e73. doi: 10.1093/nar/gku169
Luo, R., Liu, B., Xie, Y., Li, Z., Huang, W., Yuan, J., et al. (2012). SOAPdenovo2: an empirically improved memory-efficient short-read de novo assembler. Gigascience 1:18. doi: 10.1186/2047-217X-1-18
Marino, E., Richards, J. L., Mcleod, K. H., Stanley, D., Yap, Y. A., Knight, J., et al. (2017). Gut microbial metabolites limit the frequency of autoimmune T cells and protect against type 1 diabetes. Nat. Immunol. 18, 552–562. doi: 10.1038/ni.3713
Masuo, S., Kobayashi, Y., Oinuma, K., and Takaya, N. (2016). Alternative fermentation pathway of cinnamic acid production via phenyllactic acid. Appl. Microbiol. Biotechnol. 100, 8701–8709. doi: 10.1007/s00253-016-7623-4
Nakatsu, G., Li, X., Zhou, H., Sheng, J., Wong, S. H., Wu, W. K., et al. (2015). Gut mucosal microbiome across stages of colorectal carcinogenesis. Nat. Commun. 6:8727. doi: 10.1038/ncomms9727
Nicholson, J. K., Holmes, E., and Wilson, I. D. (2005). Gut microorganisms, mammalian metabolism and personalized health care. Nat. Rev. Microbiol. 3, 431–438. doi: 10.1038/nrmicro1152
Nylund, L., Nermes, M., Isolauri, E., Salminen, S., De Vos, W. M., and Satokari, R. (2015). Severity of atopic disease inversely correlates with intestinal microbiota diversity and butyrate-producing bacteria. Allergy 70, 241–244. doi: 10.1111/all.12549
Pande, S., and Kost, C. (2017). Bacterial unculturability and the formation of intercellular metabolic networks. Trends Microbiol. 25, 349–361. doi: 10.1016/j.tim.2017.02.015
Qin, J., Li, Y., Cai, Z., Li, S., Zhu, J., Zhang, F., et al. (2012). A metagenome-wide association study of gut microbiota in type 2 diabetes. Nature 490, 55–60. doi: 10.1038/nature11450
Qin, N., Yang, F., Li, A., Prifti, E., Chen, Y., Shao, L., et al. (2014). Alterations of the human gut microbiome in liver cirrhosis. Nature 513, 59–64. doi: 10.1038/nature13568
Riviere, A., Gagnon, M., Weckx, S., Roy, D., and De Vuyst, L. (2015). Mutual Cross-feeding interactions between Bifidobacterium longum subsp. longum NCC2705 and Eubacterium rectale ATCC 33656 Explain the Bifidogenic and Butyrogenic Effects of Arabinoxylan Oligosaccharides. Appl. Environ. Microbiol. 81, 7767–7781. doi: 10.1128/AEM.02089-15
Scarpellini, E., Valenza, V., Gabrielli, M., Lauritano, E. C., Perotti, G., Merra, G., et al. (2010). Intestinal permeability in cirrhotic patients with and without spontaneous bacterial peritonitis: is the ring closed? Am. J. Gastroenterol. 105, 323–327. doi: 10.1038/ajg.2009.558
Schuppan, D., and Afdhal, N. H. (2008). Liver cirrhosis. Lancet 371, 838–851. doi: 10.1016/S0140-6736(08)60383-9
Scorrano, S., Longo, L., and Vasapollo, G. (2010). Molecularly imprinted polymers for solid-phase extraction of 1-methyladenosine from human urine. Anal. Chim. Acta 659, 167–171. doi: 10.1016/j.aca.2009.11.046
Segata, N., Izard, J., Waldron, L., Gevers, D., Miropolsky, L., Garrett, W. S., et al. (2011). Metagenomic biomarker discovery and explanation. Genome Biol. 12:R60. doi: 10.1186/gb-2011-12-6-r60
Shannon, P., Markiel, A., Ozier, O., Baliga, N. S., Wang, J. T., Ramage, D., et al. (2003). Cytoscape: a software environment for integrated models of biomolecular interaction networks. Genome Res. 13, 2498–2504. doi: 10.1101/gr.1239303
Silva, G. G., Green, K. T., Dutilh, B. E., and Edwards, R. A. (2016). SUPER-FOCUS: a tool for agile functional analysis of shotgun metagenomic data. Bioinformatics 32, 354–361. doi: 10.1093/bioinformatics/btv584
Stewart, C. J., Embleton, N. D., Marrs, E. C. L., Smith, D. P., Fofanova, T., Nelson, A., et al. (2017). Longitudinal development of the gut microbiome and metabolome in preterm neonates with late onset sepsis and healthy controls. Microbiome 5:75. doi: 10.1186/s40168-017-0295-1
Tilg, H., Cani, P. D., and Mayer, E. A. (2016). Gut microbiome and liver diseases. Gut 65, 2035–2044. doi: 10.1136/gutjnl-2016-312729
Tsochatzis, E. A., Bosch, J., and Burroughs, A. K. (2014). Liver cirrhosis. Lancet 383, 1749–1761. doi: 10.1016/S0140-6736(14)60121-5
Xu, M., Wang, B., Fu, Y., Chen, Y., Yang, F., Lu, H., et al. (2012). Changes of fecal Bifidobacterium species in adult patients with hepatitis B virus-induced chronic liver disease. Microb. Ecol. 63, 304–313. doi: 10.1007/s00248-011-9925-5
Yan, A. W., Fouts, D. E., Brandl, J., Starkel, P., Torralba, M., Schott, E., et al. (2011). Enteric dysbiosis associated with a mouse model of alcoholic liver disease. Hepatology 53, 96–105. doi: 10.1002/hep.24018
Young, R. E., and Hood, D. W. (2013). Haemophilus parainfluenzae has a limited core lipopolysaccharide repertoire with no phase variation. Glycoconj. J. 30, 561–576. doi: 10.1007/s10719-012-9455-5
Yu, J., Feng, Q., Wong, S. H., Zhang, D., Liang, Q. Y., Qin, Y., et al. (2017). Metagenomic analysis of faecal microbiome as a tool towards targeted non-invasive biomarkers for colorectal cancer. Gut 66, 70–78. doi: 10.1136/gutjnl-2015-309800
Keywords: liver cirrhosis, progression, gut microbiome, metagenomics, metabolomics
Citation: Shao L, Ling Z, Chen D, Liu Y, Yang F and Li L (2018) Disorganized Gut Microbiome Contributed to Liver Cirrhosis Progression: A Meta-Omics-Based Study. Front. Microbiol. 9:3166. doi: 10.3389/fmicb.2018.03166
Received: 10 August 2018; Accepted: 07 December 2018;
Published: 18 December 2018.
Edited by:
George Tsiamis, University of Patras, GreeceReviewed by:
Christopher L. Hemme, University of Rhode Island, United StatesJiaming Liu, Dean Associates, United Kingdom
Copyright © 2018 Shao, Ling, Chen, Liu, Yang and Li. This is an open-access article distributed under the terms of the Creative Commons Attribution License (CC BY). The use, distribution or reproduction in other forums is permitted, provided the original author(s) and the copyright owner(s) are credited and that the original publication in this journal is cited, in accordance with accepted academic practice. No use, distribution or reproduction is permitted which does not comply with these terms.
*Correspondence: Lanjuan Li, bGpsaUB6anUuZWR1LmNu
†These authors have contributed equally to this work