 Murat Bağcıoğlu
 Martina Fricker
 Sophia Johler
 Monika Ehling-Schulz
- 1Functional Microbiology, Institute of Microbiology, Department of Pathobiology, University of Veterinary Medicine Vienna, Vienna, Austria
- 2Institute for Food Safety and Hygiene, Vetsuisse Faculty, University of Zurich, Zurich, Switzerland
The Bacillus cereus group comprises genetical closely related species with variable toxigenic characteristics. However, detection and differentiation of the B. cereus group species in routine diagnostics can be difficult, expensive and laborious since current species designation is linked to specific phenotypic characteristic or the presence of species-specific genes. Especially the differentiation of Bacillus cereus and Bacillus thuringiensis, the identification of psychrotolerant Bacillus mycoides and Bacillus weihenstephanensis, as well as the identification of emetic B. cereus and Bacillus cytotoxicus, which are both producing highly potent toxins, is of high importance in food microbiology. Thus, we investigated the use of a machine learning approach, based on artificial neural network (ANN) assisted Fourier transform infrared (FTIR) spectroscopy, for discrimination of B. cereus group members. The deep learning tool box of Matlab was employed to construct a one-level ANN, allowing the discrimination of the aforementioned B. cereus group members. This model resulted in 100% correct identification for the training set and 99.5% correct identification overall. The established ANN was applied to investigate the composition of B. cereus group members in soil, as a natural habitat of B. cereus, and in food samples originating from foodborne outbreaks. These analyses revealed a high complexity of B. cereus group populations, not only in soil samples but also in the samples from the foodborne outbreaks, highlighting the importance of taking multiple isolates from samples implicated in food poisonings. Notable, in contrast to the soil samples, no bacteria belonging to the psychrotolerant B. cereus group members were detected in the food samples linked to foodborne outbreaks, while the overall abundancy of B. thuringiensis did not significantly differ between the sample categories. None of the isolates was classified as B. cytotoxicus, fostering the hypothesis that the latter species is linked to very specific ecological niches. Overall, our work shows that machine learning assisted (FTIR) spectroscopy is suitable for identification of B. cereus group members in routine diagnostics and outbreak investigations. In addition, it is a promising tool to explore the natural habitats of B. cereus group, such as soil.
Introduction
Bacillus cereus, the name giving species of a group of genetically closely related species with highly variable pathogenic potential (Kolstø et al., 2009; Ehling-Schulz et al., 2011, 2019), is recognized as an important foodborne pathogen that provokes two different types of food poisoning – emesis and diarrhea (Hauge, 1955; Holmes et al., 1981). Two heat-labile tripartite protein toxin complexes, designated Nhe (non-haemolytic enterotoxin) and Hbl (haemolytic enterotoxin), have been linked to the diarrhoeal syndrome, while the emetic syndrome is caused by the depsipeptide toxin cereulide (Ehling-Schulz et al., 2004a; Stenfors Arnesen et al., 2008). Spore preparations of B. thuringiensis including its crystal toxin are commonly used biopesticides (Schnepf et al., 1998; Bravo et al., 2011) but B. thuringiensis has also been reported in the context of foodborne outbreaks and the presence of the aforementioned enterotoxin genes nhe and hbl as well as in vitro enterotoxicity has been described (Jackson et al., 1995; Gaviria Rivera et al., 2000; Johler et al., 2018). However, since in routine microbial diagnostics B. cereus and B. thuringiensis are not differentiated, the actual contribution of B. thuringiensis to foodborne outbreaks is hitherto unknown. More recently, a new B. cereus group species has been added, which is characterized by the production of a heat-labile necrotic protein enterotoxin, designated cytotoxin 1 (CytK1), and its thermotolerance (Guinebretiere et al., 2013). CytK1 has been first described in the context of a large foodborne outbreak in France, including three fatal cases (Lund et al., 2000).
In contrast to B. cereus and B. thuringiensis, which are rather ubiquitous and found in various food products, B. cytotoxicus seems to be associated with specific food products, such as mashed potato powder, potato pure and vegetable pure (Guinebretiere et al., 2013; Contzen et al., 2014; Heini et al., 2018). B. cytotoxicus represents the thermotolerant member of the B. cereus group, (showing growth between 20°C and 50°C) while B. weihenstephanensis and B. mycoides are characterized by their high psychrotolerance, allowing them to grow at 5°C (Lechner et al., 1998; Guinebretiere et al., 2008). Although the latter two species can carry the enterotoxin genes nhe and hbl, they are mainly food spoiling microorganisms and their food poisoning potential seems to be rather low (Pruss et al., 1999; Ehling-Schulz et al., 2005; Hendriksen et al., 2006; Guinebretiere et al., 2008).
Despite several attempts have been made to differentiate the closely related B. cereus group members, an easy and cost-effective method for differential diagnostics is still lacking. Especially, the discrimination of B. cereus and B. thuringiensis in routine diagnostics is a challenge because both species are genetically intermingled (Guinebretiere et al., 2008; Ehling-Schulz et al., 2011; Zheng et al., 2017) and B. thuringiensis can only be differentiated from B. cereus by the presence of the cry genes. The cry genes are located on a megaplasmid and encode the crystal, insecticidal toxins, which delineated the species B. thuringiensis (Kronstad et al., 1983; Frederiksen et al., 2006). However, the high molecular polymorphisms of the cry genes, does not allow their reliable detection by standard PCR systems. In current food microbiology routine procedures, following the guidelines of the International Organization for Standardization (ISO), distinct species of the B. cereus are therefore not differentiated but subsumed as presumptive B. cereus for identification and enumeration in feed and food (ISO 7932:2004). However, since food safety authorities are aware of the limitations of these methods, initiatives have been started to include optional tests for differential diagnostics (see e.g., ISO 7932:2004/DAM 1:2018). In line with these initiatives, we assessed the potential of Fourier Transform Infrared (FTIR) spectroscopy for differentiation of B. cereus and B. thuringiensis as well as for the identification of the other B. cereus group species described above.
FTIR spectroscopy has already been applied successfully for the rapid identification of microorganisms (Helm et al., 1991; Wenning et al., 2008; Fricker et al., 2011) as well as for typing of B. cereus isolates (Ehling-Schulz et al., 2005). With this phenotypic method the entire chemical and biochemical composition of whole cells can be obtained by the interaction of mid-infrared light and the molecules present in the cells (Naumann et al., 1991), which yields species specific features. These “spectral fingerprints” are unique for each microorganism and allow the identification and / or differentiation at different taxonomic levels (Helm et al., 1991; Beattie et al., 1998; Rebuffo-Scheer et al., 2007; Wagener et al., 2014; Johler et al., 2016). Especially if FTIR spectroscopy is coupled to artificial intelligence (AI) systems, such as artificial neural networks (ANN), it is a powerful tool in microbial diagnostics (Bosch et al., 2008; Grunert et al., 2013; Schabauer et al., 2014; Lasch et al., 2018). ANNs are networks consisting of highly interconnected neural computing elements that acquire knowledge by a learning algorithm.
Because of the specific consumer risk related to B. cereus and B. cytotoxicus, the current lack of data about the role of B. thuringiensis in foodborne outbreaks as well as the specific spoilage potential of B. mycoides and B. weihenstephanensis, we aimed to establish a rapid diagnostic system with high throughput capabilities to discriminate the aforementioned species. To this end, we deployed ANN, as a machine learning method, to construct a classification system, based on bacterial FTIR spectral fingerprints. Further, the established method was applied for population analysis of B. cereus group isolates originating from two food poisoning outbreaks caused by emetic B. cereus and from soil samples of different geographic origins.
Materials and Methods
Bacterial Strains
A collection of 160 Bacillus cereus group strains, including 60 B. cereus (34 non-emetic B. cereus, 26 emetic B. cereus), 60 B. thuringiensis, 11 B. cytotoxicus, 14 B. weihenstephanensis and 15 B. mycoides isolates, was used for the training and the validation of the developed ANN model. Details on strains are provided elsewhere (Pruss et al., 1999; Ehling-Schulz et al., 2005; Carlin et al., 2006; Fricker et al., 2007; Guinebretiere et al., 2008; Heini et al., 2018; Johler et al., 2018) and in Supplementary Table S1 of the supplemental material. Strains were grown on plate count agar (5.0 g tryptone, 2.5 g yeast extract, 1.0 g D-glucose, 15 g agar per liter) at 30°C overnight. Strains were stored on plate count agar at 6°C for up to 3 weeks before they were transferred to fresh plates.
Strains Characterization
All strains used in this study were either characterized in previous studies (see section “Bacterial Strains”), or additional tests were accomplished to assure the correct classification of the strains. The following parameters were used for strain characterization: starch hydrolysis, haemolysis, presence of the emetic toxin (ces) genes in B. cereus, the crystal toxin (cry) genes and / or the crystal toxin in B. thuringiensis and the cold shock protein A (cspA) gene in psychrotolerant strains as described (Bourque et al., 1993; Francis et al., 1998; Ehling-Schulz et al., 2004b, 2005; Hendriksen and Hansen, 2006). In addition, the pantothenate synthetase gene (panC) of selected strains was determined as described previously (Guinebretiere et al., 2008). Based on their panC sequences, strains were assigned to the phylogenetic groups described by Guinebretiere et al. (2008). The SplitsTreeTM software1 was used for SplitsTreeAnalysis of panC nucleotide sequences.
Sample Preparation and Measurements of B. cereus Group Strains by FTIR Spectroscopy
The strains stored on plate count agar were streaked on tryptone soy agar (TSA) plates (Oxoid, Germany) and incubated at 25°C for 16–18 h. From this pre-culture the cells were grown as lawns on TSA plates at 25°C for 24 h ± 30 min. Samples were prepared as described previously (Fricker et al., 2011; Grunert et al., 2013). In brief, one loop (diameter 1 mm) of bacterial cells grown as confluent lawn was transferred into a 1.5 mL microcentrifuge tube containing 100 μL of sterile deionized water. The suspension was mixed by vortexing and aliquots containing 30 μl of the suspension were transferred onto a 96 well zinc selenite (ZnSe) optical plate (Bruker Optics GmbH, Ettlingen, Germany) and left for drying at 40°C for 40 min in order to create a thin, transparent film for FTIR measurements. The FTIR measurements were carried out using an IFS 28/B spectrometer and/or a HTS-XT microplate adapter coupled to a Tensor 27 FTIR spectrometer (Bruker Optics GmbH, Ettlingen, Germany) with spectral acquisition in transmission mode in the spectral range of 4000 to 500 cm-1 using the following parameters: 6 cm-1 spectral resolution, zero-filling factor 4, Blackmann-Harris 3-term apodization and 32 interferograms were averaged with background subtraction for each spectrum. The sample spectra were collected after background spectra were taken against an empty cell of the ZnSe plate. At least 10 independent measurements were prepared per strain to yield the number of spectra per strain required for the training and validation of the ANN (see section “Classification Model: Neural Network Architecture”).
Spectral Data Analyses
The quality of FTIR spectral data was evaluated using OPUS software (version 7.8.5; Bruker Optics, Ettlingen, Germany), which assess the quality of spectra with respect to absorbance values, signal-to-noise ratio and intensity of the water vapor lines. On average, 90% of the spectra passed the quality test. Spectral pre-processing included the calculation of second derivatives using the Savitzky-Golay algorithm with 11 smoothing points and subsequent unit vector normalization using the OPUS software and the Orange data mining toolbox for Python (version 3.20.1) (Demsar et al., 2013) for plotting of processed data. The spectral windows from 3100 to 2800 cm-1 and 1800 to 700 cm-1 were pre-determined for further data processing and analysis.
Multivariate data analysis of FTIR spectra was performed using Unscrambler X (version 10.5, Camo AS, Norway) and MATLAB (Release 2018b, The MathWorks Inc., Natick, MA, United States) combined with the Deep Learning Toolbox running on a quad-core CPU laptop using single NVIDIA (Santa Clara, CA, United States) GeForce GTX 1060 (1152 CUDA cores) graphics card. Hierarchical cluster analysis (HCA) and principle component analysis (PCA) was used as an unsupervised method for spectral data analysis and ANN was employed as a supervised method to build up the classification model described in section “Classification Model: Neural Network Architecture.” In addition, HCA (using the Ward’s algorithm) of the processed spectra was performed to identify outlier spectra. For the establishment of the ANN, only spectra showing a heterogeneity < 1.2 were included. This procedure resulted in a total of 1307 spectra used for the establishment of the ANN (see section “Classification Model: Neural Network Architecture”).
Classification Model: Neural Network Architecture
The Deep Learning Toolbox from MATLAB R2018b was applied to perform feature selection and to construct a neural network model. The pre-processed data set was divided into three subsets: training, validation and test set by setting randomly to 65, 20, and 15%, respectively. The training set employed for training the network comprised input and target vectors of the assigned set by computing the gradient and updating the network weights and biases. The validation set was used to validate that network by generalizing and allowing to stop training before overfitting by monitoring the error on the validation set during the training process. The test set was applied as an independent set to assess the network accuracy on data not being used in training or validation by measuring the suitability of the model on a real-world scenario.
Statistics
The FTIR spectral data were evaluated using a normality test to decide whether the parametric or nonparametric statistical test should be used. For this purpose, the Mardia and Royston tests was applied (Mecklin and Mundfrom, 2004). These resulted in a non-normality assumption (the degree of significance, p < 0.0001), which is considered as monotonic but also nonlinear distribution, showing non-parametric statistic monotonic association between the variables of the spectral features. Further, since the data showed normal distribution, each B. cereus group member species were analyzed using the one-way ANOVA and Dunnett’s multiple comparison tests in GraphPad Prism 6 (GraphPad Software, Inc., United States) at which p < 0.05 was considered as statistically significant.
Classification of B. cereus Group Isolates From Soil Samples and Isolates From Recent Food Poisonings by Emetic B. cereus With ANN Assisted FTIR Spectroscopy
Soil samples were collected in a field near Lausanne (Switzerland), Freising-Weihenstephan (Germany), Sarajevo (Bosnia and Herzegovina), and in Golden Bay (Malta). Ten g of each soil sample were diluted 1:10 in ¼ Ringer solution (Merck, Germany). Ten ml of the mixture were incubated at 80°C for 10 min and serial tenfold dilutions were plated on PEMBA (Oxoid, Germany) and plate count agar. B. cereus isolates were randomly selected and were subjected to further analysis. Furthermore, two food samples, a rice dish implicated in a foodborne outbreak in a day care center for children in Southern Germany (Fricker et al., 2007), and a milk rice, implicated in a foodborne outbreak in Northern Germany (Wambo et al., 2011), have been included. A total of 25 g of sample was homogenized in 225 ml BHIG broth (Brain Heart Broth (Merck, Germany) supplemented with 0.1 % Glucose) and serial tenfold dilutions were plated as described for the soil samples. Isolates were measured by FTIR as described above and were identified by ANN assisted FTIR spectroscopy.
Results
Analysis of FTIR Spectra
Fourier Transform Infrared spectra from all strains included in this study (see Supplementary Table S1) were recorded and the quality of spectra was verified by the quality test provided with the OPUS software. Only FTIR spectra passing this test were used for further analysis. Second derivatives of FTIR spectra were calculated and unit vector normalized as described in material and methods. Representative processed spectra from the different B. cereus group species are presented in Figure 1. Next, processed spectra were analyzed by principle component analysis (PCA) as an unsupervised method to gain an overview on the distribution of species and strains. However, the score plots of the PCA analysis of FTIR spectra from the different B. cereus group members did not show a clear species-specific grouping (Supplementary Figure S1). Similar to the metabolic fingerprinting of B. cereus group strains by FTIR, SplitsTree analysis of panC sequences resulted in mixed species clusters. In particular, B. cereus and B. thuringiensis are intermingled and scattered over different clusters (Supplementary Figure S2).
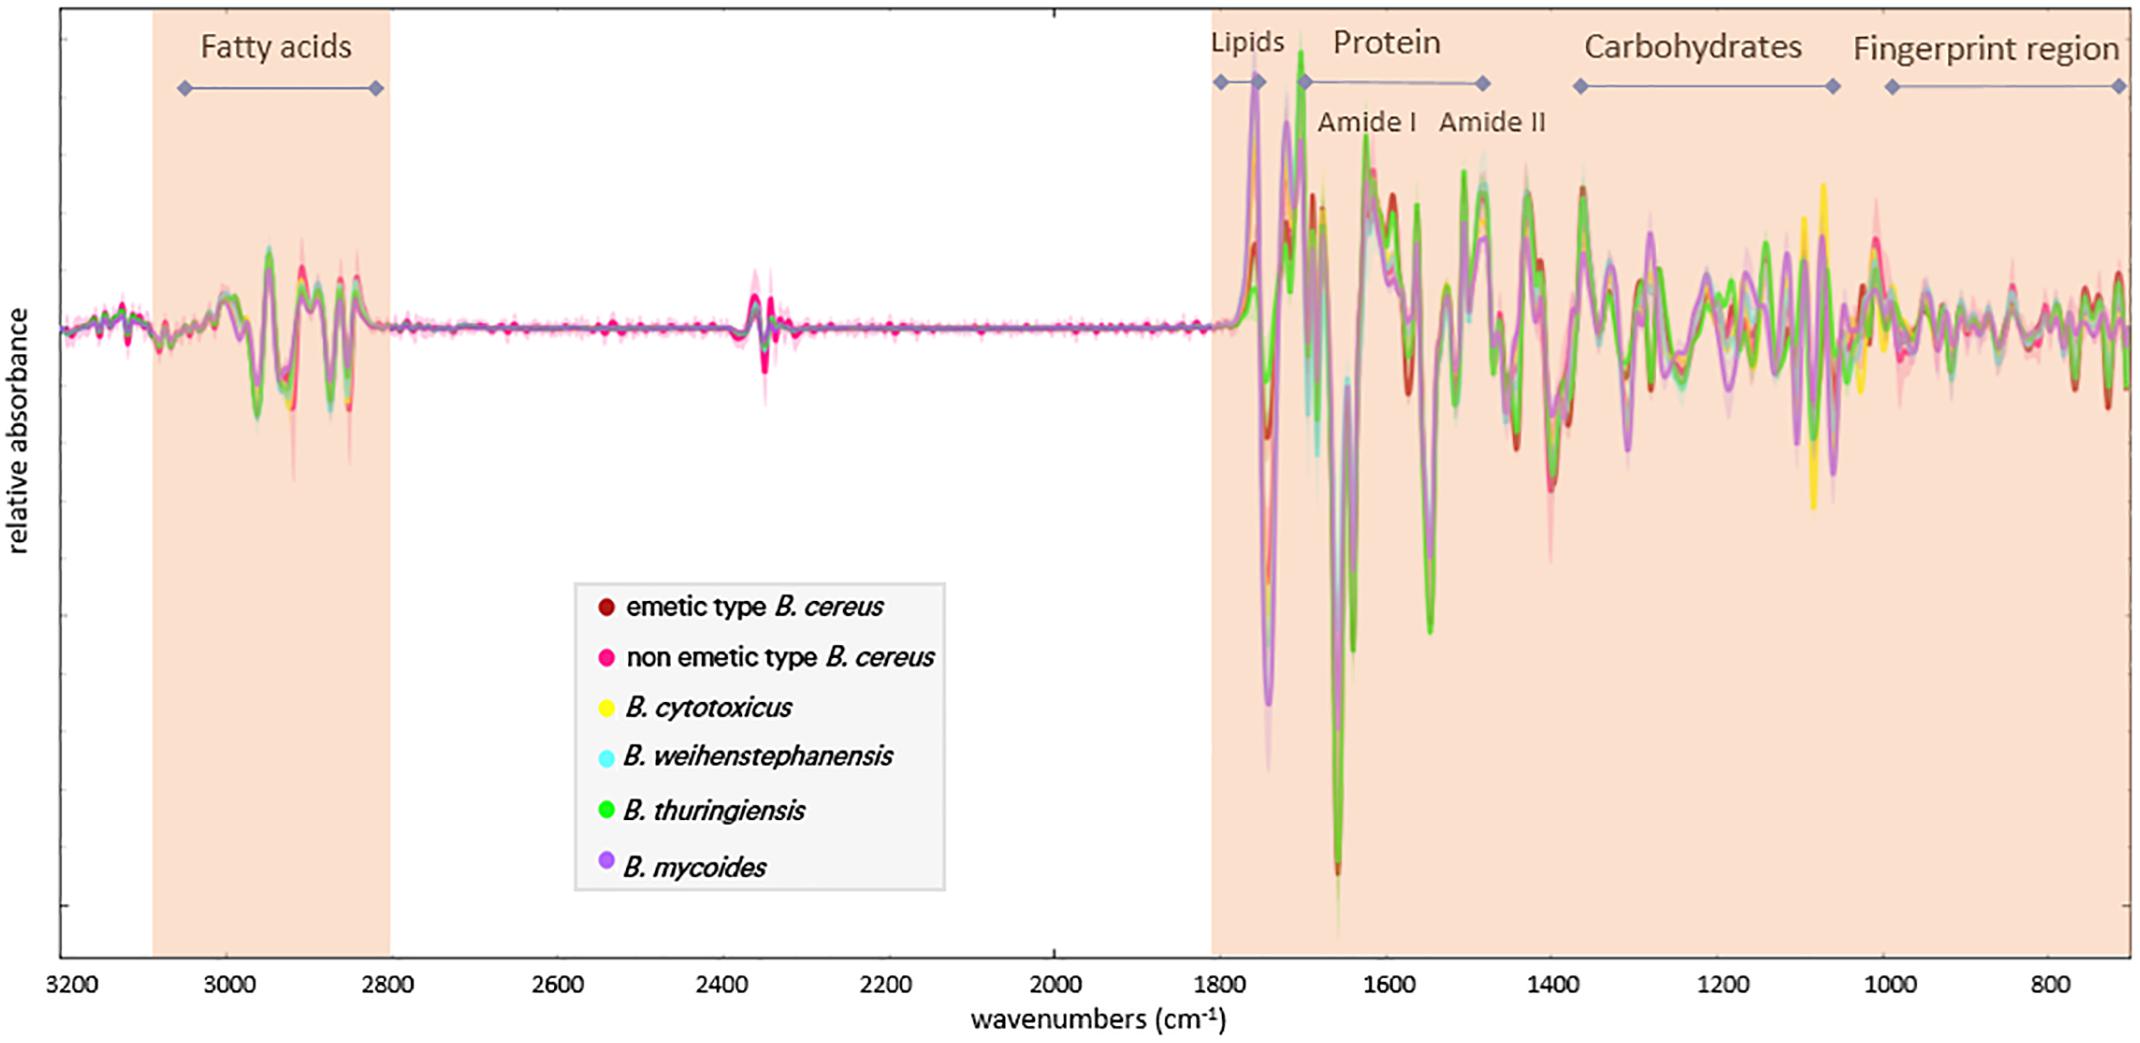
Figure 1. Representative processed (second derivative and unit vector normalized) FTIR spectra of the B. cereus group members, which were used in the ANN model for classification. The selected wavenumbers ranges are highlighted. Bars indicate spectral regions, which have been assigned to different microbial components [according to (Helm et al., 1991; Maquelin et al., 2002)].
Since unsupervised methods, such as PCA, did not allow to discriminate the B. cereus group members based on their FTIR spectral fingerprints, the suitability of supervised systems for species discrimination was explored. To this end, an ANN was constructed as outlined below, using the spectral wave number ranges indicated in Figure 1.
Construction of the ANN Model
The network model constructed was a two-layer feed-forward network with a sigmoid transfer function in the hidden layer, and a softmax transfer function in the output layer. For training multilayer feed-forward network, scaled conjugate gradient numerical optimization algorithm was employed to optimize the performance functions. Roughly, the network weights and biases alternates into such a way that the performance function decreases most rapidly, iterating until the negative of the gradient converges (Hagan et al., 1996). Once training the network has been completed, its performance was evaluated by using cross-entropy and percent misclassification error as well as by analyzing the results using visualization tools, such as confusion matrices (Figure 2). The confusion matrix helps to evaluate the model by looking at the percentages of correct and incorrect classifications. Correct classifications are presented on the green squares on the matrix diagonal. The red squares represent incorrect classifications. If the network is accurate, then the percentages in the red squares are small which indicates the few misclassifications.
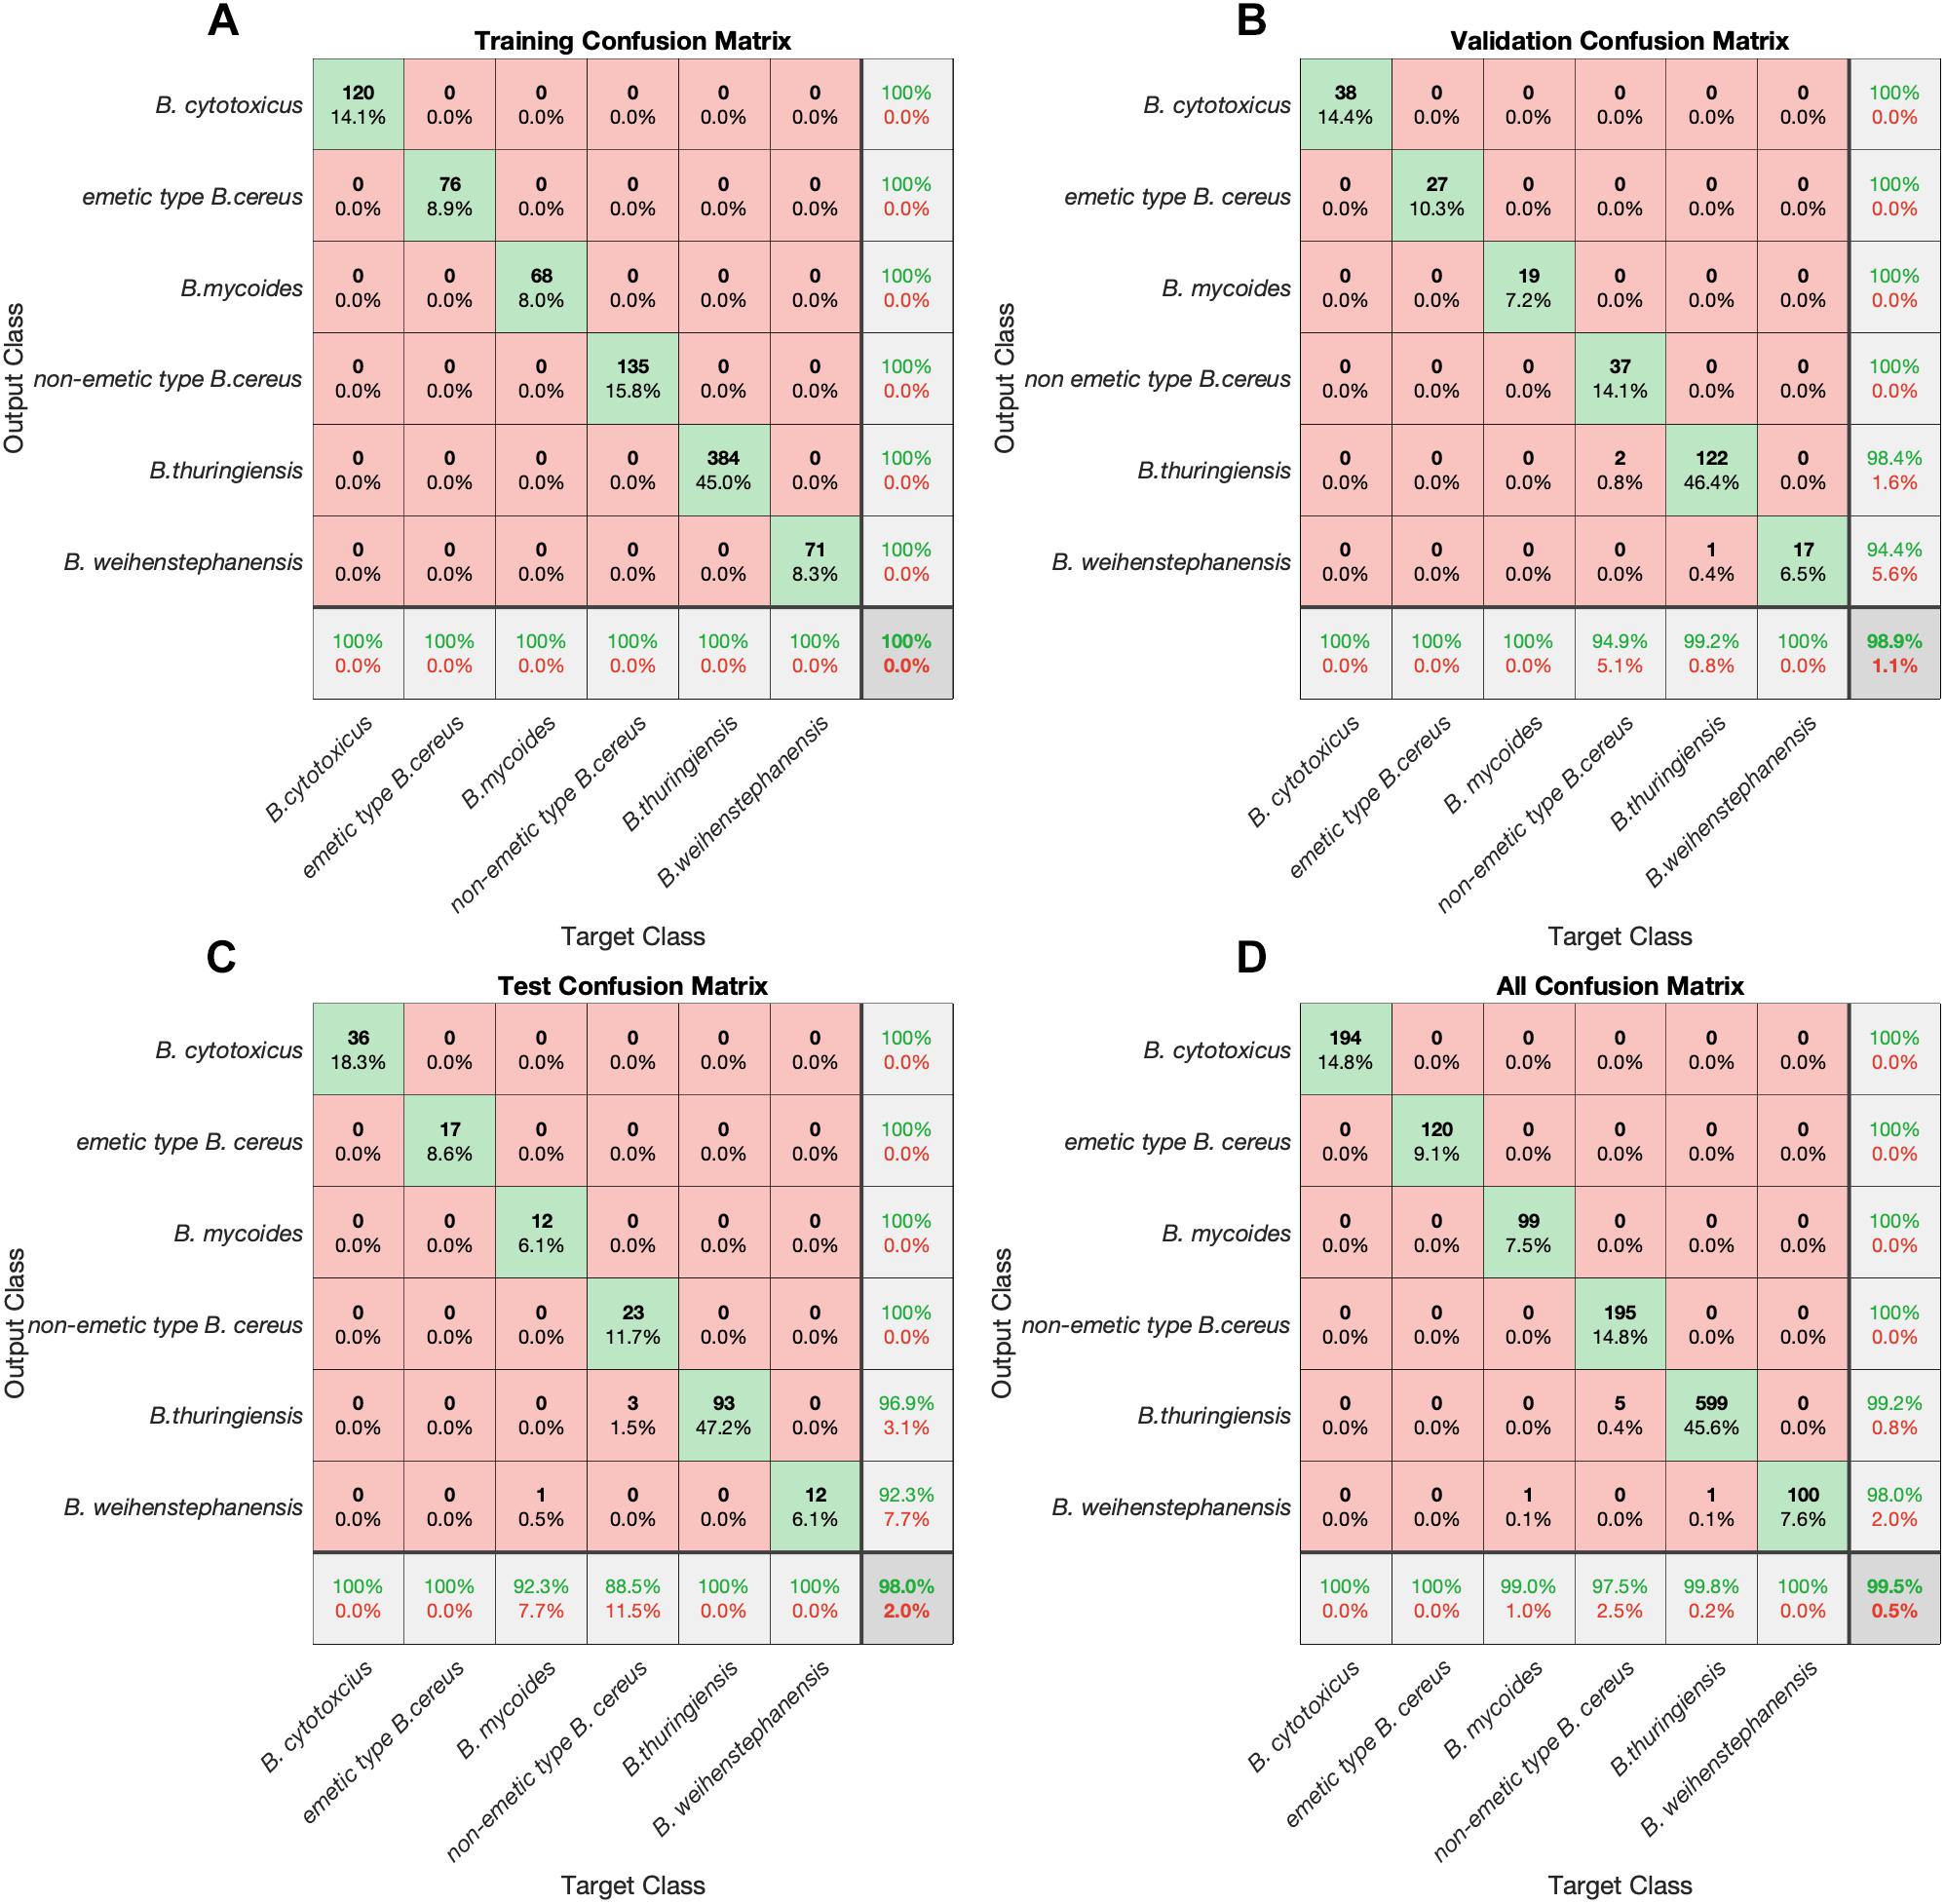
Figure 2. Confusion matrices. Overall percentages of correct and incorrect classifications. Correct classifications are the green squares on the matrix diagonal. The red squares represent incorrect classifications. The number of the spectra and the portion of spectra are given in each cell box. If the network is accurate, then the percentages in the red squares are small which indicates few misclassifications. Confusion matrices for each sets were shown as following (A) training set (B) validation set (C) test set and (D) all confusion matrices in one matrix.
In order to improve the generalization in the neural network model, a regularization method was employed. The regularization involves modifying the performance function, which is normally chosen to be the sum of squares of the network errors on the training set. In addition, the network has been trained 100 times. By calculating the mean squared error for the average output, which was lower than most of the individual performances, the outputs for any input were averaged. The constructed ANN model is depicted in Figure 3. Further, receiver operating characteristics (ROC) curve analysis was performed in order to evaluate the predictive ability of the established model. ROC curve, the true positive rate (i.e., sensitivity) versus false positive rate (i.e., 1-specificity), was plotted using the statistical data obtained by ANN classification based on FTIR spectroscopic data. The area under the ROC curve (AUC) is a measure of classification model performance that indicates a successful classification model, if it is close to 1. Thus, a good model accuracy can be assumed for our established ANN as the AUC values for each species are close to 1 (see Supplementary Figure S3).
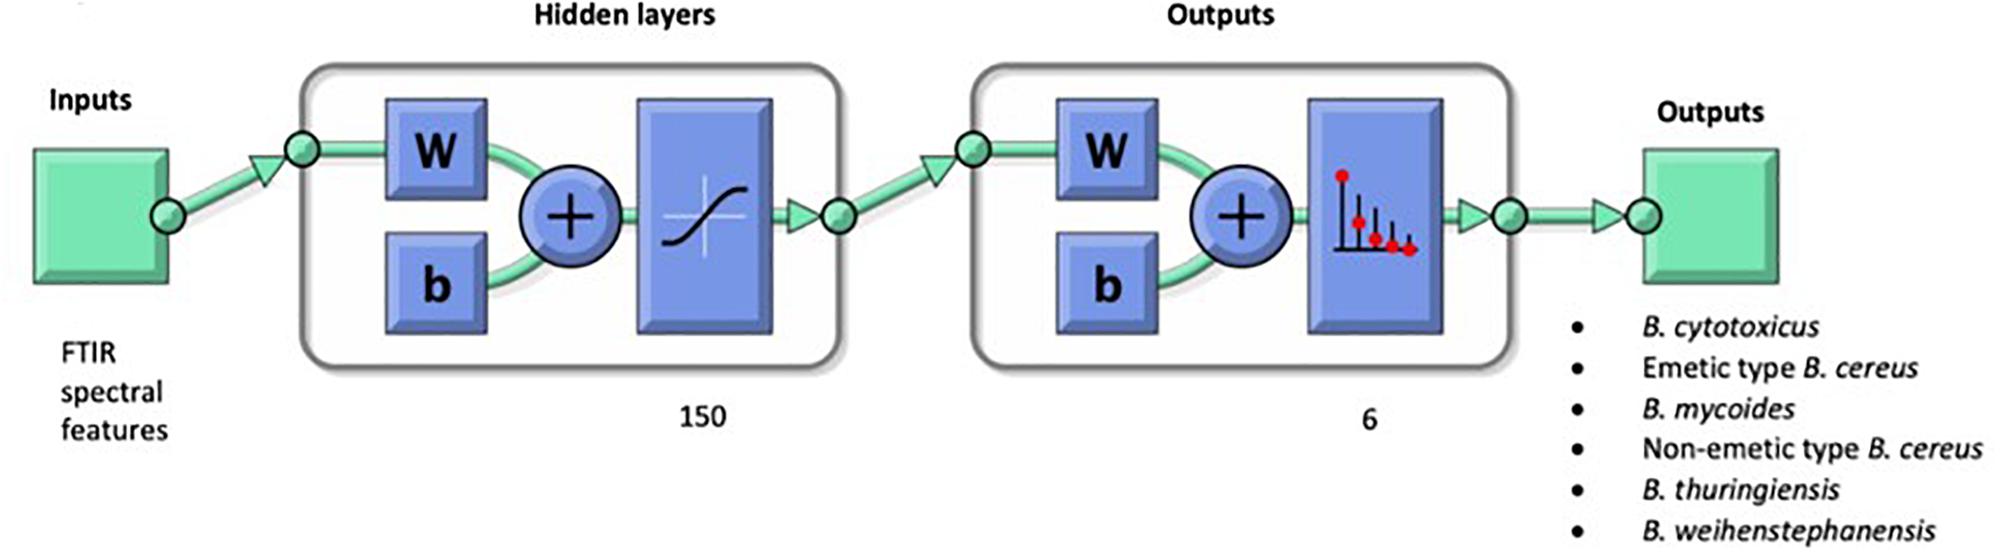
Figure 3. Architecture of the ANN model constructed from FTIR spectra of B. cereus group member species. The model outcomes the B. cereus group in six different subgroups for the discrimination of non-emetic type B. cereus, emetic type B. cereus, B. thuringiensis and B. weihenstephanensis, B. mycoides, B. cytotoxicus. W and b refer to the network’s adjustable parameters which are weight matrices and bias vectors. Once the network is trained, its bias and weight values formed into a vector. The single vector is then redivided into the original biases and weights.
Results of the ANN Model
The architecture of ANN model was designed in such a way that in a one level net, the spectrum of an unknown B. cereus group isolate is assigned to one of the groups specified as (1) emetic B. cereus, (2) non-emetic B. cereus, (3) B. thuringiensis, (4) B. weihenstephanensis, (5) B. mycoides and (6) B. cytotoxicus.
Strains of the B. cereus group used for training, listed in Supplementary Table S1 of the supplemental material, could be unequivocal assigned to one of the specific B. cereus group members mentioned above in the architecture of the model. The ANN model, which was trained with randomly assigned spectra of 65% of the processed FTIR spectral dataset strains, yielded 100% correct identification (Figure 2). Further, in the validation of the trained model with randomly assigned 20% of the pre-processed FTIR dataset, only two spectra from non-emetic B. cereus and one from B. thuringiensis isolates were misidentified, whereas all spectra from emetic type of B. cereus, from B. weihenstephanensis, from B. mycoides and from B. cytotoxicus were identified correctly. The independent test set, consisting of randomly assigned 15 % of the dataset, which were unknown to the ANN model, achieved a correct identification rate of 98.0% (Figure 2). Overall, the constructed ANN model yielded 99.5 % correct classification. It was able to identify all spectra of emetic type of B. cereus, B. cytotoxicus and B. weihenstephanensis strains (100%) correctly, 99.0% of the B. mycoides, 97.5% of the non-emetic type B. cereus, 99.8% of the B. thuringiensis spectra.
Application of the Developed ANN Assisted FTIR Spectroscopy for the Classification of B. cereus Group Isolates From Different Soil Samples and Rice Dishes Associated With Emetic Foodborne Outbreaks
After establishment of the ANN model, it was used to analyze B. cereus populations in soil samples of different geographical origin and in food samples, collected in frame of two foodborne outbreaks in Germany. The soil samples were collected near Freising-Weihenstephan (Germany), Golden Bay (Malta), Lausanne (Switzerland), and Sarajevo (Bosnia and Herzegovina). The rice dish was sampled in a day care center in Southern Germany where 17 children started vomiting after consumption of the reheated meal. The milk rice sample originates from a foodborne outbreak in Northern Germany, which effected 43 children from different kindergartens and 3 adults. From each sample, 66 to 110 B. cereus group isolates were obtained and subjected to FTIR spectroscopy. Subsequent chemometric analysis was carried out using the novel ANN. The main population components varied between the different samples (Table 1).
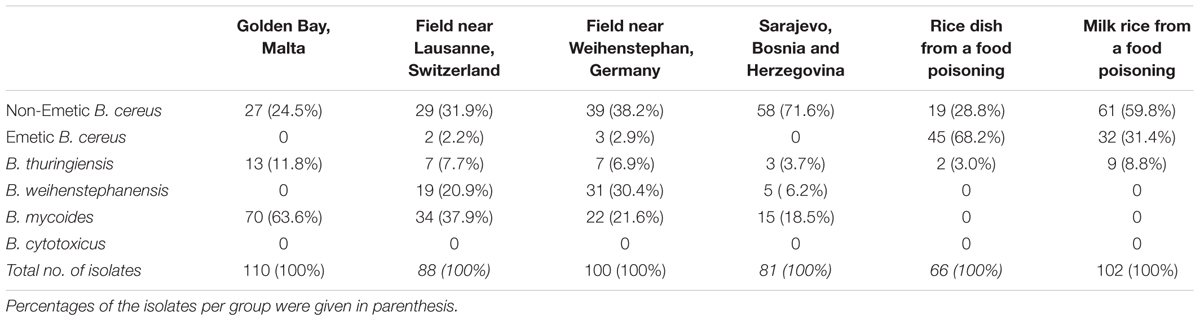
Table 1. Classification of soil sample isolates from different origins and from food poisoning cases via FTIR spectroscopy with the developed ANN model.
The main part of the Golden Bay soil isolates (64 %) was classified as B. mycoides, while B. cereus was the predominant species in the soil sample from Sarajevo (72%). The majority of the isolates from the soil samples from the area of Lausanne were classified as B. mycoides and B. cereus, (38 and 32%, respectively), while in the soil samples from Weihenstephan B. cereus and B. weihenstephanensis showed the highest prevalence (38 and 30%, respectively). As expected, the majority of isolates (68%) from the rice dish connected to the emetic food poisoning in Southern Germany belonged to the emetic type of B. cereus. However, unexpectedly, non-emetic B. cereus isolates represented the majority of isolates (60%) from the emetic foodborne in Northern Germany while only 31% of isolates in the latter sample belong to emetic B. cereus (Table 1). B. thuringiensis was detected in all samples in low abundancies, ranging from 3 to 12%. B. cytotoxicus was not detected in any of the samples.
Discussion
The discrimination between the members of the B. cereus group in food microbiology as well as in clinical diagnostics is primarily based on distinct pathogenic characteristics, such as toxin formation, and phenotypical characteristics, such as the formation of crystalline inclusion bodies for B. thuringiensis, the ability to grow at low temperature for B. weihenstephanensis or the rhizoid colony morphology of B. mycoides. Because of the close genetic relationship among members of the B. cereus group and the fact that species are phylogenetically not clearly separated (Guinebretiere et al., 2008; Kolstø et al., 2009) (see also Supplementary Figure S2), it was proposed to regard them as one species (Carlson et al., 1994; Helgason et al., 2000; Rasko et al., 2005). More recently, it has also been suggested to split them up in several genomospecies, based on average nucleotide identity (ANI) values (Liu et al., 2017). However, both concepts would cause problems for diagnostics and assignment to distinct biological risk groups (Priest et al., 2004; Ehling-Schulz et al., 2019). Thus, we assessed the potential of FTIR spectroscopy in combination with machine-based learning to establish a classification system for the B. cereus group members B. cereus (non-emetic and emetic type), B. thuringiensis, B. weihenstephanensis, B. mycoides, B. cytotoxicus, which are of major importance in food microbiology.
The implementation of ANNs in combination with FTIR spectroscopy has been reported to allow a more accurate differentiation of closely related species and strains than unsupervised methods, such as hierarchical cluster analysis (HCA) and principal component analysis (PCA) (Rebuffo et al., 2006; Grunert et al., 2013). These findings are corroborated by our current study. Our work provided evidence that the application of a machine learning model with the aid of ANN is a powerful tool for classification of bacterial species and subtypes (that are difficult to discriminate in routine diagnostics) based on their FTIR spectral fingerprints. ANNs have the advantage that the most discriminative wave numbers between species or isolates are weighted according to their importance for the differentiation (Schmitt and Udelhoven, 2001), while, by contrast, only windows between certain wave numbers can be selected for HCA. The trained ANN model in our study reached an overall correct identification rate of 100% in the internal and 98.0% in the external validation. These results demonstrate the high performance of ANN assisted FTIR spectroscopy for the differentiation of the closely related B. cereus group members.
Next, we applied the established ANN assisted FTIR spectroscopy method to gain insights into the population structure of soil samples from different geographical origins and food samples from outbreaks caused by emetic B. cereus in Germany. The classification results, presented in Table 1, revealed significant population differences in such kind of samples. The psychrotolerant members of the B. cereus group, B. mycoides and B. weihenstephanensis were predominant in the soil samples from Germany, Malta, Switzerland (53 to 70% per sample) but were not found in the sample from foodborne outbreaks. Only few of the soil isolates were classified as B. thuringiensis (3 to 12% per sample). Similar observations have been reported from a study of sandy loam in Denmark. The latter type of soil contained mainly B. weihenstephanensis and B. mycoides (94%) but was free of B. thuringiensis and only 6% of the population represented B. cereus isolates (Hendriksen et al., 2006). The differences in populations of soil samples concerning mesophilic and psychrotolerant B. cereus group members might be, at least partially, explained by the annual average temperature at the different sampling sites (von Stetten et al., 1999). The low number of soil isolates classified to the emetic type of B. cereus corroborates previous findings and suggest that emetic strains occupy specific, still largely unknown natural niches (Altayar and Sutherland, 2006; Ehling-Schulz et al., 2015).
In contrast to soil samples, none of the isolates from the foodborne outbreaks was classified to the psychrotolerant members of the B. cereus group (Table 1), fostering the hypothesis that the psychrotolerant members of the B. cereus group are rather a food spoilage than a food safety problem (Ehling-Schulz et al., 2005; Guinebretiere et al., 2008). However, apart from the isolates assigned to the emetic type of B. cereus (68 and 32%), a considerable number of isolates was classified as non-emetic B. cereus. In one emetic outbreak, the number of non-emetic isolates (60%) even exceeded the number of emetic isolates (31%). Mixed populations of B. cereus group isolates in such samples have also been reported from other outbreaks (Pirhonen et al., 2005; McIntyre et al., 2008; Schmid et al., 2016), strengthening the demand to analyze more than one colony from food samples implicated in food poisonings. For instance, using a WSG approach for the investigation of a recent B. cereus outbreak in upstate New York, emetic as well as non-emetic B. cereus isolates were identified in human and food samples connected to the outbreak (Carroll et al., 2019), corroborating the results from the analysis of two outbreaks in Germany by our newly established ANN assisted FTIR method. However, the in-depth investigation of a B. cereus outbreak by WGS recently presented by Carroll et al. also pinpoints the current bioinformatic challenges related to such investigations, which is still a drawback for the implementation of WGS in routine diagnostics. By contrast, our ANN assisted FTIR does not require specialized bioinformatic expertise, which facilitates its implementation in routine diagnostics.
Nevertheless, results from both, the WGS approach used by Carroll et al. (2019) as well as from our ANN assisted FTIR method, highlight the importance of accompanying molecular and biochemical analyses for detection of the pathogen and /or its toxin directly in the food, especially in outbreak situations (Fricker et al., 2007; Bauer et al., 2010). Notable, none of the isolates from the soil nor from the foodborne outbreak samples from Germany (see Table 1) or New York upstate (Carroll et al., 2019) was classified as B. cytotoxicus, which strengthen the hypothesis that B. cytotoxicus is rather rare in nature and restricted to very specific, yet to explore, niches (Contzen et al., 2014; Heini et al., 2018).
Conclusion
In summary, a machine learning approach was successfully employed to establish an ANN assisted FTIR spectroscopy method for the rapid and cost-efficient differentiation of closely related B. cereus group members, such as B. cereus and B. thuringiensis. This novel method was applied to classify B. cereus group members in different soils and food samples implicated in food poisoning. Our work demonstrates the high complexity of natural B. cereus group populations, which is a challenge for routine diagnostics as well as for investigations in outbreak situations. The developed method is a promising tool for investigation of B. cereus group populations in different kinds of samples requiring high throughput capacities, such as soil, water or food habitats. It could help not only to elucidate the so far largely unknown role of B. thuringiensis in foodborne outbreaks but also to decipher the rather unexplored natural habitats of the highly potent toxin producers, B. cytotoxicus and emetic B. cereus.
Author Contributions
ME-S and MF conceived and designed the study. MF performed the experiments. MB and MF carried out the chemometric analyses. SJ contributed strains and carried out genotypic analyses. MB, MF, and ME-S wrote the manuscript. ME-S acted as overall study coordinator. All authors revised the manuscript.
Funding
This work has been partially supported by funds from the Bavarian Ministry for Agriculture and Forestry (AZ M2-7606.2-256).
Conflict of Interest Statement
The authors declare that the research was conducted in the absence of any commercial or financial relationships that could be construed as a potential conflict of interest.
Acknowledgments
Partial results presented in this work have been published as part of the dissertation thesis of MF (Fricker, 2007). We thank Romy Renner, Sebastian Sedlmeier, and Tatiana Svoboda for excellent technical assistance.
Supplementary Material
The Supplementary Material for this article can be found online at: https://www.frontiersin.org/articles/10.3389/fmicb.2019.00902/full#supplementary-material
Footnotes
References
Altayar, M., and Sutherland, A. D. (2006). Bacillus cereus is common in the environment but emetic toxin producing isolates are rare. J. Appl. Microbiol. 100, 7–14. doi: 10.1111/j.1365-2672.2005.02764.x
Bauer, T., Stark, T., Hofmann, T., and Ehling-Schulz, M. (2010). Development of a stable isotope dilution analysis for the quantification of the Bacillus cereus toxin cereulide in foods. J. Agric. Food Chem. 58, 1420–1428. doi: 10.1021/jf9033046
Beattie, S. H., Holt, C., Hirst, D., and Williams, A. G. (1998). Discrimination among Bacillus cereus, B. mycoides and B. thuringiensis and some other species of the genus Bacillus by Fourier transform infrared spectroscopy. FEMS Microbiol. Lett. 164, 201–206. doi: 10.1111/j.1574-6968.1998.tb13086.x
Bosch, A., Minan, A., Vescina, C., Degrossi, J., Gatti, B., Montanaro, P., et al. (2008). Fourier transform infrared spectroscopy for rapid identification of nonfermenting gram-negative bacteria isolated from sputum samples from cystic fibrosis patients. J. Clin. Microbiol. 46, 2535–2546. doi: 10.1128/JCM.02267-07
Bourque, S. N., Valero, J. R., Mercier, J., Lavoie, M. C., and Levesque, R. C. (1993). Multiplex polymerase chain reaction for detection and differentiation of the microbial insecticide Bacillus thuringiensis. Appl. Environ. Microbiol. 59, 523–527.
Bravo, A., Likitvivatanavong, S., Gill, S. S., and Soberon, M. (2011). Bacillus thuringiensis: a story of a successful bioinsecticide. Insect Biochem. Mol. Biol. 41, 423–431. doi: 10.1016/j.ibmb.2011.02.006
Carlin, F., Fricker, M., Pielaat, A., Heisterkamp, S., Shaheen, R., Salonen, M. S., et al. (2006). Emetic toxin-producing strains of Bacillus cereus show distinct characteristics within the Bacillus cereus group. Int. J. Food Microbiol. 109, 132–138. doi: 10.1016/j.ijfoodmicro.2006.01.022
Carlson, C. R., Caugant, D. A., and Kolsto, A. B. (1994). Genotypic diversity among Bacillus cereus and Bacillus thuringiensis strains. Appl. Environ. Microbiol. 60, 1719–1725.
Carroll, L. M., Wiedmann, M., Mukherjee, M., Nicholas, D. C., Mingle, L. A., Dumas, N. B., et al. (2019). Characterization of emetic and diarrheal Bacillus cereus strains from a 2016 foodborne outbreak using whole-genome sequencing: addressing the microbiological, epidemiological, and bioinformatic challenges. Front. Microbiol. 10:144. doi: 10.3389/fmicb.2019.00144
Contzen, M., Hailer, M., and Rau, J. (2014). Isolation of Bacillus cytotoxicus from various commercial potato products. Int. J. Food Microbiol. 174, 19–22. doi: 10.1016/j.ijfoodmicro.2013.12.024
Demsar, J., Curk, T., Erjavec, A., Gorup, C., Hocevar, T., Milutinovic, M., et al. (2013). Orange: data mining toolbox in python. J. Mach. Learn. Res. 14, 2349–2353.
Ehling-Schulz, M., Frenzel, E., and Gohar, M. (2015). Food-bacteria interplay: pathometabolism of emetic Bacillus cereus. Front. Microbiol. 6:704. doi: 10.3389/fmicb.2015.00704
Ehling-Schulz, M., Fricker, M., and Scherer, S. (2004a). Bacillus cereus, the causative agent of an emetic type of food-borne illness. Mol. Nutr. Food Res. 48, 479–487. doi: 10.1002/mnfr.200400055
Ehling-Schulz, M., Fricker, M., and Scherer, S. (2004b). Identification of emetic toxin producing Bacillus cereus strains by a novel molecular assay. FEMS Microbiol. Lett. 232, 189–195. doi: 10.1016/S0378-1097(04)00066-7
Ehling-Schulz, M., Knutsson, R., and Scherer, S. (2011). “Bacillus cereus,” in Genomes of Food- and Water-Borne Pathogens, eds S. Kathariou, P. Fratamico, and Y. Liu (Washington DC: ASM Press), 147–164.
Ehling-Schulz, M., Lereclus, D., and Koehler, T. M. (2019). The Bacillus cereus group: Bacillus species with pathogenic potential. Microbiol. Spectrum 6, GPP3-0032-2018. doi: 10.1128/microbiolspec.GPP3-0032-2018
Ehling-Schulz, M., Svensson, B., Guinebretiere, M. H., Lindback, T., Andersson, M., Schulz, A., et al. (2005). Emetic toxin formation of Bacillus cereus is restricted to a single evolutionary lineage of closely related strains. Microbiology 151, 183–197. doi: 10.1099/mic.0.27607-0
Francis, K. P., Mayr, R., Von Stetten, F., Stewart, G. S., and Scherer, S. (1998). Discrimination of psychrotrophic and mesophilic strains of the Bacillus cereus group by PCR targeting of major cold shock protein genes. Appl. Environ. Microbiol. 64, 3525–3529.
Frederiksen, K., Rosenquist, H., Jorgensen, K., and Wilcks, A. (2006). Occurrence of natural Bacillus thuringiensis contaminants and residues of Bacillus thuringiensis-based insecticides on fresh fruits and vegetables. Appl. Environ. Microbiol. 72, 3435–3440. doi: 10.1128/AEM.72.5.3435-3440.2006
Fricker, M. (2007). Development of Genotypic and Phenotypic Methods for the Identification and Differentiation of Hazardous Bacillus cereus Group Strains. PhD thesis. München: Technische Universität München.
Fricker, M., Messelhausser, U., Busch, U., Scherer, S., and Ehling-Schulz, M. (2007). Diagnostic real-time PCR assays for the detection of emetic Bacillus cereus strains in foods and recent food-borne outbreaks. Appl. Environ. Microbiol. 73, 1892–1898. doi: 10.1128/AEM.02219-06
Fricker, M., Skanseng, B., Rudi, K., Stessl, B., and Ehling-Schulz, M. (2011). Shift from farm to dairy tank milk microbiota revealed by a polyphasic approach is independent from geographical origin. Int. J. Food Microbiol. 145(Suppl. 1), S24–S30. doi: 10.1016/j.ijfoodmicro.2010.08.025
Gaviria Rivera, A. M., Granum, P. E., and Priest, F. G. (2000). Common occurrence of enterotoxin genes and enterotoxicity in Bacillus thuringiensis. FEMS Microbiol. Lett. 190, 151–155. doi: 10.1111/j.1574-6968.2000.tb09278.x
Grunert, T., Wenning, M., Barbagelata, M. S., Fricker, M., Sordelli, D. O., Buzzola, F. R., et al. (2013). Rapid and reliable identification of Staphylococcus aureus capsular serotypes by means of artificial neural network-assisted fourier transform infrared spectroscopy. J. Clin. Microbiol. 51, 2261–2266. doi: 10.1128/JCM.00581-13
Guinebretiere, M. H., Auger, S., Galleron, N., Contzen, M., De Sarrau, B., De Buyser, M. L., et al. (2013). Bacillus cytotoxicus sp. nov. is a novel thermotolerant species of the Bacillus cereus Group occasionally associated with food poisoning. Int. J. Syst. Evol. Microbiol. 63, 31–40. doi: 10.1099/ijs.0.030627-0
Guinebretiere, M. H., Thompson, F. L., Sorokin, A., Normand, P., Dawyndt, P., Ehling-Schulz, M., et al. (2008). Ecological diversification in the Bacillus cereus group. Environ. Microbiol. 10, 851–865. doi: 10.1111/j.1462-2920.2007.01495.x
Hagan, M. T., Demuth, H. B., and Beale, M. H. (1996). Neural Network Design. Boston, MA: PWS Pub. Co.
Hauge, S. (1955). Food poisoning caused by aerobic spore forming bacilli. J. Appl. Bacteriol. 18, 591–595. doi: 10.1111/j.1365-2672.1955.tb02116.x
Heini, N., Stephan, R., Ehling-Schulz, M., and Johler, S. (2018). Characterization of Bacillus cereus group isolates from powdered food products. Int. J. Food Microbiol. 283, 59–64. doi: 10.1016/j.ijfoodmicro.2018.06.019
Helgason, E., Okstad, O. A., Caugant, D. A., Johansen, H. A., Fouet, A., Mock, M., et al. (2000). Bacillus anthracis, Bacillus cereus, and Bacillus thuringiensis–one species on the basis of genetic evidence. Appl. Environ. Microbiol. 66, 2627–2630. doi: 10.1128/aem.66.6.2627-2630.2000
Helm, D., Labischinski, H., Schallehn, G., and Naumann, D. (1991). Classification and identification of bacteria by fourier-transform infrared spectroscopy. J. Gen. Microbiol. 137, 69–79. doi: 10.1099/00221287-137-1-69
Hendriksen, N. B., and Hansen, B. M. (2006). Detection of Bacillus thuringiensis kurstaki HD1 on cabbage for human consumption. FEMS Microbiol. Lett. 257, 106–111. doi: 10.1111/j.1574-6968.2006.00159.x
Hendriksen, N. B., Hansen, B. M., and Johansen, J. E. (2006). Occurrence and pathogenic potential of Bacillus cereus group bacteria in a sandy loam. Antonie Van Leeuwenhoek 89, 239–249. doi: 10.1007/s10482-005-9025-y
Holmes, J. R., Plunkett, T., Pate, P., Roper, W. L., and Alexander, W. J. (1981). Emetic food poisoning caused by Bacillus cereus. Arch. Intern. Med. 141, 766–767. doi: 10.1001/archinte.141.6.766
Jackson, S. G., Goodbrand, R. B., Ahmed, R., and Kasatiya, S. (1995). Bacillus cereus and Bacillus thuringiensis isolated in a gastroenteritis outbreak investigation. Lett. Appl. Microbiol. 21, 103–105. doi: 10.1111/j.1472-765x.1995.tb01017.x
Johler, S., Kalbhenn, E. M., Heini, N., Brodmann, P., Gautsch, S., Bagcioglu, M., et al. (2018). Enterotoxin production of Bacillus thuringiensis isolates from biopesticides, foods, and outbreaks. Front. Microbiol. 9:1915. doi: 10.3389/fmicb.2018.01915
Johler, S., Stephan, R., Althaus, D., Ehling-Schulz, M., and Grunert, T. (2016). High-resolution subtyping of Staphylococcus aureus strains by means of fourier-transform infrared spectroscopy. Syst. Appl. Microbiol. 39, 189–194. doi: 10.1016/j.syapm.2016.03.003
Kolstø, A. B., Tourasse, N. J., and Økstad, O. A. (2009). What sets Bacillus anthracis apart from other Bacillus species? Annu. Rev. Microbiol. 63, 451–476. doi: 10.1146/annurev.micro.091208.073255
Kronstad, J. W., Schnepf, H. E., and Whiteley, H. R. (1983). Diversity of locations for Bacillus thuringiensis crystal protein genes. J. Bacteriol. 154, 419–428.
Lasch, P., Stammler, M., Zhang, M., Baranska, M., Bosch, A., and Majzner, K. (2018). FT-IR hyperspectral imaging and artificial neural network analysis for identification of pathogenic bacteria. Anal. Chem. 90, 8896–8904. doi: 10.1021/acs.analchem.8b01024
Lechner, S., Mayr, R., Francis, K. P., Pruss, B. M., Kaplan, T., Wiessner-Gunkel, E., et al. (1998). Bacillus weihenstephanensis sp. nov. is a new psychrotolerant species of the Bacillus cereus group. Int. J. Syst. Bacteriol. 48(Pt 4), 1373–1382. doi: 10.1099/00207713-48-4-1373
Liu, Y., Du, J., Lai, Q., Zeng, R., Ye, D., Xu, J., et al. (2017). Proposal of nine novel species of the Bacillus cereus group. Int. J. Syst. Evol. Microbiol. 67, 2499–2508. doi: 10.1099/ijsem.0.001821
Lund, T., De Buyser, M. L., and Granum, P. E. (2000). A new cytotoxin from Bacillus cereus that may cause necrotic enteritis. Mol. Microbiol. 38, 254–261. doi: 10.1046/j.1365-2958.2000.02147.x
Maquelin, K., Choo-Smith, L.-P., Kirschner, C., Ngo-Thi, N. A., Naumann, D., and Puppels, G. J. (2002). “Vibrational spectroscopic studies in microorganisms,” in Handbook of Vibrational Spectroscopy, eds J. M. Calmers and P. R. Griffiths (Chichester: John Wiley & Sons Ltd.), 1–27.
McIntyre, L., Bernard, K., Beniac, D., Isaac-Renton, J. L., and Naseby, D. C. (2008). Identification of Bacillus cereus group species associated with food poisoning outbreaks in British Columbia, Canada. Appl. Environ. Microbiol. 74, 7451–7453. doi: 10.1128/AEM.01284-08
Mecklin, C. J., and Mundfrom, D. J. (2004). An appraisal and bibliography of tests for multivariate normality. Int. Stat. Rev. 72, 123–138. doi: 10.1111/j.1751-5823.2004.tb00228.x
Naumann, D., Helm, D., Labischinski, H., and Giesbrecht, P. (1991). “The characterization of microorganisms by fourier-transform infrared spectroscopy (FT-IR),” in Modern Techniques for Rapid Microbiological Analysis, ed. W. H. Nelson (New York, NY: VCH publisher), 43–96.
Pirhonen, T. I., Andersson, M. A., Jääskeläinen, E. L., Salkinoja-Salonen, M. S., Honkanen-Buzalski, T., and Johansson, T. M. L. (2005). Biochemical and toxic diversity of Bacillus cereus in a pasta and meat dish associated with a food-poisoning case. Food Microbiol. 22, 87–91. doi: 10.1016/j.fm.2004.04.002
Priest, F. G., Baker, M., Baillie, L. W. J., Holmes, E. C., and Maiden, M. C. J. (2004). Population structure and evolution of the Bacillus cereus group. J. Bacteriol. 186, 7959–7970. doi: 10.1128/jb.186.23.7959-7970.2004
Pruss, B. M., Dietrich, R., Nibler, B., Martlbauer, E., and Scherer, S. (1999). The hemolytic enterotoxin HBL is broadly distributed among species of the Bacillus cereus group. Appl. Environ. Microbiol. 65, 5436–5442.
Rasko, D. A., Altherr, M. R., Han, C. S., and Ravel, J. (2005). Genomics of the Bacillus cereus group of organisms. FEMS Microbiol. Rev. 29, 303–329. doi: 10.1016/j.femsre.2004.12.005
Rebuffo, C. A., Schmitt, J., Wenning, M., Von Stetten, F., and Scherer, S. (2006). Reliable and rapid identification of Listeria monocytogenes and Listeria species by artificial neural network-based Fourier transform infrared spectroscopy. Appl. Environ. Microbiol. 72, 994–1000. doi: 10.1128/AEM.72.2.994-1000.2006
Rebuffo-Scheer, C. A., Kirschner, C., Staemmler, M., and Naumann, D. (2007). Rapid species and strain differentiation of non-tubercoulous mycobacteria by fourier-transform infrared microspectroscopy. J. Microbiol. Methods 68, 282–290. doi: 10.1016/j.mimet.2006.08.011
Schabauer, L., Wenning, M., Huber, I., and Ehling-Schulz, M. (2014). Novel physico-chemical diagnostic tools for high throughput identification of bovine mastitis associated gram-positive, catalase-negative cocci. BMC Vet. Res. 10:156. doi: 10.1186/1746-6148-10-156
Schmid, D., Rademacher, C., Kanitz, E. E., Frenzel, E., Simons, E., Allerberger, F., et al. (2016). Elucidation of enterotoxigenic Bacillus cereus outbreaks in Austria by complementary epidemiological and microbiological investigations, 2013. Int. J. Food Microbiol. 232, 80–86. doi: 10.1016/j.ijfoodmicro.2016.05.011
Schmitt, J., and Udelhoven, T. (2001). “Use of artificial neural networks in biomedical diagnosis,” in Infrared and Raman Spectroscopy of Biological Materials, eds H. U. Gremlich and B. Yan (New York, NY: Marcel Dekker, Inc.), 379–419.
Schnepf, E., Crickmore, N., Van Rie, J., Lereclus, D., Baum, J., Feitelson, J., et al. (1998). Bacillus thuringiensis and its pesticidal crystal proteins. Microbiol. Mol. Biol. Rev. 62, 775–806.
Stenfors Arnesen, L. P., Fagerlund, A., and Granum, P. E. (2008). From soil to gut: Bacillus cereus and its food poisoning toxins. FEMS Microbiol. Rev. 32, 579–606. doi: 10.1111/j.1574-6976.2008.00112.x
von Stetten, F., Mayr, R., and Scherer, S. (1999). Climatic influence on mesophilic Bacillus cereus and psychrotolerant Bacillus weihenstephanensis populations in tropical, temperate and alpine soil. Environ. Microbiol. 1, 503–515. doi: 10.1046/j.1462-2920.1999.t01-1-00070.x
Wagener, K., Grunert, T., Prunner, I., Ehling-Schulz, M., and Drillich, M. (2014). Dynamics of uterine infections with Escherichia coli, Streptococcus uberis and Trueperella pyogenes in post-partum dairy cows and their association with clinical endometritis. Vet. J. 202, 527–532. doi: 10.1016/j.tvjl.2014.08.023
Wambo, G. O. K., Burckhardt, F., Frank, C., Hiller, P., Wichmann-Schauer, H., Zuschneid, I., et al. (2011). The proof of the pudding is in the eating: an outbreak of emetic syndrome after a kindergarten excursion, Berlin, Germany, December 2007. Eurosurveillance 16, 11–16.
Wenning, M., Scherer, S., and Naumann, D. (2008). “Infrared spectroscopy in the identification of microorganisms,” in Vibrational Spectroscopy for Medical Diagnosis, eds M. Diem, P. R. Griffiths, and J. M. Chalmers (Chichester:Wiley).
Keywords: Bacillus cereus, FTIR spectroscopy, machine learning, artificial neural networks, diagnostics
Citation: Bağcıoğlu M, Fricker M, Johler S and Ehling-Schulz M (2019) Detection and Identification of Bacillus cereus, Bacillus cytotoxicus, Bacillus thuringiensis, Bacillus mycoides and Bacillus weihenstephanensis via Machine Learning Based FTIR Spectroscopy. Front. Microbiol. 10:902. doi: 10.3389/fmicb.2019.00902
Received: 03 December 2018; Accepted: 09 April 2019;
Published: 26 April 2019.
Edited by:
Giovanna Suzzi, University of Teramo, ItalyReviewed by:
Lucia Vannini, University of Bologna, ItalyFereidoun Forghani, University of Georgia, United States
Copyright © 2019 Bağcıoğlu, Fricker, Johler and Ehling-Schulz. This is an open-access article distributed under the terms of the Creative Commons Attribution License (CC BY). The use, distribution or reproduction in other forums is permitted, provided the original author(s) and the copyright owner(s) are credited and that the original publication in this journal is cited, in accordance with accepted academic practice. No use, distribution or reproduction is permitted which does not comply with these terms.
*Correspondence: Monika Ehling-Schulz, TW9uaWthLkVobGluZy1TY2h1bHpAdmV0bWVkdW5pLmFjLmF0
†These authors have contributed equally to this work
‡Present address: Martina Fricker, Department of Genetic Epidemiology, University of Regensburg, Regensburg, Germany