 David G. Cooper
 Yishuo Jiang
 Sydney Skuodas
 Luying Wang
 Jan S. Fassler
- Biology Department, University of Iowa, Iowa City, IA, United States
The propensity for Saccharomyces cerevisiae yeast to ferment sugars into ethanol and CO2 has long been useful in the production of a wide range of food and drink. In the production of alcoholic beverages, the yeast strain selected for fermentation is crucial because not all strains are equally proficient in tolerating fermentation stresses. One potential mechanism by which domesticated yeast may have adapted to fermentation stresses is through changes in the expression of stress response genes. MED15 is a general transcriptional regulator and RNA Pol II Mediator complex subunit which modulates the expression of many metabolic and stress response genes. In this study, we explore the role of MED15 in alcoholic fermentation. In addition, we ask whether MED15 alleles from wine, sake or palm wine yeast improve fermentation activity and grape juice fermentation stress responses. And last, we investigate to what extent any differences in activity are due to allelic differences in the lengths of three polyglutamine tracts in MED15. We find that strains lacking MED15 are deficient in fermentation and fermentation stress responses and that MED15 alleles from alcoholic beverage yeast strains can improve both the fermentation capacity and the response to ethanol stresses when transplanted into a standard laboratory strain. Finally, we find that polyglutamine tract length in the Med15 protein is one determinant in the efficiency of the alcoholic fermentation process. These data lead to a working model in which polyglutamine tract length and other types of variability within transcriptional hubs like the Mediator subunit, Med15, may contribute to a reservoir of transcriptional profiles that may provide a fitness benefit in the face of environmental fluctuations.
Introduction
MED15 encodes a subunit of the tail domain of the RNA Polymerase II Mediator complex. Mediator is a conserved transcriptional regulatory complex consisting of 21 core subunits in yeast (Guglielmi et al., 2004), divided into three domains (head, middle, and tail) that helps recruit RNA Pol II to target genes (Davis et al., 2002). The primary function of the head and middle modules is to interact with RNA Pol II and the general transcriptional machinery, while the primary function of the tail module is to interact with DNA-bound transcription factors and chromatin remodeling complex proteins (Myers et al., 1999; Takagi et al., 2006; Takagi and Kornberg, 2006; Ansari et al., 2012; Ansari and Morse, 2012). As a member of the Mediator tail domain Med15 has both positive and negative roles in gene expression (Suzuki et al., 1988; Fassler and Winston, 1989; Sussel et al., 1995; Cooper and Fassler, 2019) that are the result of physical contacts with a variety of transcription factors, chromatin remodeling proteins and other subunits of the Mediator complex. Med15 is required for normal activation of stress response genes and metabolic genes among others, as well as for the downregulation of genes involved in translation and ribosome biogenesis (Cooper and Fassler, 2019). Including both positive and negatively regulated genes, MED15 regulates as much as 10% of the genome (Ansari et al., 2012). Deletions of the MED15 gene are viable, but have a reduced growth rate and exhibit sensitivity to many stresses including heat (Auesukaree et al., 2009), low pH (Mollapour et al., 2004), hyperoxia (Outten et al., 2005), and osmotic stress (Zapater et al., 2007). The null mutant also exhibits reduced growth on non-glucose carbon sources (Nogi and Fukasawa, 1980; Suzuki et al., 1988), reduced growth under anaerobic conditions (Samanfar et al., 2013), and reduced respiratory growth rate (Merz and Westermann, 2009; Bode et al., 2013).
The Med15 protein can be subdivided into three large structural domains. The N-terminal ∼90 amino acids comprise a well-conserved and fully characterized KIX (kinase inducible domain interacting domain) (Parker et al., 1996; Thakur et al., 2008). The Med15 KIX domain engages pleiotropic drug resistance transcription factor (Pdr1) orthologs, which are key regulators of the multidrug resistance pathway in Saccharomyces cerevisiae and the clinically important human pathogen Candida glabrata (Thakur et al., 2008). The C-terminal 250 amino acids, sometimes referred to as the Mediator Association Domain (MAD), is known for its role in Mediator assembly. Deletions throughout this region disrupt Mediator integrity. Residues located between amino acids (aa) 500 and 630 and outside of the MAD domain may also contribute to mediator assembly (Jedidi et al., 2010). The middle domain of Med15 is intrinsically disordered, due in part to the overrepresentation of glutamine residues. The amino acid bias is extensive and the S. cerevisiae protein and many fungal Med15 orthologs are characterized by long tracts of uninterrupted glutamine. Fungal Med15 proteins contain three prominent glutamine stretches (here called Q1, Q2, and Q3) which lie adjacent to and partially overlap with the positions of predicted coiled-coil domains (Cooper and Fassler, 2019).
The role for polyglutamine (poly-Q) tracts in Med15 has not been established, though the functional importance of poly-Q has been investigated in other contexts. Poly-Q tract containing proteins are enriched in transcriptional regulators (Cooper and Fassler, 2019) and more specifically there is an enrichment of glutamine residues within transcriptional activation domains (Gerber et al., 1994). Polyglutamine tracts likely effect transcriptional activation by mediating protein-protein interactions as has been observed in Taf12 - Rap1 interactions (Garbett et al., 2007), the homodimerization of Nab3 (Loya et al., 2013), the interaction between Q rich human TBP and TFIIB (Friedman et al., 2007), the interaction between the glutamine-rich activation domain in Drosophila SP1 with itself (Pascal and Tjian, 1991) and with Taf4 (Hoey et al., 1993), and the in vitro poly-Q-dependent interaction between basal transcription factors such as TFIID and TFIIF with the mutant (expanded Q) Huntingtin (Htt) protein (Zhai et al., 2005).
The availability of thousands of genomes for individual S. cerevisiae strains provides an opportunity to evaluate the potential for variation within the Med15 protein. We find occasional amino acid substitutions, but the most striking variation within Med15 is the length of simple sequence repeats that underlie the glutamine and glutamine-alanine tracts in the central part of the protein. Recently, the phenotypic stress response consequences of Med15 polyglutamine variation have been investigated (Gallagher et al., 2020). The significance of this type of variation has also been investigated in the yeast Ssn6 (Cyc8) transcriptional co-repressor protein (Gemayel et al., 2015) as well as in the ANGUSTIFOLIA and Clock proteins in other organisms (O’Malley et al., 2010; Bryan et al., 2018).
The role of MED15 in industrial phenotypes has not been thoroughly investigated. In one study MED15 was found to be required for FLO11 activation and the hydrophobicity phenotype that leads to the flotation of sherry yeast (known as flor) during the aging process in barrels (Barrales et al., 2008; Fidalgo et al., 2008). These and other studies found that MED15 was also required for flocculation and adhesion (Barrales et al., 2008; Fidalgo et al., 2008). Finally, overexpression of Arabidopsis thaliana MED15 in wild type strains of S. cerevisiae led to increased flocculation, adhesion and a significant increase in ethanol production (Dahiya et al., 2016).
Yeast have been used to ferment grape juice/must in the production of alcoholic beverages for millennia. The differences in wine and beer fermentation environments have resulted in yeast diversification with certain strains becoming adapted to the production of specific beverages (Legras et al., 2018). Genome scale analyses of hundreds of strains have shown that yeast adapt to new environments via both small and large genetic changes (Peter et al., 2018). Small variations due to single nucleotide or small indels can change the structure and/or function of the encoded protein or alter gene expression. Larger changes including chromosomal rearrangements, segmental duplications and gene copy number variation have also been observed. Changes in glutamine tract length, which are expected to occur at higher frequencies than the average spontaneous mutation rate (1.7 e-7) (Gou et al., 2019), may also provide a reservoir of standing diversity that could be tapped during the process of adaptation to novel environments.
Grape juice is a stressful environment for yeast due in part to its high sugar content (140–260 g/L total sugar) (14–26°Bx) which is an equimolar mixture of glucose and fructose, resulting from the cleavage of sucrose within the grape (Bisson, 1993). The elevated sugar content in grapes constitutes a severe hyperosmotic stress which is compounded by other constituents of the grape must including soil- and agrochemical-based copper (Provenzano et al., 2010; Sun et al., 2016) as well as the sulfites added immediately after grape crush to inhibit or kill spoilage organisms (Divol et al., 2012). In addition, low concentrations of available nitrogen in grape juice (Henschke and Jiranek, 1993) can become growth limiting, as amino acids are quickly depleted during fermentation (Jiranek et al., 1995). Grape juice also has a low pH (2.8–3.8) caused by a mix of tartaric, malic, and citric acids (Pretorius, 2000). Available nitrogen and ∼50% of the sugars are quickly consumed during the growth phase (Bisson, 1993) of the yeast inoculum. The remaining sugar is fermented after culture saturation in the production of energy. Ethanol is the main byproduct of yeast fermenting glucose for energy. Other metabolic products are made throughout the fermentation process including various acids (acetic, succinic, and lactic) and volatile compounds (esters, fatty acids, aldehydes, and higher alcohols) (Pretorius, 2000; Varela et al., 2012; Peltier et al., 2018).
In addition to the environmental stresses present at the start of fermentation, accumulation of both ethanol and acetic acid are stressors specific to late fermentation cultures. Correspondingly, wine yeasts have high tolerance to many compounds including acetic acid, copper, sulfite, high glucose, and ethanol (Gallone et al., 2016). Yeast respond to the initial and accumulating stresses of grape juice and fermentation through the environmental stress response (Mendes-Ferreira et al., 2007a,b). Ethanol toxicity is thought to occur by disrupting membrane structural integrity, while the addition of lipids or oxygenation that is required to synthesize fatty acids can mitigate the toxic effects (Pretorius, 2000; Varela et al., 2012).
In the present study, we assess the contribution of MED15 to industrial phenotypes such as growth in high sugar media, ethanol and acetic acid tolerance, ethanol production and fermentation rates. We also investigate the potential contribution of sequence variation within the Med15 protein to the fermentation lifestyle. To investigate this set of questions we constructed isogenic laboratory strains (S288C) that either contain or lack the MED15 gene (WT and med15Δ), as well as med15Δ strains carrying centromeric plasmids expressing either the laboratory (LAB) or alleles of MED15 from strains specific to different types of alcoholic beverage production. All MED15 genes were expressed from the MED15 promoter from the genome of the S288C laboratory strain. Commercial strains with polyglutamine tract lengths differing from the LAB strain (Cooper and Fassler, 2019) were used to investigate the impact of natural poly-Q tract allelic variation on the activity of Med15. We find that strains lacking MED15 have reduced tolerance for growth on ethanol and display reduced fermentation rates. We also find that certain MED15 alleles from industrial strains improve growth and fermentation rates over strains with in MED15LAB alleles. The MED15 sequence of LAB and industrial strains differ primarily, but not exclusively, in the length of their glutamine tracts. Strain reconstruction experiments show that glutamine tract lengths in Med15 do influence fermentation rate, and have the potential to be adaptive in certain domestication niches.
Materials and Methods
Strains
Strains are derivatives of S288C, a widely used non-flocculent laboratory strain, originally designed for biochemical studies (Mortimer and Johnston, 1986). The med15Δ strain was from the deletion collection (Brachmann et al., 1998). Genotypes of additional strains used in this study are listed in Table 1. Industrial yeast strains were purchased from commercial vendors (WY1, Lalvin 71B-1122, Home Brew Stuff; WY2, Lalvin RC-212 and WY3, Lalvin ICV_D-47, Amazon; WY4, Lalvin EC-1118, Home Brew Ohio; WY5, Lalvin K1-V-1116, RiteBrew) or were obtained from the ARS culture collection1 (SY20, sake yeast, NRRL-Y11573 and PY23, palm wine yeast, NRRL-Y17772) or were from the Goddard laboratory collection (Bradbury et al., 2006) (WY7, Lalvin ICV D-254; WY15, DSM Fermichamp).
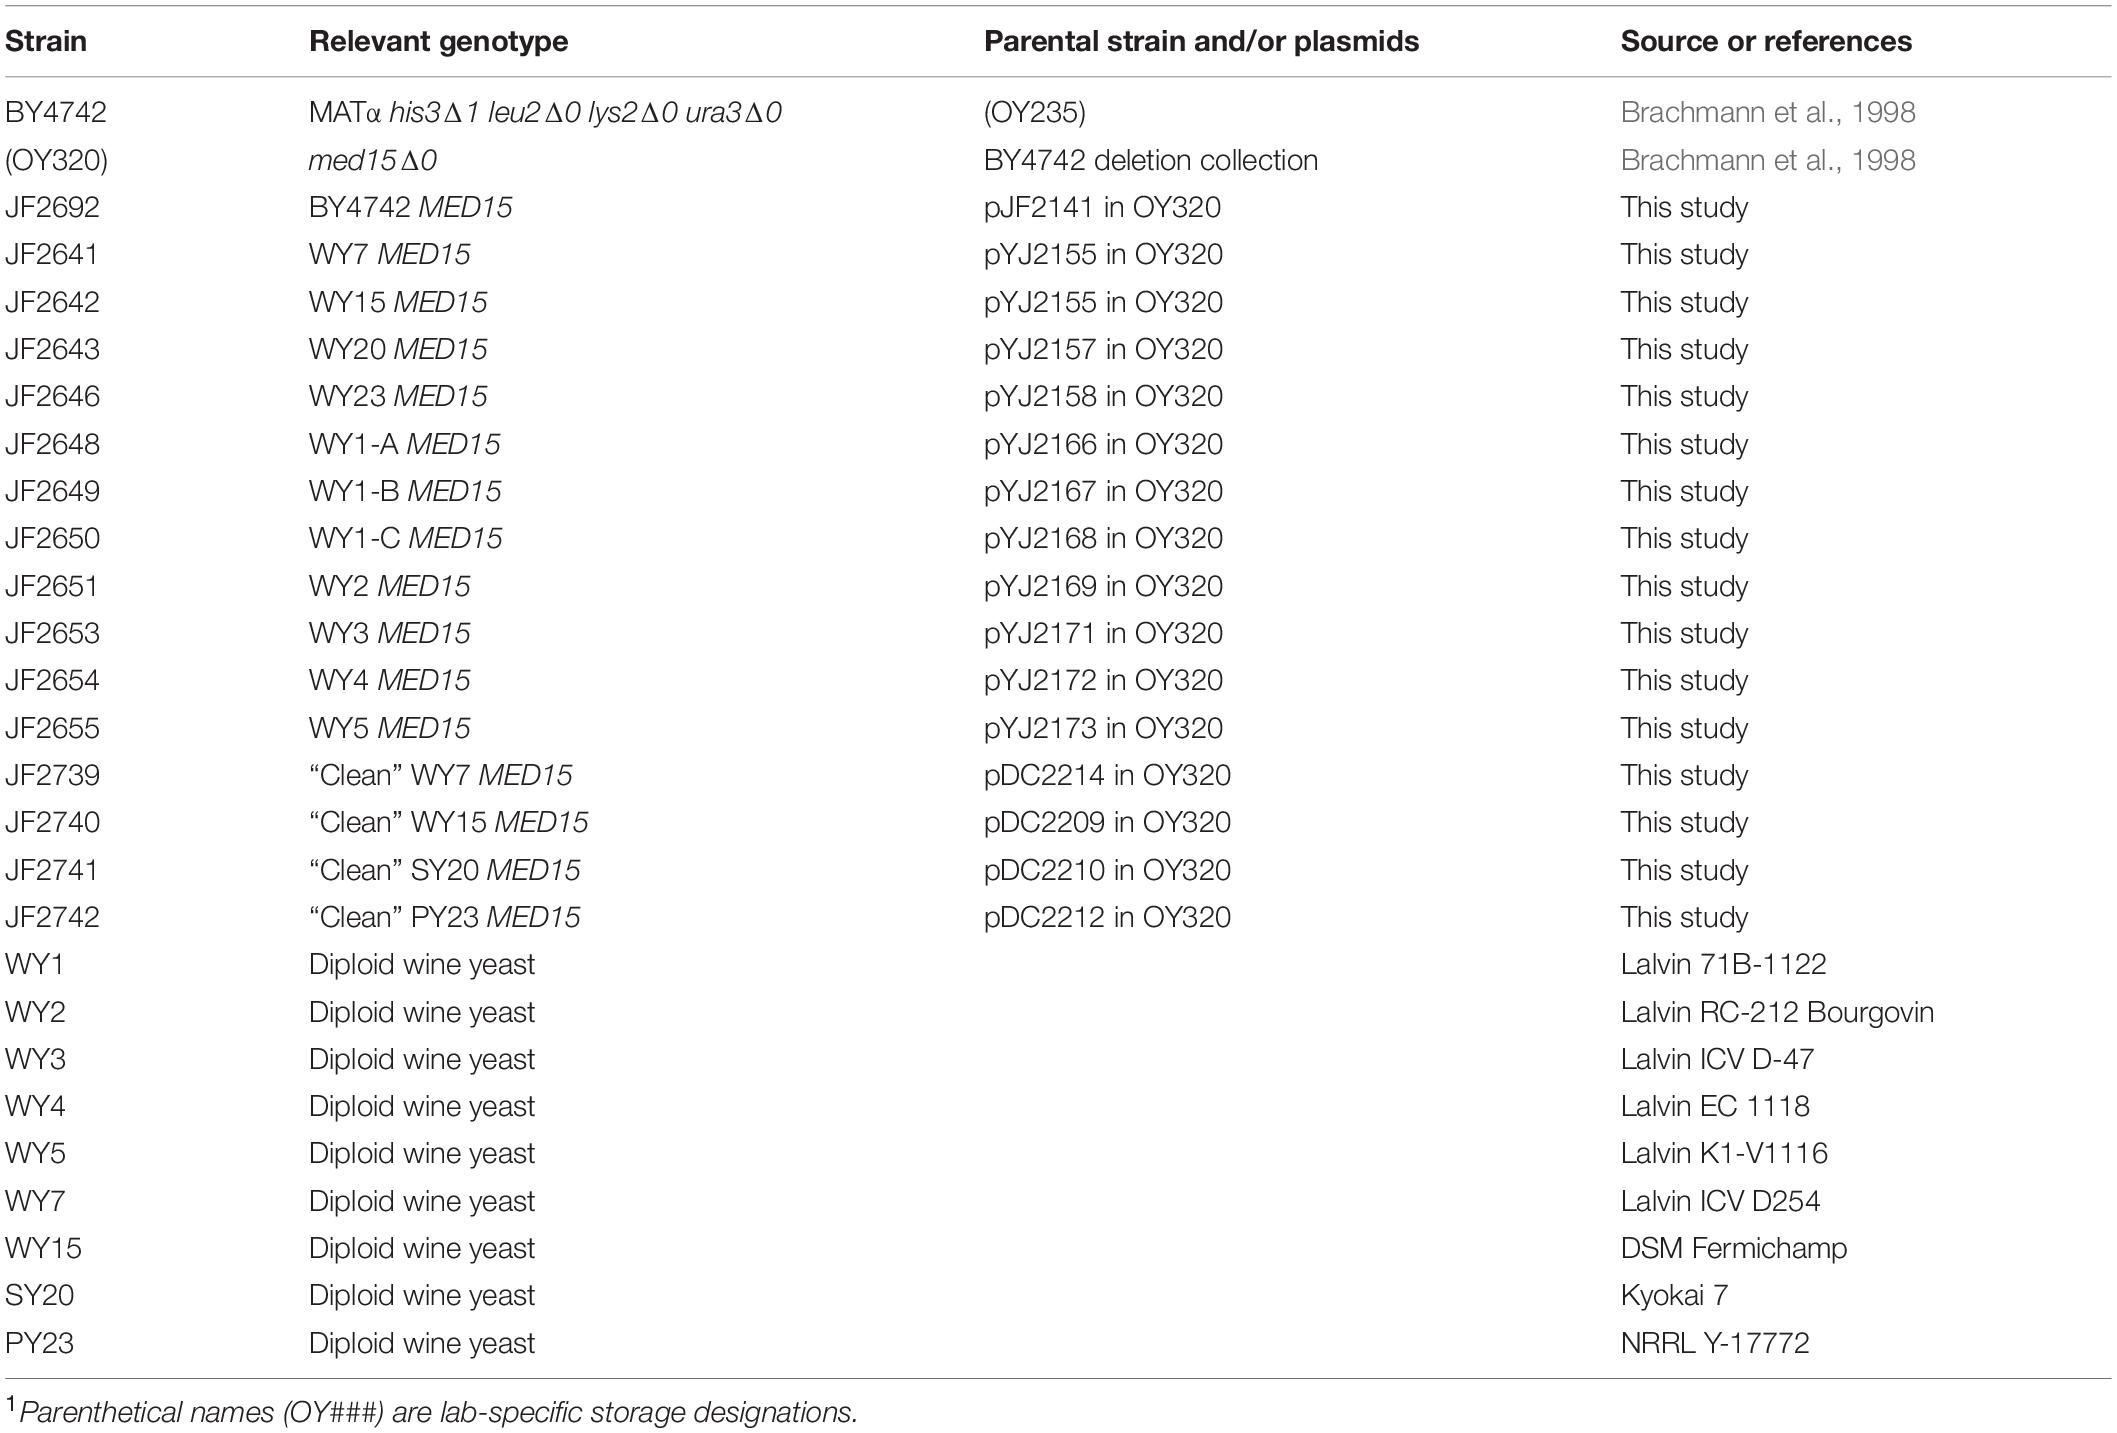
Table 1. Strains Used in this Study1.
Plasmid Construction
The details of plasmid construction are found in Supplementary File 2. Plasmid used in this work are provided in Supplementary Table 1.
Primers
Primers used in this work are provided in Supplementary Table 2.
Yeast Methods
Colony PCR
Rapid PCR screening was conducted using Taq polymerase, colony PCR buffer [final concentrations: 12.5 mM Tris-Cl (pH 8.5), 56 mM KCl, 1.5 mM MgCl2, 0.2 mM dNTPs], and primers (0.2 μM). A small amount of yeast cells were transferred using the end of a 200 μL micropipet tip. A standard hot-start thermocycler program with extension at 68°C was adjusted for the Tm of the primer set and size of the amplification product.
Yeast Transformation
Transformations of med15Δ strains were conducted using the frozen-EZ yeast transformation II (Zymo Research) with minor modifications. Transformations into all other strains were conducted using a standard lithium acetate transformation protocol (Ito et al., 1983; Gietz and Woods, 2002).
Media
Growth and fermentation rates were compared using various types of media, including rich YPD media where D is glucose/dextrose added to 2% (2%) or 20% (20%) with or without supplements at the indicated concentrations (ethanol, acetic acid); YP media with galactose (2%, YPGalactose) or glycerol (3%, YPGlycerol); or amino-acid supplemented white or red grape juice media (20–21°Bx with added leucine, histidine, lysine, and uracil; (white grape juice, WGJ-AA; red grape juice, RGJ-AA) at the indicated temperatures (°C). Grape juice concentrate (Global Vinters Inc., Canada) supplied at ∼68°Bx (1°Bx = 1 g/100 mL) was diluted to 20–21°Bx with distilled deionized water using a triple scale hydrometer and confirmed with a refractometer (Milwaukee). Grape juice media was supplemented with 200 mg/L histidine, 300 mg/L leucine, 300 mg/L lysine, and 200 mg/L uracil for use in growth and fermentation experiments. The yeast assimilable nitrogen (YAN) in this media (242.5 mg N/L) was determined using the formol titration method (Gump et al., 2001). In some experiments, ammonium sulfate was added to the media at 1 g/L to increase the YAN to (434 mg N/L).
Growth Curves
Saturated precultures were prepared in triplicate by overnight incubation in selective media with aeration at 30°C. Cultures were then diluted in the same media and incubated to exponential phase and then diluted to an initial concentration of 5 × 10⁶ cells/mL based on hemocytometer counts. Growth was monitored spectrophotometrically at 600 nm over time. Growth rates and other parameters such as lag and doubling times were analyzed using GrowthRates v3.0 (Hall et al., 2014; Mira et al., 2017; Hall et al., 2020) as an unbiased way to identify datapoints comprising the linear part of the growth curve. Differences among the WY MED15 alleles the LAB allele and the deletion (med15Δ) were evaluated using ANOVA with Tukey post-hoc analysis (Tukey, 1949). ∗, p < 0.05; ∗∗, p < 0.01; ∗∗∗, p < 0.001.
Spot Assays
Exponentially growing subcultures in selective media were differentially diluted to achieve a consistent initial concentration of 5 × 10⁶ cell/mL. 10-fold serial dilutions were carried out in the wells of a sterile 96 well microtiter dish. 2 μl volumes of each dilution were spotted on different types of solid media. Phenotypes were observed and imaged daily.
Fermentation Methods
Fermentation Reactions
Small scale fermentation reactions were fashioned after Peltier et al. (2018). 5 mL fermentations were conducted in 10 mL molded sterile clear glass vials with tight rubber cap closures (American Clinical Supplies Inc.). The cap was punctured with a 25 G × 7/8 (0.5 mm × 22 mm) hypodermic needle which remained in place to allow CO2 release from the system while still restricting evaporation (Peltier et al., 2018). Yeast cultures were prepared for fermentation by incubating in SC-leucine media which selects for the presence of the MED15 expression plasmid for 2.5 days. After saturation, cultures were diluted 1:20 into fresh SC-leucine media, the cell count determined using a hemocytometer, and the OD600 determined spectrophotometrically. 1.25 × 10⁷ cells from saturated cultures were added to 5 mL prepared white grape must with added amino acids (or other media as indicated in the figure legends) in the fermentation vials to a final cell concentration of 2.5 × 10⁶ cell/mL. Uninoculated vials with the same volume of grape must were used to control for contamination. Fermentation vials were incubated at 25 ± 1°C using a heated shaker in a 4°C cold room with agitation at 175 ± 5 rpm. Progression through fermentation was determined using daily weight loss measurements with multiple different transformants (biological replicates) per genotype. In pre-treatment experiments cultures were prepared as above, subcultured and grown to early log phase before being subjected to 38°C or to WGJ (diluted 1:3 in YPD) for 1 h. After treatment, cells were gently pelleted and resuspended in full-strength WGJ in fermentation vials.
Ethanol Measurements
Ethanol measurements were averaged over 6 biological replicates. The assay was conducted in punctured fermentation vials identical to those used for weight loss. Samples were evaluated with the K-OH Ethanol Kit (Megazyme) which measures NADH produced following enzymatic conversion of ethanol to acetaldehyde and then to acetic acid and NADH. The Megazyme protocol was adapted for use in microtiter dishes. 10 μL samples consisting of yeast in WGJ were collected daily from vials prepared identical to and in parallel with fermentation vials, diluted in 90 μL of water, and incubated for 1 h at 30°C to release ethanol into the supernatant. 10 μL of each supernatant was further diluted and stored in microtubes until assayed. Reagents (minus the alcohol dehydrogenase enzyme) were combined and added to microtiter dish wells containing the appropriate supernatant dilutions (typically 1:200 for day 1 and 1:1000 for subsequent days) and a background absorbance (A340) reading taken. The alcohol dehydrogenase enzyme was then added to each well to initiate the reaction. Following a 5-min incubation at room temperature, spectrophotometric readings were taken every minute until the A340 reading stabilized. An ethanol standard at 0.05 μg/μL was included in every experiment. The change in absorbance was used to calculate the concentration of ethanol in g/L using the formula provided.
Cell Counts and Viability
To determine cell number and viability in the fermentation cultures, fermentation experiments were set up in duplicate with one vial being evaluated for weight loss and never opened, and a second punctured fermentation vial identical to those used for weight loss sampled once daily throughout the time course. 20 μL samples were removed from each culture for hemocytometer counts and OD600 measurements using a plate reader. Diluted samples were also resuspended in 100 μL 1× PBS solution and 100 μL methylene blue (0.1 mg/mL methylene blue in 2% dihydrate sodium citrate) incubated for 5-min and then examined microscopically to estimate the percentage of metabolically inactive (staining blue) cells (n = 200 cells).
Viability/vitality was also assessed using the FUN-1 stain {[2-chloro-4-(2,3-dihydro-3-methyl-(benzo-1,3-thiazol-2-yl)-methylidene)-1-phenylquinolinium iodide], Molecular Probes, F7030} according to manufacturer’s directions. Yeast cells were washed in staining buffer (2% glucose and 10 mM Na-HEPES at pH 7.2), resuspended in staining buffer with 2 μM FUN-1, and incubated for 60 min at 30°C in the dark prior to microscopy. In live cells, FUN-1 is converted from a diffusely distributed pool of intracellular green fluorescence to compact orange-red intravacuolar structures, a process that requires both plasma membrane integrity and metabolic capability. Metabolically inactive cells exhibit a uniform green glow and lack fluorescent intravacuolar bodies due to the non-specific distribution of the dye. Extremely bright, diffuse, green-yellow cytoplasmic fluorescence was taken to represent cells that have become permeabilized with consequent rapid uptake of the dye with staining of protein and DNA (Millard et al., 1997). The ratio of cells exhibiting red fluorescence over those exhibiting green or bright yellow fluorescence (N > 200 cells) for each strain and time point was used in calculating the percent viable or vital cells in each population.
Reactive Oxygen Measurements
Reactive oxygen species levels were measured daily during the fermentation time course using the oxidant-sensitive cell permeable 2’7’ dichlorofluorescein diacetate (H2DCFDA) fluorogenic probe (Sigma). Samples were removed from punctured fermentation vials (set up in parallel and not used for weight loss measurements) and processed as previously described (Sinha and Pick, 2021). Fluorescence was measured in 96 well microtiter dishes with a Cytation 5 plate reader. Fluorescence values were calculated by subtracting the fluorescence in unstained samples from the fluorescence in the corresponding stained sample, and normalizing to the culture density (OD600).
Reproducibility and Statistics
Fermentation experiments were conducted using multiple transformants (up to 10) of each plasmid type as indicated in each figure legend. Each experiment was repeated on at least two separate occasions. Fermentation data is plotted using GraphPad Prism 8.4 either as line graphs, or by day using box and whisker plots, with boxes above and below the median representing the 1st and 3rd quartile and whiskers represent the 10th and 90th percentile. Differences between each WY MED15 allele and the LAB allele or between the med15Δ and the LAB allele were evaluated by two-tailed t-test, with the Holm-Sidak multiple testing correction (Padj) where indicated, or one-way ANOVA with Tukey (1949) post-hoc analysis using GraphPad Prism 8.4 as indicated in the legends ∗, p 0.05; ∗∗, p 0.01; ∗∗∗, p 0.001.
Results
MED15 Is Required for Tolerance to Fermentation Stresses and for Normal Fermentation Kinetics
The role of MED15 in the growth of yeast in fermentation conditions was evaluated by examining the med15Δ mutant on plates prepared with white grape juice with amino acid supplementation (WGJ-AA) and other fermentation stressors. The effect of temperature was also evaluated since commercial fermentation reactions are typically carried out at 20–30°C for red wine and below 15°C for white wine (Reynolds et al., 2001). The med15Δ strain is cold-sensitive; it failed to grow at 14°C and grew poorly at 20°C (Figure 1A). Interestingly, the cold sensitivity of the mutant at 20°C was partially alleviated on WGJ-AA media. Conversely, the slight sensitivity of the med15Δ mutant to high temperatures was exacerbated in the presence of osmotic stressors such as grape juice (Figure 1A). The deletion strain also grew poorly relative to the wild type strain at 50 mM acetic acid (Figure 1A) and failed to grow on media containing 6% ethanol (Figure 1A). These concentrations were determined empirically and were chosen to give the greatest contrast in phenotype between the MED15 and med15Δ strains. The acetic acid concentration of 50 mM is much higher than is normally present in wine while 6% ethanol is much lower than is normally present in wine.
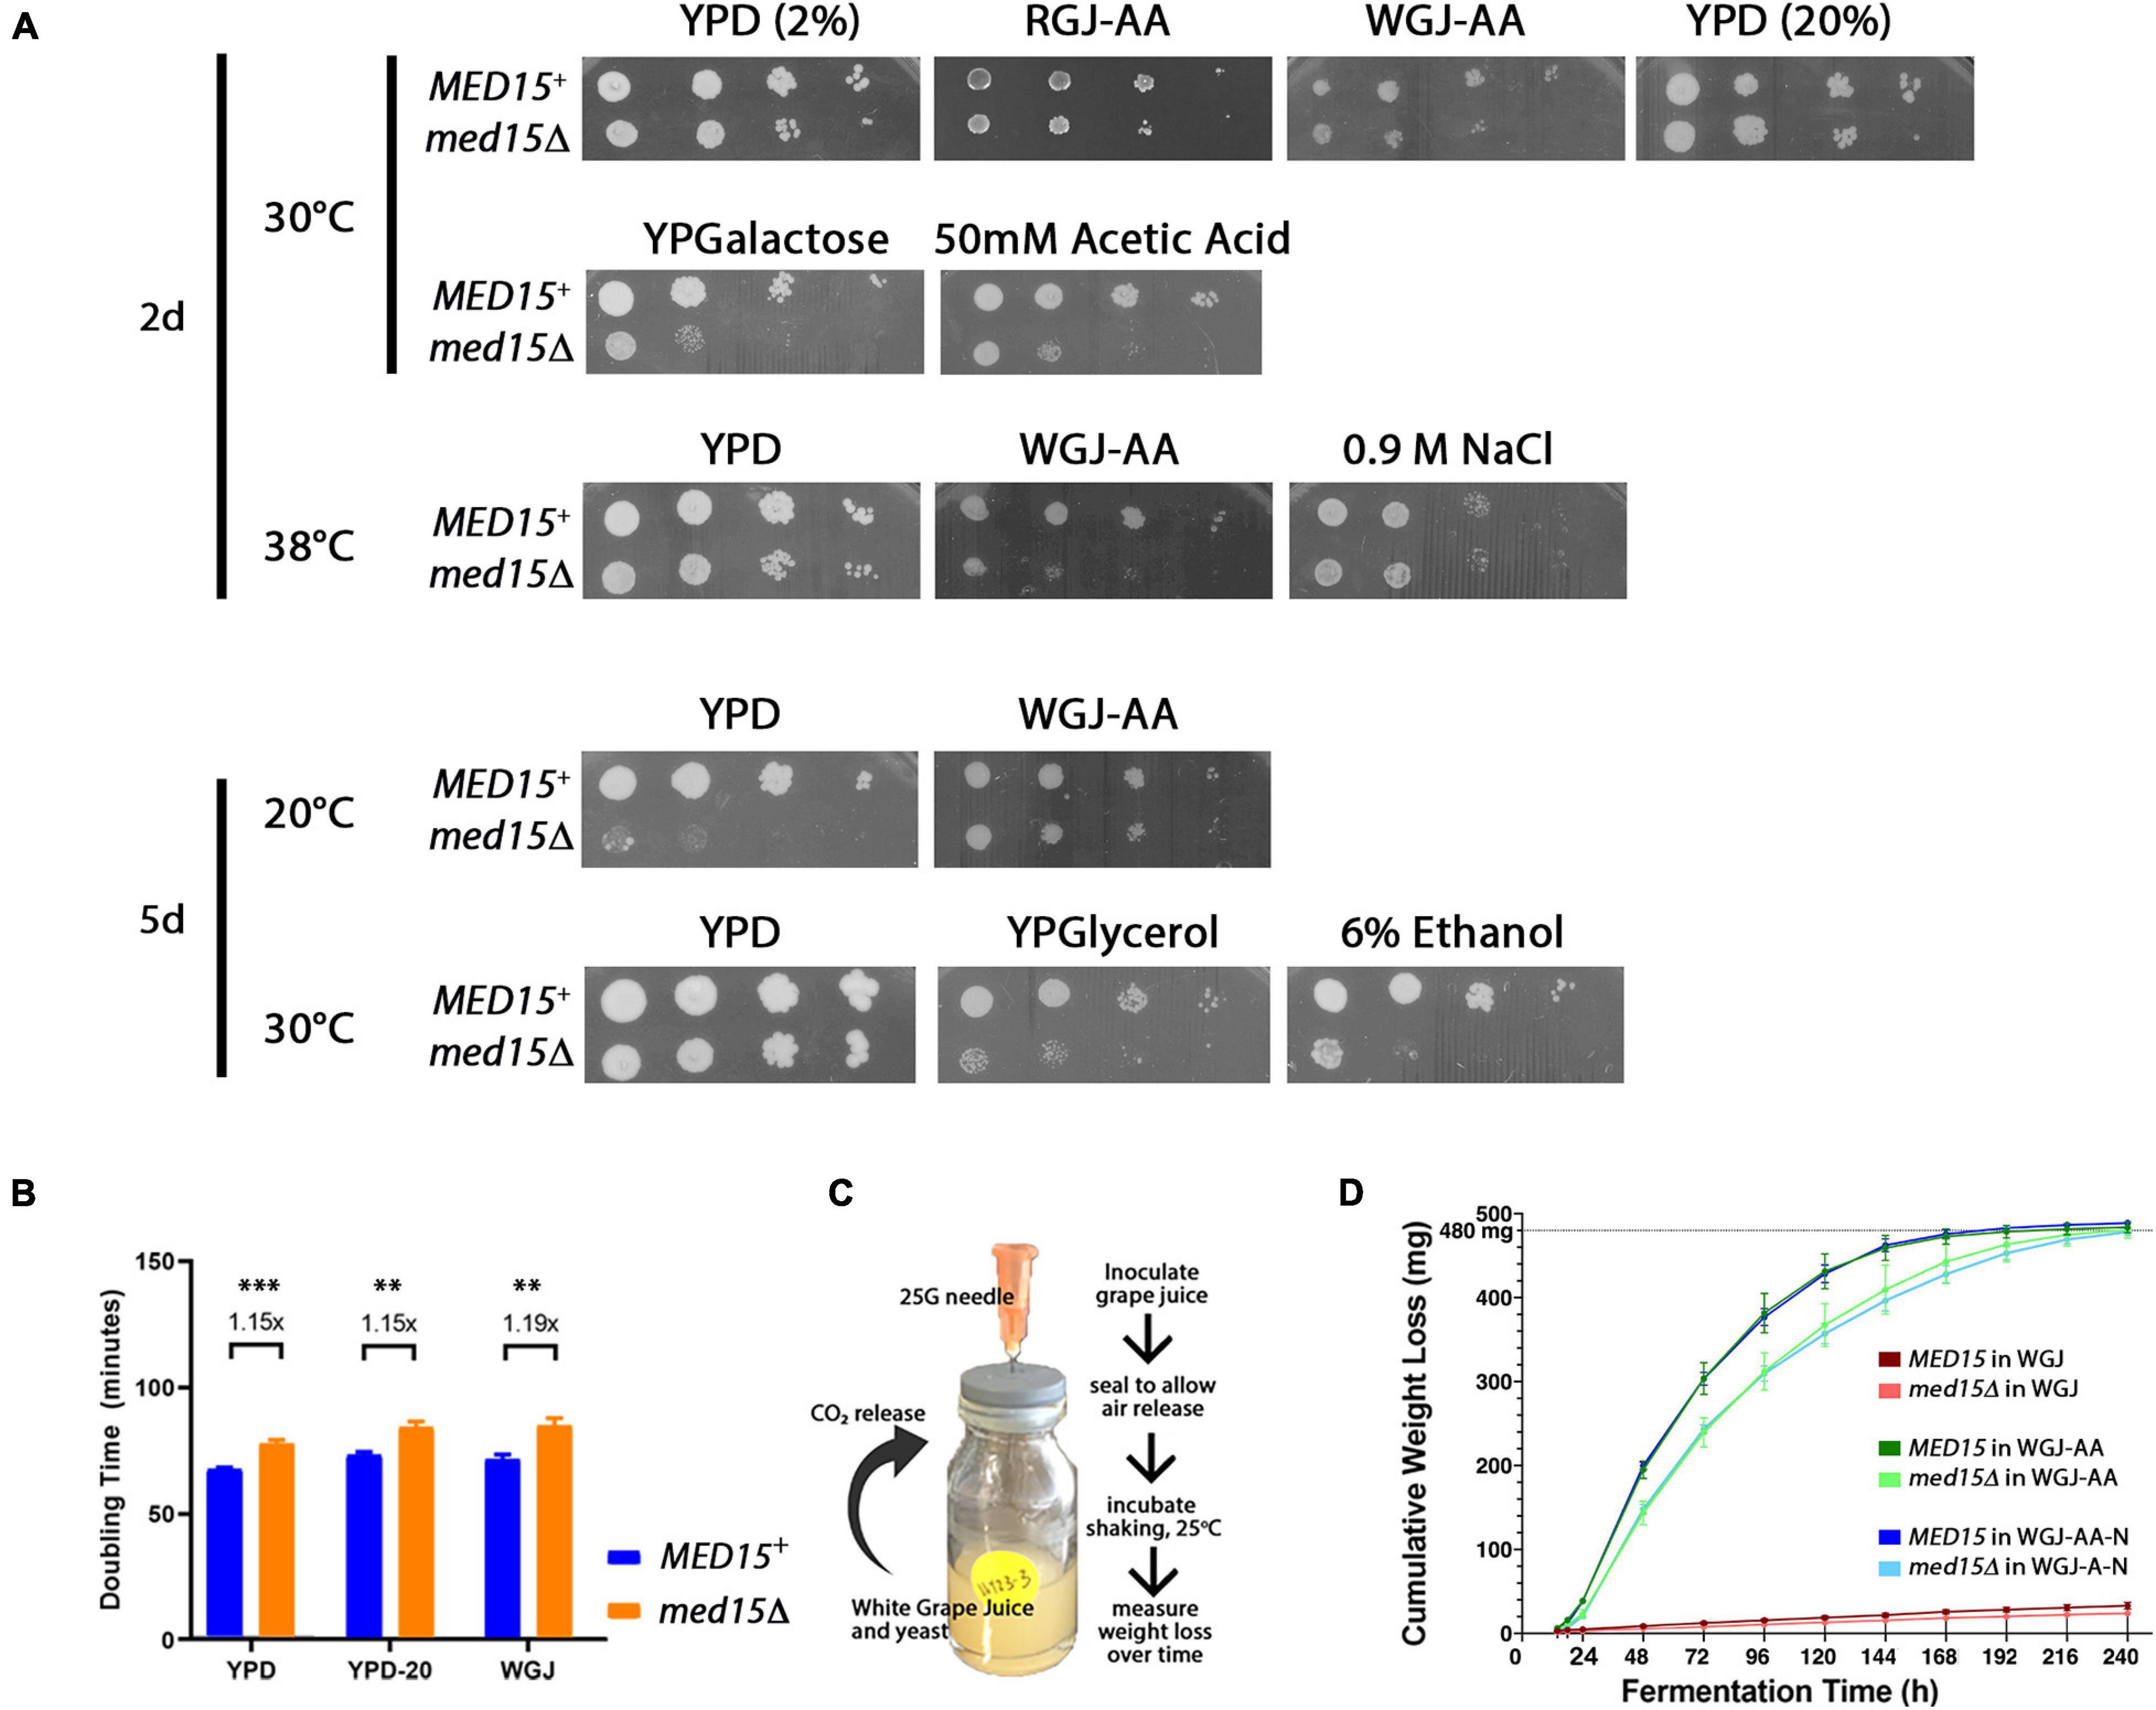
Figure 1. Med15 growth and fermentation activities. (A) Phenotypic analysis using 10-fold serial dilutions of log-phase MED15 and med15Δ cultures spotted on rich YPD media where D is glucose/dextrose added to 2% (2%) or 20% (20%) with or without supplements (ethanol, acetic acid), or on YP media with galactose (YPGalactose) or glycerol (YPGlycerol) or on amino-acid supplemented white or red grape juice media (20–21°Bx with added leucine, histidine, lysine, and uracil; (white grape juice, WGJ-AA; red grape juice, RGJ-AA) at the indicated temperatures (°C). (B) Growth, depicted as doubling times of WT (MED15) and med15Δ strains in rich media (YP) containing 2% glucose [YPD (2%)], 20% glucose [YPD (20%)], and supplemented white grape juice (WGJ) at 30°C. (C) Fermentation apparatus and experiment schematic. 1.25E7 cells were added to 5 mL of supplemented WGJ media in a small vial. A needle was inserted through the rubber seal to allow CO2 escape. Vials were incubated at 25°C in a shaking incubator and measurements of weight loss were made daily. (D) Cumulative weight loss over 7 days for WT and med15Δ strains in WGJ (no supplements), WGJ-AA (amino acid supplemented), and WGJ-AA-N (amino acid plus nitrogen supplemented). For panels (B,D), data points are the averages of 3–6 biological replicates (transformants) and error bars are the standard deviation of the mean. Weight loss comparisons between genotypes were significantly different (p ≤ 0.01) at all time points in all media with the exception of 14 h in WGJ-AA (Supplementary Figure 1). Significance was determined using two-tailed t-tests.
Although grape juice media presents a relatively hostile environment even before cells begin the fermentation process, including nitrogen and amino acid limitation, high initial sugar concentration (hyperosmotic stress), and low pH between 2.9 and 3.9 (acid stress), the med15 mutation did not specifically compromise growth in the grape juice environment (Figures 1A,B). Tolerance to high sugar media was confirmed by measuring growth rate in YPD with 20% instead of the usual 2% glucose (Figure 1B).
To determine the fermentation efficiency of the med15Δ mutant relative to the isogenic WT strain we conducted small-scale fermentation reactions (Figure 1C). Weight loss was measured over 8–10 days as a proxy for progression through the fermentation process, as weight loss is proportional to carbon dioxide produced by fermentation. In experiments conducted with agitation at 25°C, CO2 loss in the WT strain plateaued between 5 and 6 days (120–144 h) (Figure 1D). The med15Δ strain exhibited a marked delay at the start of fermentation with ∼40% less weight loss than WT lab strain during the first 24 h.
To more precisely define the specific fermentation deficiencies caused by the absence of the MED15 gene, we determined the fermentation times at which the WT and mutant strains achieved comparable CO2 weight loss (Table 2 where T10 is time to 10% weight loss). The time to comparable weight loss were significantly different for all weight loss benchmarks evaluated (lag, t10, t35, t50, t80). For example, the fermentation lag time [time to 2 g/L weight loss (Peltier et al., 2018)] averaged 14.6 h in the WT strain compared to 18.8 h in the med15Δ strain (p = 4.24E-06).
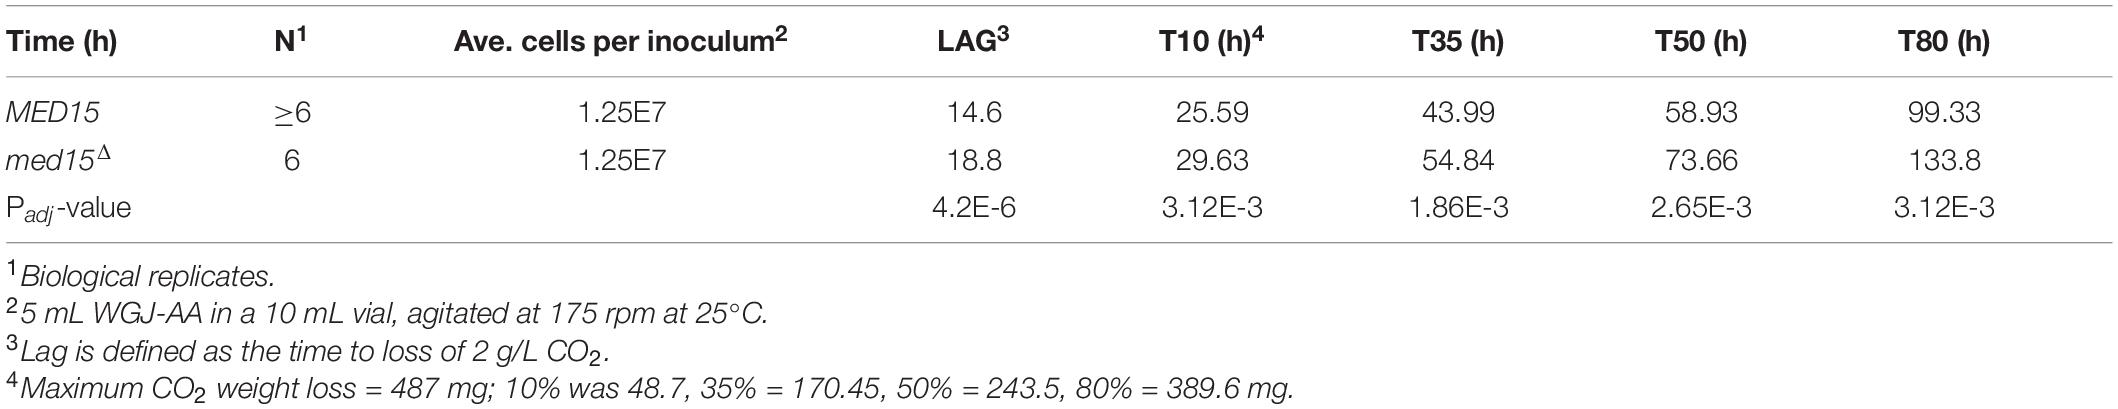
Table 2. Equivalent Times to Weight Loss Benchmarks.
We next investigated the effect of nitrogen availability on the slower fermentation kinetics in the mutant, by supplementing our standard fermentation media (WGJ-AA) with ammonium sulfate to increase the YAN from 242 to 434 mg N/L (WGJ-AA-N). There were no significant differences in weight loss for either the WT or mutant strain in either media type except at the earliest times (14 h, 18 h), where a small reduction in weight loss was observed for both genotypes in the nitrogen supplemented media (Figure 1D and Supplementary Figure 1). The time to equivalent weight loss benchmarks for the two strains was significantly different in WGJ-AA-N, just as it was in WGJ-AA media (Supplementary Figure 1).
In a companion experiment, we investigated the impact of providing extra sugar (22.1°Bx vs. 20.5°Bx) to the wild type and med15Δ mutant strain in the high YAN condition. The final (maximum) weight loss was increased in the wild type strain (528.4 mg versus 483.8 mg) 1.1-fold. In contrast, the mutant strain showed no comparable weight loss increase (0.98-fold) suggesting that MED15 may play a modest role in sugar uptake or utilization (Supplementary Figure 1D). Interestingly, sugar consumption was incomplete regardless of genotype or media (Supplementary Figure 2).
The Vulnerability of WT and med15 Mutant Strains to Late Fermentation Stress
One explanation for the impact of the med15Δ on fermentation could be that there are fewer cells in the culture due to the increased doubling time, or that the strain undergoes progressive loss of viability under fermentation conditions. We therefore investigated to what extent the reduced fermentation rate in strains lacking MED15 was a function of diminished culture saturation or sensitivity to accumulated stress in late fermentation (stationary phase). All fermentation reactions were inoculated comparably, with exactly 1.25 × 10⁷ cells from a fresh stationary phase culture being added to each vial.
While the med15Δ strain does grow more slowly, cell density and cell count measurements reveal that the number of cells in the two strains is comparable by 48 h (Figure 2A). To determine if there are any differences in metabolic activity, cells growing in WGJ-AA or WGJ-AA-N were sampled every 24 h (sampling was from parallel punctured fermentation vials that were not being used for weight loss) with methylene blue or with the vitality dye, FUN-1 (Figures 2B–E). FUN-1 {[2-chloro-4-(2,3-dihydro-3-methyl-(benzo-1,3-thiazol-2-yl)-methylidene)-1-phenylquinolinium iodide]} which distinguishes between metabolically active, metabolically inactive and dead, permeabilized cells. To account for differences in nutrient availability and ethanol accumulation during fermentation at any particular time, comparisons of the two strains were made at times corresponding to CO2 weight loss benchmarks (Table 2) rather than at comparable times. The percentage of methylene blue staining cells (dead) trended higher in wild type cultures than in med15Δ cultures at benchmarks up to T80 (P < 0.1) but not later (Table 3). The conclusion using the FUN-1 stain supported these observations. Dead (permeabilized, yellow) and metabolically inactive cells started accumulating in mid-fermentation regardless of genotype (Figures 2B,C) with less than 25% of WT cells falling into the metabolically active category after day 4. Benchmark analysis showed that viable cells (red + green) were significantly elevated at T10, T50, and T80 benchmarks in the mutant relative to wild type (Table 3 and Figures 2D,E).
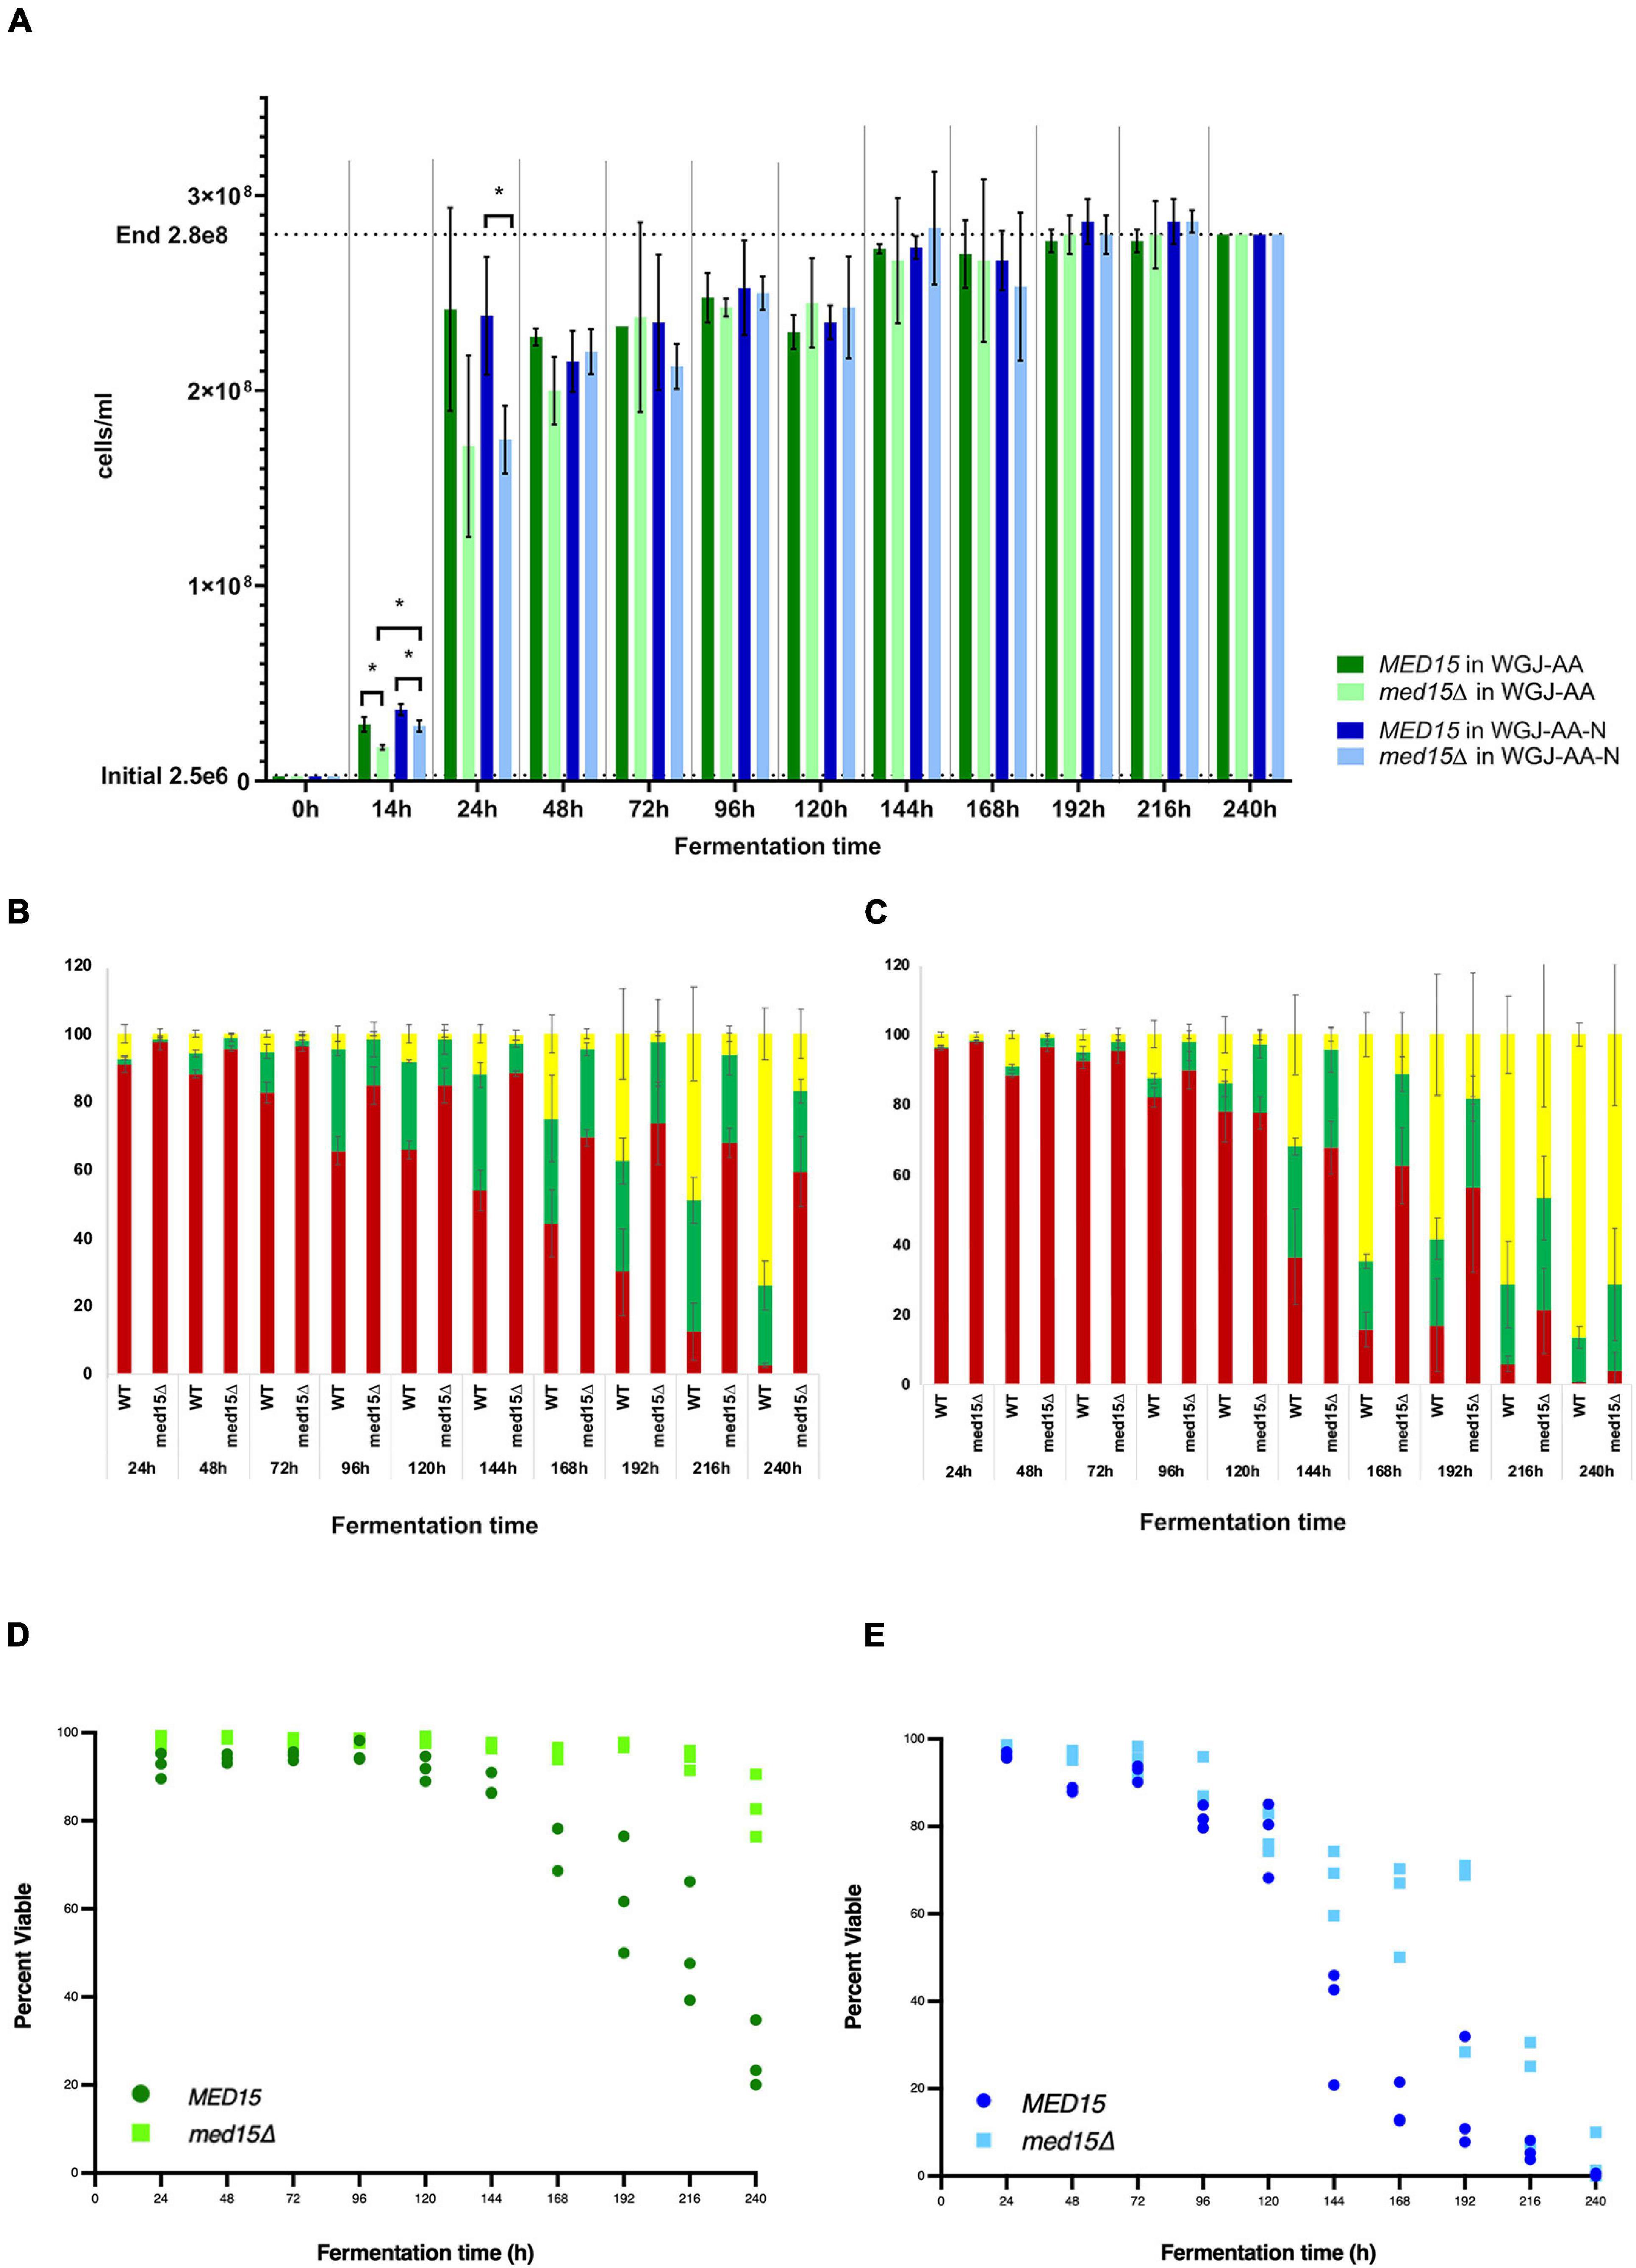
Figure 2. MED15 mutants are less sensitive to late fermentation stresses. (A) Cell number was determined microscopically using a hemocytometer for the WT and med15Δ mutant in WGJ-AA and WGJ-AA-N media. (B,C) Results of FUN-1 staining with individual tallies of red (metabolically active), green (metabolically inactive), and yellow (permeabilized, dead) cells at each time point in WGJ-AA (B) and WGJ-AA-N (C) media. (D,E) Plots of viable cells (red + green) at times during fermentation in WGJ-AA (D) and WGJ-AA-N (E). 3 biological replicates (transformants) are plotted for each time point for each genotype.
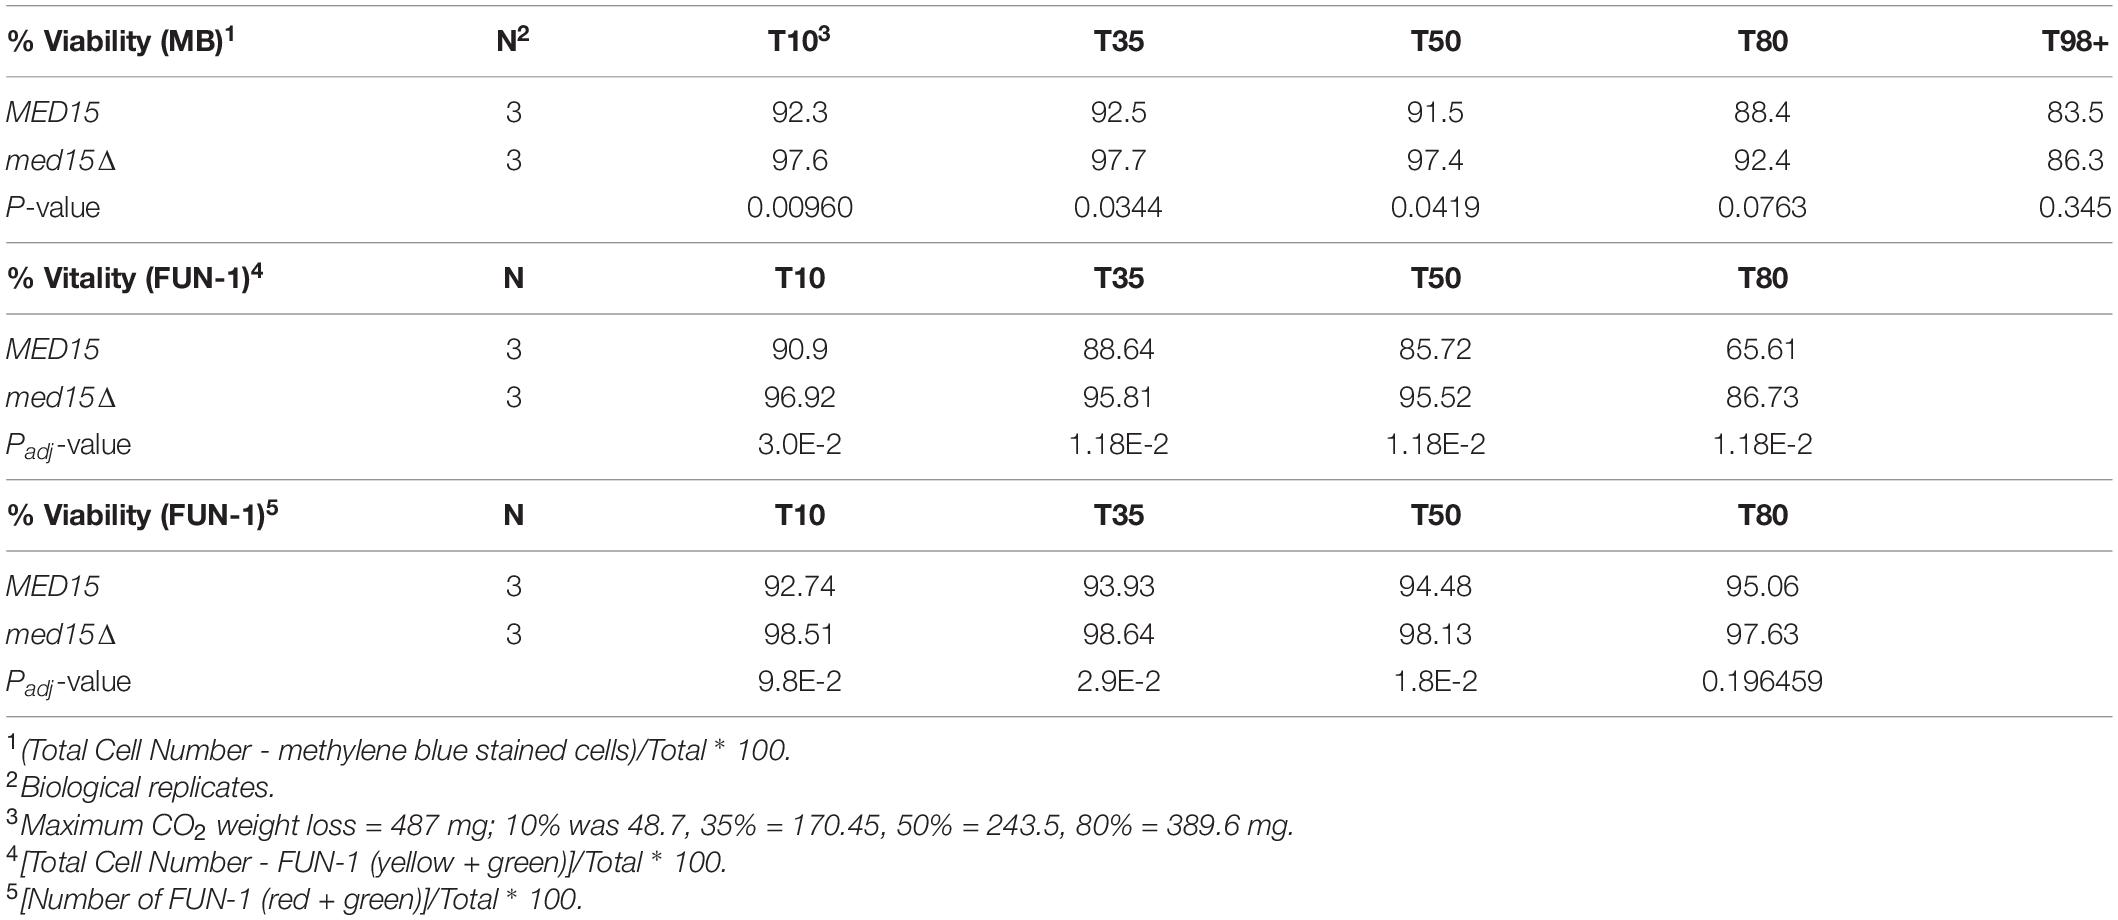
Table 3. Viability and Vitality in WGJ-AA at Weight Loss Benchmarks.
To determine if there was any impact of the med15Δ mutation on intracellular reactive oxygen species (ROS) which accumulate in response to rising ethanol levels and are partially attributable for the toxicity of the fermentation environment (Kitagaki et al., 2007) we measured ROS levels throughout the fermentation time course. Vials were opened at regular intervals for sampling. The first opening of the vial resulted in an ROS spike regardless of the specific time the vial was opened, and was likely artifactual. In the representative experiment shown in Figure 3, the spike occurred when the vial was opened at 8 h (not shown), but by 24 h the signal settled down, and was somewhat higher in the med15Δ strain than in WT. By 72 h the pattern began to change, with ROS produced by the WT strain outpacing that generated by the med15Δ mutant. When ROS was evaluated at equivalent weight loss benchmarks, only T80 and T98 were significantly different, with the level of ROS in the mutant being reduced relative to ROS in the wild types strain (Table 4).
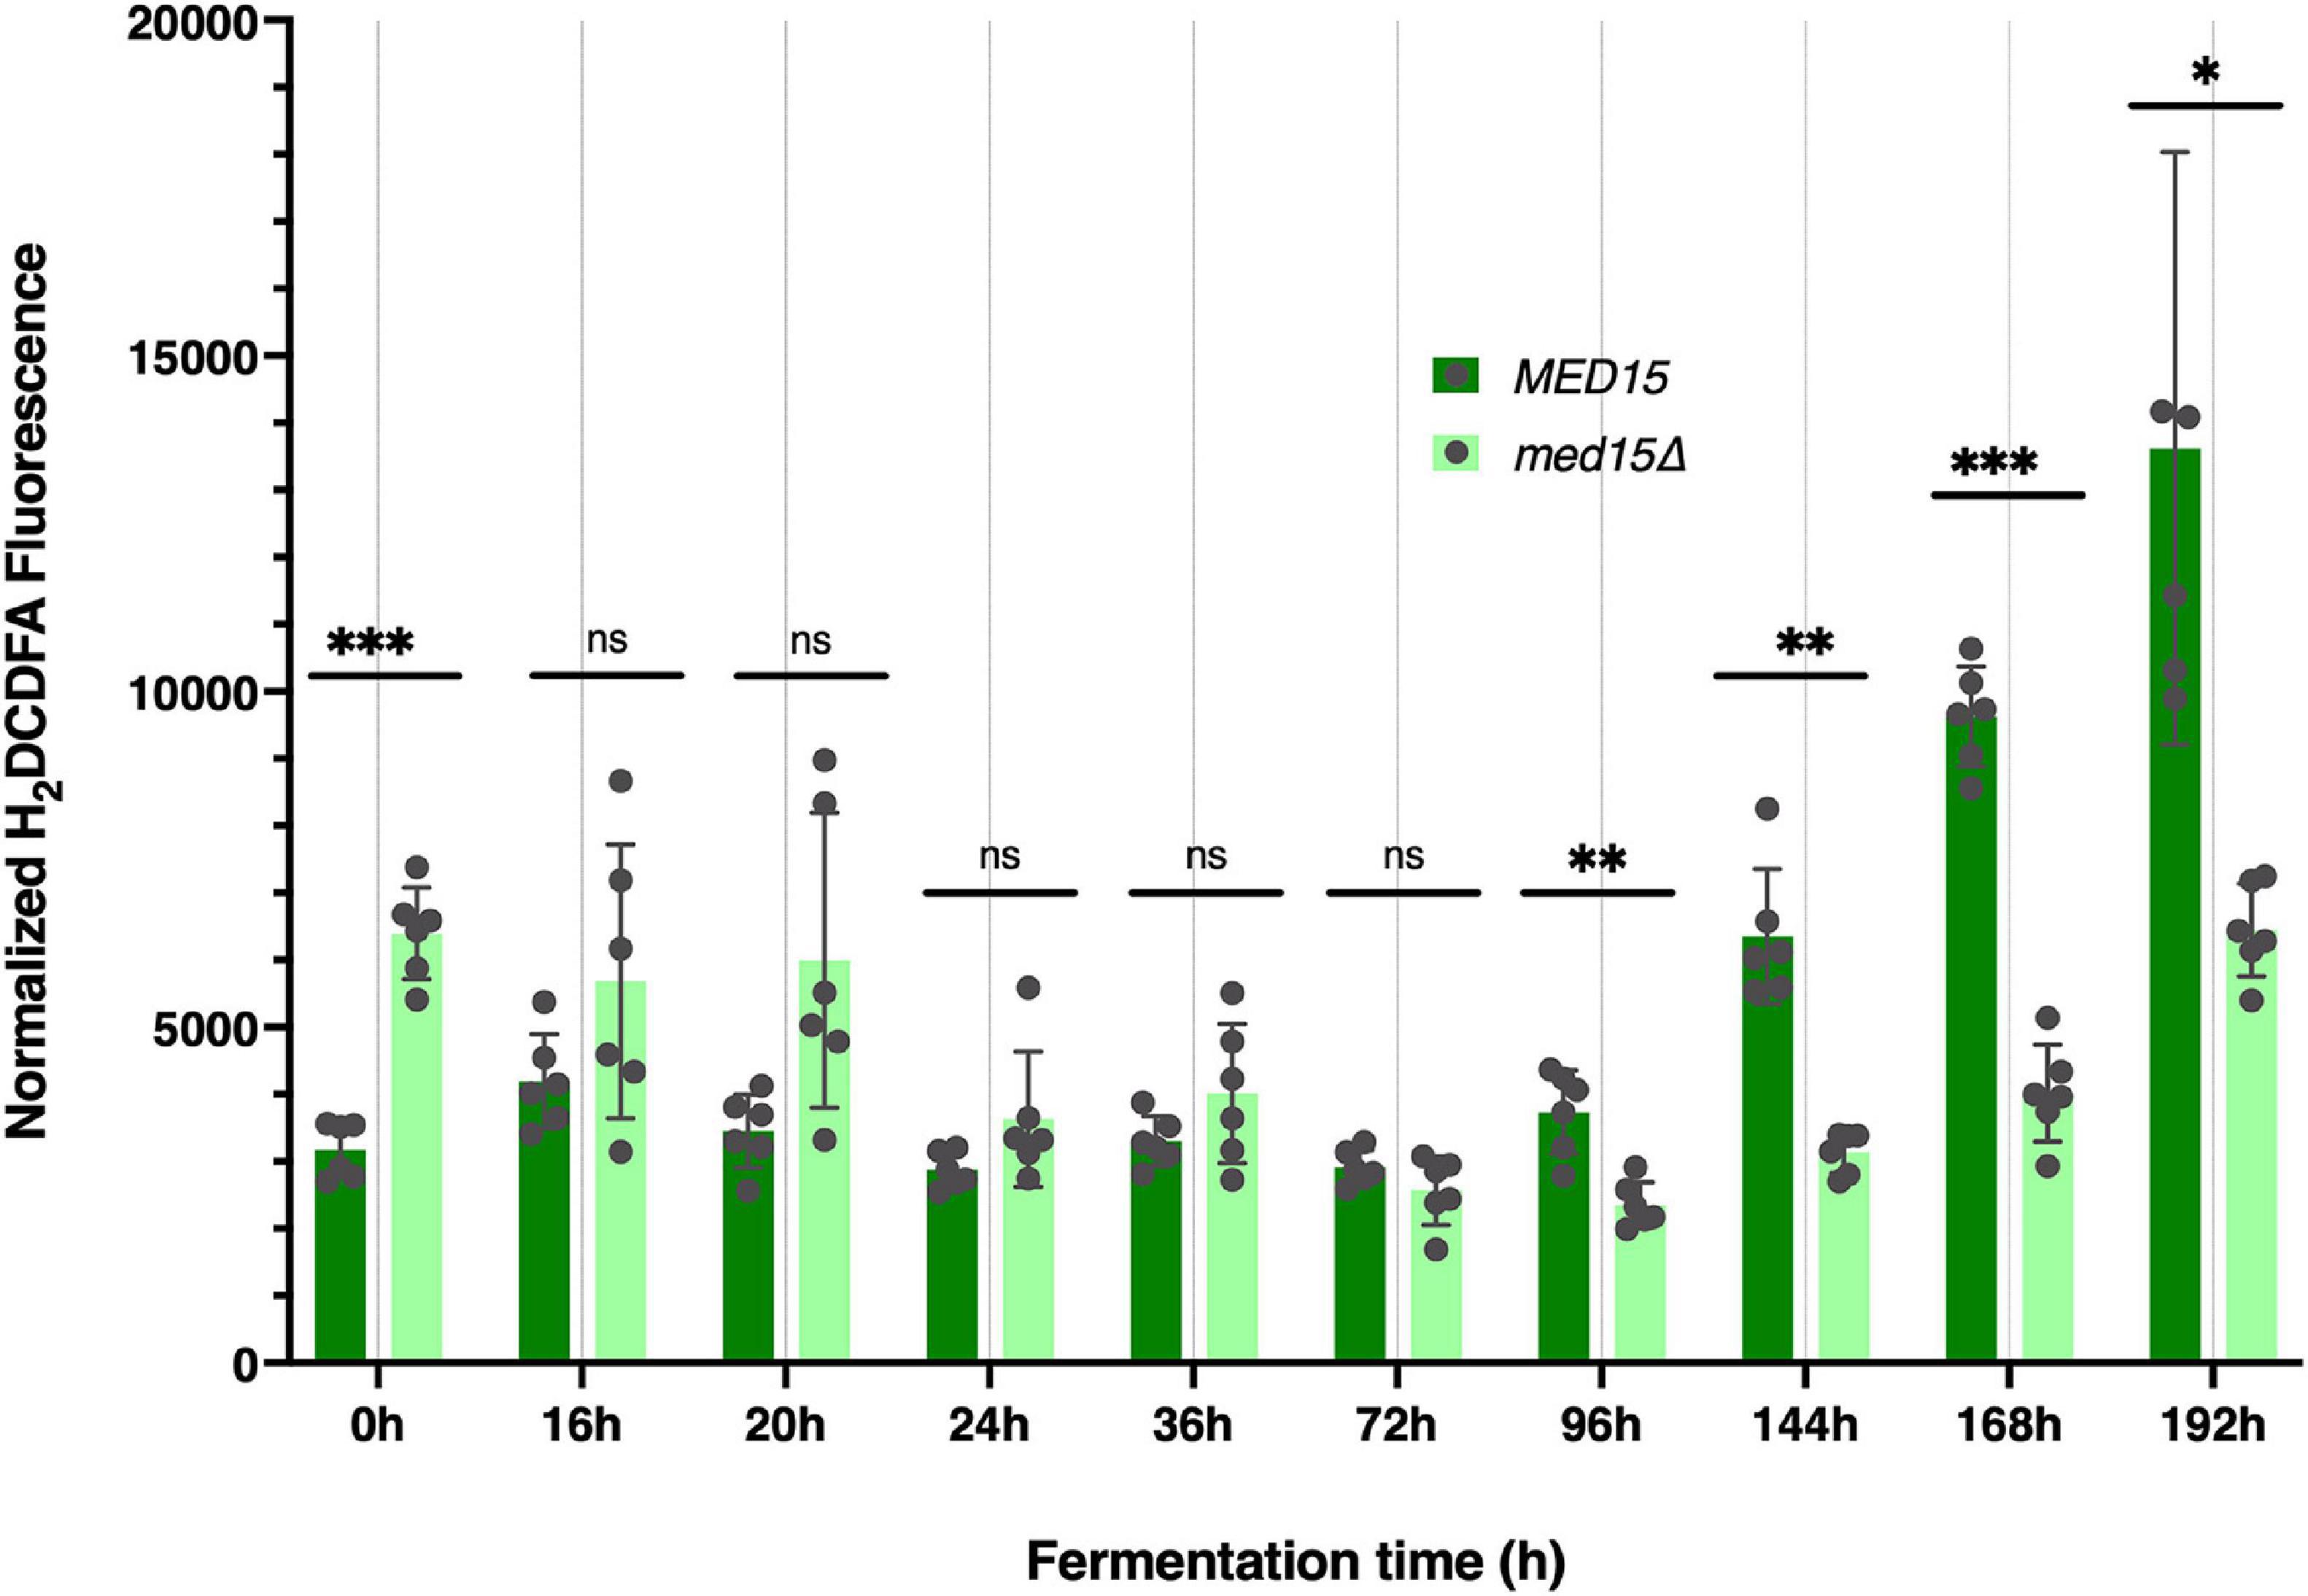
Figure 3. Reactive oxygen species are elevated at late times in fermentation specifically in the wild type strain. Reactive oxygen was measured at each time point in the fermentation time course and is shown as total arbitrary fluorescence units in H2DCDFA stained cells minus the fluorescence in unstained cells normalized to cell density. 3 biological replicates (transformants) and two technical replicates are shown; error bars are the standard deviation of the mean. Adjusted P values were determined with multiple two-tailed t-test and indicated as *, p ≤ 0.05; **, p ≤ 0.01; ***, p ≤ 0.001.
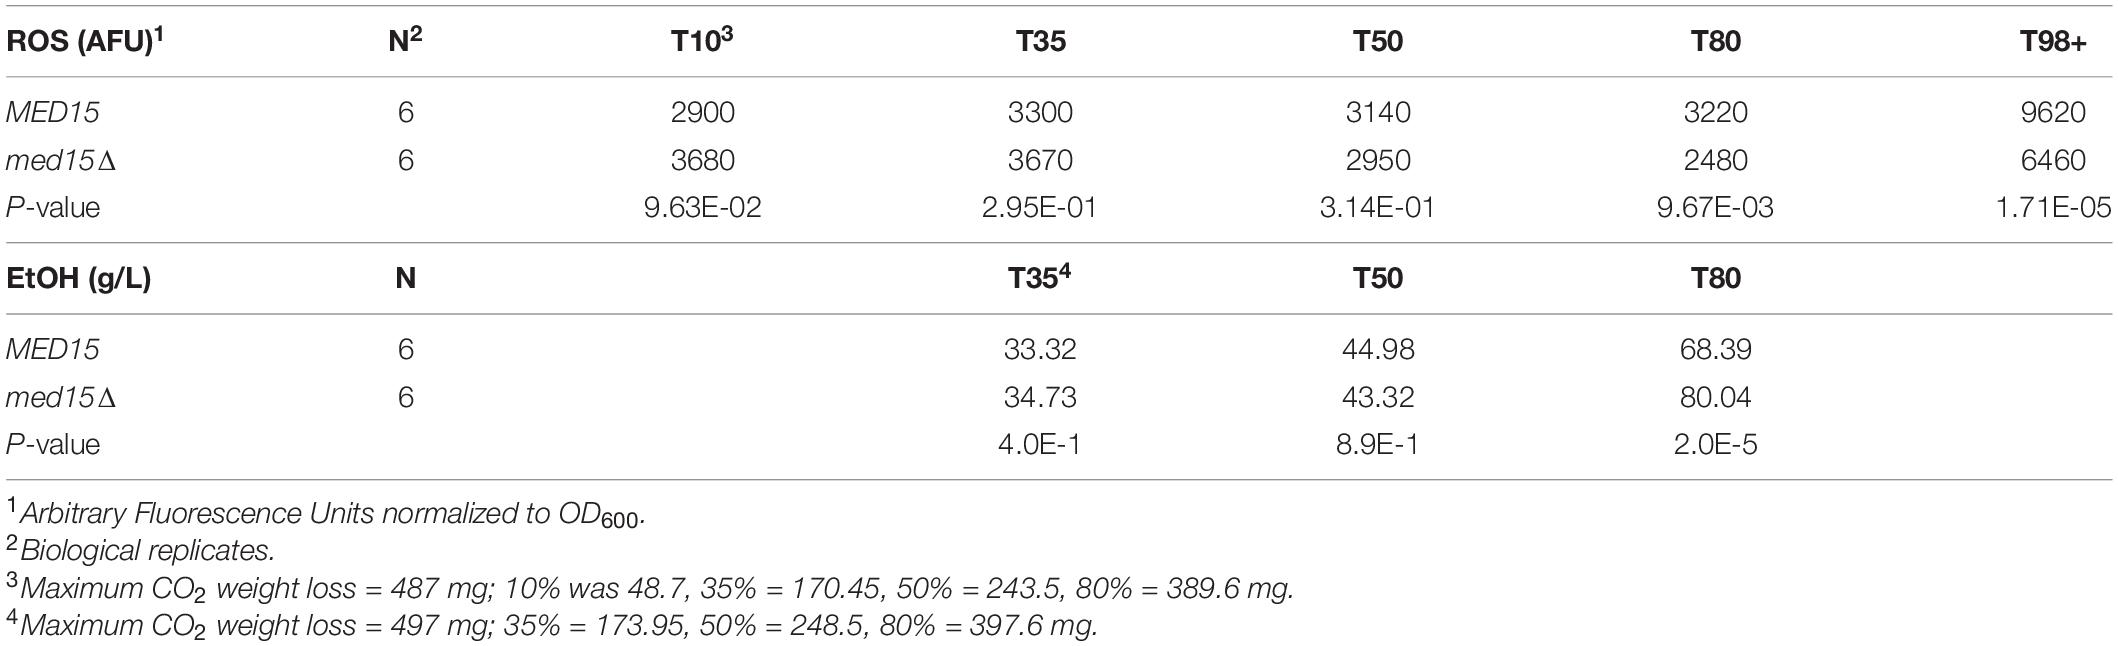
Table 4. Reactive Oxygen Species and Ethanol Levels in WGJ-AA at Weight Loss Benchmarks.
Taken together, we found increased viability and decreased ROS accumulation in the med15Δ mutant. Hence, there is no evidence that the reduced fermentation rate in the med15Δ mutant is attributable to a lower number of viable cells and we speculate that the altered fermentation kinetics in the med15Δ mutant is due instead to an extensively altered transcriptome affecting many genes involved in the production and metabolism of ethanol.
Ethanol Production Is Slower in the med15 Mutant
To investigate the impact of the med15Δ mutation on ethanol production, ethanol was measured over the fermentation time course. In the WT strain, ethanol levels peaked at approximately 6 days with approximately 90 g/L accumulated ethanol (Figure 4). As expected from the reduction in weight loss relative to the WT strain, the med15Δ strain produced less ethanol at the 6-day mark. When analyzed by CO2 weight loss benchmarks, the amount of ethanol produced at 35 and 50% weight loss is equivalent in the wild type and mutant strains, while the mutant has higher ethanol levels at the highest weight loss benchmark, perhaps due to fluctuation in the plateau phase of the curve (Figure 4) or previously noted defects in metabolism of non-fermentable carbon sources such as ethanol in the med15Δ mutant (Merz and Westermann, 2009; Bode et al., 2013; Table 4).
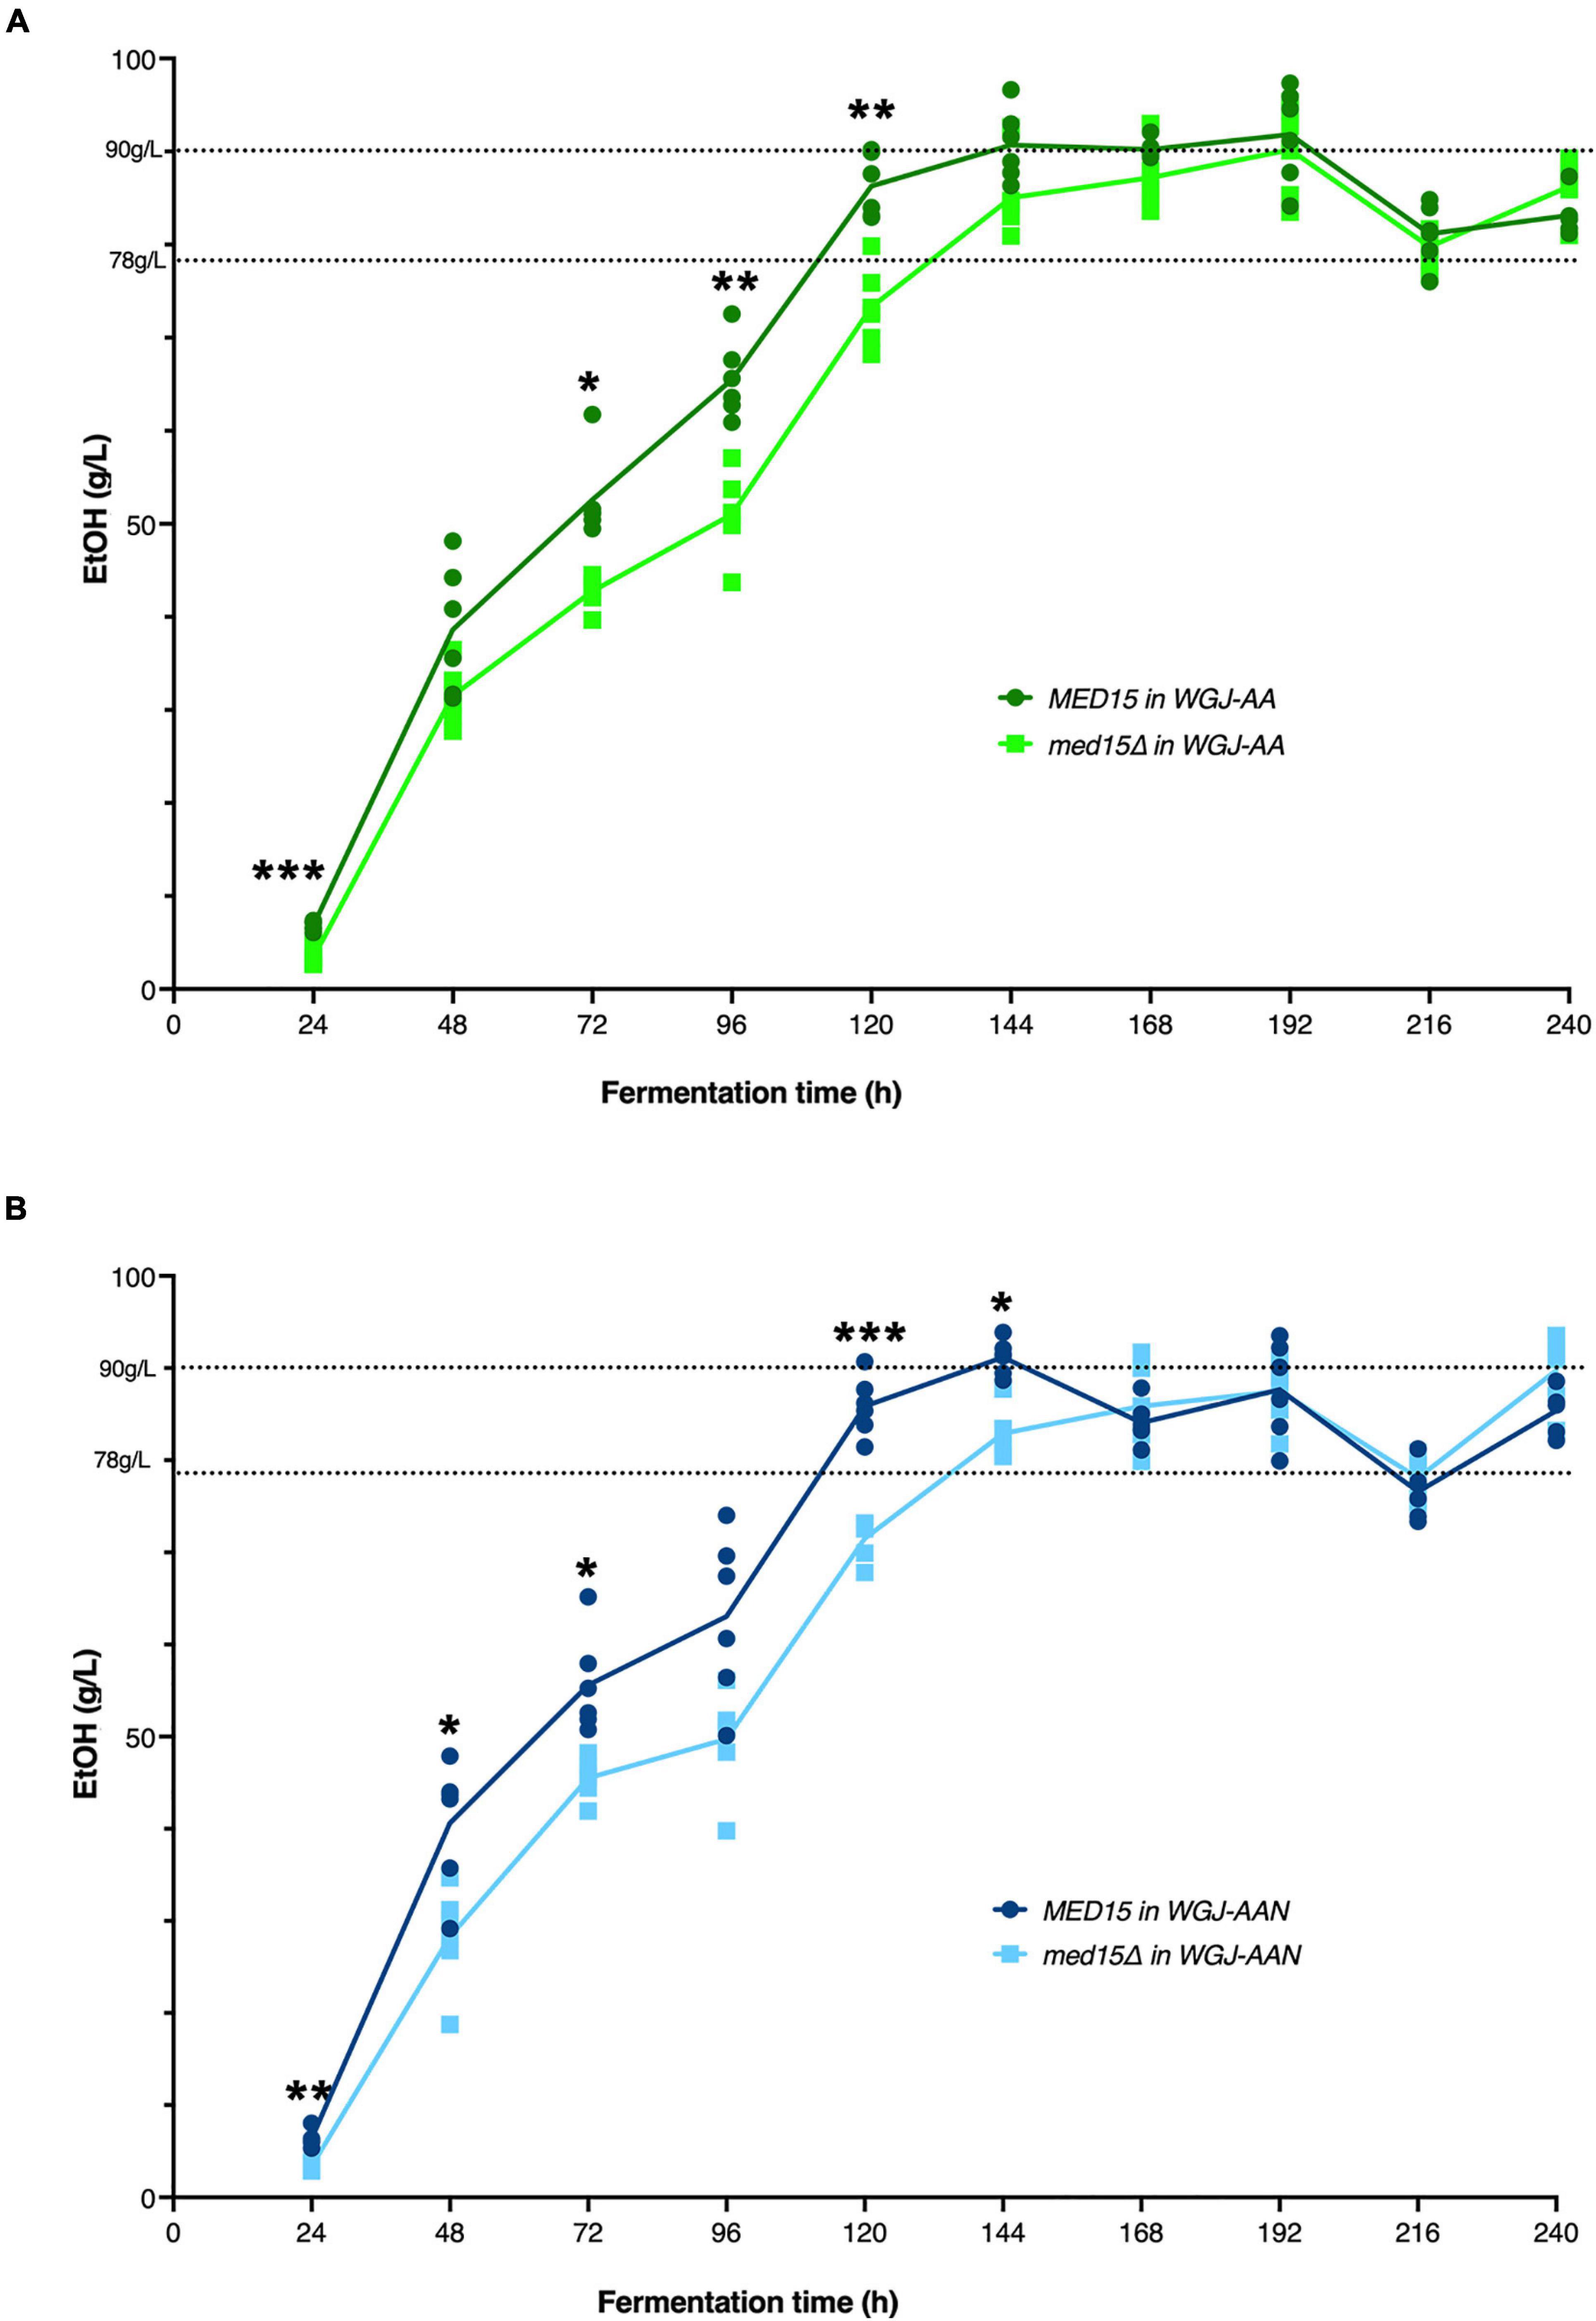
Figure 4. MED15 mutants are defective in rate of ethanol production. (A) Direct measurements of ethanol production in the wild type and med15Δ strains over a 10-day fermentation time course in WGJ-AA or (B) WGJ-AA-N. Graphs show 3 biological and two technical replicates. Adjusted P values were determined with multiple two-tailed t-test and indicated as *, p ≤ 0.05; **, p ≤ 0.01; ***, p ≤ 0.001.
Pre-treatment of the med15Δ Mutant With Low-Level Osmotic Stress Partially Suppresses the Fermentation Defect
We next investigated whether changes in the med15 fermentation profile might be due to a defect in adapting to the stresses inherent in the initial fermentation conditions. For example, the med15Δ mutant could be slower in activating stress response genes than WT, leading to a longer lag upon inoculation into grape juice media. To assess this, the length of time for the fermentation vial to begin losing weight was first compared using stationary phase versus log phase cells as inoculum. Stationary phase cells took longer than log phase cells to begin fermenting, and the lag was similar in both the WT and med15Δ strains, suggesting that the MED15 gene is not required for exit from stationary phase (Figures 5A,B).
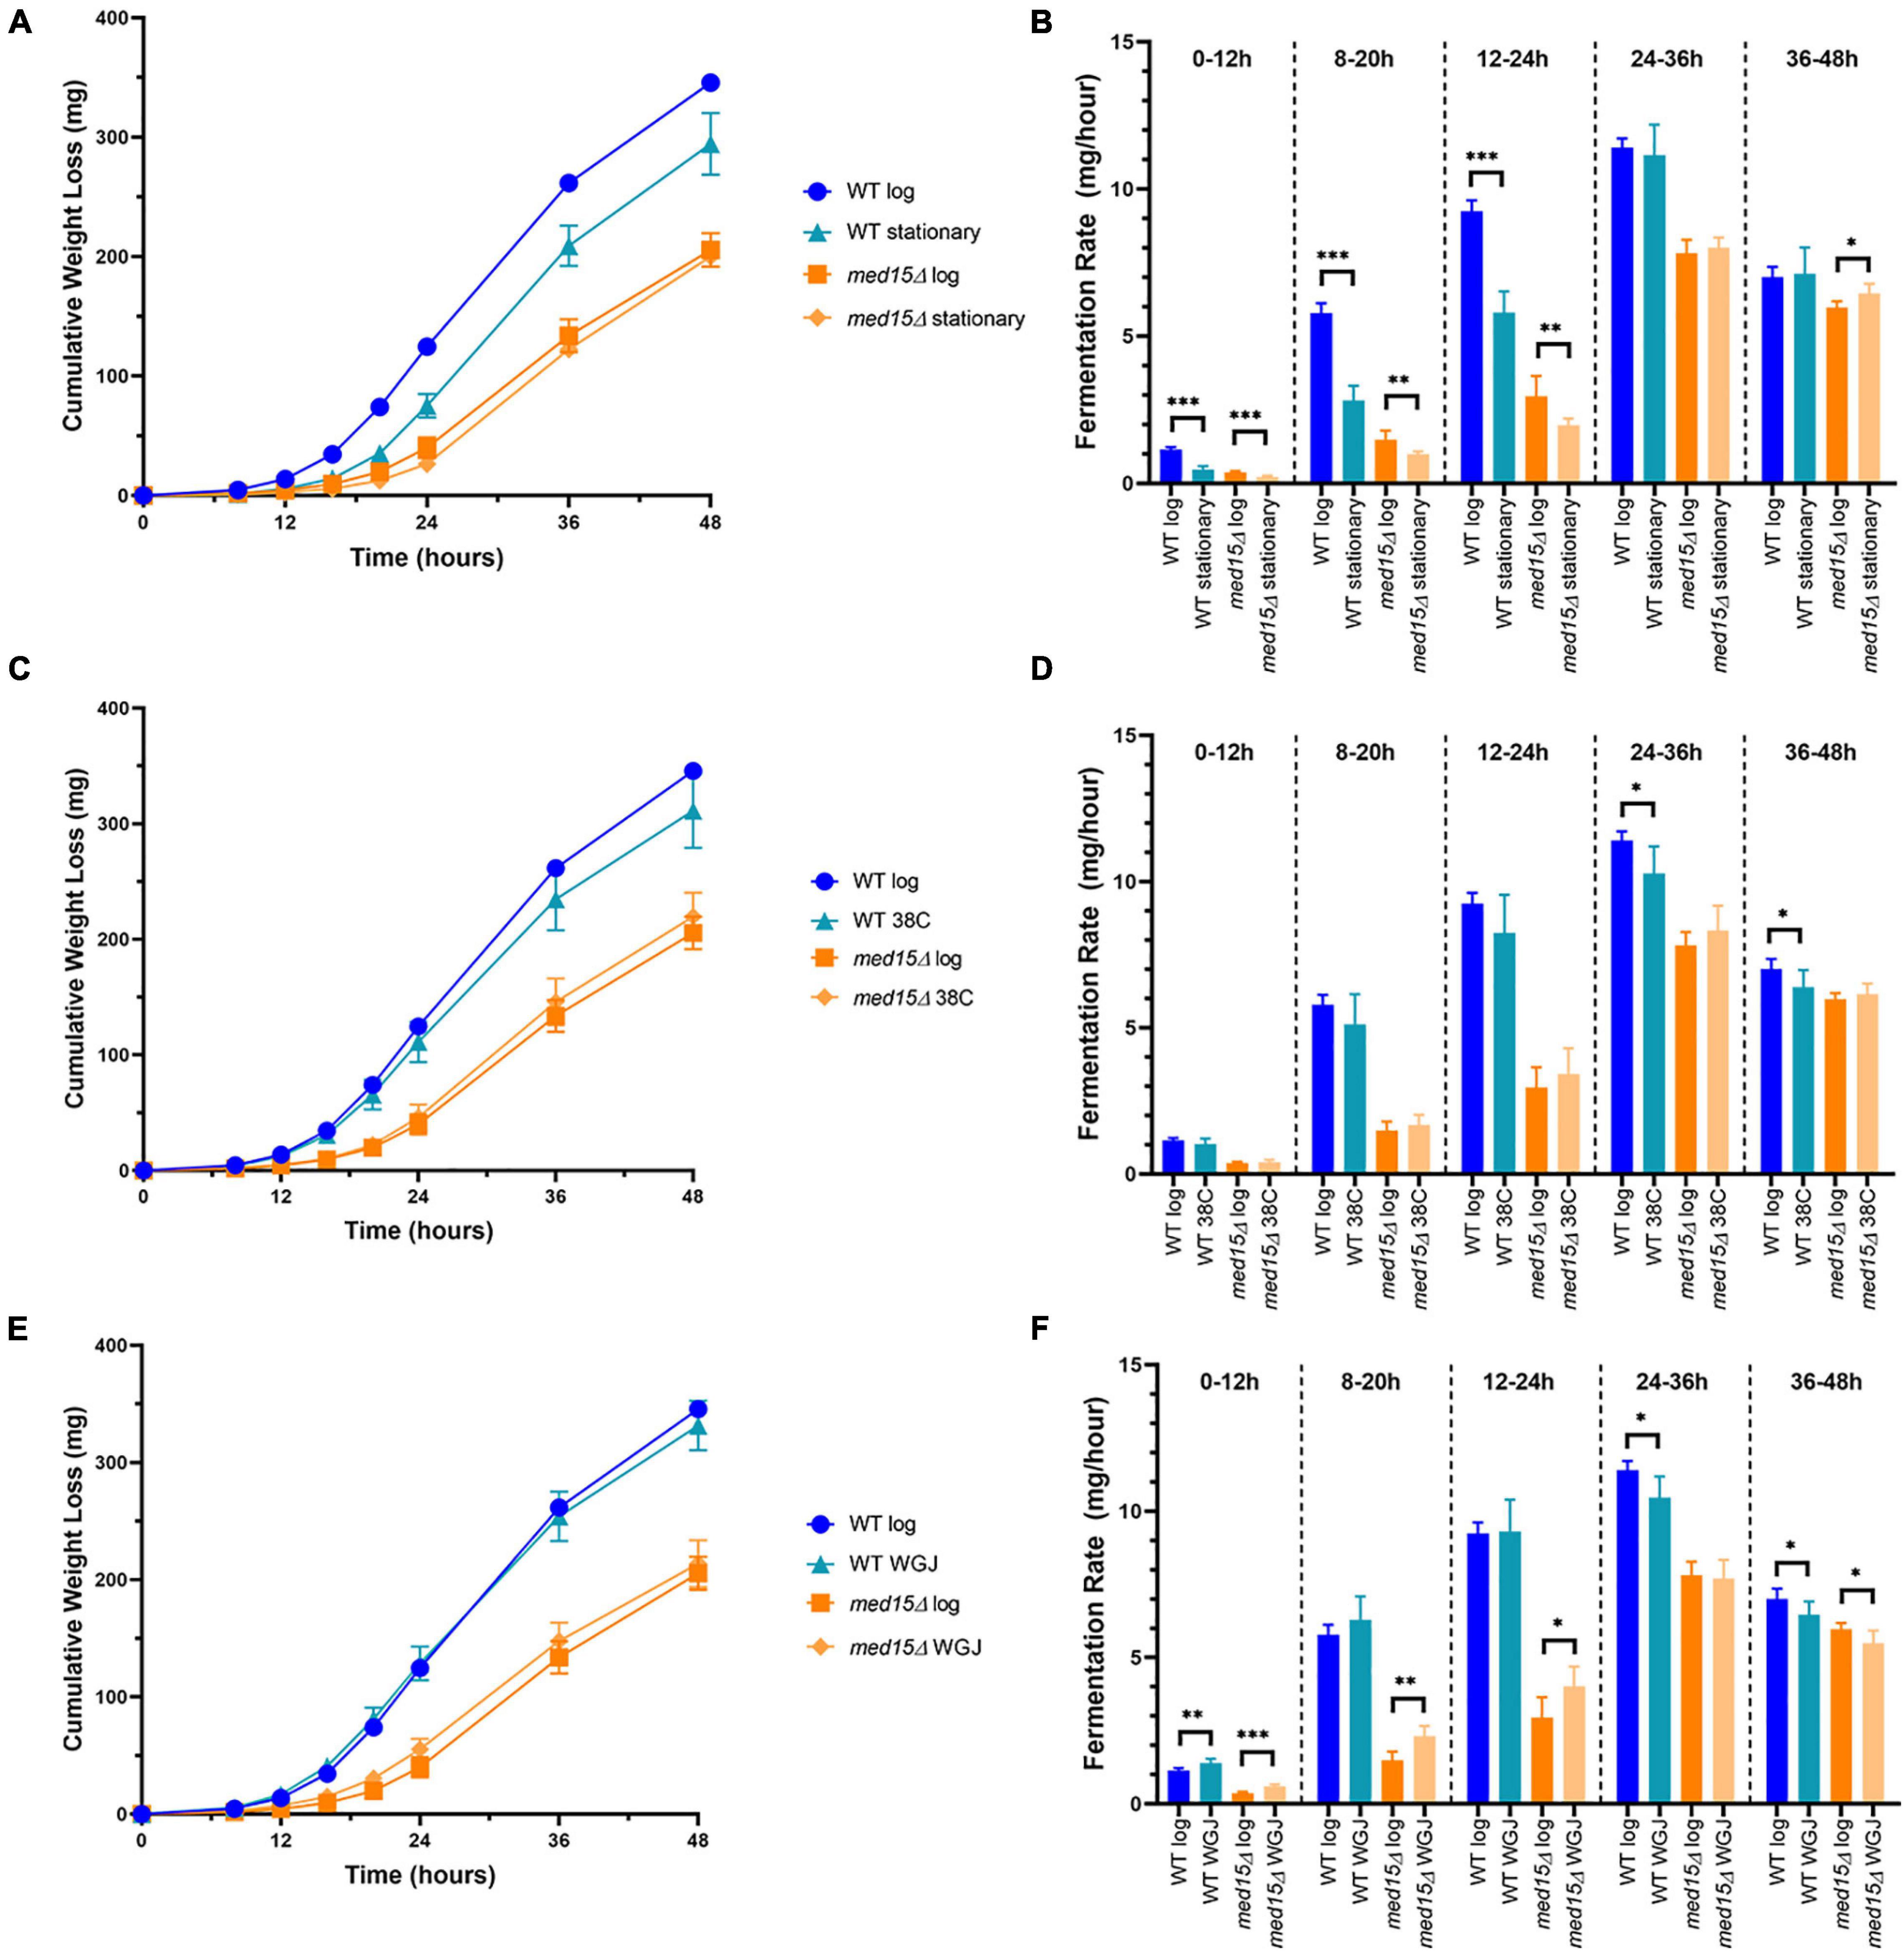
Figure 5. Fermentation in the med15 mutant can be improved by related (same)-stress and cross-stress pre-treatments. (A,B) Log phase and stationary phase WT and med15Δ cultures were compared in a 6-day fermentation time course. Fermentation weight loss (A) and fermentation rate in 12-h time periods (B). (C,D) The effect of cross-stress adaptation on fermentation rates was evaluated following a pre-treatment of log phase cells at 38°C. Fermentation weight loss (C) and fermentation rate in 12-h time periods (D). (E,F) The effect of same-stress adaptation on fermentation rates was evaluated following pre-treatment of log phase cells with 1:3 WGJ:YPD media for 1 h. Fermentation weight loss (E) and fermentation rate in 12 h time periods (F). Each data point is the average of 6 biological replicates and error bars reflect the standard deviation. The significance of differences between treated and untreated samples was determined using two-tailed t-tests. *, p ≤ 0.05; **, p ≤ 0.01; ***, p ≤ 0.001.
To further evaluate the role of MED15 in adjusting to the initial exposure to grape juice media, we tested the response of the two strains to a same-stress or cross-stress pre-treatment. In addition to basal stress resistance that corresponds to the general Environmental Stress Response, resistance to future stress may be acquired following pre-exposure to a milder stress of the same or different type. The pre-exposure triggers relevant stress-activated response genes ahead of time (Berry and Gasch, 2008). Log phase cells were either exposed to a pre-treatment for 1 h or maintained in the initial growth conditions (SC-Leu media at 30°C) for an additional hour. Pre-treatment at 38°C (1 h) had no impact on the fermentation rate of the mutant strain (Figures 5C,D), but slightly impaired the response of the WT strain. This adverse effect is therefore MED15-dependent and may entail up or down-regulation of MED15 target genes that compromise the response to fermentation conditions. In contrast to heat, pre-treatment with dilute grape juice to generate a mild osmotic stress increased fermentation in the med15Δ mutant at early timepoints (Figures 5E,F). Interestingly, the effect was minimal in the WT strain.
Alcoholic Beverage Yeast MED15 Alleles Can Improve Some Industrial Stress Responses
Given the extensive impact of the Med15 Mediator subunit on the transcriptome (Ansari et al., 2012), together with its role in fermentation, we hypothesized that the MED15 gene may have undergone specific sequence changes that contribute to the enhanced fermentation traits of wine yeast compared to LAB strains. To test this hypothesis, MED15 was isolated from a set of strains associated with different alcoholic beverages (wine yeast WY7 and WY15, sake yeast SY20, and palm wine yeast PY23) (Table 5) and cloned into an expression plasmid between flanking upstream and downstream regulatory sequences from the S288C (LAB) MED15 locus (Supplementary Figure 3). Since the diploid strains were homozygous at MED15, a single expression plasmid was constructed for each. Expression plasmids (Supplementary Table 1) were then introduced into a med15Δ derivative of the S288C LAB strain and tested for complementation of stress response phenotypes (Figure 6A). Each of the plasmids bearing MED15 alleles from wine, sake, and palm wine yeast fully complement med15Δ phenotypes.
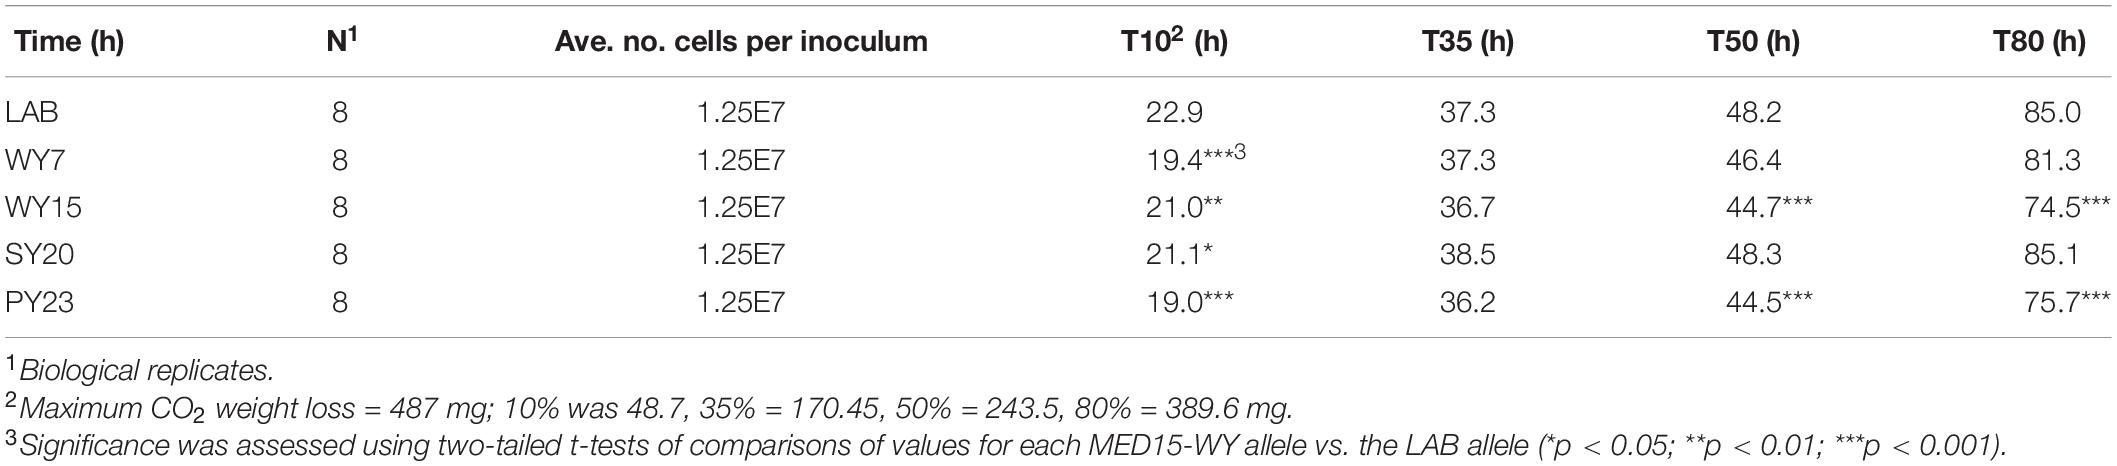
Table 5. Impact of MED15 Alleles from Industrial Yeast on Times to Equivalent Weight Loss.
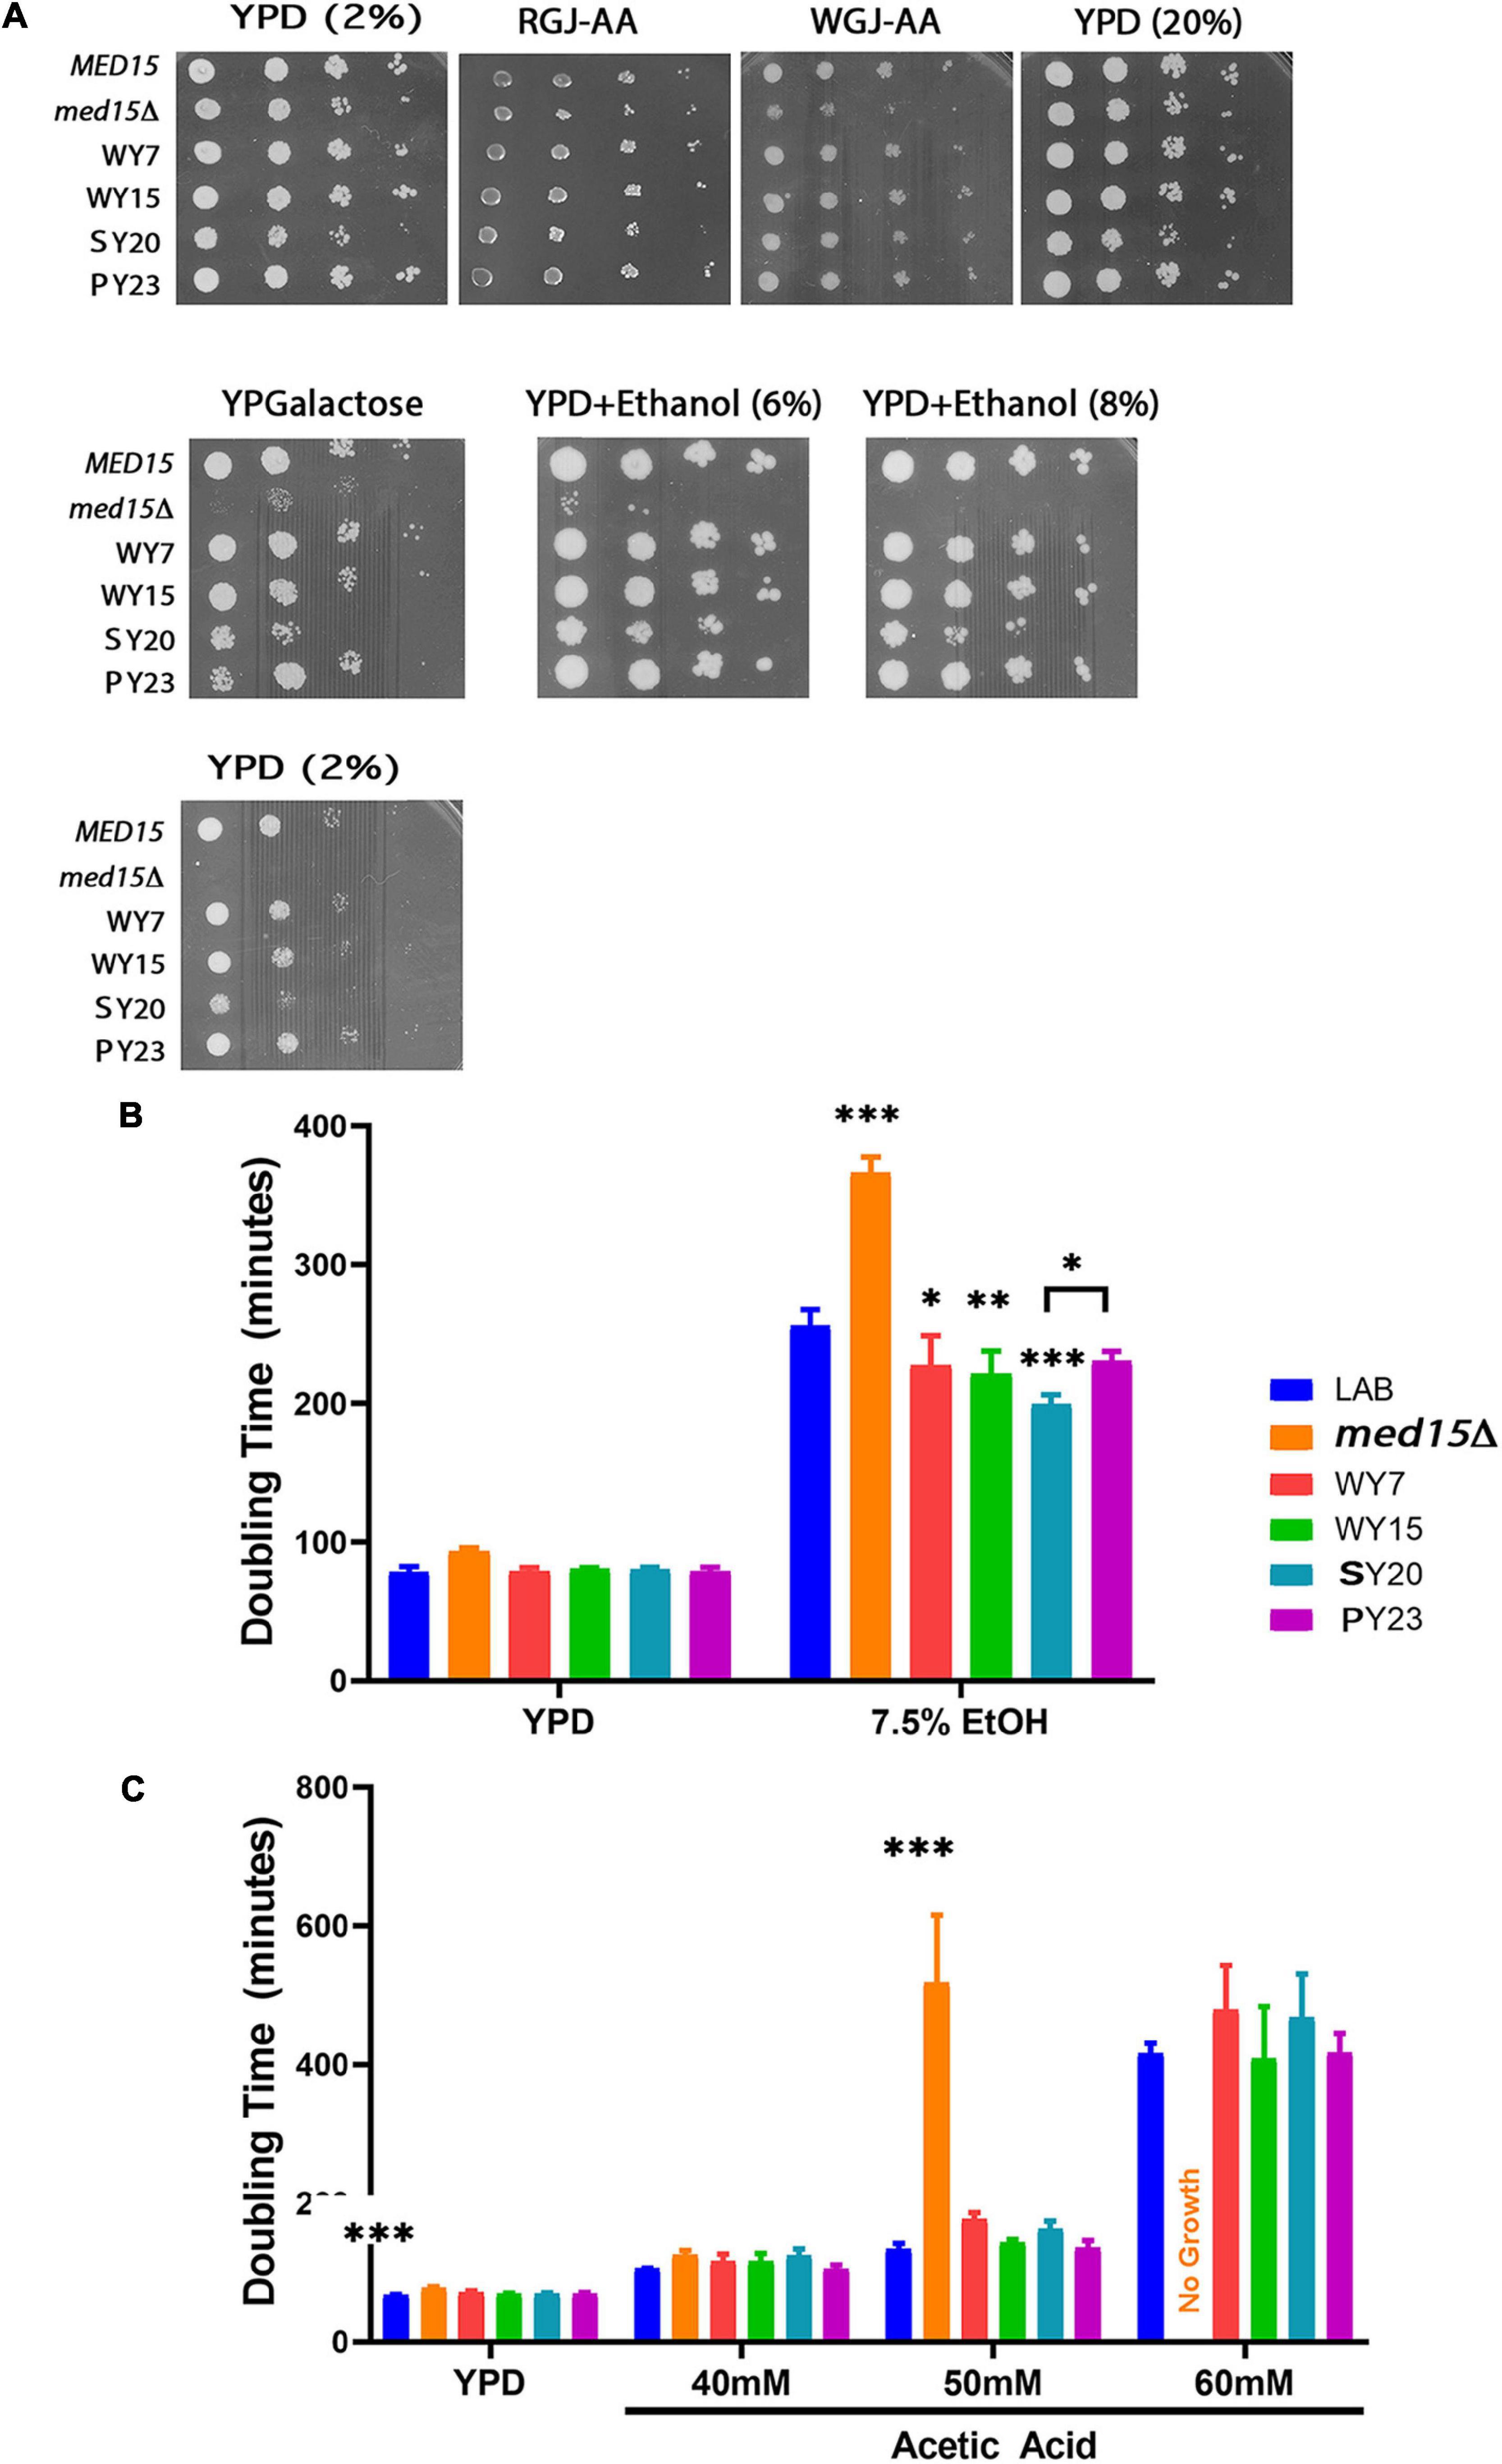
Figure 6. Alcoholic beverage MED15 alleles complement all med15 phenotypes and improve growth in acetic acid and ethanol. (A) Log-phase cultures of the med15Δ strain (OY320) carrying a CEN plasmid with the indicated MED15 allele were serially diluted and spotted on YPD media with 2% or 20% glucose YPD media with 2% or 20% glucose (YPD (2%)) or (YPD (20%)), YPD (2%) with added ethanol (YPD+Ethanol (6%)) (YPD+Ethanol (8%)), YP media with 2% galactose instead of glucose (YPGalactose), supplemented red grape juice (RGJ-AA), and supplemented white grape juice (WGJ-AA) media. Incubation temperatures were as indicated. (B,C) Doubling times derived from growth curves of the med15Δ strain carrying different MED15 alleles in YPD with or without indicated amounts of ethanol (B) or acetic acid (C). For analyses in (B,C), data points are the averages of 3 biological replicates (transformants) and error bars are the standard deviation of the mean. Significance was determined using ANOVA analysis with a Tukey post-hoc test. ∗, p ≤ 0.05; ∗∗, p ≤ 0.01; ∗∗∗, p ≤ 0.001.
To achieve more resolution and to examine the possibility that alcoholic beverage yeast MED15 alleles confer an enhanced ability to cope with late fermentation stresses, the growth rate of the med15 deleted LAB strain bearing MED15-LAB, MED15-WY, MED15-SY, or MED15-PY expression plasmids was evaluated in the presence of various concentrations of toxic byproducts of fermentation. Ethanol (Figure 6B) and acetic acid (Figure 6C) concentrations having a modest, rather than a devastating effect on growth of a strain with MED15-LAB and the expected deleterious impact on growth of a deletion strain were tested. Under these conditions, we found that strains carrying the SY20 allele were more robust than MED15-LAB in 7.5% ethanol, exhibiting a significant decrease in doubling time. No significant improvements in acetic acid tolerance were detected in comparisons of the industrial and LAB alleles at different concentrations of acetic acid (Figure 6C), however, the WY7 and SY20 alleles conferred more sensitivity than the LAB allele.
Wine Yeast MED15 Alleles Modulate the Fermentation Process
As seen in Figure 1, the MED15 gene is required for efficient progression through the fermentation process. Before specifically investigating the role of MED15 in WY fermentation, we first compared the fermentation profile of the diploid yeast strains to the haploid LAB strain with the native LAB MED15 allele. Three of the diploid strains outpaced the LAB strain at all time points and one diploid strain (SY20) outpaced the LAB strain primarily in the first 48 h. Interestingly, the final weight loss in the diploid strains was equivalent to that of the haploid LAB strain (Supplementary Figure 4) suggesting that while the industrial strains are better fermenters than the LAB strain, it is a matter of rate, and not the extent to which the sugar in the grape juice can be metabolized.
We next investigated to what extent the MED15-WY, SY and PY alleles contributed to the improved fermentation profile. Since the MED15 gene is potentially only one of a large number of genes with adaptive changes in the industrial yeast, we did not anticipate large changes. However, the impact was significant for three out of four of the MED15 alleles. Only one allele (SY20) failed to improve on the MED15-LAB fermentation profile (Figure 7). The specific impact of the MED15 allele varied. The WY7 allele increased weight loss relative to LAB during the first 24 h of fermentation (day 1) while the WY15 and PY23 alleles increased weight loss mid-fermentation (days 2–5) (Figure 7). Comparisons using weight loss benchmarks confirm these observations (Table 5).
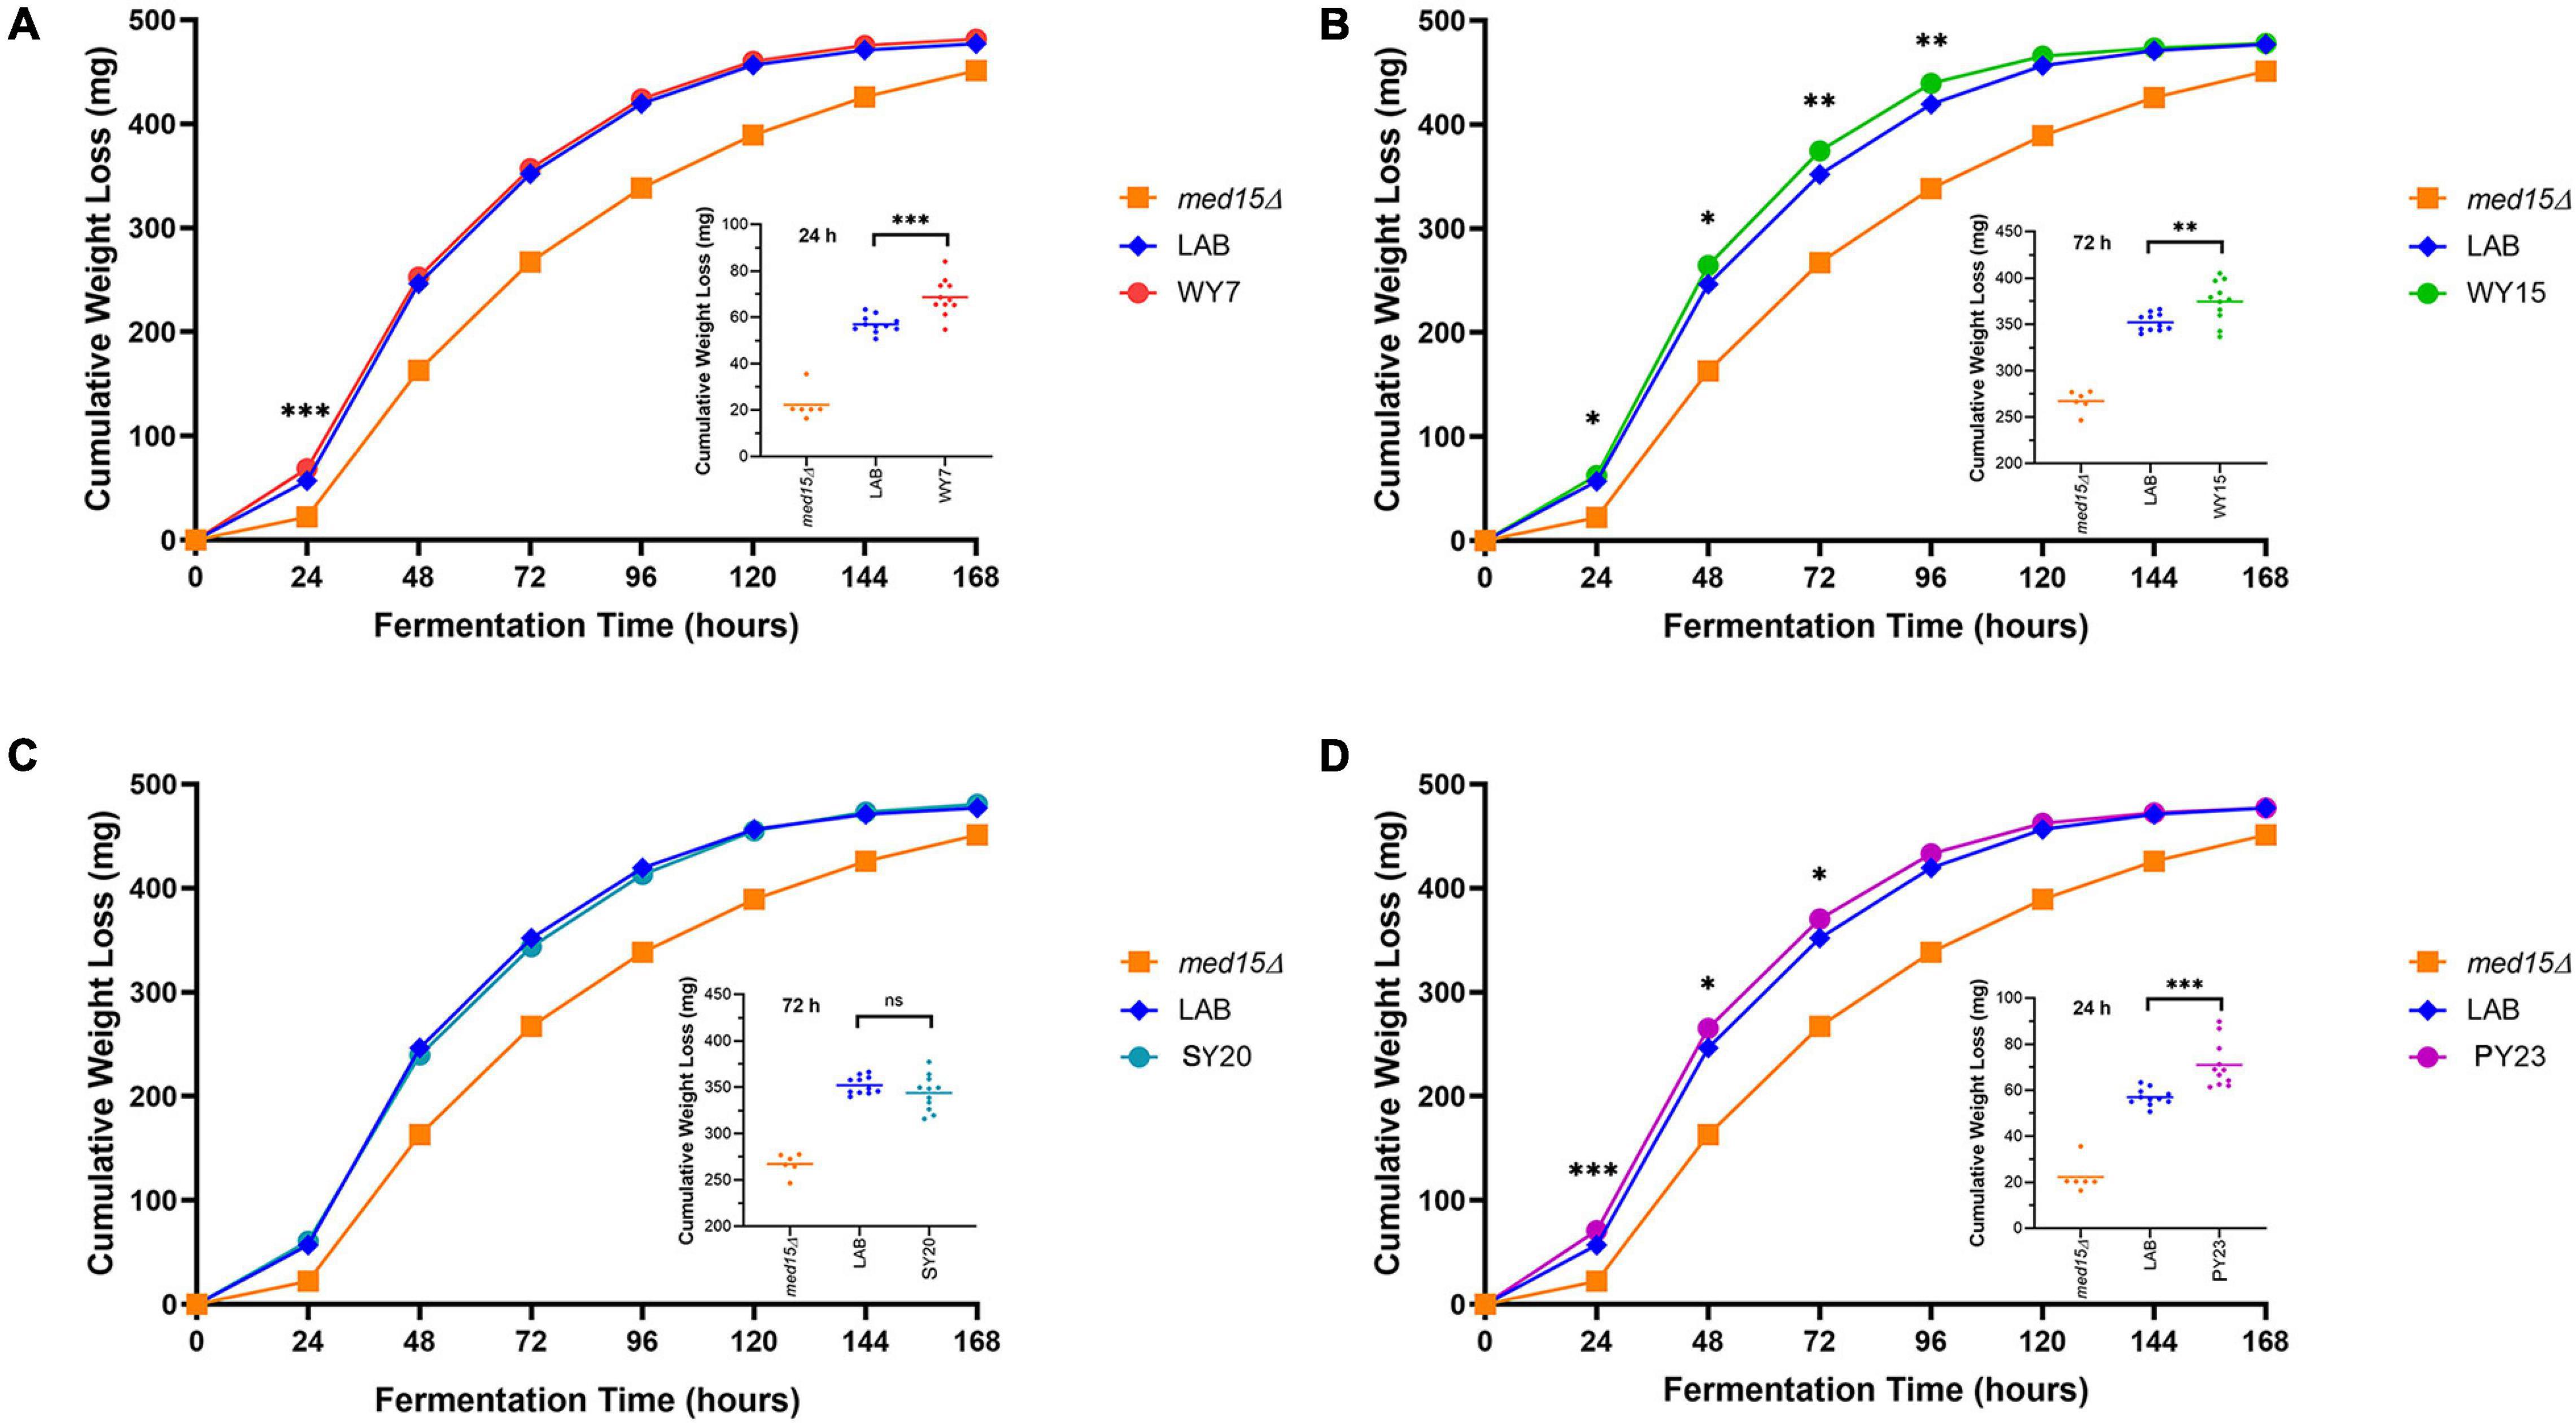
Figure 7. Fermentation of white grape juice is boosted by MED15 alleles from alcoholic beverage yeast. (A–D) Relative cumulative weight loss in WGJ fermentation experiments for the med15Δ strain (OY320) carrying plasmids expressing the LAB (S288C) or MED15-WY/SY/PY alleles. Fermentations were conducted at 25°C with constant agitation as shown in Figure 1C. For all panels, data points are the averages of 10 biological replicates (transformants) and error bars are the standard deviation of the mean. Significance was determined using two-tailed t-tests. ∗, p ≤ 0.05; ∗∗, p ≤ 0.01; ∗∗∗, p ≤ 0.001. Insets depict the distribution of data points for the most significant time point.
Laboratory and Alcoholic Beverage MED15 Alleles Differ in Polyglutamine Tract Lengths and Non-synonymous SNPs
One feature of the Med15 amino acid sequence is the overrepresentation of the amino acid glutamine (Q). The bias is especially striking at three positions in the protein where uninterrupted glutamine and glutamine-alanine tracts are found (Cooper and Fassler, 2019). The length of the Q tracts within MED15 alleles is known to vary amongst different S. cerevisiae strains (Cooper and Fassler, 2019) with potential enrichment in certain tract lengths among the European wine yeast (Cooper and Fassler, 2019). The MED15 alleles from the four industrial strains initially examined in this study were re-sequenced using Sanger technology to ensure high accuracy through repetitive sequences (Table 6). WY7 has tract lengths typical of European WY strains with the N terminal most tract (Q1) having a length of 21 glutamines, the central tract (Q2, alternating QA tracts with an interruption of 1 or 2 QAA motifs) having a length of 29, and the C terminal most tract (Q3) having a length of 25. WY15 shares Q2 and Q3 tract lengths with other European wine strains, but has a longer Q1 tract of 28. SY20 and PY23 in our study are strains used in the production of sake and palm wine, respectively, and are not members of the European wine yeast clade. They each have a Q1 tract length of 21 like WY7 but a Q2 of 28 and Q3 of 27 in the sake yeast (SY20), and a Q2 of 12 and a Q3 of 27 in the palm wine yeast (PY23) (Table 6).
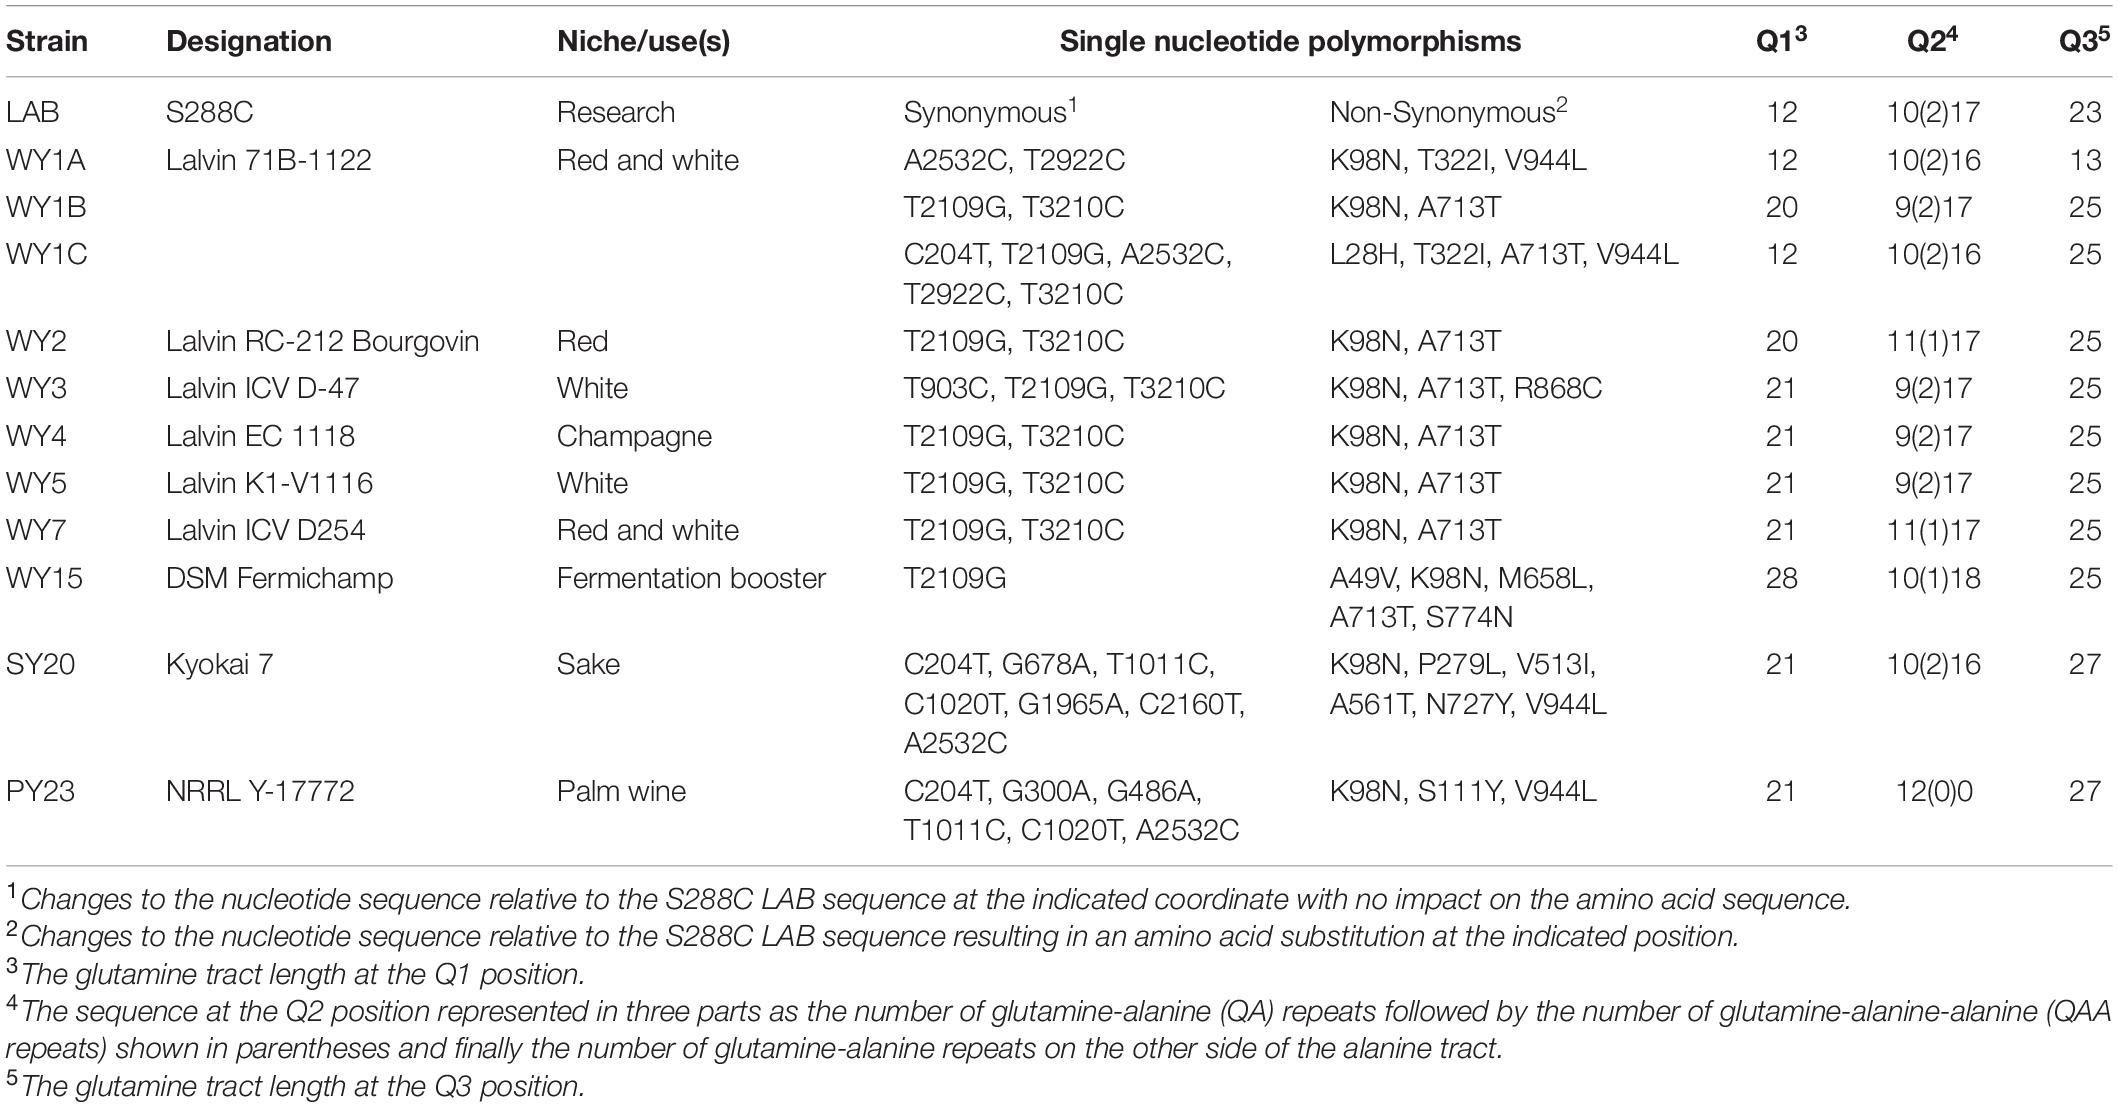
Table 6. Yeast MED15 Polymorphisms.
To increase our sampling of the European wine yeast clade, we determined the DNA sequence of MED15 from five additional European wine yeast strains (Table 6). WY1 was found to be triploid for MED15 while WY2, WY3, WY4, and WY5 are homozygous diploids. WY2-5 have a Q1 of 20–21, while WY1 has two Q1 alleles of 12 like the S288C strain, and another of 20. All five additional WY have at least one allele with a Q3 of 25. These patterns are consistent with our earlier observation (Cooper and Fassler, 2019) that European WY MED15 alleles are enriched in a Q3 track length of 25. In addition to the variation in glutamine tract genotypes, the WY MED15 alleles have 2–6 non-synonymous SNPs (nsSNPs) affecting non-glutamine parts of the protein as well as 1–7 synonymous SNPS (Table 6 and Supplementary Figure 5).
In earlier computational work (Cooper and Fassler, 2019) we found that the preponderance of European wine yeast have a Q3 tract length of 25. Both WY7 and WY15 have Q3 tracts of 25 and both boost fermentation relative to the LAB allele although with different patterns (Figure 7 and Table 5). To further test the relevance of Q3 tract length, we examined the impact of 5 additional European wine yeast alleles with a natural Q3 tract length of 25 on fermentation performance of the LAB med15Δ strain. Except for the allele from WY2, these strains exhibited no improvement over the LAB MED15 allele in fermentation experiments, suggesting that Q3 tract length is unlikely to be the sole determinant of fermentation activity (Supplementary Figure 6).
Fermentation Characteristics of Clean MED15 Alleles Differing From Laboratory Alleles in Q Tract Lengths
To examine the relevance of the Q tract differences versus nsSNPs in LAB and industrial MED15 alleles, synthetic “clean” (c) MED15 genes were constructed (Figures 8A–C) lacking most or all non-synonymous changes. Strains with the clean alleles were characterized in fermentation assays side by side with examples of the original allele as well as the LAB allele as seen in Figures 8D–G and as summarized in cartoon form in Table 7.
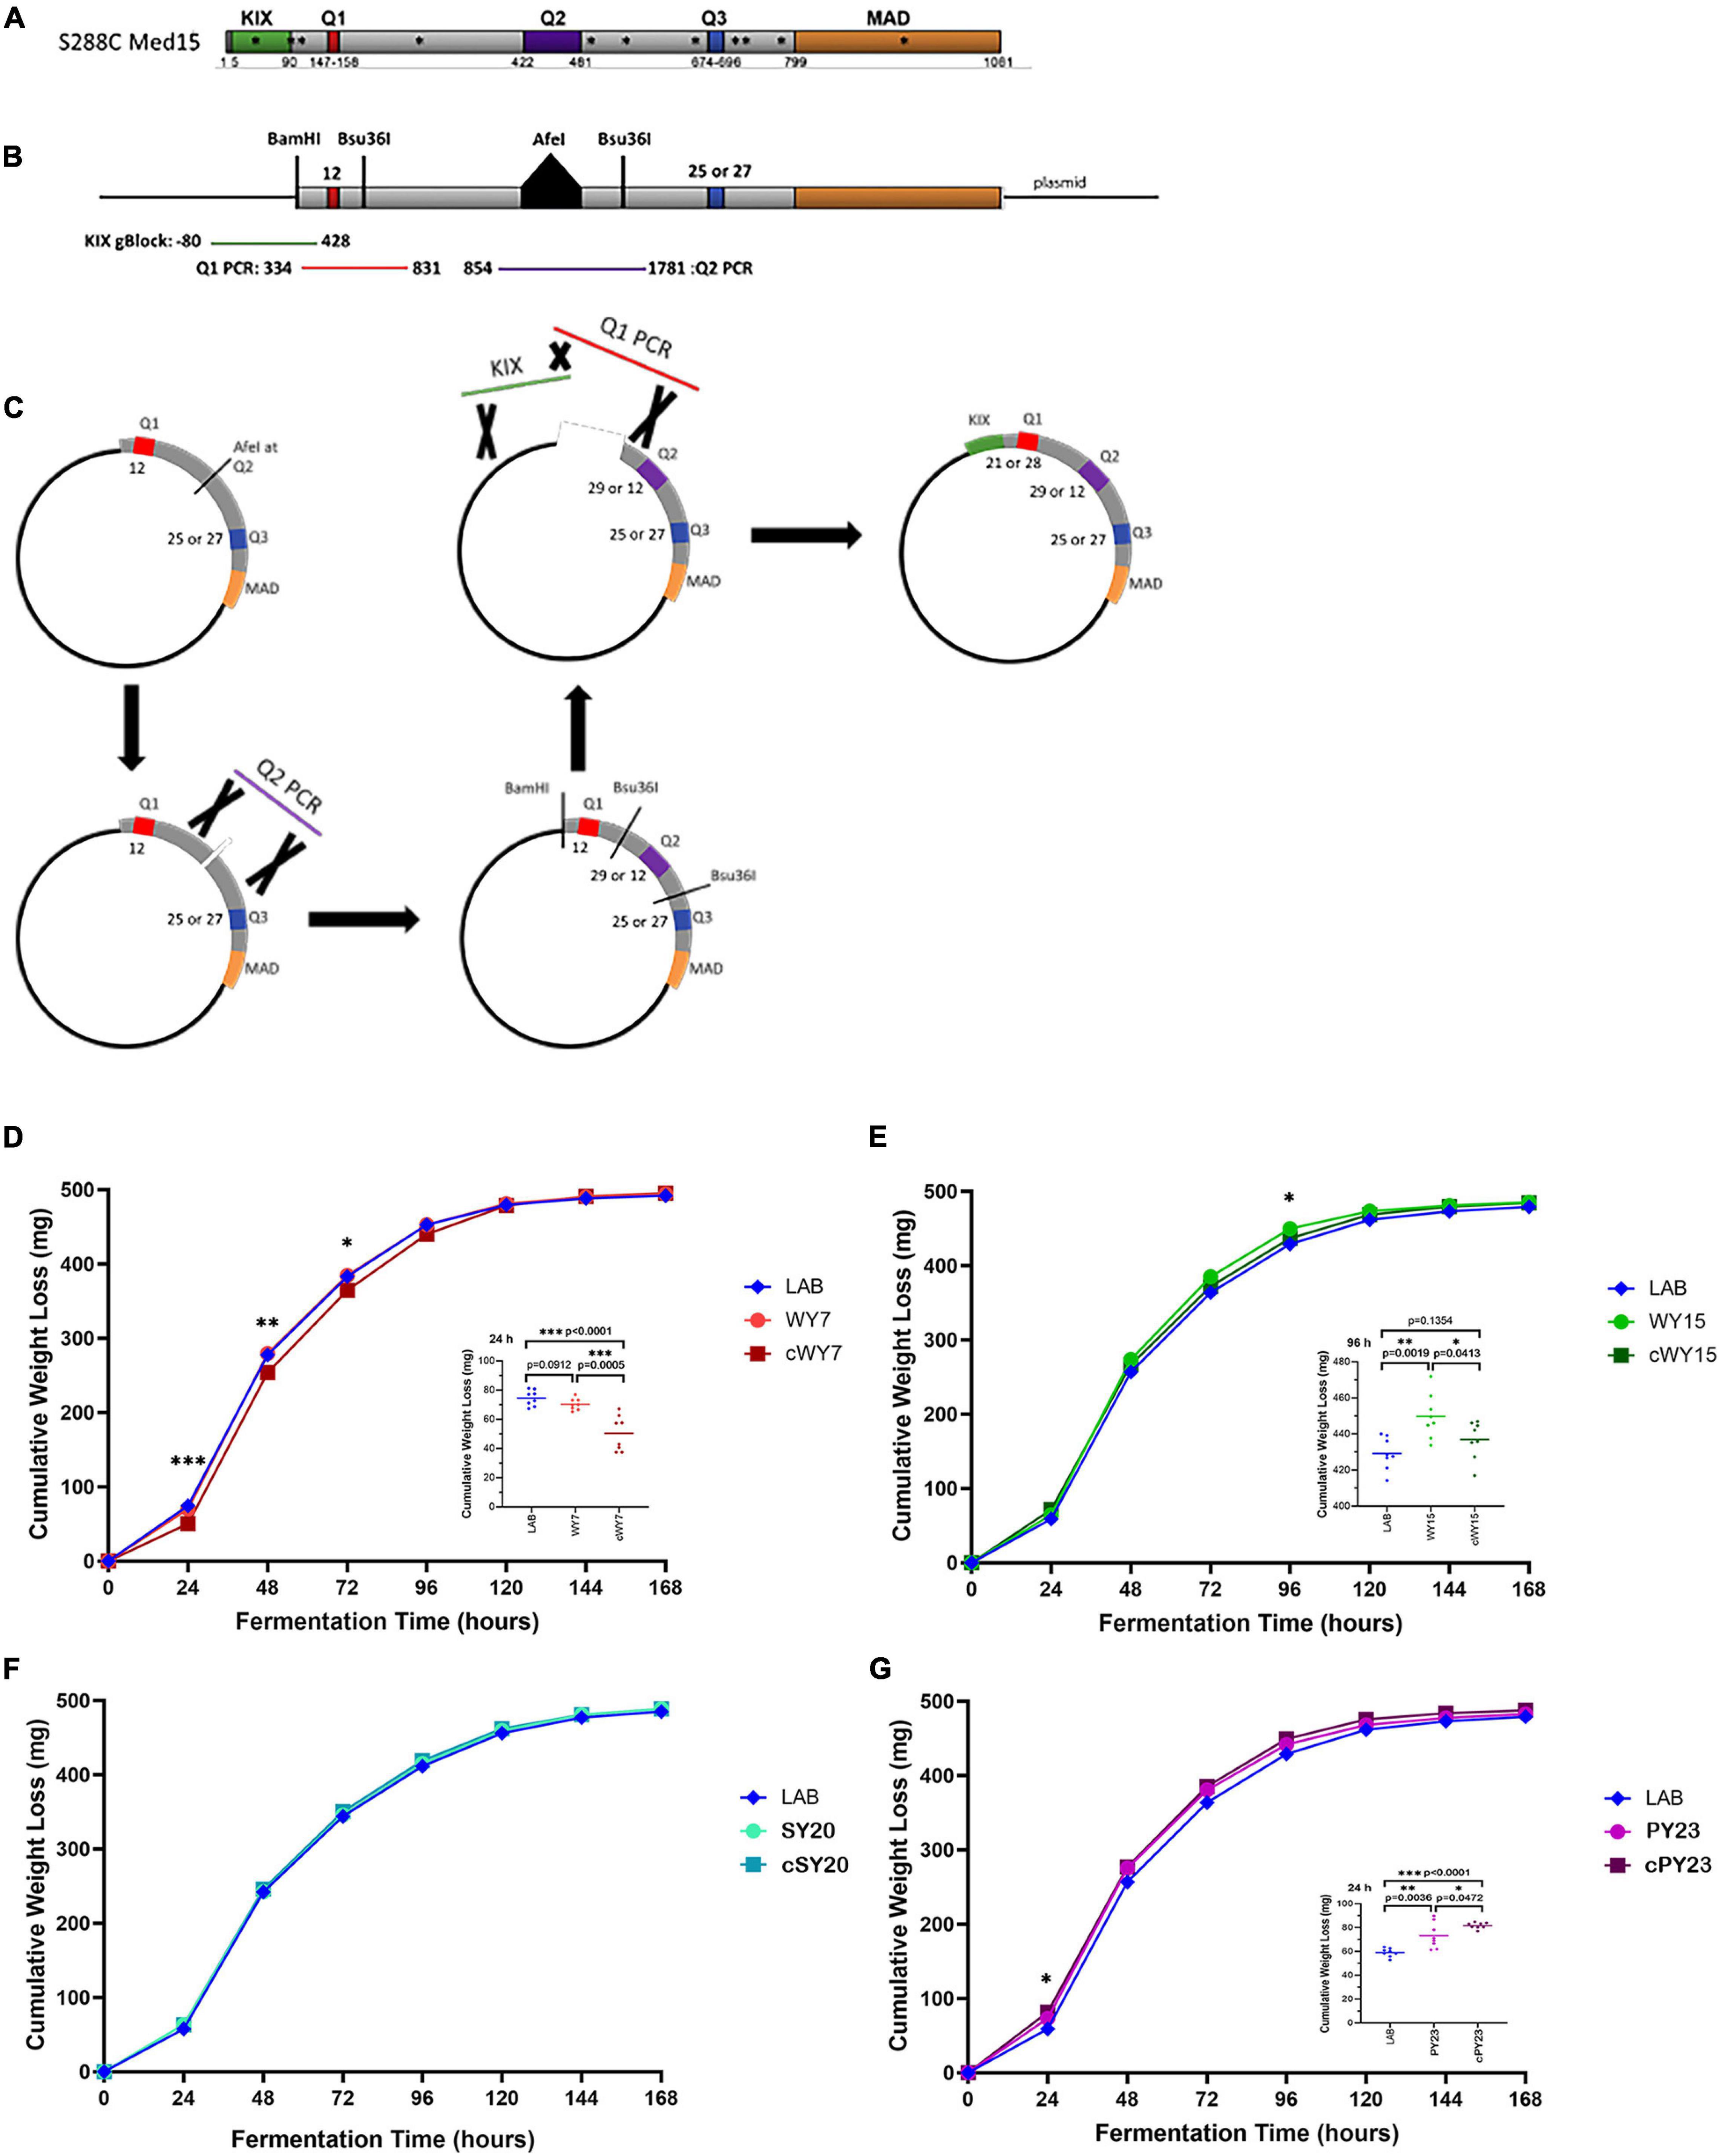
Figure 8. Both glutamine tracts and non-glutamine SNPs are involved in the fermentation booster phenotypes seen in strains carrying WY MED15. (A) The S288C (LAB) Med15 protein is shown in cartoon form with the positions of the three glutamine tracts between the N terminal KIX domain and the C terminal MAD domain indicated. Also shown with asterisks are the positions of non-synonymous SNPs in the wine yeast MED15 alleles evaluated in this study. (B) A second cartoon of a synthetically reconstructed S288C Med15 protein that lacks the KIX domain and has an AfeI site at the normal position of the Q2 tract and have either 25 or 27 glutamines at Q3. PCR fragments are shown to indicate the region amplified from the MED15-WY alleles that were designed to encompass the Q tract without nearby SNPs. (C) The process by which “clean” WY alleles were constructed from the parts illustrated in panel (B). (D–G) The fermentation profiles of the LAB allele, the original alcoholic beverage alleles (e.g., WY) and the “clean” (e.g., cWY) alleles are plotted. Data points are the averages of 8 biological replicates (transformants) and error bars are the standard deviation of the mean. Significance was assessed using a two-tailed t-test. Insets depict the distribution of data points for the most significant time point.
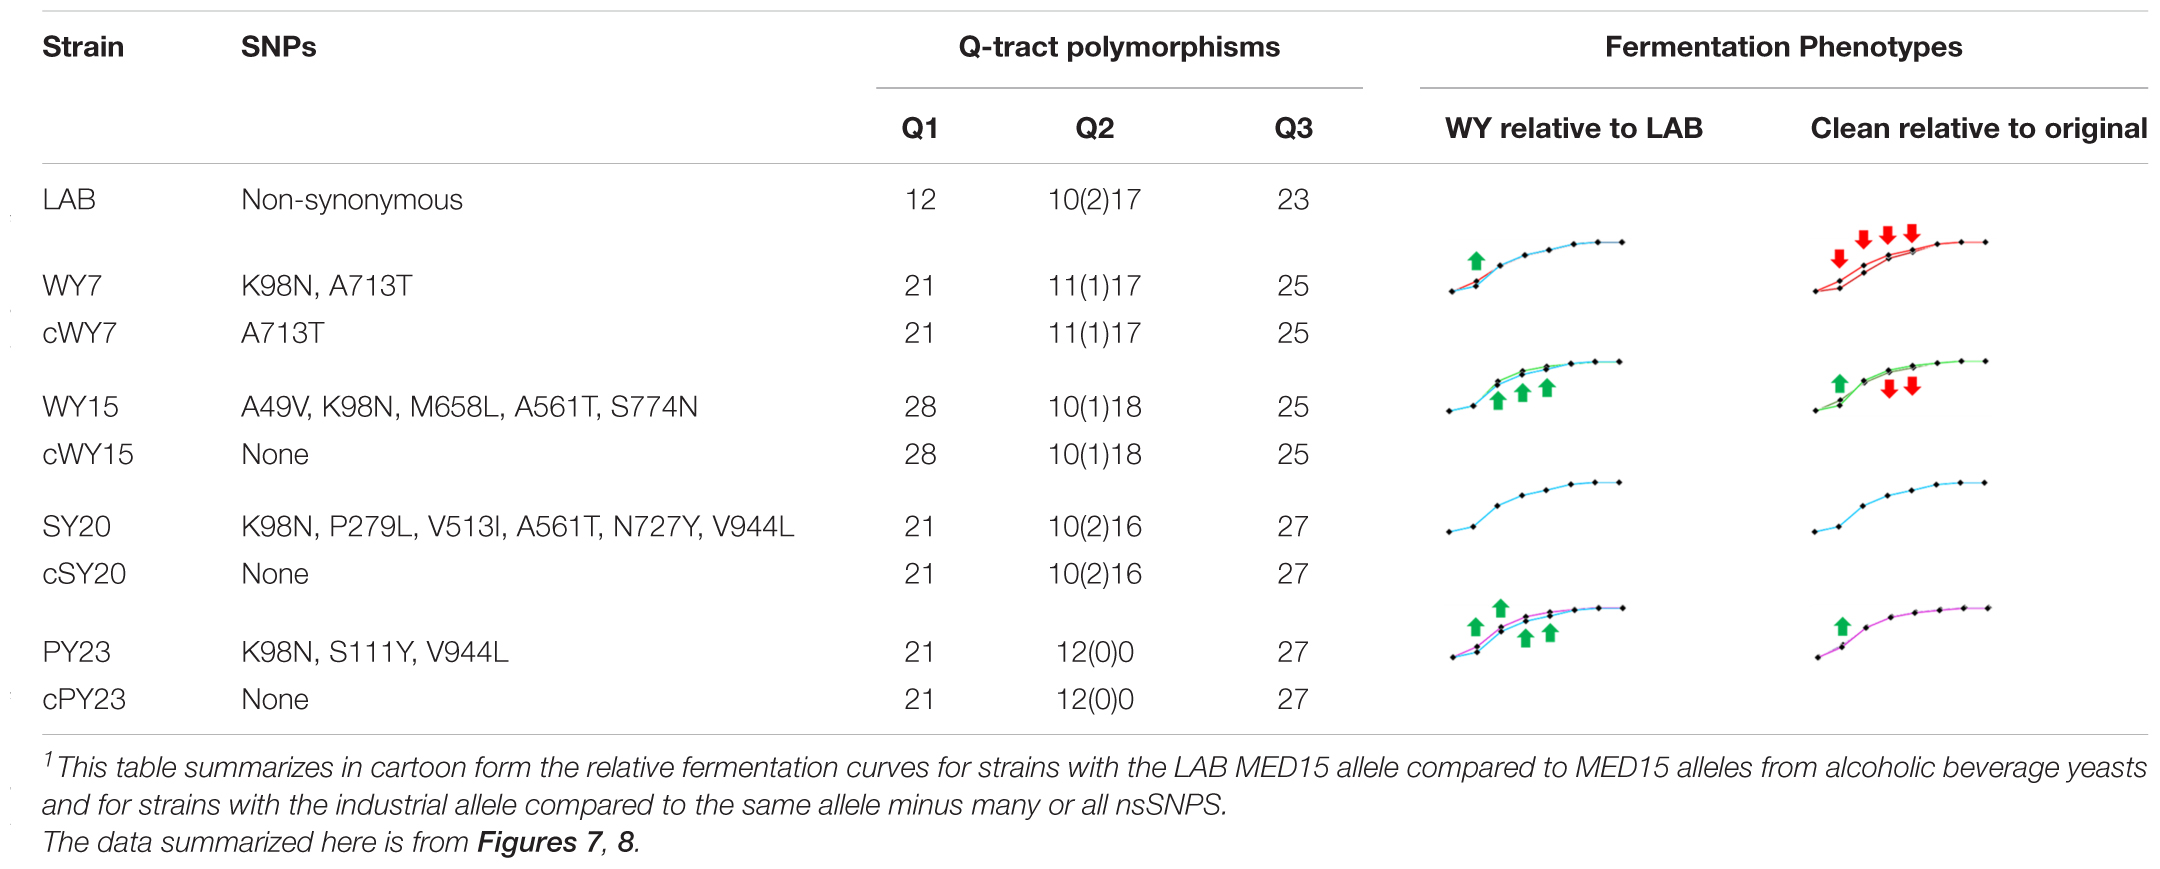
Table 7. Cartoon Summary of MED15 alleles from Alcoholic Beverage Yeasts with and without Non-synonymous SNPs1.
Strains with the cWY7 [Q1 = 21, Q2 = 11(1)17, Q3 = 27] allele from which only one (K98N) of two non-synonymous SNPs was removed performed more poorly than the original allele (Figure 8D and Table 7) over several time points. The possibility that K98N might be a key SNP for fermentation performance is consistent with the pattern in the cWY15 allele which lacks all 5 SNPs including K98N and in which mid-profile performance is also diminished. However, the importance of the K98N allele is contradicted by the cPY23 allele, which lacks 3 of 3 SNPs including K98N and in which we see no reduction in fermentation performance. Furthermore, the fermentation performance of both the cWY15 and the cPY23 alleles is improved early in fermentation (48 h) in the absence of nsSNPs suggesting that certain mutations may prevent the full impact of the Q tracts early in the fermentation time course. The remainder of the cPY23 fermentation time course is not affected by the absence of nsSNPS, clearly indicating that the Q tracts are important to the PY23 fermentation booster phenotype.
Discussion
As one of the subunits of RNA Polymerase II Mediator tail module, MED15 is well known for its role in regulating expression of stress response and metabolic genes. However, no previous research has directly investigated the role of MED15 in the fermentation process. Here we show that the MED15 subunit of the Mediator complex is important for the efficient fermentation of grape juice. Despite the mutant’s impaired tolerance to acute exposure to various chemicals (notably ethanol and acetic acid), the med15Δ strain is not sensitized to late-stage fermentation stresses presumably because they have accumulated slowly. Instead, the fermentation phenotype likely reflects reduced gene expression of key metabolic genes including those involved in ethanol production and metabolism. In addition, we have shown that some MED15 alleles differing in poly-Q tract lengths and SNPs confer more efficient grape juice fermentation, which is consistent with the hypothesis that MED15 alleles from wine yeast may be optimized for fermentation. Future experiments conducted in industrial strains and directly assessing fitness will be needed to confirm the importance of MED15 in commercial wine making environments and the adaptive potential of alleles found in alcoholic beverage yeasts. Nonetheless, the improvements afforded by the WY and PY MED15 alleles that we have documented in this study are novel and surprising and provide important groundwork for pursuing more targeted experiments with industrial implications.
med15Δ Does Not Sensitize Yeast Strains to the Gradual (Cumulative) Stresses of Late Fermentation
Although we and others have shown that med15Δ strains are highly sensitive to acute ethanol and acetic acid stress (Figure 1; Kawahata et al., 2006; Qian et al., 2012), there appears to be no excess sensitivity to these compounds in the late fermentation environment, presumably because the adaptation of yeast to the gradual accumulation of acetic acid and ethanol during fermentation involves different pathways.
Yeast cells are known to lose metabolic activity and cell membrane integrity in the presence of acetic acid (Rego et al., 2014). Unexpectedly, we found that the loss of cell viability and increased permeability in MED15+ strains during late-stage fermentation appears to be curtailed in the med15Δ deletion strain. The altered transcriptome in the med15 mutant may influence the sensitivity of the mutant cells to acetic acid or it may influence the accumulation of acetic acid. It is possible that the reduced expression of MED15 target genes that account for deficiencies in respiratory growth in the mutant may reduce acetic acid levels and hence ROS and cell death.
Since both acetic acid and ethanol are known inducers of apoptosis (Ludovico et al., 2001; Kitagaki et al., 2007), MED15 might have a pro-apoptotic effect by virtue of regulating the expression of the appropriate genes. The intersection of genes regulated by MED15 (Hu et al., 2007) and those having apoptosis annotation includes a short list of candidates (Supplementary Figure 7). Mutations in eight genes that are positively regulated by Med15 are annotated as reducing apoptosis phenotypes. These may be important in the pro-survival phenotype in the med15Δ mutant.
Survival of the med15 Mutant in Late-Stage Fermentation
The med15Δ mutant fails to grow on non-fermentable carbon sources and is thus compromised in oxidative metabolism (Merz and Westermann, 2009; Bode et al., 2013). Hence, the CO2 weight loss and ethanol production profiles of the MED15+ and med15Δ mutant strains are somewhat affected by different constraints. In the MED15+ strain, weight loss is the sum of the anaerobic fermentation process plus any residual ongoing respiration, both leading to the production of CO2, followed by additional CO2 production after the diauxic shift (upon accumulation of ethanol) whereupon cells begin to catabolize ethanol and the other carbon compounds via the TCA cycle and oxidative phosphorylation in the mitochondria. The diauxic shift is accompanied by elevated reactive oxygen species (ROS) levels and an accompanying oxidative stress response (Bisson and Walker, 2015). In contrast, the med15 mutant presumably produces CO2 primarily by fermentation, and less so by respiration, since it is not fully metabolizing available ethanol. Using H2-DCFDA, a widely used fluorescent dye for measuring intracellular ROS levels, we found that the mutant produces less ROS during late fermentation and this may account for the reduced mortality. The apparent discrepancy between the observation that WT and med15Δ strains consume ethanol equivalently late in fermentation (Figure 4) and the observation that levels of ROS are lower in the med15Δ mutant at that time (Figure 3) are potentially explained by normal conversion of ethanol to acetaldehyde in the mutant, followed by reduced activity in the later steps leading to acetyl CoA and subsequent respiration-mediated CO2 production. The oxidation of acetaldehyde to acetate is catalyzed by both cytosolic and mitochondrial aldehyde dehydrogenase, of which the main isoforms (Ald6 and Ald4, respectively) are important for growth on ethanol. Our preliminary q-RT-PCR and RNA-Seq experiments show that the ALD4, ALD5, and ALD6 genes are positively regulated by MED15 and may be rate limiting in the mutant.
Fermentation Stress Response
We examined the sensitivity of the med15Δ mutant to cross-stress pre-treatments to determine whether the slower fermentation response in the mutant might relate to deficiencies in the ability of the mutant strain to rapidly mount a stress response. Pre-exposure to heat stress had no impact on the fermentation rate of the mutant strain (Figures 5C,D), but impaired the response of the WT strain. This adverse effect is therefore MED15-dependent and may entail up or down-regulation of MED15 target genes that compromise the response to fermentation conditions. When strains were pre-exposed to dilute grape juice generating a mild osmotic stress, fermentation was increased in the med15Δ mutant at early timepoints (Figures 5E,F) but was minimal in the WT strain suggesting that MED15 may be repressing genes that can, but do not normally contribute to adaptation. The results of the pre-treatment experiments suggest that the fermentation defect in the mutant is unlikely to be due to its known deficiencies in stress response and is more likely the consequence of changes in the expression of metabolic genes involved in the production or consumption of ethanol.
In addition to the general and stimulus-specific response mechanisms which are mounted transiently in cells experiencing stress (Gasch et al., 2000; Causton et al., 2001), sustained changes in transcript abundance over fermentation time courses of up to 15 days are also observed (Marks et al., 2008), indicative of an adaptive response to fermentation stress. Of the 223 fermentation stress response (FSR) genes, exhibiting sustained and dramatic induction throughout the entire time course, ∼25% overlap with MED15 targets identified under laboratory conditions (Hu et al., 2007; Supplementary Figure 7) including 43 that are positively and 8 that are negatively regulated. Consistent with this, our preliminary RNA-Seq data suggests that in addition to Med15 regulation of glycolytic and alcoholic fermentation genes during growth in laboratory culture conditions (YPD), there is a set of metabolic genes that are modulated by Med15 specifically during grape juice fermentation. The presence of hexose transporter genes in the fermentation-specific differentially regulated gene set together with our observations of differential sugar utilization in the med15Δ mutant (Supplementary Figure 1D) suggests that the defects in fermentation efficiency in the mutant may be due in part to a reduced rate of sugar uptake. Many Med15 regulated fermentation specific genes also influence the efficiency of amino acid anabolism. In the nitrogen-limiting grape juice environment, the ability to modulate the production of amino acids may allow for more efficient fermentation.
Fermentation and Glutamine Bias in Med15
We find that MED15 alleles originating in strains used in production of alcoholic beverages are somewhat more efficient in sugar utilization and ethanol production. With the polyglutamine tracts within Med15 being the primary difference among alleles, we hypothesized that specific tract lengths and/or tract length combinations could be important determinants of a fermentation boosting/permissive transcriptome. We analyzed seven alleles (WY1-5, WY7, and WY15) belonging to the European wine clade, as well as one sake yeast (SY20) and one palm wine yeast (PY23) which are phylogenetically distinct (Strope et al., 2015).
Based on the analysis of the MED15 sequence reported for 150 strains (Cooper and Fassler, 2019) and on the resequencing of the MED15 allele from the nine strains described (Supplementary File 1), we hypothesized that a Q3 tract of 25 glutamines (compared to a Q3 tract of 23 glutamines in the LAB allele) is an important sequence feature in wine yeast strains that might contribute to the increased fermentation rate we observed when certain of the WY MED15 alleles are examined in the LAB strain. Of the 7 European alleles, only WY15, WY7, and WY2 have any impact on fermentation, while WY1 and 3–5 alleles behave similarly to the LAB allele during WGJ fermentation. At face value, these observations suggest that a Q3 tract of 25 glutamine residues, is insufficient on its own to change the course of a fermentation reaction and that the WY2, WY15, and WY7 fermentation phenotype may instead be a function of Q3 length in combination with other Q tract lengths or with non-synonymous SNPs in the sequence.
Synthetic MED15 genes were used to evaluate the role of Q tract length combinations in the absence of all other amino acid substitutions that could be expected to influence the fermentation phenotype (Figures 8D–G, Table 7, and Supplementary Figure 5). Strikingly, the removal of SNPs from the PY23 MED15 allele had little effect on the fermentation profile, confirming the importance of the Q tracts. The PY23 MED15 sequence is distinctive in two ways. It has a Q3 tract length of 27, 2 residues longer than any of the European wine yeast. In addition, it has an unusual Q2 tract. At 12 QA repeats, it is only half the length of the LAB or any other variant allele. Whether this short Q tract is primarily responsible for the changes in fermentation profile, or whether it works in collaboration with the Q1 of 21 and/or the Q3 of 27 will require additional investigation. These observations suggest that individual tract lengths or combinations of specific tract lengths may correspond to specific industrial phenotypes.
What Is the Molecular Basis of Glutamine Tract-Dependent Function in Med15?
The molecular mechanism for the glutamine tract length dependence of fermentation could be a direct effect due to glutamine dependent interactions between Med15 and any of its transcription factor or chromatin associated interactors. Alternatively, the effect could be indirect. We speculate that the Q tracts may not themselves mediate these protein-protein interactions, but instead interact with one another to generate specific Med15 conformations that contribute to a more or less active Mediator complex. Further tests of this hypothesis and additional characterization of the Med15 protein will be necessary to understand the details of this mechanism.
Data Availability Statement
The raw data supporting the conclusions of this article will be made available by the authors, without undue reservation.
Author Contributions
DC and YJ conducted experiments, analyzed data, and participated in editing drafts of the manuscript. SS and LW conducted experiments. JF designed the experiments and participated in supervision and writing. All authors approved the final version of the manuscript.
Funding
This project was supported by a University of Iowa Dissertation Writing Fellowship to DC.
Conflict of Interest
The authors declare that the research was conducted in the absence of any commercial or financial relationships that could be construed as a potential conflict of interest.
Publisher’s Note
All claims expressed in this article are solely those of the authors and do not necessarily represent those of their affiliated organizations, or those of the publisher, the editors and the reviewers. Any product that may be evaluated in this article, or claim that may be made by its manufacturer, is not guaranteed or endorsed by the publisher.
Acknowledgments
We thank Daniel Weeks, Bin He, and Tyler Atagozli for pre-submission comments on the manuscript. We are also grateful to Y. C. Lee for generous gifts of plasmids, as well as R. C. Gardner (University of Auckland, New Zealand) and the USDA Agricultural Research Service Culture Collection for yeast strains. We thank A. Erives, R. Malone, G. Gussin, and especially members of the lab for extensive discussions of this work. Former high school students Jared Marks, Kriti Babu, Binglun Shao, Manasa Pagadala, Michael Peng, summer REU student Carolina Pacheco, and University of Iowa undergraduate, Cole Kerns are enthusiastically acknowledged for preliminary work related to this topic.
Supplementary Material
The Supplementary Material for this article can be found online at: https://www.frontiersin.org/articles/10.3389/fmicb.2021.741572/full#supplementary-material
Footnotes
References
Ansari, S. A., Ganapathi, M., Benschop, J. J., Holstege, F. C., Wade, J. T., and Morse, R. H. (2012). Distinct role of mediator tail module in regulation of SAGA-dependent, TATA-containing genes in yeast. EMBO J. 31, 44–57. doi: 10.1038/emboj.2011.362
Ansari, S. A., and Morse, R. H. (2012). Selective role of mediator tail module in the transcription of highly regulated genes in yeast. Transcription 3, 110–114. doi: 10.4161/trns.19840
Auesukaree, C., Damnernsawad, A., Kruatrachue, M., Pokethitiyook, P., Boonchird, C., Kaneko, Y., et al. (2009). Genome-wide identification of genes involved in tolerance to various environmental stresses in Saccharomyces cerevisiae. J. Appl. Genet. 50, 301–310. doi: 10.1007/BF03195688
Barrales, R. R., Jimenez, J., and Ibeas, J. I. (2008). Identification of novel activation mechanisms for FLO11 regulation in Saccharomyces cerevisiae. Genetics 178, 145–156. doi: 10.1534/genetics.107.081315
Berry, D. B., and Gasch, A. P. (2008). Stress-activated genomic expression changes serve a preparative role for impending stress in yeast. Mol. Biol. Cell 19, 4580–4587. doi: 10.1091/mbc.e07-07-0680
Bisson, L. F. (1993). “Metabolism of sugars,” in Wine Microbiology and Biotechnology, Vol. 1, ed. G. Fleet (Taylor & Francis Group), 55–76.
Bisson, L. F., and Walker, G. A. (2015). The microbial dynamics of wine fermentation. Adv. Fermented Foods Beverages 19, 435–476. doi: 10.1016/B978-1-78242-015-6.00019-0
Bode, M., Longen, S., Morgan, B., Peleh, V., Dick, T. P., Bihlmaier, K., et al. (2013). Inaccurately assembled cytochrome c oxidase can lead to oxidative stress-induced growth arrest. Antioxid Redox Signal 18, 1597–1612. doi: 10.1089/ars.2012.4685
Brachmann, C. B., Davies, A., Cost, G. J., Caputo, E., Li, J., Hieter, P., et al. (1998). Designer deletion strains derived from Saccharomyces cerevisiae S288C: a useful set of strains and plasmids for PCR-mediated gene disruption and other applications. Yeast 14, 115–132. doi: 10.1002/(SICI)1097-0061(19980130)14:2<115::AID-YEA204>3.0.CO;2-2
Bradbury, J. E., Richards, K. D., Niederer, H. A., Lee, S. A., Rod Dunbar, P., and Gardner, R. C. (2006). A homozygous diploid subset of commercial wine yeast strains. Antonie Van Leeuwenhoek 89, 27–37. doi: 10.1007/s10482-005-9006-1
Bryan, A. C., Zhang, J., Guo, J., Ranjan, P., Singan, V., Barry, K., et al. (2018). A variable polyglutamine repeat affects subcellular localization and regulatory activity of a populus Angustifolia protein. G3 8, 2631–2641. doi: 10.1534/g3.118.200188
Causton, H. C., Ren, B., Koh, S. S., Harbison, C. T., Kanin, E., Jennings, E. G., et al. (2001). Remodeling of yeast genome expression in response to environmental changes. Mol. Biol. Cell 12, 323–337. doi: 10.1091/mbc.12.2.323
Cooper, D. G., and Fassler, J. S. (2019). Med15: glutamine-rich mediator subunit with potential for plasticity. Trends Biochem. Sci. 44, 737–751. doi: 10.1016/j.tibs.2019.03.008
Dahiya, P., Bhat, D. S., and Thakur, J. K. (2016). Expression of AtMed15 of Arabidopsis in yeast causes flocculation and increases ethanol production in yeast culture. Sci. Rep. 6:27967. doi: 10.1038/srep27967
Davis, J. A., Takagi, Y., Kornberg, R. D., and Asturias, F. A. (2002). Structure of the yeast RNA polymerase II holoenzyme: mediator conformation and polymerase interaction. Mol. Cell 10, 409–415. doi: 10.1016/S1097-2765(02)00598-1
Divol, B., du Toit, M., and Duckitt, E. (2012). Surviving in the presence of sulphur dioxide: strategies developed by wine yeasts. Appl. Microbiol. Biotechnol. 95, 601–613. doi: 10.1007/s00253-012-4186-x
Fassler, J. S., and Winston, F. (1989). The Saccharomyces cerevisiae SPT13/GAL11 gene has both positive and negative regulatory roles in transcription. Mol. Cell. Biol. 9, 5602–5609. doi: 10.1128/MCB.9.12.5602
Fidalgo, M., Barrales, R. R., and Jimenez, J. (2008). Coding repeat instability in the FLO11 gene of Saccharomyces yeasts. Yeast 25, 879–889. doi: 10.1002/yea.1642
Friedman, M. J., Shah, A. G., Fang, Z. H., Ward, E. G., Warren, S. T., Li, S., et al. (2007). Polyglutamine domain modulates the TBP-TFIIB interaction: implications for its normal function and neurodegeneration. Nat. Neurosci. 10, 1519–1528. doi: 10.1038/nn2011
Gallagher, J. E. G., Ser, S. L., Ayers, M. C., Nassif, C., and Pupo, A. (2020). The polymorphic PolyQ tail protein of the mediator complex, MED15, regulates the variable response to diverse stresses. Int. J. Mol. Sci. 21:894. doi: 10.3390/ijms21051894
Gallone, B., Steensels, J., Prahl, T., Soriaga, L., Saels, V., Herrera-Malaver, B., et al. (2016). Domestication and divergence of saccharomyces cerevisiae beer yeasts. Cell 166, 1397–1410.e1316. doi: 10.1016/j.cell.2016.08.020
Garbett, K. A., Tripathi, M. K., Cencki, B., Layer, J. H., and Weil, P. A. (2007). Yeast TFIID serves as a coactivator for Rap1p by direct protein-protein interaction. Mol. Cell Biol. 27, 297–311. doi: 10.1128/MCB.01558-06
Gasch, A. P., Spellman, P. T., Kao, C. M., Carmel-Harel, O., Eisen, M. B., Storz, G., et al. (2000). Genomic expression programs in the response of yeast cells to environmental changes. Mol. Biol. Cell 11, 4241–4257. doi: 10.1091/mbc.11.12.4241
Gemayel, R., Chavali, S., Pougach, K., Legendre, M., Zhu, B., Boeynaems, S., et al. (2015). Variable glutamine-rich repeats modulate transcription factor activity. Mol. Cell 59, 615–627. doi: 10.1016/j.molcel.2015.07.003
Gerber, H. P., Seipel, K., Georgiev, O., Hofferer, M., Hug, M., Rusconi, S., et al. (1994). Transcriptional activation modulated by homopolymeric glutamine and proline stretches. Science 263, 808–811. doi: 10.1126/science.8303297
Gietz, R. D., and Woods, R. A. (2002). Transformation of yeast by lithium acetate/single-stranded carrier DNA/polyethylene glycol method. Methods Enzymol. 350, 87–96. doi: 10.1016/S0076-6879(02)50957-5
Gou, L., Bloom, J. S., and Kruglyak, L. (2019). The genetic basis of mutation rate variation in yeast. Genetics 211, 731–740. doi: 10.1534/genetics.118.301609
Guglielmi, B., van Berkum, N. L., Klapholz, B., Bijma, T., Boube, M., Boschiero, C., et al. (2004). A high resolution protein interaction map of the yeast mediator complex. Nucleic Acids Res. 32, 5379–5391. doi: 10.1093/nar/gkh878
Gump, B. H., Zoecklein, B. W., and Fugelsang, K. C. (2001). “Prediction of prefermentation nutritional status of grape juicethe formol method,” in Methods in Biotechnology, Vol. 14, eds J. F. T. Spencer and A. L. Ragout de Spencer (Totowa, NJ: Human Press).
Hall, B. G., Acar, H., Nandipati, A., and Barlow, M. (2014). Growth rates made easy. Mol. Biol. Evol. 31, 232–238.
Hall, B. G., Acar, H., Nandipati, A., and Barlow, M. (2020). Growth rates made easy. Mol. Biol. Evol. 31, 232–238.
Henschke, P. A., and Jiranek, V. (1993). “Metabolism of nitrogen compounds,” in Wine Microbiology and Biotechnology, Vol. 1, ed. G. H. Fleet (Taylor & Francis), 77–164.
Hoey, T., Weinzieri, R. O. J., Gill, G., Chen, J.-L., Dynlacht, B. D., and Tjian, R. (1993). Molecular cloning and functional analysis of Drosophila TAF110 reveal properties expected of coactivators. Cell 72, 247–260. doi: 10.1016/0092-8674(93)90664-C
Hu, Z., Killion, P. J., and Iyer, V. R. (2007). Genetic reconstruction of a functional transcriptional regulatory network. Nat. Genet. 39, 683–687. doi: 10.1038/ng2012
Ito, H., Fukuda, Y., Murata, K., and Kimura, A. (1983). Transformation of intact yeast cells treated with alkali cations. J. Bacteriol. 153, 163–168. doi: 10.1128/jb.153.1.163-168.1983
Jedidi, I., Zhang, F., Qiu, H., Stahl, S. J., Palmer, I., Kaufman, J. D., et al. (2010). Activator Gcn4 employs multiple segments of Med15/Gal11, including the KIX domain, to recruit mediator to target genes in vivo. J. Biol. Chem. 285, 2438–2455. doi: 10.1074/jbc.M109.071589
Jiranek, V., Langridge, P., and Henschke, P. A. (1995). Regulation of hydrogen sulfide liberation in wine-producing Saccharomyces cerevisiae strains by assimilable nitrogen. Appl. Environ. Microbiol. 61, 461–467. doi: 10.1128/aem.61.2.461-467.1995
Kawahata, M., Masaki, K., Fujii, T., and Iefuji, H. (2006). Yeast genes involved in response to lactic acid and acetic acid: acidic conditions caused by the organic acids in Saccharomyces cerevisiae cultures induce expression of intracellular metal metabolism genes regulated by Aft1p. FEMS Yeast Res. 6, 924–936. doi: 10.1111/j.1567-1364.2006.00089.x
Kitagaki, H., Araki, Y., Funato, K., and Shimoi, H. (2007). Ethanol-induced death in yeast exhibits features of apoptosis mediated by mitochondrial fission pathway. FEBS Lett. 581, 2935–2942. doi: 10.1016/j.febslet.2007.05.048
Legras, J. L., Galeote, V., Bigey, F., Camarasa, C., Marsit, S., Nidelet, T., et al. (2018). Adaptation of S. cerevisiae to fermented food environments reveals remarkable genome plasticity and the footprints of domestication. Mol. Biol. Evol. 35, 1712–1727. doi: 10.1093/molbev/msy066
Loya, T. J., O’Rourke, T. W., and Reines, D. (2013). Yeast Nab3 protein contains a self-assembly domain found in human heterogeneous nuclear ribonucleoprotein-C (hnRNP-C) that is necessary for transcription termination. J. Biol. Chem. 288, 2111–2117. doi: 10.1074/jbc.M112.430678
Ludovico, P., Sousa, M. J., Silva, M. T., Leão, C., and Côrte-Real, M. (2001). Saccharomyces cerevisiae commits to a programmed cell death process in response to acetic acid. Microbiology 147, 2409–2415. doi: 10.1099/00221287-147-9-2409
Marks, V. D., Ho Sui, S. J., Erasmus, D., van der Merwe, G. K., Brumm, J., Wasserman, W. W., et al. (2008). Dynamics of the yeast transcriptome during wine fermentation reveals a novel fermentation stress response. FEMS Yeast Res. 8, 35–52. doi: 10.1111/j.1567-1364.2007.00338.x
Mendes-Ferreira, A., del Olmo, M., Garcia-Martinez, J., Jimenez-Marti, E., Leao, C., Mendes-Faia, A., et al. (2007a). Saccharomyces cerevisiae signature genes for predicting nitrogen deficiency during alcoholic fermentation. Appl. Environ. Microbiol. 73, 5363–5369. doi: 10.1128/AEM.01029-07
Mendes-Ferreira, A., del Olmo, M., Garcia-Martinez, J., Jimenez-Marti, E., Leao, C., Mendes-Faia, A., et al. (2007b). Transcriptional response of Saccharomyces cerevisiae to different nitrogen concentrations during alcoholic fermentation. Appl. Environ. Microbiol. 73, 3049–3060. doi: 10.1128/AEM.02754-06
Merz, S., and Westermann, B. (2009). Genome-wide deletion mutant analysis reveals genes required for respiratory growth, mitochondrial genome maintenance and mitochondrial protein synthesis in Saccharomyces cerevisiae. Genome Biol. 10:R95. doi: 10.1186/gb-2009-10-9-r95
Millard, P. J., Roth, B. L., Thi, H.-P. T., Yue, S. T., and Haugland, R. P. (1997). Development of the FUN-1 family of fluorescent probes for vacuole labeling and viability testing of yeasts. Appl. Environ. Microbiol. 63, 2897–2905. doi: 10.1128/aem.63.7.2897-2905.1997
Mira, P., Barlow, M., Meza, J. C., and Hall, B. G. (2017). Statistical package for growth rates made easy. Mol. Biol. Evol. 34, 3303–3309. doi: 10.1093/molbev/msx255
Mollapour, M., Fong, D., Balakrishnan, K., Harris, N., Thompson, S., Schuller, C., et al. (2004). Screening the yeast deletant mutant collection for hypersensitivity and hyper-resistance to sorbate, a weak organic acid food preservative. Yeast 21, 927–946. doi: 10.1002/yea.1141
Mortimer, R. K., and Johnston, J. R. (1986). Genealogy of principal strains of the yeast genetic stock center. Genetics 113, 35–43. doi: 10.1093/genetics/113.1.35
Myers, L. C., Gustafsson, C. M., Hayashibara, K. C., Brown, P. O., and Kornberg, R. D. (1999). Mediator protein mutations that selectively abolish activated transcription. Proc. Natl. Acad. Sci. U.S.A. 96, 67–72. doi: 10.1073/pnas.96.1.67
Nogi, Y., and Fukasawa, T. (1980). A novel mutation that affects utilization of galactose in Saccharomyces cerevisiae. Curr. Genet. 2, 115–120. doi: 10.1007/BF00420623
O’Malley, K. G., Ford, M. J., and Hard, J. J. (2010). Clock polymorphism in Pacific salmon: evidence for variable selection along a latitudinal gradient. Proc. Biol. Sci. 277, 3703–3714. doi: 10.1098/rspb.2010.0762
Outten, C. E., Falk, R. L., and Culotta, V. C. (2005). Cellular factors required for protection from hyperoxia toxicity in Saccharomyces cerevisiae. Biochem. J. 388, 93–101. doi: 10.1042/BJ20041914
Parker, D., Ferreri, K., Nakajima, T., LaMorte, V. J., Evans, R., Koerber, S. C., et al. (1996). Phosphorylation of CREB at Ser-133 induces complex formation with CREB-binding protein via a direct mechanism. Mol. Cell. Biol. 16, 694–703. doi: 10.1128/MCB.16.2.694
Pascal, E., and Tjian, R. (1991). Different activation domains of Sp1 govern formation of multimers and mediate transcriptional synergism. Genes Dev. 5, 1646–1656. doi: 10.1101/gad.5.9.1646
Peltier, E., Bernard, M., Trujillo, M., Prodhomme, D., Barbe, J. C., Gibon, Y., et al. (2018). Wine yeast phenomics: a standardized fermentation method for assessing quantitative traits of Saccharomyces cerevisiae strains in enological conditions. PLoS One 13:e0190094. doi: 10.1371/journal.pone.0190094
Peter, J., De Chiara, M., Friedrich, A., Yue, J. X., Pflieger, D., Bergstrom, A., et al. (2018). Genome evolution across 1,011 Saccharomyces cerevisiae isolates. Nature 556, 339–344. doi: 10.1038/s41586-018-0030-5
Pretorius, I. S. (2000). Tailoring wine yeast for the new millennium: novel approaches to the ancient art of winemaking. Yeast 16, 675–729. doi: 10.1002/1097-0061(20000615)16:8<675::AID-YEA585>3.0.CO;2-B
Provenzano, M. R., El Bilali, H., Simeone, V., Baser, N., Mondelli, D., and Cesari, G. (2010). Copper contents in grapes and wines from a mediterranean organic vineyard. Food Chem. 122, 1338–1343. doi: 10.1016/j.foodchem.2010.03.103
Qian, W., Ma, D., Xiao, C., Wang, Z., and Zhang, J. (2012). The genomic landscape and evolutionary resolution of antagonistic pleiotropy in yeast. Cell Rep. 2, 1399–1410. doi: 10.1016/j.celrep.2012.09.017
Rego, A., Duarte, A. M., Azevedo, F., Sousa, M. J., Corte-Real, M., and Chaves, S. R. (2014). Cell wall dynamics modulate acetic acid-induced apoptotic cell death of Saccharomyces cerevisiae. Microb. Cell. 1, 303–314. doi: 10.15698/mic2014.09.164
Reynolds, A., Cliff, M., Girard, B., and Kopp, T. G. (2001). Influence of fermentation temperature on composition and sensory properties of semillon and shiraz wines. Am. J. Enol. Viticu. 52, 235–240.
Samanfar, B., Omidi, K., Hooshyar, M., Laliberte, B., Alamgir, M., Seal, A. J., et al. (2013). Large-scale investigation of oxygen response mutants in Saccharomyces cerevisiae. Mol. Biosyst. 9, 1351–1359. doi: 10.1039/c3mb25516f
Sinha, A., and Pick, E. (2021). Fluorescence detection of increased reactive oxygen species levels in Saccharomyces cerevisiae at the diauxic shift. Methods Mol. Biol. 2202, 81–91. doi: 10.1007/978-1-0716-0896-8_7
Strope, P. K., Skelly, D. A., Kozmin, S. G., Mahadevan, G., Stone, E. A., Magwene, P. M., et al. (2015). The 100-genomes strains, an S. cerevisiae resource that illuminates its natural phenotypic and genotypic variation and emergence as an opportunistic pathogen. Genome Res. 25, 762–774. doi: 10.1101/gr.185538.114
Sun, X., Liu, L., Zhao, Y., Ma, T., Zhao, F., Huang, W., et al. (2016). Effect of copper stress on growth characteristics and fermentation properties of Saccharomyces cerevisiae and the pathway of copper adsorption during wine fermentation. Food Chem. 192, 43–52. doi: 10.1016/j.foodchem.2015.06.107
Sussel, L., Vannier, D., and Shore, D. (1995). Suppressors of defective silencing in yeast: effects on transcriptional repression at the HMR locus, cell growth and telomere structure. Genetics 141, 873–888. doi: 10.1093/genetics/141.3.873
Suzuki, Y., Nogi, Y., Abe, A., and Fukasawa, T. (1988). GAL11 protein, an auxiliary transcription activator for genes encoding galactose-metabolizing enzymes in Saccharomyces cerevisiae. Mol. Cell. Biol. 8, 4991–4999. doi: 10.1128/MCB.8.11.4991
Takagi, Y., Calero, G., Komori, H., Brown, J. A., Ehrensberger, A. H., Hudmon, A., et al. (2006). Head module control of mediator interactions. Mol. Cell 23, 355–364. doi: 10.1016/j.molcel.2006.06.007
Takagi, Y., and Kornberg, R. D. (2006). Mediator as a general transcription factor. J. Biol. Chem. 281, 80–89. doi: 10.1074/jbc.M508253200
Thakur, J. K., Arthanari, H., Yang, F., Pan, S. J., Fan, X., Breger, J., et al. (2008). A nuclear receptor-like pathway regulating multidrug resistance in fungi. Nature 452, 604–609. doi: 10.1038/nature06836
Tukey, J. W. (1949). Comparing individual means in the analysis of variance. Biometrics 5, 99–114. doi: 10.2307/3001913
Varela, C., Kutyna, D. R., Solomon, M. R., Black, C. A., Borneman, A., Henschke, P. A., et al. (2012). Evaluation of gene modification strategies for the development of low-alcohol-wine yeasts. Appl. Environ. Microbiol. 78, 6068–6077. doi: 10.1128/AEM.01279-12
Zapater, M., Sohrmann, M., Peter, M., Posas, F., and de Nadal, E. (2007). Selective requirement for SAGA in Hog1-mediated gene expression depending on the severity of the external osmostress conditions. Mol. Cell. Biol. 27, 3900–3910. doi: 10.1128/MCB.00089-07
Keywords: MED15/GAL11, wine yeast, domestication, Mediator, polyglutamine tracts, fermentation, ethanol
Citation: Cooper DG, Jiang Y, Skuodas S, Wang L and Fassler JS (2021) Possible Role for Allelic Variation in Yeast MED15 in Ecological Adaptation. Front. Microbiol. 12:741572. doi: 10.3389/fmicb.2021.741572
Received: 14 July 2021; Accepted: 27 September 2021;
Published: 18 October 2021.
Edited by:
Xinqing Zhao, Shanghai Jiao Tong University, ChinaReviewed by:
Feng-Yan Bai, Institute of Microbiology, Chinese Academy of Sciences (CAS), ChinaAgustin Aranda, Institute for Integrative Systems Biology, University of Valencia, Spain
Florian F. Bauer, Stellenbosch University, South Africa
Copyright © 2021 Cooper, Jiang, Skuodas, Wang and Fassler. This is an open-access article distributed under the terms of the Creative Commons Attribution License (CC BY). The use, distribution or reproduction in other forums is permitted, provided the original author(s) and the copyright owner(s) are credited and that the original publication in this journal is cited, in accordance with accepted academic practice. No use, distribution or reproduction is permitted which does not comply with these terms.
*Correspondence: Jan S. Fassler, amFuLWZhc3NsZXJAdWlvd2EuZWR1
†These authors have contributed equally to this work and share first authorship