 Bowei Gu1,2,3
 Hungchia Huang1,2
 Yizhe Zhang1,2
 Ran Li1,2Lei Wang4Ying Wang1,2
 Jia Sun1,2Jianning Wang1,2
 Rui Zhang1,2
 Nianzhi Jiao1,2
 Dapeng Xu1,2*
- 1State Key Laboratory of Marine Environmental Science, College of Ocean and Earth Sciences, Institute of Marine Microbes and Ecospheres, Xiamen University, Xiamen, China
- 2Fujian Key Laboratory of Marine Carbon Sequestration, Xiamen University, Xiamen, China
- 3Key Laboratory of Tropical Marine Bio-resources and Ecology, South China Sea Institute of Oceanology, Chinese Academy of Sciences, Guangzhou, China
- 4College of the Environment and Ecology, Xiamen University, Xiamen, China
Ciliates are pivotal components of the marine microbial food web, exerting profound impacts on oceanic biogeochemical cycling. However, the temporal dynamics of ciliate assemblages on a short time scale in the highly fluctuating estuarine ecosystem remain largely unexplored. We studied changes in the ciliate community during a short time frame in the high salinity waters (>26) of a subtropical estuary. Ciliate abundance, biomass, size and oral diameter structure, and community composition fluctuated considerably and irregularly over a few days or even a few hours. Spearman correlations and the generalized linear model revealed that heterotrophic prokaryotes (HPs) and viral abundances drove the dynamics of ciliate abundance and biomass. The structural equation model further identified a major path from the high-fluorescence content virus (HFV) to HPs and then ciliates. Given the substantial correlation between salinity and HPs/HFV, we proposed that the response of HPs and HFV to salinity drives the dynamics of ciliate biomass. Additionally, the Mantel test showed that phytoplankton pigments such as Lutein and Neoxanthin, phosphate, and pigmented picoeukaryotes were key covariates of the ciliate community composition. This study demonstrated the highly changing patterns of ciliate assemblages and identified potential processes regulating ciliate biomass and community composition on short timescales in a subtropical, hydrographically complex estuary.
Introduction
Typically, microbial communities drive marine ecosystem functions (Fenchel, 2008; Worden et al., 2015). Ciliates are a crucial component of marine microbial communities, integrating smaller prey (e.g., prokaryotes and nanoflagellates) and larger zooplanktons by channeling elements to higher trophic levels (Fenchel, 2008). Additionally, ciliate exudates may contain both labile and recalcitrant dissolved organic matter, contributing to the global carbon cycle (Strom et al., 1997; Stoecker, 1999; Jiao et al., 2010). These roles are especially critical in estuarine ecosystems, which harbor rich ciliate prey and many multicellular ciliate grazers (Stoecker and Capuzzo, 1990).
Estuarine systems characterized by strong and periodic tidal fluctuations are profoundly influenced by saltwater-freshwater mixing and tidal pumping (Kowalik, 2004; Heiss and Michael, 2014). Environmental parameters in the estuarine ecosystem typically fluctuate over short time scales, e.g., daily or even hourly. Together with increasing anthropogenic activity, such as the discharge of pollutants (e.g., heavy metals and nutrients), tidal mixing enables estuarine ecosystems to support vital and complex ecological niches and harbor diverse microbial groups that adapt to the highly dynamic estuarine environments (Maurice et al., 2011). The importance of ciliates in marine environments is widely recognized, and studies on ciliates in estuaries have made significant progress as well (Calbet and Landry, 2004). For example, using techniques with high taxonomic resolution, in situ investigations have advanced our understanding of the diversity, distribution patterns, and potential driving mechanisms of estuarine ciliates, highlighting the influence of the water mass (as defined by salinity and temperature) and other environmental factors on the ciliate community (Sun et al., 2017, 2020, 2021; Yang et al., 2020; Gu et al., 2021). Due to their small size and fast growth rate, microbial communities cannot remain static throughout time and can respond rapidly to even mild perturbations (Faust et al., 2015). Typically, the abundances of microbial members change considerably between measured time points (Gonze et al., 2018). For example, monthly or interannual time-series studies have shown that the abundance of ciliates in the Bahía Blanca Estuary can fluctuate by an order of magnitude, and wind-induced processes and water turbidity are responsible for ciliate dynamics (Loìpez-Abbate et al., 2019). While these studies yielded valuable insights into the long-term dynamics of ciliates, they could be easily obscured by the strong seasonal variations, particularly in the case of an uneven sampling distribution and subsequent inaccuracies. Additionally, understanding the dynamic patterns and environmental driving factors of microbial communities on a short time scale is crucial for inferring their distribution, activity, and roles in biogeochemical cycling (Khandeparker et al., 2017; Chen et al., 2019). Thus, high-resolution investigations of short-term changes in ciliate abundance and community composition are highly desired to gain insights into the intricate temporal dynamics of ciliates and their driving factors.
Recent years have seen an increase in the use of molecular approaches, e.g., sequencing of marker genes, such as the SSU rRNA gene, to explore the diversity and distribution of ciliates from a variety of marine environments (Grattepanche et al., 2014; Santoferrara et al., 2016; Sun et al., 2017, 2019, 2020, 2021; Zhao et al., 2017). However, sequencing-based methods cannot offer direct data on the abundance and biomass of ciliates, which is necessary for inferring their potential ecological functions (Santoferrara et al., 2016). Furthermore, due to the limitations of the reference database used to assign taxonomic identities to the retrieved sequences, many sequences cannot be confidently classified at the species level. Ciliates have been reported to feed on prey ca. 5–30% of their length and most efficiently on prey ca. 25% of their oral diameter (Dolan et al., 2013). Thus, ciliate size and oral diameter were considered to represent conservative taxonomic/functional traits (Dolan et al., 2013). Again, such information is accessible exclusively through morphology-based techniques, such as the quantitative protargol staining method (Meng et al., 2018; Sun et al., 2019; Yang et al., 2020; Gu et al., 2021; Huang et al., 2021). Details on the variations of ciliate size and oral diameter, abundance, biomass, and community composition during short-term time-series sampling may provide insights into their ecological niche and roles.
Thus, to explore the dynamic patterns of ciliates and to elucidate the environmental driving factors on a short time scale, a high frequency sampling strategy was conducted hourly for six non-continuous days in the high salinity waters (>26) of the Jiulong River estuary in southeast China. The Jiulong River estuary is a typically subtropical estuary (Supplementary Figure S1) that receives substantial quantities of nutrient-rich freshwater discharge (1.17 × 10¹⁰ m3 per year) from the Jiulong River (Huang and Hong, 1999). The river is mostly fed by the summer monsoon, which occurs between April and July, and there is no dam upstream to regulate the river’s flow (Huang and Hong, 1999). The suspended particles and nutrients, particularly NO3-N and soluble reactive phosphorus, in the Jiulong River estuary originated primarily from the Jiulong River (Yan et al., 2012). Previous studies have reported the distribution of polycyclic aromatic hydrocarbon (PAH) degrading bacteria, the seasonal dynamics of bacterial communities, the biogeographical patterns of archaea, the spatial/temporal distribution of microbial eukaryotes, and the seasonal changes of ciliates along salinity gradients in the Jiulong River estuary (Tian et al., 2002; Hu et al., 2015; Sun et al., 2017; Kong et al., 2019; Wang et al., 2019). However, no investigations of the short-term variations in ciliate assemblages have been conducted in this area. Our work aims to (i) explore changes in the abundance, biomass, size, oral diameter, and community composition of ciliates at a high resolution and (ii) gain insight into the coupling of ciliates and environmental parameters.
Materials and Methods
Sample Collection
The sampling site (S03, 118.031°E, 24.429°N) is located near the mouth of the Jiulong River and is significantly influenced by river discharge and seawater intrusion (Wang et al., 2019). Hourly samples were collected from 8:30 a.m. to 4:30 p.m. on April 3 and from 8:30 a.m. to 5:30 p.m. on April 5, 7, 9, 11, and 16, 2016. A 5 L polycarbonate bottle was used to collect seawater samples at a depth of ca. 0.5 m. Samples for phytoplankton pigment analysis were collected by filtering 500 ml of seawater through a 0.7 μm pore size, 47 mm GF/F (Gleman) glass fiber filter and immediately frozen in liquid nitrogen. Nutrient samples were filtered using the same filter and stored at –20°C until analysis. Two ml of seawaters were pre-filtered through a 20-μm mesh and fixed with ice-cold glutaraldehyde (0.5% final concentration) at room temperature for 15 min in the dark, then flash-frozen in liquid nitrogen to determine the abundance of picoplankton, including pigmented picoeukaryotes (PPEs), heterotrophic prokaryotes (HPs), Synechococcus, and viral-like particles (VLPs). For ciliate identification and enumeration, 500 ml of seawaters were fixed with Bouin’s solution (10% final concentration) with the addition of ice-cold acetic acid (1% final concentration) before fixation and stored in the dark at 20°C until further analysis.
Determination of Environmental Parameters
Temperature, salinity, and dissolved oxygen (DO) were determined in situ using a YSI Pro2030 (YSI Life Sciences, Yellow Springs, OH, United States). The inorganic nutrients, including phosphate, silicate, nitrite, and nitrate, were measured using a Seal AA3 auto-analyzer (Bran-Luebbe, GmbH, Delavan, WI, United States).
Phytoplankton pigments were determined following Huang et al. (2010). To summarize, phytoplankton pigments were extracted using N,N-dimethylformamide (Furuya and Marumo, 1983) and analyzed with a high performance liquid chromatography (HPLC) system (Agilent Series 1100, Agilent Technologies, Santa Clara, CA, United States) equipped with a 3.5-mm Eclipse XDB C8 column (100 × 4.6 mm; Agilent Technologies, Santa Clara, CA, United States) following Mantoura and Llewellyn (1983) and Van Heukelem and Thomas (2001).
The abundance of picoplankton and VLPs was determined using flow cytometers (Epics Altra II, Beckman Coulter, Brea, CA, United States, and BD Accuri C6, Franklin Lake, NJ, United States). Subsamples were stained with SYBR Green I (Molecular Probe, Eugene, OR, United States) according to the published protocol before assessing viral and HPs abundance (Marie et al., 1999). Fluorescent beads (Molecular Probes) with a diameter of 1 μm were added as an internal standard. Synechococcus and PPEs were identified without staining by their pigment fluorescence (Marie et al., 1999). The FlowJo vX.0.7 software (Tree Star, Ashland, OR, United States) was used to process all the data generated by flow cytometers.
Ciliate Identification and Enumeration
To determine the abundance, size, oral diameter, and species identity of ciliates, the quantitative protargol stain method was employed (Montagnes and Lynn, 1987). Briefly, the fixed samples (500 ml each) were filtered through one or two 0.8 μm pore size, cellulose nitrate filters (Whatman, Florham Park, NJ, United States), embedded in a thin layer of agar, stained with protargol, dehydrated with isopropanol and xylene solutions, and mounted using neutral balsam on microscopic slides. Each slide was thoroughly scanned at ×400 magnification, and all ciliates were identified and counted using a compound microscope (Olympus BX50). Ciliates were identified according to Montagnes and Lynn (1991), Strüder-Kypke and Montagnes (2002), and Xu et al. (2009). The carbon biomass of ciliates was calculated using simple geometric volume (Hillebrand et al., 1999) multiplied by a conversion factor of 0.19 pg C μm–3 (Putt and Stoecker, 1989).
Data Analysis
All statistical analyses were conducted using R 4.0.3. The “GGally” package in R based on Spearman correlations was used to analyze and visualize the association between ciliate abundance/biomass and environmental parameters [water temperature, salinity, DO, phosphate, silicate, nitrite, nitrate, Synechococcus, HPs, PPEs, high fluorescence content virus (HFV), and low fluorescence content virus (LFV)]. Additionally, a generalized linear model (GLM) based on Gaussian distributions was used to identify highly correlated variables and determine the best fit. The variance inflation factor (VIF) was used to test multicollinearity, and variables with a VIF > 10 were eliminated from the model (Graham, 2003). The GLM results aided in testing a set of hypothesized pathways that served as a framework for developing a multivariate model in which all parameters might function as endogenous (dependent) or exogenous (predictor) variables. We used confirmatory path analysis, a form of structural equation modeling (SEM), to assess possible relationships between environmental parameters and ciliate abundance (Shipley, 2000). SEM was calculated using the “lavaan” package in R (Rosseel, 2012), and model fit was tested by the metrics of Chi-square value (χ2), comparative fit index (CFI), and root square mean error of approximation (RMSEA) (Schermelleh-Engel and Moosbrugger, 2003). The total number of samples for the model was 59.
A principal coordinate analysis (PCoA) plot based on Bray Curtis dissimilarities was used to depict the ordination of the ciliate community with the “vegan” package in R (Oksanen et al., 2010). Additionally, the Mantel test was performed with the same R package to explore the correlations between ciliate communities and environmental parameters.
Results
Environmental Parameters
The water temperature at S03 ranged between 18.0 and 21.9°C, with a daily variation of ca. 2°C. Relatively modest salinity changes between 26.74 and 31.68 were recorded, which exhibited a significant negative correlation with temperature (r = –0.59, p < 0.001) (Figure 1 and Supplementary Figure S2). Salinity was typically highest in the morning and evening and lowest at noon, except on April 16. The average concentrations of phosphate, silicate, nitrite, and nitrate were 1.17 ± 0.48, 30.89 ± 9.63, 4.74 ± 1.78, and 32.34 ± 10.51 μM, respectively, and all of them had a significantly inverse relationship with salinity (r = –0.60, p < 0.01; r = –0.95, p < 0.001; –0.95, p < 0.001; r = –0.91, p < 0.001) and covaried with temperature (r = 0.56, p < 0.001; r = 0.60, p < 0.001; r = 0.52, p < 0.001; r = 0.59, p < 0.001) (Figure 1 and Supplementary Figure S2).
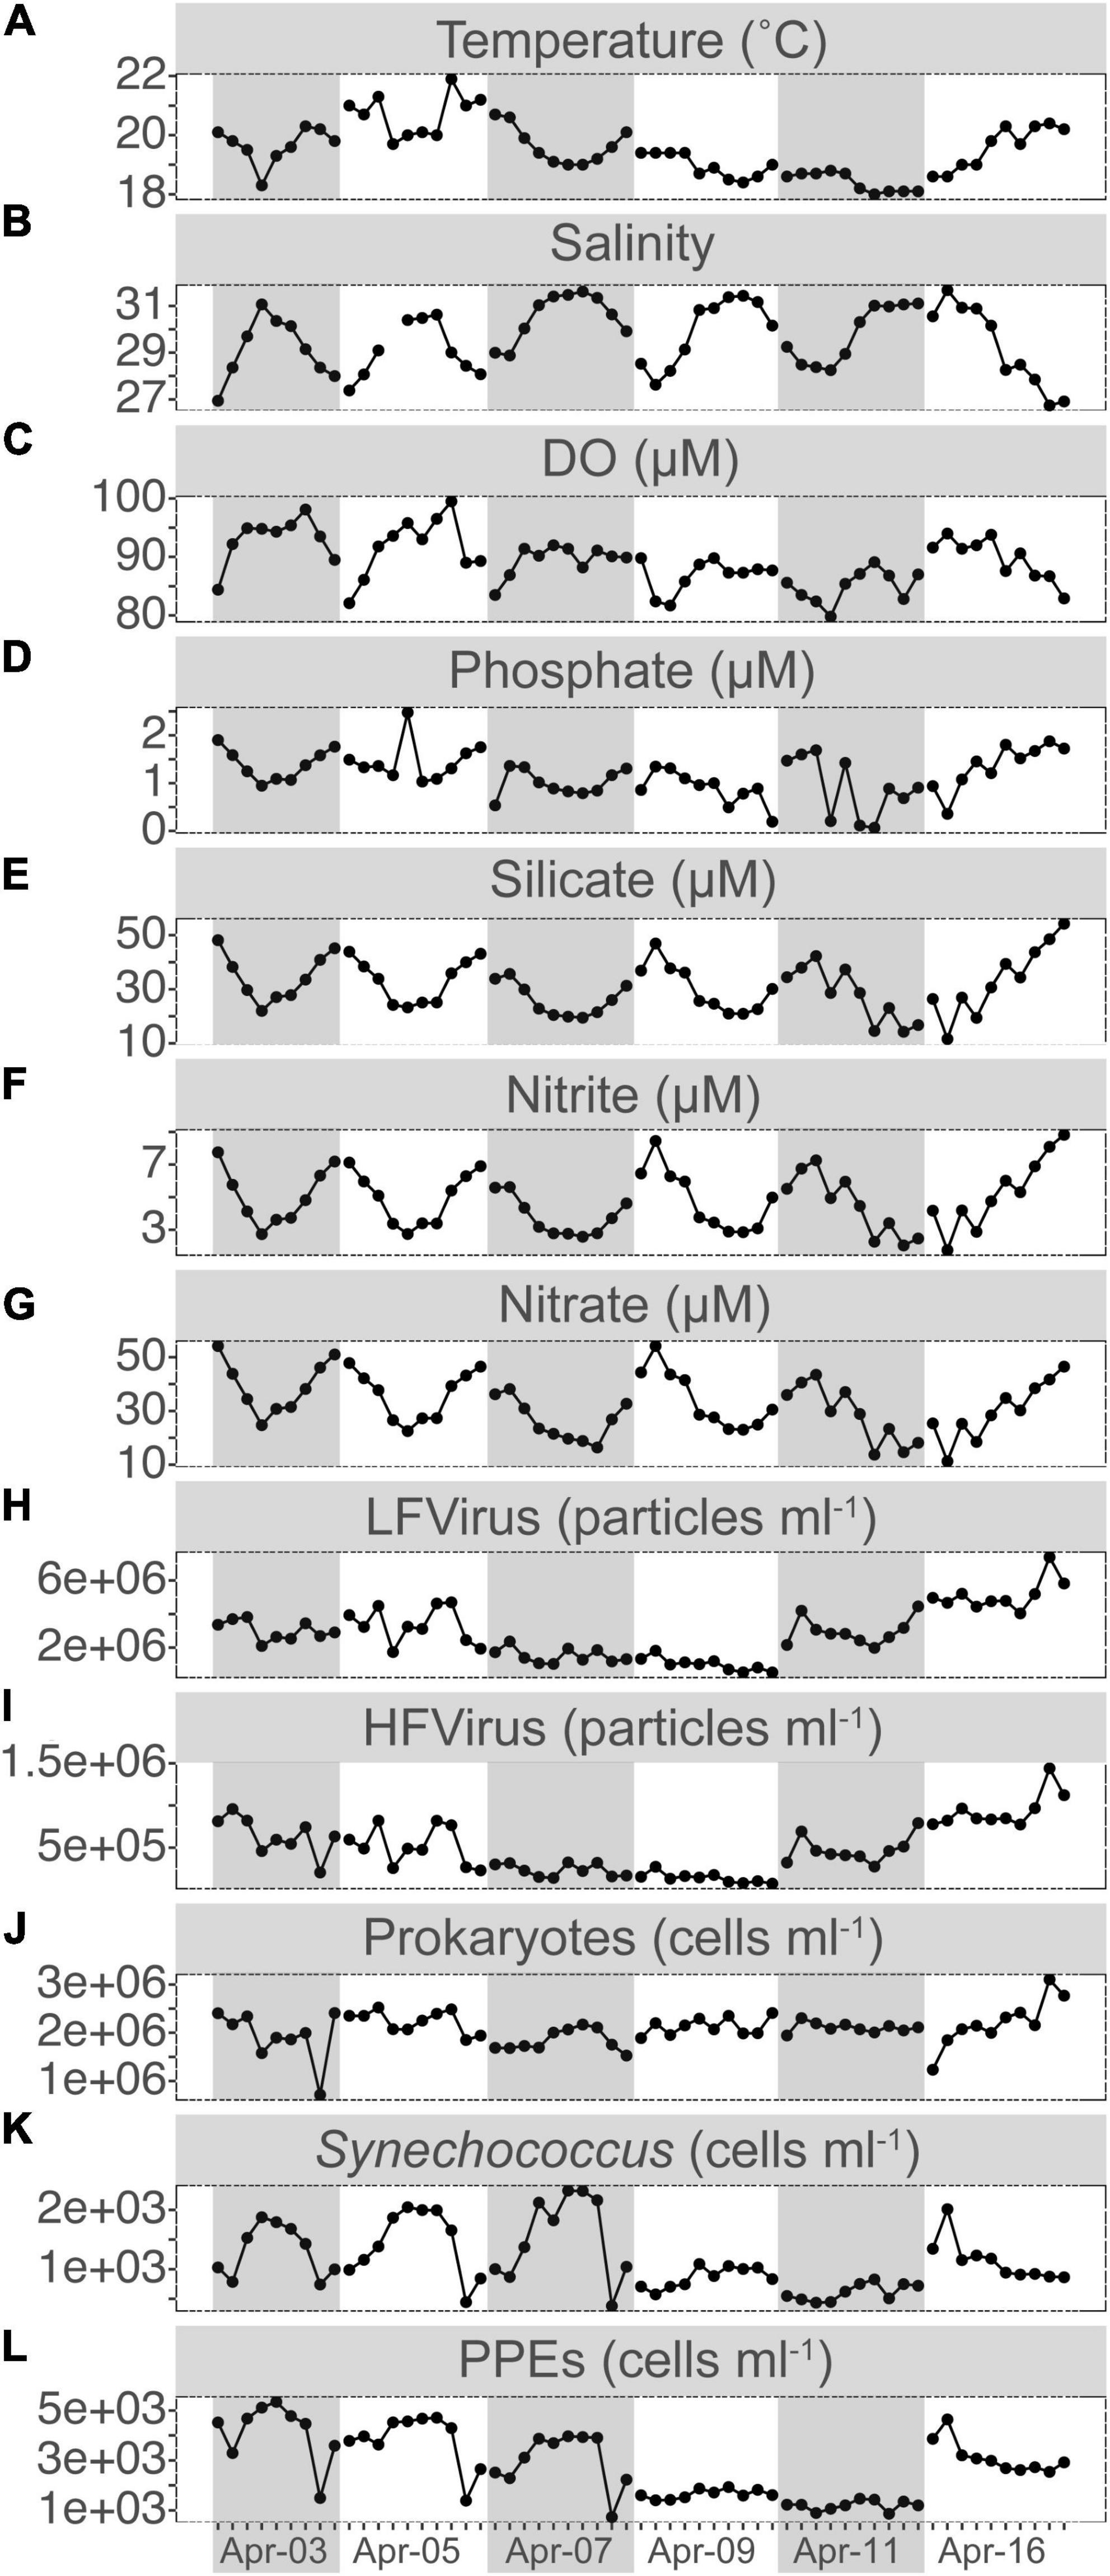
Figure 1. Short-term time series of the dynamics for temperature (A), salinity (B), dissolved oxygen (DO, C), phosphate (D), silicate (E), nitrite (F), and nitrate (G) concentrations, LFvirus (low-fluorescence content virus, H), HFvirus (high-fluorescence content virus, I), heterotrophic prokaryotes (J), Synechococcus (K), and PPEs (pigmented picoeukaryotes, L) abundance. Gray or non-gray shadow represented different sampling days.
PPEs were the dominant picophytoplankton throughout our study period, with a mean abundance of 2.80 ± 1.34 × 10³ cells ml–1, about twice that of Synechococcus. During the first 3 days, PPEs and Synechococcus both showed relatively comparable patterns of variation in abundance, with a peak at noon and a relative decrease in the morning and evening (Figure 1). Compared to PPEs and Synechococcus, the patterns of HPs, HFVs, and LFVs abundance did not exhibit apparent daily regularity (Figure 1). The abundances of HFVs and LFVs increased from 7.34 × 10⁴ and 5.27 × 10⁵ cells ml–1 (17:30 on Apr 9) to 1.44 × 10⁶ and 7.38 × 10⁶ cells ml–1 (16:30 on Apr 16) (ca. a 20-fold increase for HFVs and a 14-fold increase for LFVs, respectively), whereas the HPs abundance increased from 7.18 × 10⁵ cells ml–1 (15:30 on Apr 3) to 3.10 × 10⁶ cells ml–1 (16:30 on Apr 16, ca. 30-fold increase).
Ciliate Abundance, Biomass, Cell Size, Oral Diameter, and Correlations With Environmental Parameters
Ciliates were a modest component of the counted microbial plankton, with an abundance of 4–7 orders of magnitude lower than picoplankton (Figures 1, 2A). Ciliates were not found in about half (31/59) of the samples. Ciliate abundance averaged 15.21 ± 24.30 cells l–1 and varied significantly (Figures 2A,B) throughout the day and sampling period, peaking at 95 cells l–1 at 11:30 on Apr 16. When all time-series data were integrated, ciliate abundance showed only significant correlations with biotic factors, including HPs (r = 0.26, p < 0.05), HFVs (r = 0.41, p < 0.01), and LFVs abundance (r = 0.38, p < 0.01). By contrast, no significant correlations (p > 0.05) between ciliate abundance and abiotic factors were found. Higher biomass of ciliates was observed in the final 3 days (0.22 ± 0.29 μg C l–1) than in the first 3 days (0.05 ± 0.09 μg C l–1), and the maximum biomass (0.85 μg C l–1) was found at 17:30 on Apr 9. To assess changes in the cell size and oral diameter structure, ciliates were divided into four size fractions (20–39, 40–59, 60–80, and >80 μm) and four oral diameter categories (10–19, 20–30, and >30 μm). The ciliate community was dominated by the 40–59 (29.81%) and 60–80 μm (43.45%) cell size fractions, as well as the 20–30 μm (63.32%) oral diameter fractions (Figures 2C,D).
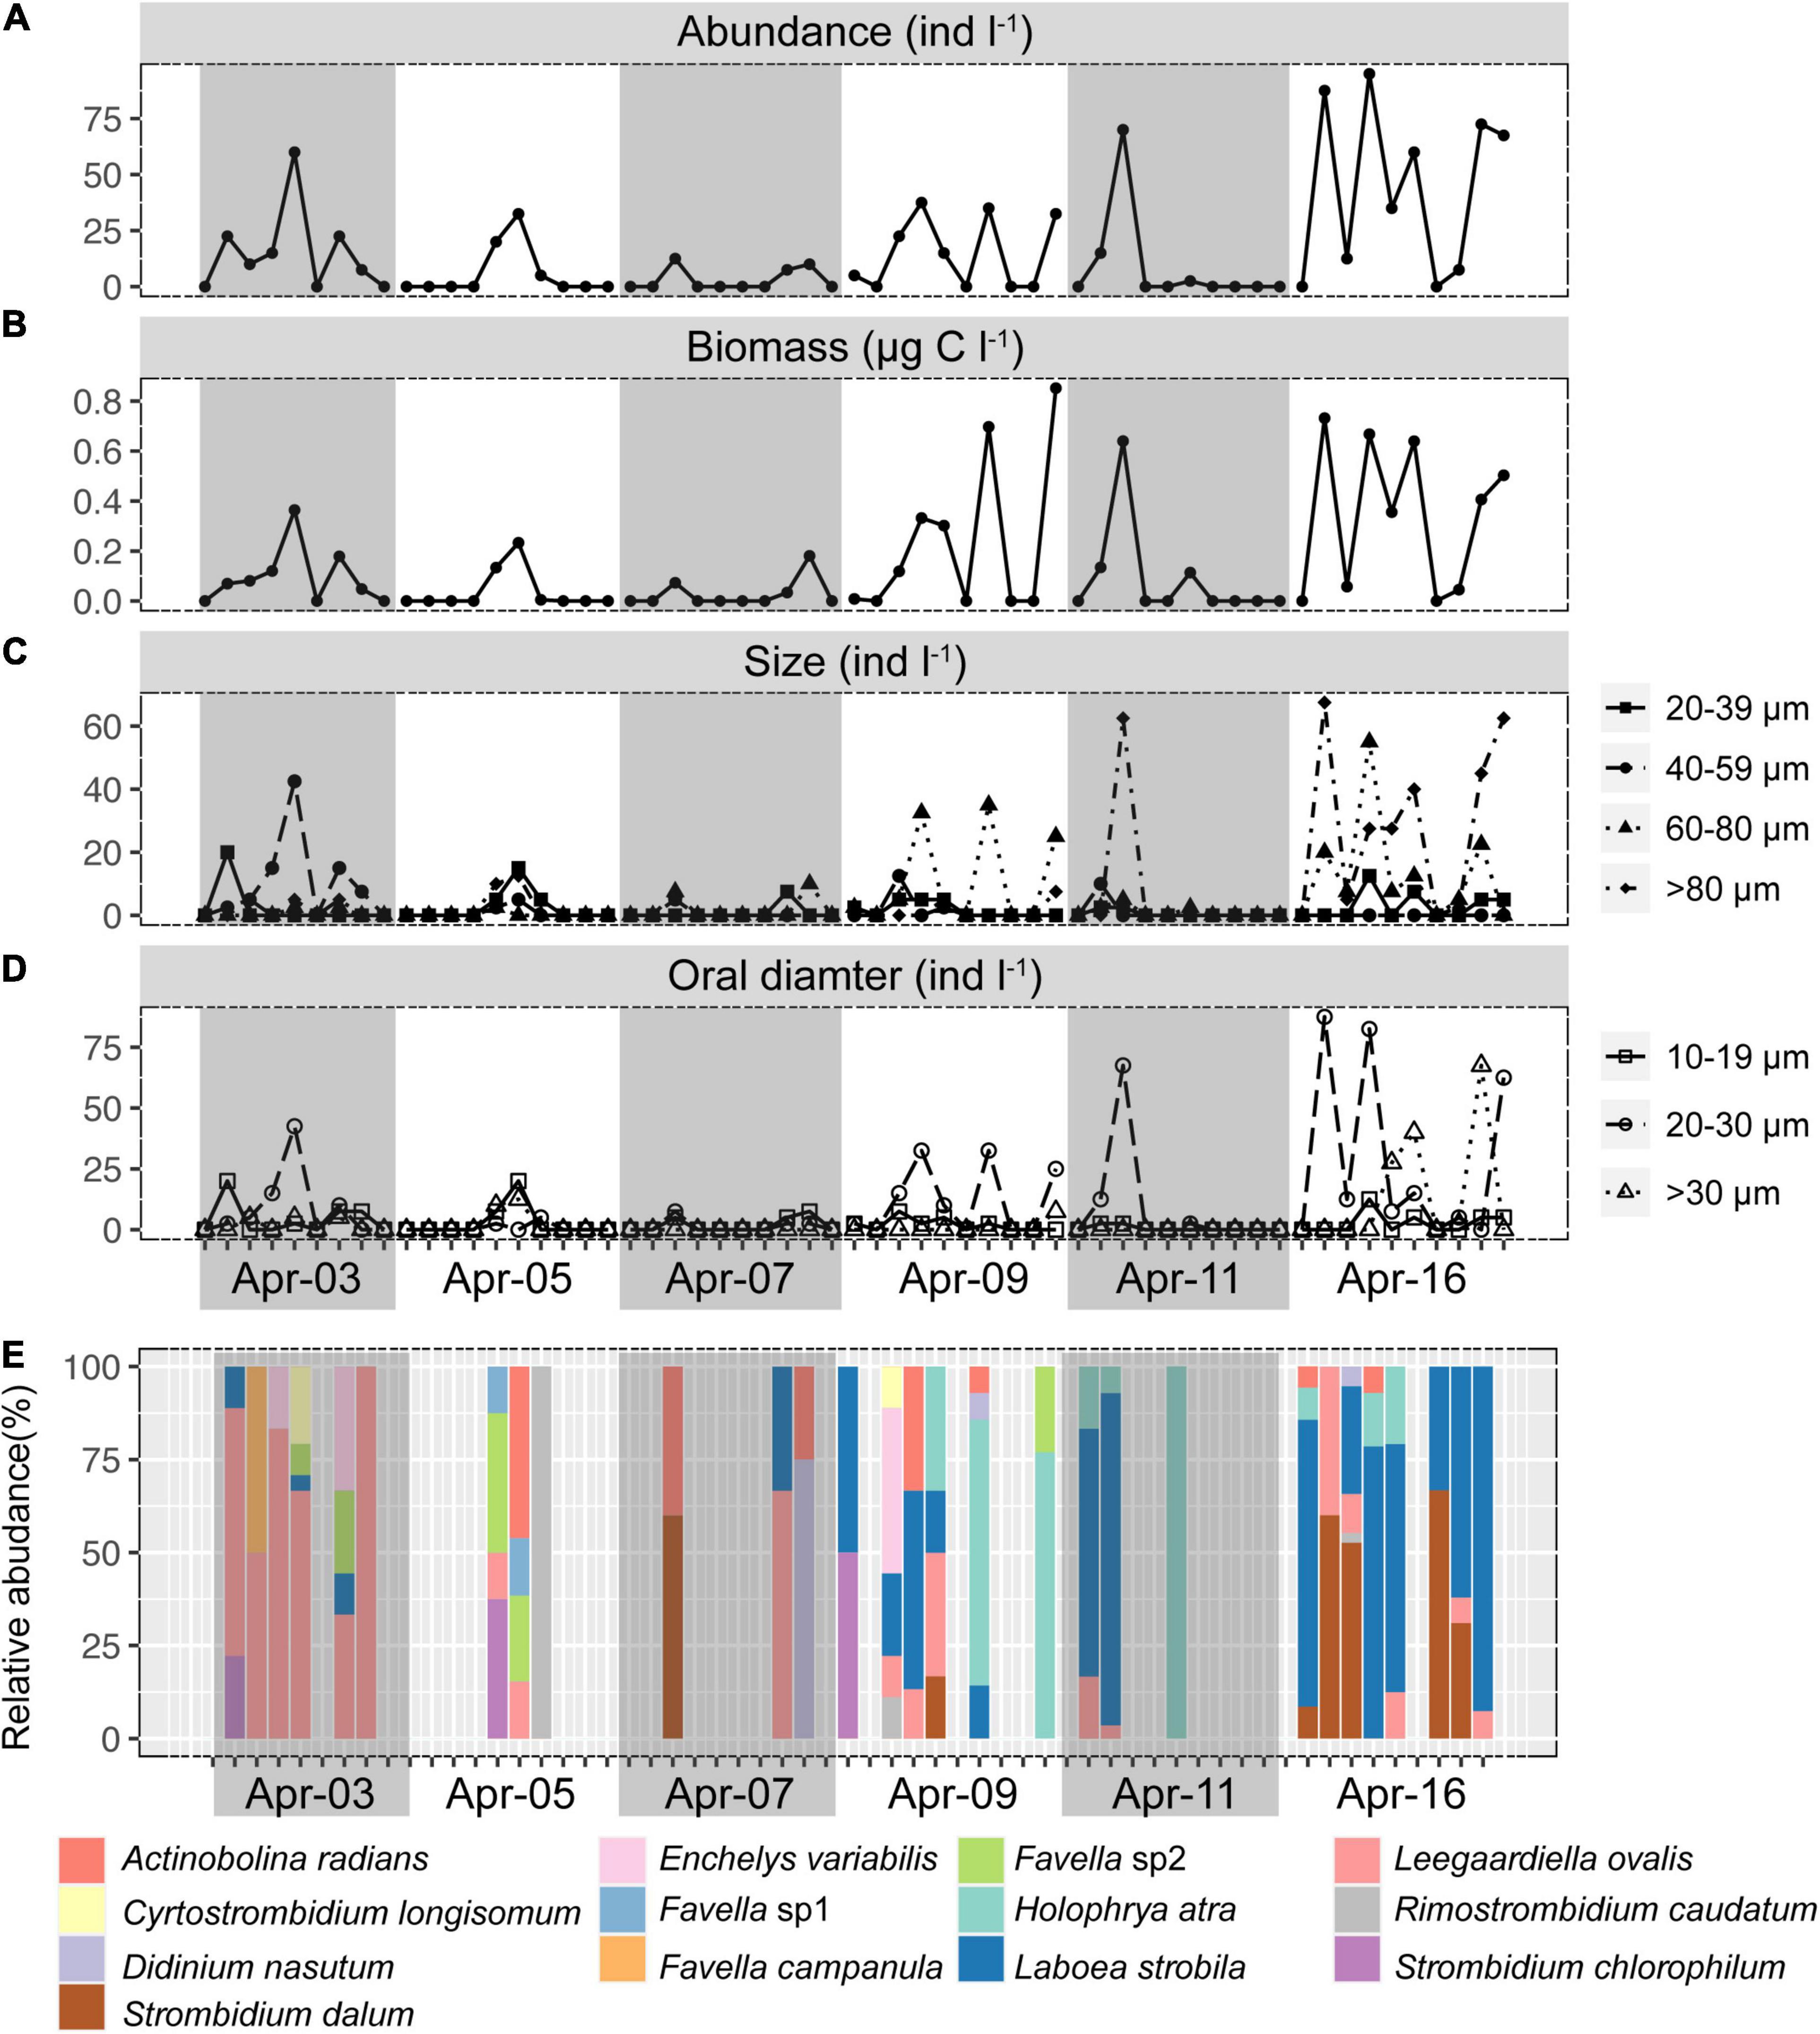
Figure 2. Short-term time series of the abundance (A), biomass (B), size structure (C), oral diameter structure (D), and community composition of ciliates (E). Gray or non-gray shadow represented different sampling days.
Generalized linear models (GLM) were used to determine the main and interactive effects and effect sizes of environmental parameters on ciliate abundance and biomass. The results indicated that environmental factors (e.g., temperature and salinity) had an insignificant effect on the ciliate abundance and biomass (p > 0.05). However, biotic variables (e.g., HFVs and HPs) were significant covariates (p < 0.05) of ciliate abundance and biomass (Figures 3A,B). A path analysis was also used to build a multivariate model that could be used as a framework for all parameters to function as dependent or predictor variables (Figure 3C). The final model confirmed that salinity had a significant direct effect on nitrate concentration (r = –0.94, p < 0.01) but not on ciliate abundance (r = 0.22, p > 0.05). Significant pathways (r = 0.31, p < 0.05) were discovered between ciliates from HPs that are significantly influenced by HFVs (r = 0.42, p < 0.01) (Figure 3C). Overall, the resulting SEM fit our data well (χ2 = 7.721, p = 0.358, CFI = 0.995, rmsea = 0.042), indicating the potential control mechanism of ciliate biomass.
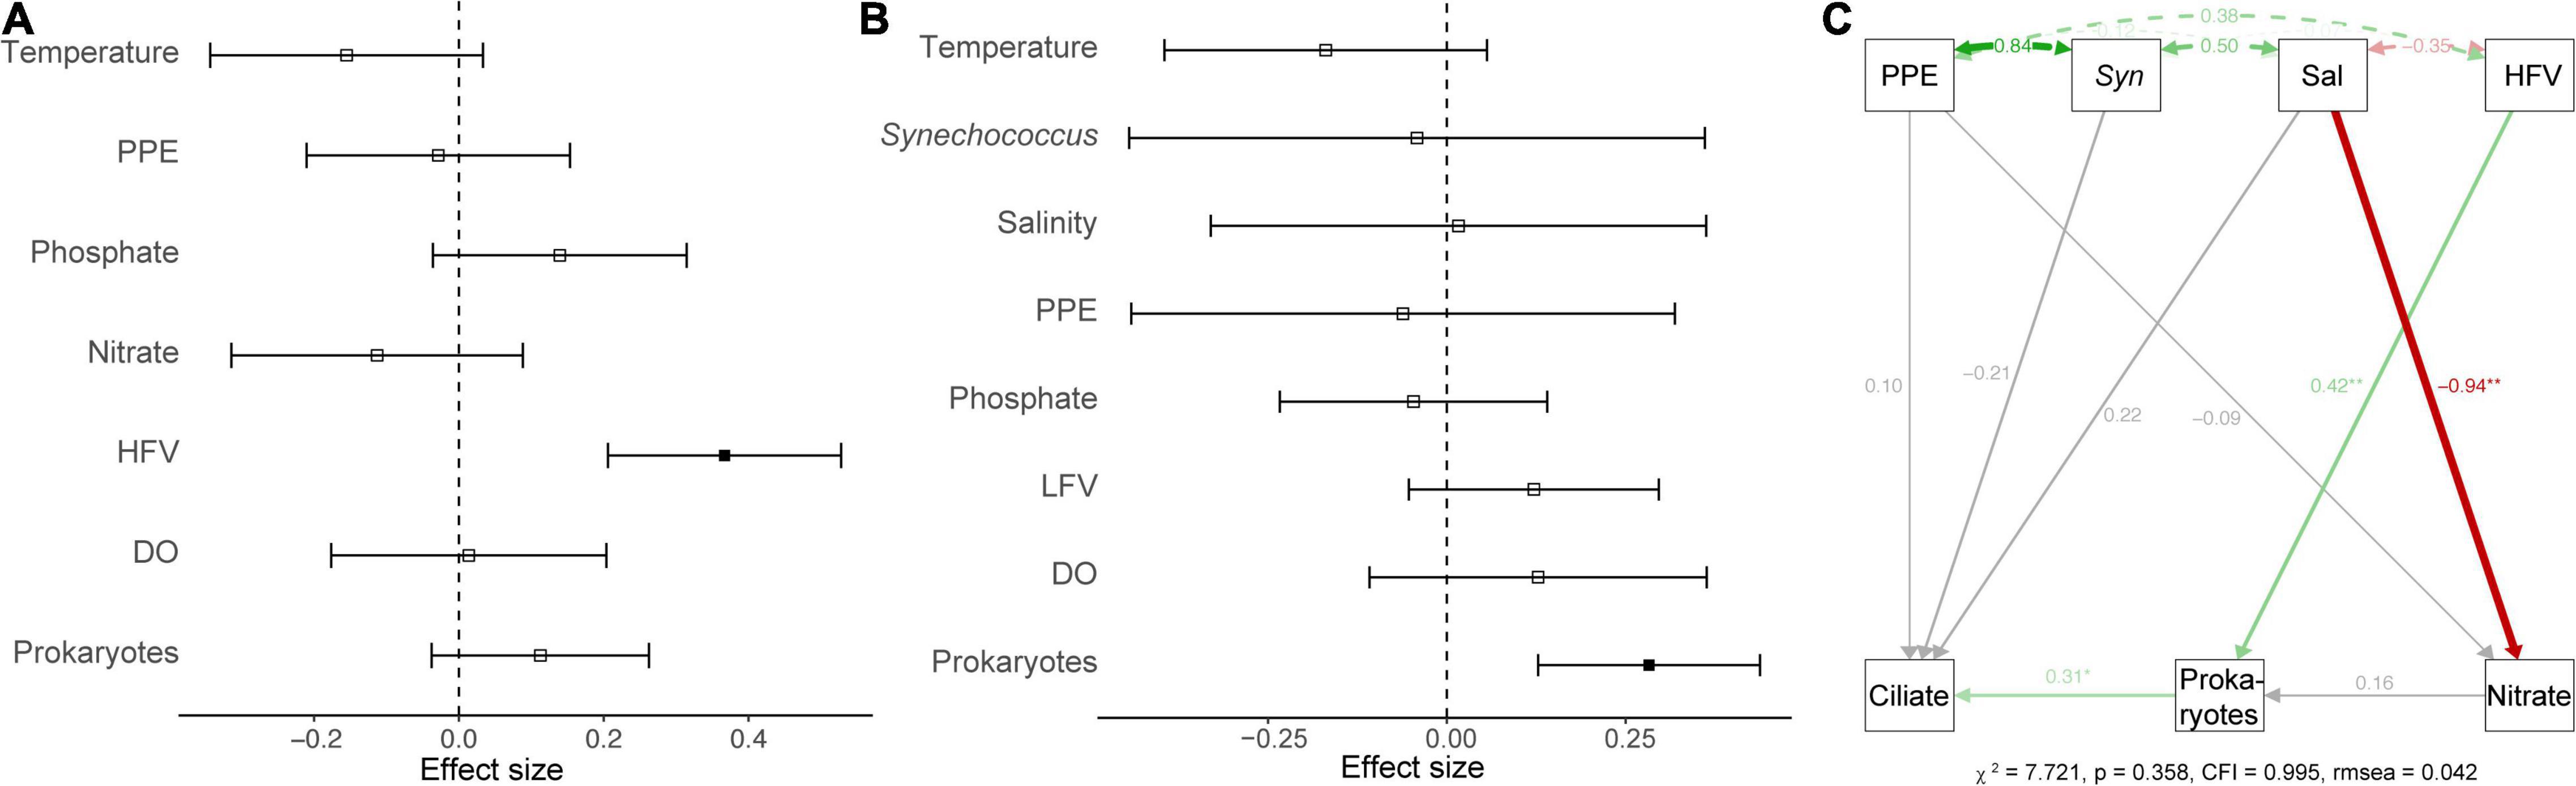
Figure 3. A generalized linear model showed the effect of environmental variables on the abundance (A) and biomass (B) of ciliates. Significant (p < 0.05) and non-significant (p > 0.05) effects were marked by the solid or non-solid square dots, respectively. (C) Structural equation model that describes potential direct impacts of environmental variables (PPEs, Syn, salinity, HFV, heterotrophic prokaryotes, and nitrite) on ciliate biomass. The solid green and red arrows indicated significant (p < 0.05) positive and negative associations, respectively. The gray arrows indicated that the correlations were non-significant (p > 0.05). Double-headed arrows represented covariances. Path coefficients are displayed next to arrows and represent the expected change in the response given a one-unit change in the predictor given the other variables.
The Composition of Ciliate Communities and Their Relationships With Environmental Variables
Thirteen species were retrieved during the study period (Figure 2E and Supplementary Figure S3). Leegaardiella ovalis (ca. 22.41% of overall abundance), Laboea strobila (ca. 27.98%), Strombidium dalum (ca. 10.19%), and Holophrya atra (ca. 12.04%) were the most abundant species. Generally, the ciliate community exhibited no clear pattern of occurrence throughout each day. There were differences between different days. For example, the first day was dominated by L. ovalis (ca. 66.67%), whereas the last 3 days were dominated by L. strobila (ca. 44.22%) (Figure 3C). In the PCoA based on Bray Curtis distance, ciliate communities were fragmented and were not grouped according to the sampling time or tides (i.e., spring, neap, and transitional periods), indicating that the community composition fluctuated significantly within and between days (Figure 4). The Mantel test revealed that the ciliate community was significantly correlated with Lutein (r = 0.438, p < 0.001) and Neoxanthin (r = 0.312, p = 0.008). Phosphate and PPEs were also found to be significantly correlated with the ciliate community, but with rather low r values (r = 0.210, p = 0.028 for phosphate and r = 0.163, p = 0.037 for PPEs, respectively). Temperature (r = –0.01, p = 0.507) and salinity (r = –0.05, p = 0.767) had no significant effects on the ciliate community (Table 1).
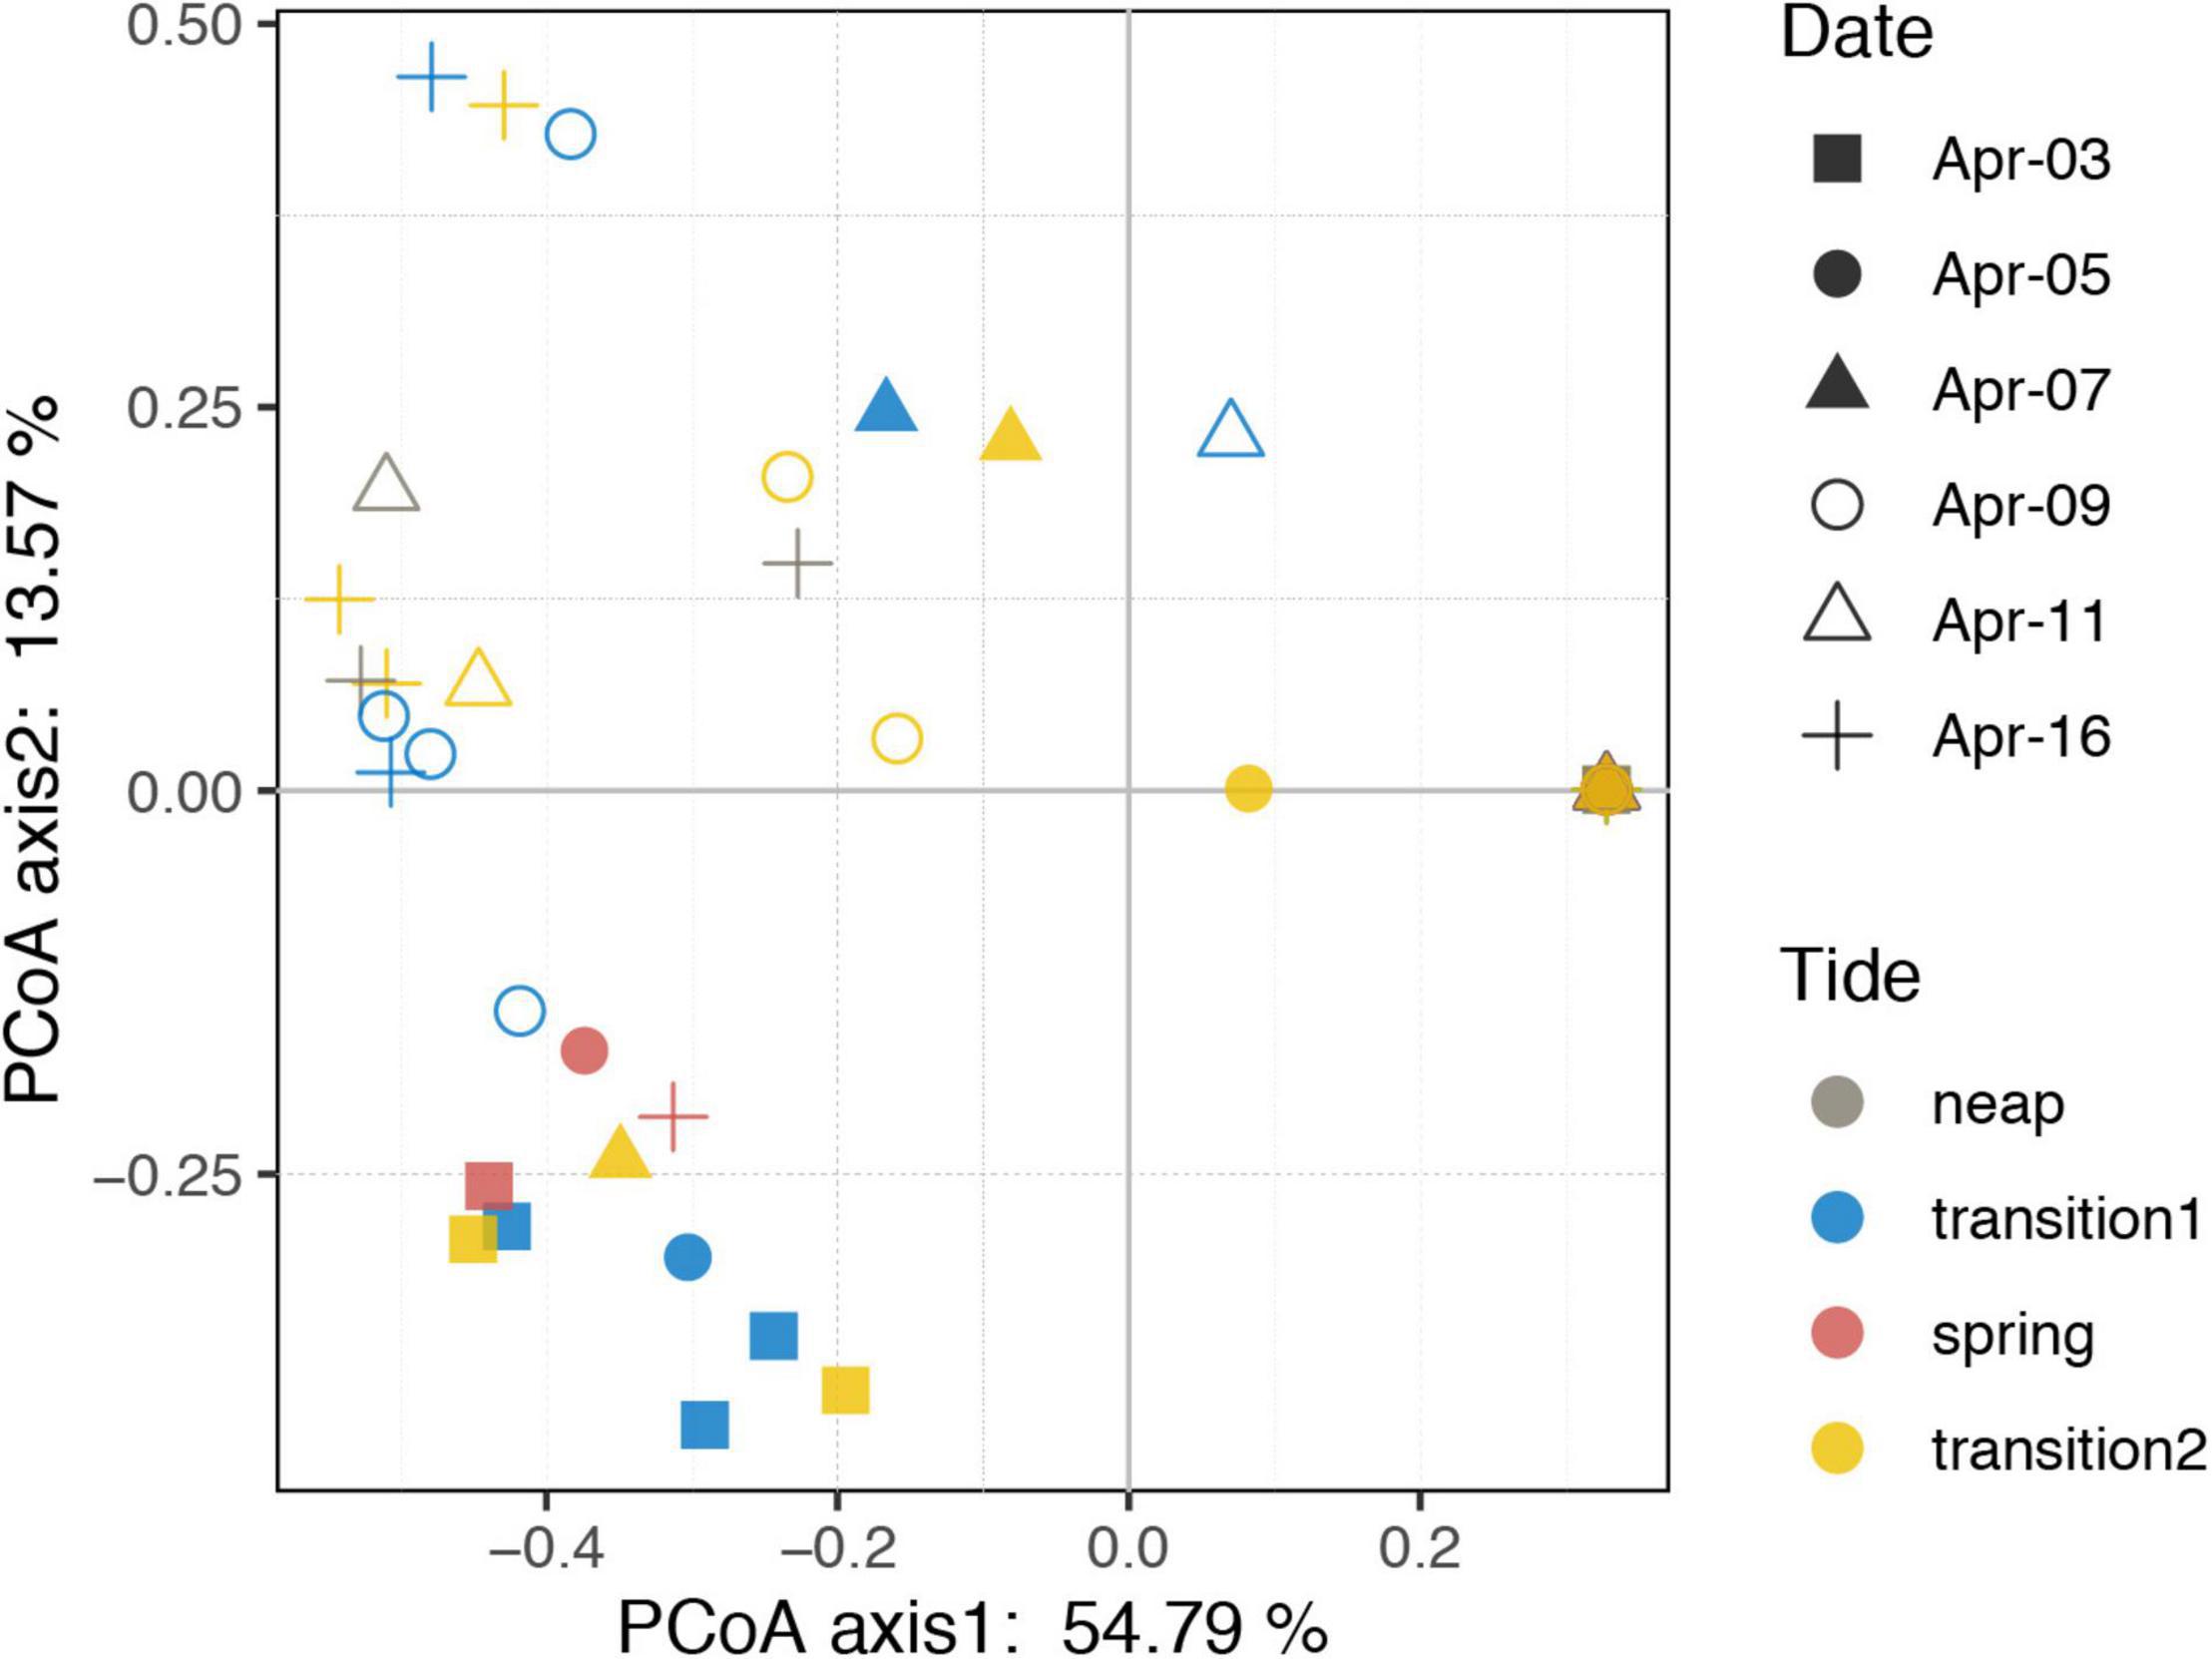
Figure 4. Principal coordinate analysis plot based on Bray–Curtis dissimilarity of the ciliate community. Neap, transition, and spring tide were distinguished based on the distinct variations of tidal range. Transition 1 and 2 represents the transition from neap to spring and from spring to neap tides, respectively.
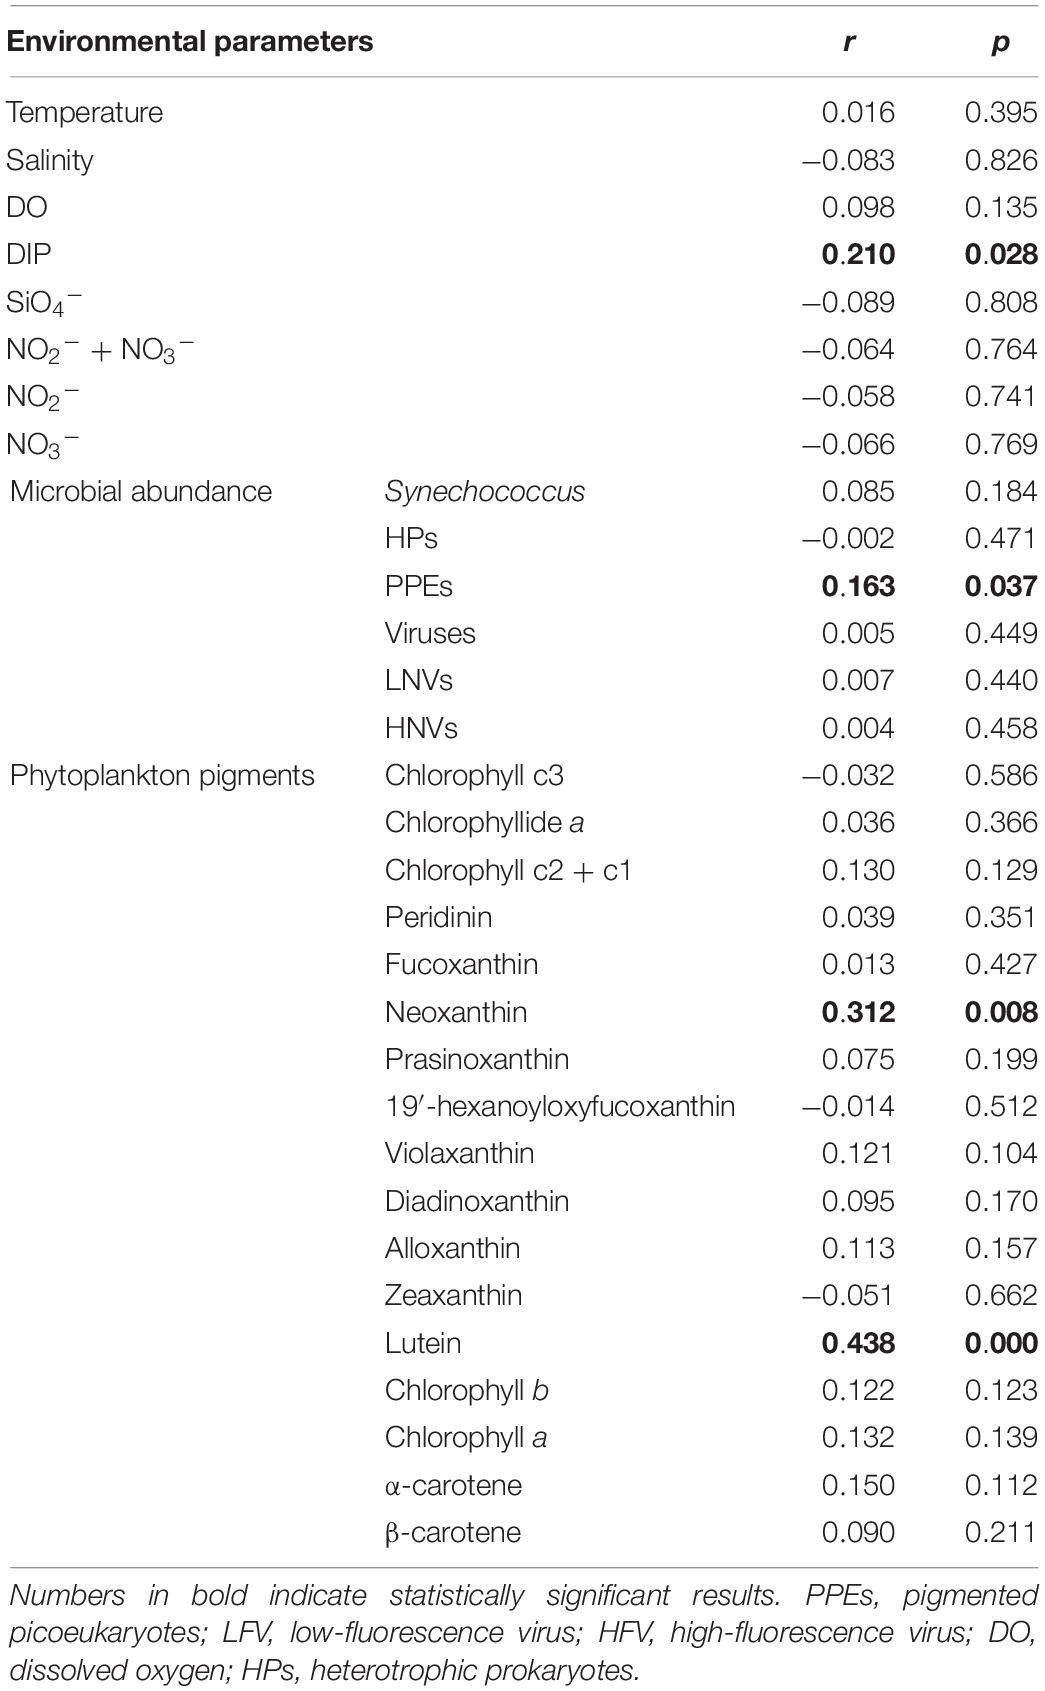
Table 1. Mantel test comparison between ciliate community variability (measured as Bray–Curtis dissimilarity) and environmental parameters.
Discussion
To our best knowledge, this is the first study to explore the dynamics of ciliates using the quantitative protargol stain approach over a short-term and high-frequency time series (i.e., hourly sampling). At S03, the coupling of temperature, salinity, and nutrients was observed (Figure 1), which closely mirrored the dilution effect pattern observed in estuarine environments where nutrients from eutrophic freshwater were diluted by oligotrophic offshore seawater. Our data showed unequivocally that a high-frequency sampling strategy could be used to detect a wide range of temporal changes in ciliate assemblages in the Jiulong River estuary. We emphasized that in subtropical estuarine environments, ciliates (abundance, biomass, size and oral diameter structure, and community composition) exhibited dramatic variations within a few days, even a few hours. Using Spearman correlation, GLM, path analysis, and mantel test, we found that biological factors (PPEs, HPs, viruses, and phytoplankton pigments) were the driving factors of ciliate variations in the waters with high nutrient input and salinity (26.7–31.7) of the Jiulong River estuary.
High Dynamics of Ciliate Assemblages
In general, the abundance of ciliates varied substantially across the study period at the Jiulong River estuary sampling site, with a narrow gradient of high estuarine salinities. In comparison to other coastal estuaries and bays worldwide (Chiang et al., 2003; Strom et al., 2007; Tsai et al., 2011; Haraguchi et al., 2018; Loìpez-Abbate et al., 2019; Yang et al., 2020; Gu et al., 2021), the abundance of ciliates was comparatively lower, ranging between 0 and 95 cells l–1, although this was within the range reported in some literature (Santoferrara and Alder, 2009; Santoferrara et al., 2010). Additionally, due to the small number of sampling stations (1 station) and the short sampling period (6 days), only 13 ciliate species were recovered, far fewer than in previous large-area sampling studies in the estuary (Tsai et al., 2011; Yang et al., 2020; Gu et al., 2021). Long-term time series investigations in estuarine ecosystems have revealed seasonal changes in ciliate abundance, biomass, size, and community composition (Tsai et al., 2011; Haraguchi et al., 2018). Our study further revealed that the abundance, biomass, size, oral diameter, and community composition of ciliates changed rapidly and irregularly within a few days or even a few hours in the estuary (Figure 2), and these dynamics influenced prey populations (e.g., HPs, PPEs, and Synechococcus) via top–down control. For instance, changes in the oral diameter and community structure of ciliate assemblages may alter prey composition, as various species have different grazing preferences (Gong et al., 2016), and ciliates feed most efficiently on prey ca. 25% of their oral diameter (Dolan et al., 2013). Additionally, the dominance of the ciliate community shifted from Leegaardiella ovalis on Apr 3 to Laboea strobila on Apr 16, indicating that the function of the ciliate assemblages may transition from heterotrophic to phototrophic/mixotrophic, thus potentially affecting the primary productivity of the system.
Environmental Factors Shaping the Abundance, Biomass, and Community Composition of Ciliates
In estuarine ecosystems, salinity is commonly considered a crucial factor in shaping microbial populations (Campbell and Kirchman, 2013; Xia et al., 2017), including ciliates (Elloumi et al., 2006; Yang et al., 2020; Gu et al., 2021). In this study, Synechococcus and HPs abundances increased with salinity (Supplementary Figure S2, r = 0.50, p < 0.001; r = 0.34, p < 0.05, respectively), confirming earlier findings (Jochem, 2003; Zhang et al., 2013; Chen et al., 2019). However, the observed ciliate abundance and biomass did not follow this trend (Supplementary Figure S2), exhibiting substantial changes within hours or days (Figure 2). Our results showed that salinity had only a minor effect on ciliate abundance and biomass (Figures 3A,B). During the study period, salinity fluctuated slightly (26.7–31.0). Because sampling a high salinity range was not the focus of this work, the “real” effect of salinity on estuarine ciliate communities cannot be detected by the present dataset.
Ciliates have been identified as the primary bacterial grazers and are expected to consume up to 100% of the estimated protozoan bacterivory in coastal waters (Sherr and Sherr, 1987; Zhao et al., 2020). In the present study, SEM analysis revealed a significant path from HFVs to HPs and then to ciliates, implying changes in ciliate biomass over a short time in the Jiulong River estuary may be attributed to changes in food supply (HPs). Chen et al. (2019) highlighted the importance of virus-HPs interactions in microbial dynamics (i.e., bacterial production and community composition) in the Jiulong River estuary. We further discovered that virus-HPs interactions might play a role in regulating ciliate biomass via bottom-up control in the Jiulong River estuary. HPs are highly sensitive to changes in ionic strength, and variation in salinity (26.7–31.7) during the tidal cycle may result in a shift in the physiological stress on metabolic processes of HPs (Kukkaro and Bamford, 2009; Wei et al., 2019). As with HPs, the realized niche of viruses would be confined by salinity, as salt stress has been shown to directly affect their survival and ability to infect (Wei et al., 2019). Ciliates appeared to be less salinity-sensitive than HPs and viruses because they expanded across a wide range of salinities (Li et al., 2018, 2019). However, due to a lack of data on nanoflagellates and copepods, which are commonly acknowledged as the food and grazers of ciliates, it was unknown whether nanoflagellates and copepods affected ciliate abundance, biomass, and community composition in the Jiulong River estuary during a short period. Overall, our study found that in the high salinity waters (26.7–31.7) of the Jiulong River estuary, salinity has a minor direct regulatory effect on ciliate abundance and biomass. In contrast, virus-HPs interactions drove the changes in ciliate biomass (Figure 3).
Additionally, phytoplankton pigments including Lutein (r = 0.438, p < 0.001) and Neoxanthin (r = 0.312, p = 0.008) were found to be significantly correlated with ciliate community composition (Table 1). In the estuary, Lutein and Neoxanthin were mostly found in chlorophytes, serving as food sources for ciliates (Ansotegui et al., 2003). Lutein and Neoxanthin accounted for ca. 0–58.8% of total phytoplankton pigments, with an average of ca. 20% (Supplementary Figure S4). It has been reported that protistan grazers can preferentially hunt certain groups of phytoplankton (Li et al., 2021). Thus, the composition of ciliate communities may be directly altered by the phytoplankton communities through grazing. Meanwhile, ciliate communities may be altered due to predation on nanoflagellate assemblages, which typically feed on phytoplankton. Additionally, it has been proposed that phytoplankton can mobilize organic nutrients, affecting the organic nutrients available to heterotrophic prokaryotes and thereby affecting the grazers, i.e., nanoflagellates and ciliates. This “indirect effect” of phytoplankton-organic nutrients-heterotrophic prokaryotes-grazers may also account for the correlations found between phytoplankton pigments and ciliate communities in this study (Fenchel, 2008). Phosphate was the third factor that significantly correlated with ciliate community composition (Table 1, r = 0.17, p = 0.045, Mantel test), consistent with a recent report conducted in the Pearl River estuary (Gu et al., 2021). We surmised that it was owing to the dominance of L. strobila, an autotrophic/mixotrophic ciliate species, that might require dissolved inorganic phosphate (DIP) for growth (McManus and Fuhrman, 1986).
Conclusion
In summary, our work established that the abundance, biomass, cell size and oral diameter structure, and community composition of ciliates in high salinity waters (>26) of the Jiulong River estuary altered significantly and irregularly during a short period (i.e., both hourly and daily). Biotic factors (HFVs and HPs) were strongly associated with ciliate abundance and biomass rather than abiotic factors. Further analysis showed that the path from salinity to HPs and viruses and finally to ciliates might account for the dynamics of ciliate biomass. In contrast, the ciliate community was primarily shaped by phytoplankton pigments, including Neoxanthin and Lutein, followed by phosphate and PPEs. Our results bridged the gap in our understanding of ciliate dynamic patterns on a short time scale and identified the potential forcing environmental factors in the high salinity estuarine waters of a subtropical estuary.
Data Availability Statement
The raw data supporting the conclusions of this article will be made available by the authors, without undue reservation.
Author Contributions
BG: formal analysis and writing – original draft. HH and YW: formal analysis. YZ: investigation and formal analysis. RL, LW, JS, and JW: investigation. RZ: writing – review and editing. NJ: writing – review and editing, funding acquisition. DX: conceptualization, formal analysis, writing – review and editing, and supervision. All authors: contributed to the article and approved the submitted version.
Funding
This work was funded by the National Natural Science Foundation of China (Nos. 42188102, 41876142, 42141003, and 41861144018).
Conflict of Interest
The authors declare that the research was conducted in the absence of any commercial or financial relationships that could be construed as a potential conflict of interest.
Publisher’s Note
All claims expressed in this article are solely those of the authors and do not necessarily represent those of their affiliated organizations, or those of the publisher, the editors and the reviewers. Any product that may be evaluated in this article, or claim that may be made by its manufacturer, is not guaranteed or endorsed by the publisher.
Acknowledgments
We thank Chengda Li, Jiezhen Xie, and Tingwei Luo for their help organizing the cruise and sample collection and Xin Liu for his comments on the phytoplankton pigments analysis. We also thank the three reviewers and the editor for their valuable comments and suggestions, which help us improve the manuscript.
Supplementary Material
The Supplementary Material for this article can be found online at: https://www.frontiersin.org/articles/10.3389/fmicb.2022.797638/full#supplementary-material
References
Ansotegui, A., Sarobe, A., Trigueros, J. M., Urrutxurtu, I., and Orive, E. (2003). Size distribution of algal pigments and phytoplankton assemblages in a coastal–estuarine environment: contribution of small eukaryotic algae. J. Plankton Res. 25, 341–355. doi: 10.1093/plankt/25.4.341
Calbet, A., and Landry, M. R. (2004). Phytoplankton growth, microzooplankton grazing, and carbon cycling in marine systems. Limnol. Oceanogr. 49, 51–57. doi: 10.4319/lo.2004.49.1.0051
Campbell, B. J., and Kirchman, D. L. (2013). Bacterial diversity, community structure and potential growth rates along an estuarine salinity gradient. ISME J. 7, 210–220. doi: 10.1038/ismej.2012.93
Chen, X., Wei, W., Wang, J., Li, H., Sun, J., Ma, R., et al. (2019). Tide driven microbial dynamics through virus-host interactions in the estuarine ecosystem. Water Res. 160, 118–129. doi: 10.1016/j.watres.2019.05.051
Chiang, K.-P., Lin, C.-Y., Lee, C.-H., Shiah, F.-K., and Chang, J. (2003). The coupling of oligotrich ciliate populations and hydrography in the East China Sea: spatial and temporal variations. Deep Sea Res. Part II Top. Stud. Oceanogr. 50, 1279–1293. doi: 10.1016/S0967-0645(03)00023-7
Dolan, J. R., Landry, M. R., and Ritchie, M. E. (2013). The species-rich assemblages of tintinnids (marine planktonic protists) are structured by mouth size. ISME J. 7, 1237–1243. doi: 10.1038/ismej.2013.23
Elloumi, J., Carrias, J.-F., Ayadi, H., Sime-Ngando, T., Boukhris, M., and Bouaïn, A. (2006). Composition and distribution of planktonic ciliates from ponds of different salinity in the solar saltwork of Sfax, Tunisia. Estuar. Coast. Shelf Sci. 67, 21–29. doi: 10.1016/j.ecss.2005.10.011
Faust, K., Lahti, L., Gonze, D., de Vos, W. M., and Raes, J. (2015). Metagenomics meets time series analysis: unraveling microbial community dynamics. Curr. Opin. Microbiol. 25, 56–66. doi: 10.1016/j.mib.2015.04.004
Fenchel, T. (2008). The microbial loop – 25 years later. J. Exp. Mar. Biol. Ecol. 366, 99–103. doi: 10.1016/j.jembe.2008.07.013
Furuya, K., and Marumo, R. (1983). The structure of the phytoplankton community in the subsurface chlorophyll maxima in the western North Pacific Ocean. J. Plankton Res. 5, 393–406. doi: 10.1093/plankt/5.3.393
Gong, J., Qing, Y., Zou, S., Fu, R., Su, L., Zhang, X., et al. (2016). Protist-bacteria associations: gammaproteobacteria and alphaproteobacteria are prevalent as digestion-resistant bacteria in ciliated protozoa. Front. Microbiol. 7:498. doi: 10.3389/fmicb.2016.00498
Gonze, D., Coyte, K. Z., Lahti, L., and Faust, K. (2018). Microbial communities as dynamical systems. Curr. Opin. Microbiol. 44, 41–49. doi: 10.1016/j.mib.2018.07.004
Graham, M. H. (2003). Confronting multicollinearity in ecological multiple regression. Ecology 84, 2809–2815. doi: 10.1890/02-3114
Grattepanche, J. D., Santoferrara, L. F., Andrade, J., Oliverio, A. M., McManus, G. B., and Katz, L. A. (2014). Distribution and diversity of oligotrich and choreotrich ciliates assessed by morphology and DGGE in temperate coastal waters. Aquat. Microb. Ecol. 71, 211–234. doi: 10.3354/ame01675
Gu, B., Wang, Y., Xu, J., Jiao, N., and Xu, D. (2021). Water mass shapes the distribution patterns of planktonic ciliates (Alveolata, Ciliophora) in the subtropical Pearl River Estuary. Mar. Pollut. Bull. 167:112341. doi: 10.1016/j.marpolbul.2021.112341
Haraguchi, L., Jakobsen, H. H., Lundholm, N., and Carstensen, J. (2018). Phytoplankton community dynamic: a driver for ciliate trophic strategies. Front. Mar. Sci. 5:272. doi: 10.3389/fmars.2018.00272
Heiss, J. W., and Michael, H. A. (2014). Saltwater-freshwater mixing dynamics in a sandy beach aquifer over tidal, spring-neap, and seasonal cycles. Water Resour. Res. 50, 6747–6766. doi: 10.1002/2014WR015574
Hillebrand, H., Durselen, C. D., Kirschtel, D., Pollingher, U., and Zohary, T. (1999). Biovolume calculation for pelagic and benthic microalgae. J. Phycol. 35, 403–424. doi: 10.1046/j.1529-8817.1999.3520403.x
Hu, A., Hou, L., and Yu, C.-P. (2015). Biogeography of planktonic and benthic Archaeal communities in a subtropical eutrophic estuary of China. Microb. Ecol. 70, 322–335. doi: 10.1007/s00248-015-0597-4
Huang, B., and Hong, H. (1999). Alkaline phosphatase activity and utilization of dissolved organic phosphorus by algae in subtropical coastal waters. Mar. Pollut. Bull. 39, 205–211. doi: 10.1016/S0025-326X(99)00006-5
Huang, B., Hu, J., Xu, H., Cao, Z., and Wang, D. (2010). Phytoplankton community at warm eddies in the northern South China Sea in winter 2003/2004. Deep-Sea Res. Part II. 57, 1792–1798. doi: 10.1016/j.dsr2.2010.04.005
Huang, H., Yang, J., Huang, S., Gu, B., Wang, Y., Wang, L., et al. (2021). Spatial distribution of planktonic ciliates in the western Pacific Ocean: along the transect from Shenzhen (China) to Popnpei (Micronesia). Mar. Life Sci. Technol. 3, 103–115. doi: 10.1007/s42995-020-00075-7
Jiao, N., Herndl, G., Hansell, D., Benner, R., Kattner, G., Wilhelm, S., et al. (2010). Microbial production of recalcitrant dissolved organic matter: long-term carbon storage in the global ocean. Nat. Rev. Microbiol. 8, 593–599. doi: 10.1038/nrmicro2386
Jochem, F. J. (2003). Photo- and heterotrophic pico- and nanoplankton in the Mississippi River plume: distribution and grazing activity. J. Plankton Res. 25, 1201–1214. doi: 10.1093/plankt/fbg087
Khandeparker, L., Eswaran, R., Gardade, L., Kuchi, N., Mapari, K., Naik, S. D., et al. (2017). Elucidation of the tidal influence on bacterial populations in a monsoon influenced estuary through simultaneous observations. Environ. Monit. Assess. 189:41. doi: 10.1007/s10661-016-5687-3
Kong, J., Wang, Y., Warren, A., Huang, B., and Sun, P. (2019). Diversity distribution and assembly mechanisms of planktonic and benthic microeukaryote communities in intertidal zones of southeast Fujian, China. Front. Microbiol. 10:2640. doi: 10.3389/fmicb.2019.02640
Kukkaro, P., and Bamford, D. H. (2009). Virus-host interactions in environments with a wide range of ionic strengths. Environ. Microbiol. Rep. 1, 71–77. doi: 10.1111/j.1758-2229.2008.00007.x
Li, H., Wang, C., Liang, C., Zhao, Y., Zhang, W., Grégori, G., et al. (2019). Diversity and distribution of tintinnid ciliates along salinity gradient in the Pearl River Estuary in southern China. Estuar. Coast. Shelf Sci. 226:106268. doi: 10.1016/j.ecss.2019.106268
Li, Q., Edwards, K. F., Schvarcz, C. R., and Steward, G. F. (2021). Broad phylogenetic and functional diversity among mixotrophic consumers of Prochlorococcus. BioRxiv [Preprint]. doi: 10.1101/2021.08.18.456384
Li, R., Jiao, N., Warren, A., and Xu, D. (2018). Changes in community structure of active protistan assemblages from the lower Pearl River to coastal waters of the South China Sea. Eur. J. Protistol. 63, 72–82. doi: 10.1016/j.ejop.2018.01.004
Loìpez-Abbate, M. C., Molinero, J. C., Perillo, G. M. E., de Cao, M. S. B., Pettigrosso, R. E., Guinder, V. A., et al. (2019). Long-term changes on estuarine ciliates linked with modifications on wind patterns and water turbidity. Mar. Environ. Res. 144, 46–55. doi: 10.1016/j.marenvres.2018.12.001
Mantoura, R. F. C., and Llewellyn, C. A. (1983). The rapid determination of algal chlorophyll and carotenoid pigments and their break down products in natural waters by reverse phase high performance liquid chromatography. Anal. Chim. Acta 121, 297–314. doi: 10.1016/S0003-2670(00)80092-6
Marie, D., Brussaard, C. P. D., Thyrhaug, R., Bratbak, G., and Vaulot, D. (1999). Enumeration of marine viruses in culture and natural samples by flow cytometry. Appl. Environ. Microb. 65, 45–52. doi: 10.1128/AEM.65.1.45-52.1999
Maurice, C. F., Mouillot, D., Bettarel, Y., De Wit, R., Sarmento, H., and Bouvier, T. (2011). Disentangling the relative influence of bacterioplankton phylogeny and metabolism on lysogeny in reservoirs and lagoons. ISME J. 5, 831–842. doi: 10.1038/ismej.2010.181
McManus, G. B., and Fuhrman, J. A. (1986). Photosynthetic pigments in the ciliate Laboea strobila from long Island Sound, USA. J. Plankton Res. 8, 317–327. doi: 10.1093/plankt/8.2.317
Meng, Z., Xu, K., Dai, R., and Warren, A. (2018). Benthic ciliate diversity and community composition along water depth gradients: a comparison between the intertidal and offshore areas. Eur. J. Protistol. 65, 31–41. doi: 10.1016/j.ejop.2018.04.004
Montagnes, D. J. S., and Lynn, D. H. (1987). A quantitative protargol stain (QPS) for ciliates: method description and test of its quantitative nature. Mar. Microb. Food Webs 2, 83–93.
Montagnes, D. J. S., and Lynn, D. H. (1991). Taxonomy of the major groups of marine planktonic ciliates, with emphasis on the aloricate forms. Mar. Microb. Food Webs 5, 59–74.
Oksanen, J., Blanchet, F. G., Kindt, R., Legendre, P., O’hara, R. B., Simpson, G. L., et al. (2010). Vegan: Community Ecology Package. R package version 1.17-4. Available Online at: https://cran.r-project.org/web/packages/vegan/ (accessed January 1, 2010).
Putt, M., and Stoecker, D. K. (1989). An experimentally determined carbon - volume ratio for marine oligotrichous ciliates from estuarine and coastal waters. Limnol. Oceanogr. 34, 1097–1103. doi: 10.4319/lo.1989.34.6.1097
Rosseel, Y. (2012). Lavaan: an R package for structural equation modeling. J. Stat. Softw. 48, 1–36. doi: 10.18637/jss.v048.i02
Santoferrara, L., and Alder, V. (2009). Abundance trends and ecology of planktonic ciliates of the south-western Atlantic (35-63°S): a comparison between neritic and oceanic environments. J. Plankton Res. 31, 837–851. doi: 10.1093/plankt/fbp033
Santoferrara, L. F., Gomez, M. I., and Alder, V. A. (2010). Bathymetric, latitudinal and vertical distribution of protozooplankton in a cold-temperate shelf (southern Patagonian waters) during winter. J. Plankton Res. 33, 457–468. doi: 10.1093/plankt/fbq128
Santoferrara, L. F., Grattepanche, J. D., Katz, L. A., and McManus, G. B. (2016). Patterns and processes in microbial biogeography: do molecules and morphologies give the same answers? ISME J. 10, 1779–1790. doi: 10.1038/ismej.2015.224
Schermelleh-Engel, K., and Moosbrugger, H. (2003). Evaluating the fit of structural equation models: tests of significance and descriptive goodness-of-fit measures. Methods Psychol. Res. 8, 23–74.
Sherr, E. B., and Sherr, B. F. (1987). High rates of consumption of bacteria by pelagic ciliates. Nature 325, 710–711. doi: 10.1038/325710a0
Shipley, B. (2000). A new inferential test for path models based on directed acyclic graphs. Struct. Equ. Modeling 7, 206–218. doi: 10.1207/S15328007SEM0702_4
Stoecker, D. (1999). Mixotrophy among dinoflagellates. J. Eukaryot. Microbiol. 46, 397–401. doi: 10.1111/j.1550-7408.1999.tb04619.x
Stoecker, D. K., and Capuzzo, J. M. (1990). Predation on protozoa - its importance to zooplankton. J. Plankton Res. 12, 891–908. doi: 10.1093/plankt/12.5.891
Strom, S. L., Benner, R., Ziegler, S., and Dagg, M. J. (1997). Planktonic grazers are a potentially important source of marine dissolved organic carbon. Limnol. Oceanogr. 42, 1364–1374. doi: 10.4319/lo.1997.42.6.1364
Strom, S. L., Macri, E. L., and Olson, M. B. (2007). Microzooplankton grazing in the coastal Gulf of Alaska: variations in top-down control of phytoplankton. Limnol. Oceanogr. 52, 1480–1494. doi: 10.4319/lo.2007.52.4.1480
Strüder-Kypke, M. C., and Montagnes, D. J. S. (2002). Development of web-based guides to planktonic protists. Aquat. Microb. Ecol. 27, 203–207. doi: 10.3354/ame027203
Sun, P., Huang, L., Xu, D., Huang, B., Chen, N., and Warren, A. (2017). Marked seasonality and high spatial variation in estuarine ciliates are driven by exchanges between the ‘abundant’ and ‘intermediate’ biospheres. Sci. Rep. 7:9494. doi: 10.1038/s41598-017-10308-y
Sun, P., Huang, L., Xu, D., Warren, A., Huang, B., Wang, Y., et al. (2019). Integrated space-time dataset reveals high diversity and distinct community structure of ciliates in mesopelagic waters of the Northern South China Sea. Front. Microbiol. 10:2178. doi: 10.3389/fmicb.2019.02178
Sun, P., Wang, Y., Laws, E., and Huang, B. (2020). Water mass–driven spatial effects and environmental heterogeneity shape microeukaryote biogeography in a subtropical, hydrographically complex ocean system - a case study of ciliates. Sci. Total Environ. 706:135753. doi: 10.1016/j.scitotenv.2019.135753
Sun, P., Zhang, S., Wang, Y., and Huang, B. (2021). Biogeographic role of the Kuroshio Current intrusion in the microzooplankton community in the boundary zone of the northern South China Sea. Microorganisms 9:1104. doi: 10.3390/microorganisms9051104
Tian, Y., Zheng, T., and Wang, X. (2002). PAHs contamination and PAH-degrading bacteria in Xiamen Western Sea. Chem. Speciat. Bioavailab. 14, 25–33. doi: 10.3184/095422902782775317
Tsai, A.-Y., Gong, G.-C., Chiang, K.-P., Chao, C.-F., and Guo, H.-R. (2011). Long-term (1998–2007) trends on the spatial distribution of heterotrophic ciliates in the East China Sea in summer: effect of the Three Gorges Dam construction. J. Oceanogr. 67, 725–737. doi: 10.1007/s10872-011-0069-5
Van Heukelem, L., and Thomas, C. S. (2001). Computer-assisted high-performance liquid chromatography method development with applications to the isolation and analysis of phytoplankton pigments. J. Chromatogr. 10, 31–49. doi: 10.1016/S0378-4347(00)00603-4
Wang, Y., Liu, Y., Wang, J., Luo, T., Zhang, R., Sun, J., et al. (2019). Seasonal dynamics of bacterial communities in the surface seawater around subtropical Xiamen Island, China, as determined by 16S rRNA gene profiling. Mar. Pollut. Bull. 142, 135–144. doi: 10.1016/j.marpolbul.2019.03.035
Wei, W., Wang, N., Cai, L., Zhang, C., Jiao, N., and Zhang, R. (2019). Impacts of freshwater and seawater mixing on the production and decay of virioplankton in a subtropical estuary. Microb. Ecol. 78, 843–854. doi: 10.1007/s00248-019-01362-2
Worden, A., Follows, M. J., Giovannoni, S. J., Wilken, S., Zimmerman, A. E., and Keeling, P. J. (2015). Rethinking the marine carbon cycle: factoring in the multifarious lifestyles of microbes. Science 347:1257594. doi: 10.1126/science.1257594
Xia, X., Guo, W., Tan, S., and Liu, H. (2017). Synechococcus assemblages across the salinity gradient in a salt wedge estuary. Front. Microbiol. 8:1254. doi: 10.3389/fmicb.2017.01254
Xu, D., Warren, A., and Song, W. (2009). “Oligotrichs,” in Free-Living Ciliates in the Bohai and Yellow Seas, China, eds W. Song, A. Warren, and X. Hu (Beijing: Science Press), 307–351.
Yan, X., Zhai, W., Hong, H., Li, Y., Guo, W., and Huang, X. (2012). Distribution, fluxes and decadal changes of nutrients in the Jiulong River Estuary, Southwest Taiwan Strait. Chin. Sci. Bull. 57, 2307–2318. doi: 10.1007/s11434-012-5084-4
Yang, J., Huang, S., Fan, W., Warren, A., Jiao, N., and Xu, D. (2020). Spatial distribution patterns of planktonic ciliate communities in the East China Sea: potential indicators of water masses. Mar. Pollut. Bull. 156:111253. doi: 10.1016/j.marpolbul.2020.111253
Zhang, X., Shi, Z., Ye, F., Zeng, Y., and Huang, X. (2013). Picophytoplankton abundance and distribution in three contrasting periods in the Pearl River Estuary, South China. Mar. Freshw. Res. 64, 692–705. doi: 10.1071/MF12303
Zhao, F., Filker, S., Xu, K., Huang, P., and Zheng, S. (2017). Patterns and drivers of vertical distribution of the ciliate community from the surface to the abyssopelagic zone in the western Pacific Ocean. Front. Microbiol. 8:2559. doi: 10.3389/fmicb.2017.02559
Keywords: community composition, time series, temporal changes, quantitative protargol stain, microzooplankton
Citation: Gu B, Huang H, Zhang Y, Li R, Wang L, Wang Y, Sun J, Wang J, Zhang R, Jiao N and Xu D (2022) High Dynamics of Ciliate Community Revealed via Short-Term, High-Frequency Sampling in a Subtropical Estuarine Ecosystem. Front. Microbiol. 13:797638. doi: 10.3389/fmicb.2022.797638
Received: 19 October 2021; Accepted: 13 January 2022;
Published: 07 February 2022.
Edited by:
Francesco Pomati, Swiss Federal Institute of Aquatic Science and Technology, SwitzerlandReviewed by:
O. Roger Anderson, Lamont-Doherty Earth Observatory (LDEO), United StatesLydie Herfort, Independent Researcher, Oregon, OR, United States
Xiaoli Zhang, Yantai Institute of Coastal Zone Research, Chinese Academy of Sciences (CAS), China
Copyright © 2022 Gu, Huang, Zhang, Li, Wang, Wang, Sun, Wang, Zhang, Jiao and Xu. This is an open-access article distributed under the terms of the Creative Commons Attribution License (CC BY). The use, distribution or reproduction in other forums is permitted, provided the original author(s) and the copyright owner(s) are credited and that the original publication in this journal is cited, in accordance with accepted academic practice. No use, distribution or reproduction is permitted which does not comply with these terms.
*Correspondence: Dapeng Xu, ZGFwZW5neHVAeG11LmVkdS5jbg==