 Steven J. Hall
 Wenjuan Huang1
 Stephanie A. Napieralski
 Eric Roden
- 1Department of Ecology, Evolution and Organismal Biology, Iowa State University, Ames, IA, United States
- 2Department of Geoscience, University of Wisconsin-Madison, Madison, WI, United States
Periodic oxygen (O2) limitation in humid terrestrial soils likely influences microbial composition, but whether communities share similar responses in disparate environments remains unclear. To test if specific microbial taxa share consistent responses to anoxia in radically different soils, we incubated a rainforest Oxisol and cropland Mollisol under cyclic, time-varying anoxic/oxic cycles in the laboratory. Both soils are known to experience anoxic periods of days to weeks under field conditions; our incubation treatments consisted of anoxic periods of 0, 2, 4, 8, or 12 d followed by 4 d of oxic conditions, repeated for a total of 384 d. Taxa measured by 16S rRNA gene sequences after 48 d and 384 d of experimental treatments varied strongly with increasing anoxic period duration, and responses to anoxia often differed between soils at multiple taxonomic levels. Only 19% of the 30,356 operational taxonomic units (OTUs) occurred in both soils, and most OTUs did not respond consistently to O2 treatments. However, the OTUs present in both soils were disproportionally abundant, comprising 50% of sequences, and they often had a similar response to anoxic period duration in both soils (p < 0.0001). Overall, 67 OTUs, 36 families, 15 orders, 10 classes, and two phyla had significant and directionally consistent (positive or negative) responses to anoxic period duration in both soils. Prominent OTUs and taxonomic groups increasing with anoxic period duration in both soils included actinomycetes (Micromonosporaceae), numerous Ruminococcaceae, possible metal reducers (Anaeromyxobacter) or oxidizers (Candidatus Koribacter), methanogens (Methanomicrobia), and methanotrophs (Methylocystaceae). OTUs decreasing with anoxic duration in both soils included nitrifiers (Nitrospira) and ubiquitous unidentified Bradyrhizobiaceae and Micromonosporaceae. Even within the same genus, different OTUs occasionally showed strong positive or negative responses to anoxic duration (e.g., Dactylosporangium in the Actinobacteria), highlighting a potential for adaptation or niche partitioning in variable-O2 environments. Overall, brief anoxic periods impacted the abundance of certain microbial taxa in predictable ways, suggesting that microbial community data may partially reflect and integrate spatiotemporal differences in O2 availability within and among soils.
Introduction
Surface soils of humid biomes experience variation in oxygen (O2) availability over multiple spatial and temporal scales. The existence of mm-scale anoxic microsites within well-drained bulk oxic soils has been known for decades (Sexstone et al., 1985; von Fischer and Hedin, 2002). The anoxic soil volume varies over time as a function of physical O2 supply, labile carbon (C) availability, and biological O2 demand (Keiluweit et al., 2016). For instance, O2 in the pores of surface soils may vary from atmospheric levels to below detection over timescales of days to weeks to months (Silver et al., 1999; Liptzin et al., 2011; Hall et al., 2013; Huang and Hall, 2017; O’Connell et al., 2018). Availability of O2 has been proposed as one of the most important factors structuring soil microbial community composition (Fierer, 2017), as implied by differences in oxidoreductase genes among habitats (Ramírez-Flandes et al., 2019). Indeed, field measurements demonstrated that proxies for O2 may predict spatial or depth variation in microbial community composition within individual sites (Peralta et al., 2014; Lipson et al., 2015). An increasing number of studies has explicitly investigated the impact of temporal O2 variation over timescales of hours to weeks on microbial community composition, but responses of particular microbial groups or taxa are often difficult to generalize among studies (Pett-Ridge and Firestone, 2005; DeAngelis et al., 2010; Frindte et al., 2016; Mejia et al., 2016; Randle-Boggis et al., 2018; Winkler et al., 2019; Pronk et al., 2020). These differences raise the question of whether microbial communities or individual microbial taxa from disparate soils might share consistent responses to time-varying anoxic conditions, or whether differences in other soil characteristics, such as pH, organic matter availability, mineralogy, or other site-specific factors might override the effects of anoxia. Diverse terrestrial soils appear to share a core group of common and widespread bacterial taxa, which vary in abundance among habitats as a function of pH, aridity, and plant productivity (Delgado-Baquerizo et al., 2018). Similarly, temporal variation in O2 availability might also drive consistent responses in the relative abundance of core bacterial groups across diverse habitats.
Cyclic anoxic events may influence microbial community composition by maintaining generalist taxa tolerant of both aerobic and anaerobic conditions, and the relative abundance of these taxa might reflect the redox history of a given soil. In fact, previous experiments suggested that the microbial community composition of soils that routinely experience high-frequency (hours–days) O2 variability may respond little to short-term anoxic events because of adaptation to O2 fluctuations. In tropical rainforest soils, experimental 4-d anoxic/oxic fluctuations maintained bacterial composition most similar to in-situ communities, whereas communities from static oxic or anoxic treatments diverged (Pett-Ridge and Firestone, 2005; DeAngelis et al., 2010). More taxa were active under fluctuating than static redox treatments, indicating that redox variability could maintain diversity (DeAngelis et al., 2010). However, community change might be expected to occur if the duration of anoxic or oxic events exceeds the capacity of sensitive organisms to persist through unfavorable conditions (Pett-Ridge and Firestone, 2005). Bacterial communities incubated under 5-week anoxic/1-week oxic cycles for 1 y diverged from initial conditions in one rice paddy soil but not another (Winkler et al., 2019). Bacteria exposed to 4-week drained and flooded cycles in a synthetic soil did not differ from a static control (Pronk et al., 2020), but repeated 2-week flooding events altered pasture soil communities (Randle-Boggis et al., 2018). Overall, responses of soil microbial communities to experimental manipulations of O2 availability have been mixed, and it is not clear whether community responses to cyclic anoxic events of increasing duration are generally consistent within or among soils.
More broadly, we lack an understanding of whether consistent groups of microbial taxa share responses to short-term anoxic periods across disparate environments. Anoxic sewage digestors from disparate locations shared a core suite of microbes (Rivière et al., 2009), but to our knowledge, a suite of common and abundant bacteria correlated with periodic O2 deficiency in soil has not been identified. While there is increasing evidence that even closely related microbes may respond differently to environmental factors (e.g., Bier et al., 2015; García-García et al., 2019; Yu et al., 2021), some habitat preferences and functional attributes may remain conserved at relatively high taxonomic rank (Fierer et al., 2007; Philippot et al., 2010). Indeed, we might expect this reasoning to apply for O2 availability, given its central role as an electron acceptor for some organisms and toxin for others. For example, nitrifiers in phylum Nitrospirae require O2 for nitrite oxidation (Koch et al., 2015), whereas methanogens in phylum Euryarchaeota are thought to be strict anaerobes (Whitman et al., 2014). Nevertheless, taxa within these groups might differ in their sensitivity to O2. Nitrifiers may persist after months of anoxia (Pett-Ridge et al., 2006), possibly by exploiting alternative metabolisms (Koch et al., 2015), and methanogens may persist even in desert soils (Peters and Conrad, 1995). Members of some higher-level taxonomic groups clearly differ in their O2 requirements: for example, Actinobacteria comprise many aerobic organisms that decompose lignocellulose, but others are facultative or perhaps obligate anaerobes (Wellington and Toth, 1994; Barka et al., 2016). These findings highlight uncertainty about which microbial groups might respond most strongly to variation in soil O2 availability, and over what timescales.
As a proof of concept to test how microbes may respond to cyclic anoxic events of differing duration (days–weeks) in greatly contrasting habitats, we conducted laboratory experiments with two terrestrial soils: a tropical rainforest Oxisol and a temperate cropland Mollisol. These soils were chosen because they both experience anoxic events of days to weeks under field conditions as a consequence of high clay content, carbon availability, and episodically high moisture. They also differ greatly in key properties (Table 1) such as pH, mineralogy, climate, and vegetation (Huang et al., 2020b, 2021). To quantify relationships between O2 availability and community composition, we exposed soils to repeated anoxic/oxic cycles with anoxic periods of 0, 2, 4, 8, or 12 d, each of which was followed by a consistent 4-d oxic period; these cycles were repeated for a total of 384 d (Figure 1). The anoxic period durations were chosen to bracket a range of anoxic events that may occur in these soils following precipitation or ponding events, or periods of C influx from litterfall or tillage, as evidenced by measurements of moisture, O2, Eh, and/or redox-sensitive iron species (Silver et al., 1999; Hall et al., 2013; Huang and Hall, 2017; Barcellos et al., 2018; O’Connell et al., 2018; Martin et al., 2019; Yu et al., 2021). The experiment was conducted over 384 d to allow greater capacity to detect effects which might otherwise be obscured by legacies of recent environmental conditions at the time of soil sampling.
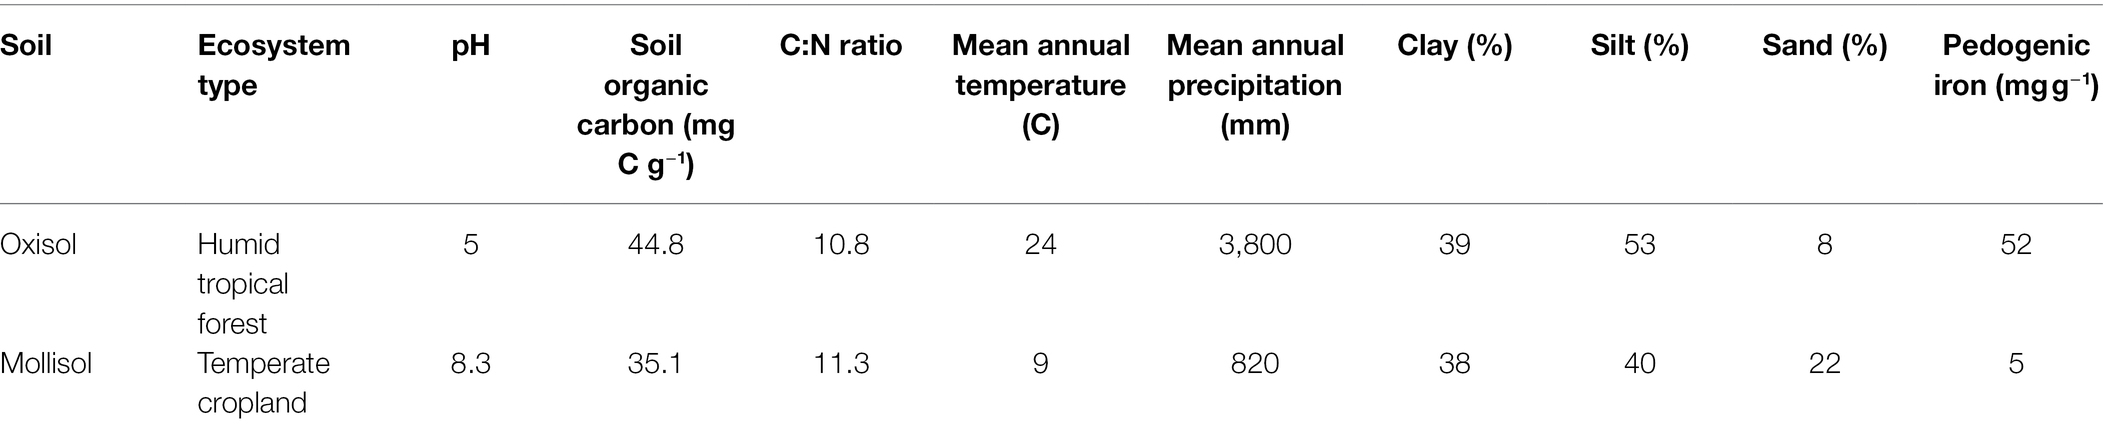
Table 1. Key attributes of soils used in this experiment.
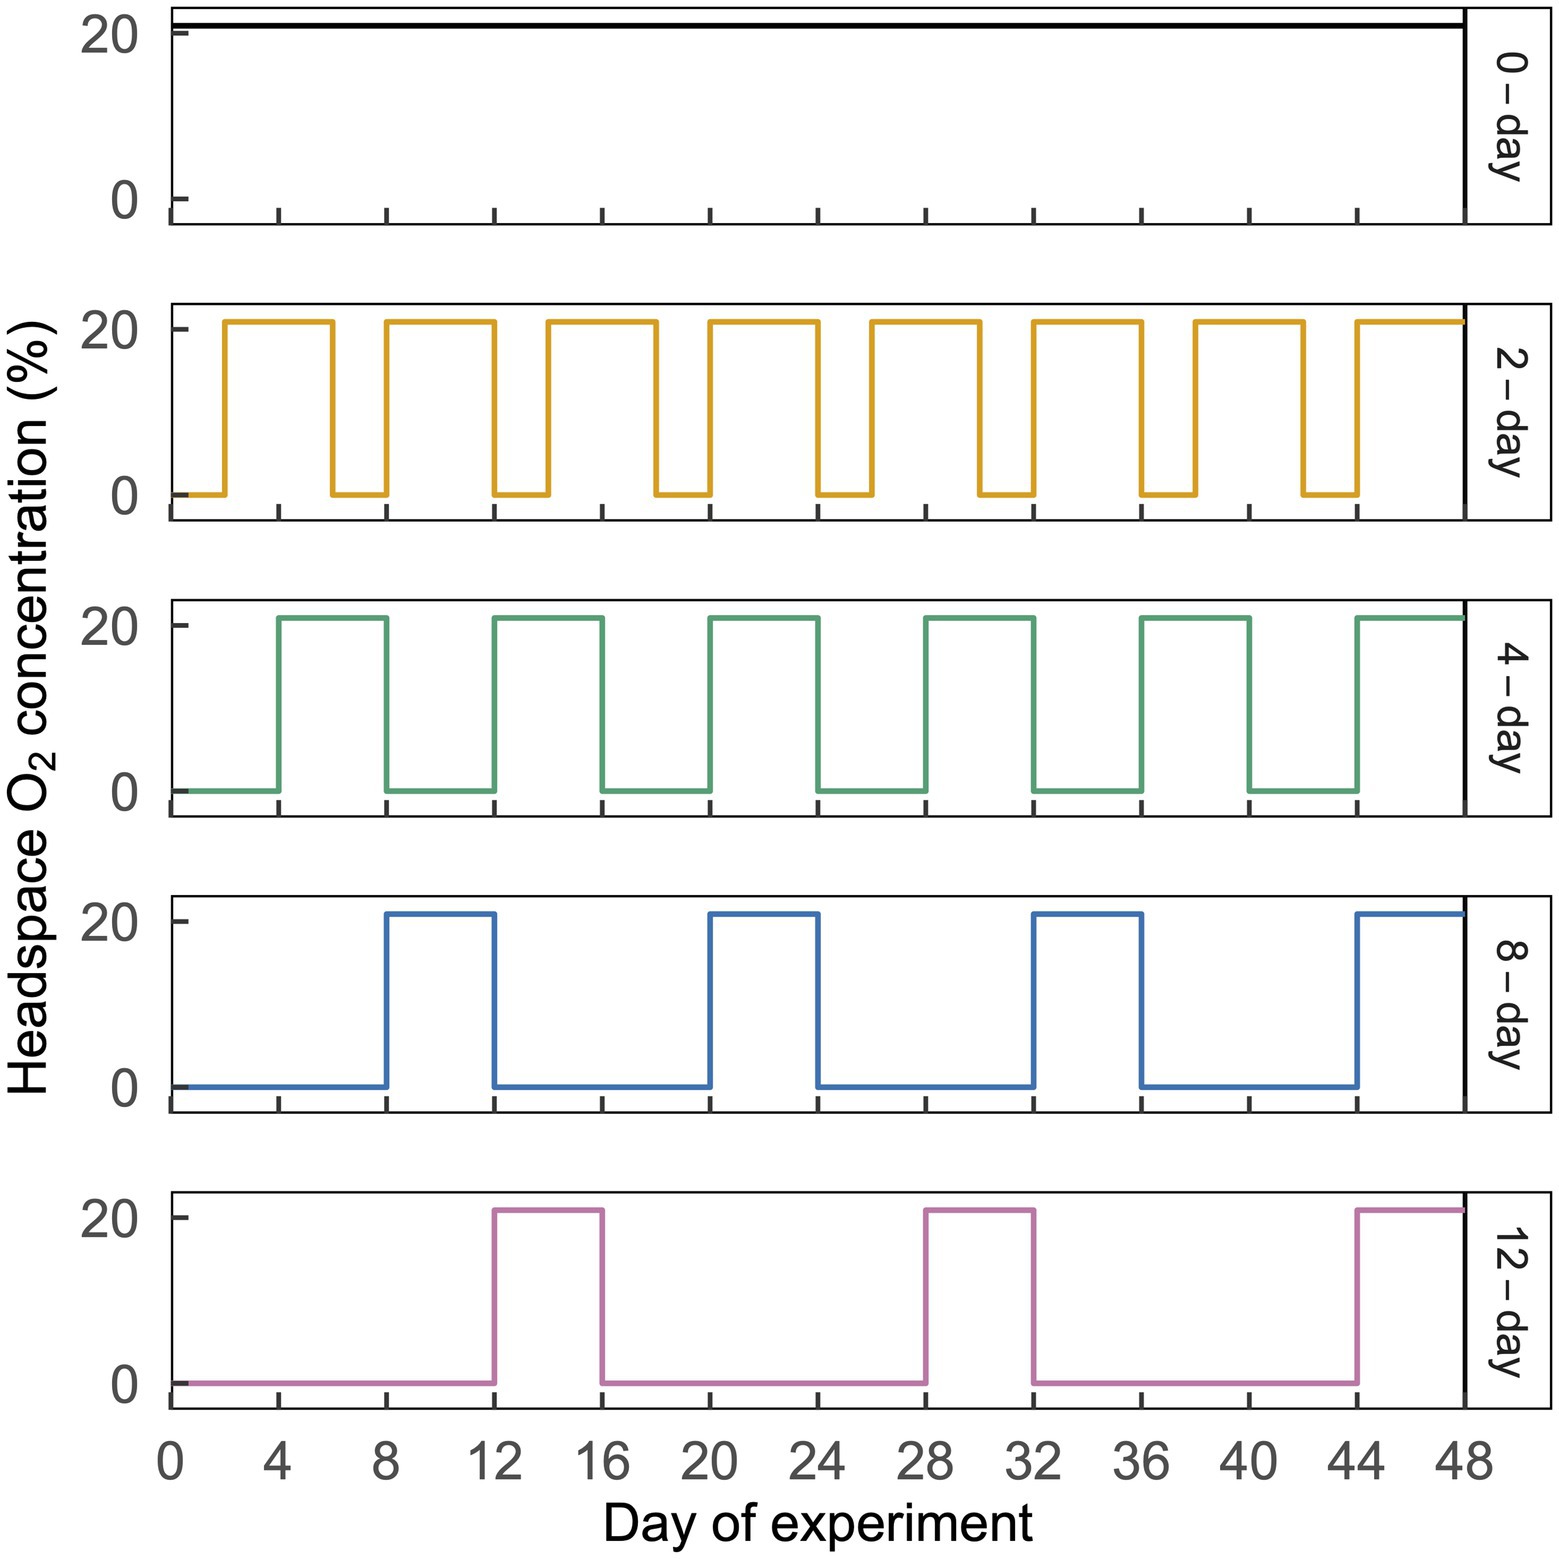
Figure 1. Illustration of the cyclic time-varying O2 treatments imposed in this study. Headspace O2 concentration is shown on the left y-axis and treatment names are shown on the right y-axis, with line colors corresponding to the ordinations in Figure 3. Each treatment is shown in a separate horizontal panel. The 2-day, 4-day, 8-day, and 12-day treatments received an N2 headspace for a period of 2, 4, 8, or 12 d, which was followed by 4 d of CO2-free air. A representative 48-d time period is shown above; this same pattern was repeated a total of eight times over 384 d. This figure is modified from Huang et al. (2021).
Biogeochemical data from this experiment were published previously in a paper where we tested impacts of cyclic anoxic conditions on organic matter decomposition and the representation of these processes in a mechanistic ecosystem C-cycling model (Huang et al., 2021). Here, we report microbial community data from the same experiment to understand how periodic anoxic conditions impacted microbial community composition in these soils. Biological replicates were destructively sampled for DNA extraction and sequencing of the 16S rRNA region after 0, 48, and 384 d. We analyzed DNA rather than RNA because we sought to characterize the time-integrated responses of communities to the experimental treatments (including dormant, active, and recently deceased organisms) as opposed to short-term changes in activity, which we would expect to vary markedly within an individual treatment over a single oxic/anoxic cycle (DeAngelis et al., 2010; Blazewicz et al., 2013). We hypothesized (1) that community composition would change predictably as a function of increasing anoxic period duration, and (2) that a core group of taxa would respond similarly to anoxic period duration in both soils.
Materials and Methods
Experimental Design
The rainforest Oxisol was sampled from a per-humid lower montane site in the Luquillo Experimental Forest, Puerto Rico, and the cropland Mollisol was sampled from a central Iowa field under long-term corn/soybean (Zea mays/Glycine max) cultivation. General properties of these soils are listed in Table 1 and were further described in a companion study (Huang et al., 2021). Replicates from each soil were subjected to each of five headspace treatments, consisting of anoxic periods of 0, 2, 4, 8, or 12 d, each followed by a 4-d oxic period; these cycles were repeated for the duration of the experiment (384 d). The total number of anoxic/oxic cycles varied among treatments according to the length of the anoxic phase. There was a total of 64, 48, 32, or 24 cycles for the 2-day, 4-day, 8-day, or 12-day treatments.
Each experimental replicate comprised 5 g soil (dry mass equivalent, amended with water to field capacity) incubated inside a separate glass jar (0.95 l) with a gas-tight aluminum lid sealed with a Viton gasket and two butyl septa for headspace flushing and venting as described below. Field moisture capacity measured 1.01 g H2O and 0.46 g H2O per g dry soil for the Oxisol and Mollisol, respectively (Huang et al., 2020b). Because labile C may gradually become depleted during soil incubations (Chacon et al., 2006), we amended soils with ground litter at the beginning of the experiment to simulate a C-rich surface soil microsite. Each replicate of each soil was amended with 0.5 g of dried and ground aboveground litter from Andropogon gerardii (a perennial C4 grass) to ameliorate short-term C limitation and to simulate conditions that prevail in C-rich surface soil microsites. This plant was not present in either of these soils prior to the experiment.
Anoxic or oxic treatments were imposed by manually replacing the jar headspace with humidified dinitrogen gas (N2) or humidified CO2-free air, respectively, at 2-d intervals throughout the experiment. We chose to directly manipulate headspace O2 content, rather than controlling O2 availability indirectly via soil moisture, to achieve a more precise temporal gradient of O2 availability independent of changes in moisture (McNicol and Silver, 2014). There is a substantial literature on responses of soil microbial communities to dry/wet cycles (e.g., Placella et al., 2012) that is not directly relevant to this study, because anoxic conditions are not necessarily achieved following wet-up of dry soils, and because traits related to drought tolerance/resuscitation may not be directly relevant to O2 dynamics in soils from humid climates. Gas was flushed through each jar at >500 ml min−1 for 15 min via a distribution manifold connected to each jar by piercing a septum with a needle; jars were vented through a separate needle placed through the other septum. Needles were removed and jars were left sealed for 2 d, at which point the headspace gas was subsampled by syringe for CO2 and CH4 measurements (Huang et al., 2021), and jars were flushed again with the appropriate gas (N2 or CO2-free air). The logistical requirements of the headspace flushing regime limited the number of sacrificial replicates which could be included in the experiment. Water vapor lost during flushing was measured gravimetrically and periodically replenished at the end of an oxic period. The ratio of soil mass to headspace volume was chosen so that CO2 concentrations were always <6,000 ppm during oxic treatment phases. Analyses of CO2 in control jars (no soil) indicated that leaks were negligible. Mass balance indicates that any dissolved porewater O2 present during the oxic periods would be rapidly depleted by respiration during the anoxic periods. Porewater saturated with O2 at 23°C at 300 m (8.3 mg O2 L−1) contains 0.11–0.26 μmol O2 per g dry soil mass equivalent, given the moisture values listed above. Given observed mean CO2 + CH4 emissions of 3.3 μmol C g−1 d−1 (Huang et al., 2021), any remaining porewater O2 would be depleted within minutes to hours after the jar headspace was flushed with N2. Increased CH4 production following flushing with N2 (Huang et al., 2021) also indicates that anoxic conditions were achieved.
During the incubation, CO2 and CH4 production declined slowly over time in all treatments as available C was depleted (Huang et al., 2021). At the end of the experiment, CO2 + CH4 production was several-fold lower than at the beginning of the experiment, but an asymptote in cumulative decomposition was not observed, and analyses of the masses and isotope composition of cumulative CO2 and CH4 emissions showed that more than half of the added litter C and > 85% of the initial soil C remained (Huang et al., 2021). 13C NMR analyses indicated that much of this remaining C was contained in carbohydrates, and that C molecular composition was similar among treatments (Huang et al., 2020b, 2021). The sum of organic C decomposed to CO2 and CH4 was statistically equivalent among many of the headspace treatments and differed by <20% among all treatments from a given soil type (Huang et al., 2021). Therefore, we propose that differences in C availability per se were not likely to be the primary drivers of changes in community composition among headspace treatments.
Data Analysis
We extracted genomic DNA from replicate subsamples after 0, 48, and 384 d (n = 3, 3, or 5, respectively per soil/headspace treatment; Supplementary Table S2) using MoBio Powersoil extraction kits (Maryland, United States). More replicates were available for analysis at 384 d than at the other timepoints because all of the replicates used for gas flux analysis (Huang et al., 2021) were sacrificed at that point; at 0 and 48 d, separate replicates not used for gas measurements were used for DNA analysis. Replicates were each incubated in separate jars. DNA was submitted to the University of Wisconsin-Madison Biotechnology Center for Illumina MiSeq 2×300 paired end sequencing of the V4 region of 16S rRNA; methodological details are described in the Supplementary Material. Raw sequences were deposited in the NCBI Sequence Read Archive under accession PRJNA693044. Sequences were processed with Quantitative Insights in Microbial Ecology (QIIME) 1.9.1 (Caporaso et al., 2010b). Prior to assembly of paired end sequences, low quality and ambiguous sequences were removed using the default QIIME parameters. Chimeric sequences were identified via de novo and reference based detection using usearch61 (Edgar, 2010). Operational taxonomic units (OTUs) were identified by de novo clustering (0.97 threshold) and were aligned against the SILVA database (Quast et al., 2013) using PyNAST (Caporaso et al., 2010a) to assign taxonomy.
Sequencing depth varied from 34,382 to 54,902 reads (median = 44,081) and two samples with <30,000 reads were discarded prior to subsequent analyses (Supplementary Table S2). Read counts did not vary systematically among headspace treatments, soils, or timepoints. We identified 40,345 OTUs in the initial dataset, which was used for calculation of diversity metrics prior to trimming rare taxa (McMurdie and Holmes, 2013). For community analyses, we discarded OTUs occurring in <3 samples and normalized counts by relative abundance. We conducted community analyses in R using phyloseq (McMurdie and Holmes, 2013) 1.28.0 and vegan 2.5.5 (Oksanen et al., 2019). We used distance-based redundancy analysis ordination using the “capscale” function with sampling date and anoxic duration as numeric predictors and tested their significance by permutation. To test responses of individual taxonomic groups to anoxic duration, we used differential expression analysis based on the negative binomial distribution implemented with DESeq2 1.24 (Love et al., 2014), correcting values of p for multiple comparisons using the Benjamini and Hochberg method. In separate DESeq analyses, we used OTUs, families, orders, classes, and phyla as response variables. Anoxic duration was coded as a continuous numeric predictor (regression design) such that the response of each OTU indicates the mean log2-fold change per day of anoxic duration. To test whether microbial groups had shared responses to anoxic duration in both soils, we coded direction of response (increase or decrease) of log2-fold change values for shared groups across different taxonomic levels, and used chi-squared tests to assess whether the overall direction of treatment response was significantly shared between soils at a given taxonomic level.
The replicates extracted for DNA at 384 d were also used for CO2 and CH4 measurements throughout the experiment (Huang et al., 2021), enabling us to assess relationships between cumulative CO2 and CH4 production and 16S composition at 384 d after accounting for headspace treatments and soil type. We used a permutational multivariate ANOVA on a Bray-Curtis distance matrix, with cumulative CO2, cumulative CH4, headspace treatment, and soil type as predictor variables. This analysis was conducted using the “adonis2” function in vegan 2.5.5 (Oksanen et al., 2019); we report the marginal effect of each model term.
Results
Community Responses to Anoxic Duration
As expected, the Oxisol and Mollisol differed substantially in microbial composition at the phylum level (Figure 2A) and especially at the family level (Supplementary Figure S1). Of the 30,356 OTUs observed in >2 samples, 5,732 occurred in both soils, and 2,292 of these shared OTUs occurred in >2 samples from each soil. These shared OTUs were disproportionately abundant, comprising 36–66% (mean 50%) of sequences among soils, treatments, and timepoints (Figure 2B). Because soil type was the dominant factor influencing microbial community composition and obscured the effects of headspace treatments when all data were analyzed together, we first conducted separate ordinations for each soil to examine anoxic treatment impacts. Community composition varied predictably with anoxic duration and sampling date in both soils; these variables were strongly correlated with the first and second axes of the ordination, respectively (adjusted R2 = 0.45 and 0.47 for the Oxisol and Mollisol, respectively; p < 0.001 for anoxic duration and sampling date; Figures 3A,B). After 48 d, samples with shorter anoxic duration (0-day and 2-day treatments) remained clustered in ordination space near pre-treatment samples, whereas samples with increasingly longer anoxic duration diverged along the second ordination axis (Figures 3A,B). After 384 d, samples from all treatments shifted along the first axis but remained separated along the second axis according to anoxic duration (Figures 3A,B). A similar pattern was evident in a combined ordination of samples from both soil types which included only OTUs shared between the soils (Figure 3C). Samples separated along axes that were correlated with anoxic treatment duration and sampling date, albeit with lower R2 than in the separate ordinations (adjusted R2 = 0.13, p < 0.001 for sampling date and p = 0.006 for anoxic duration; Figure 3C).
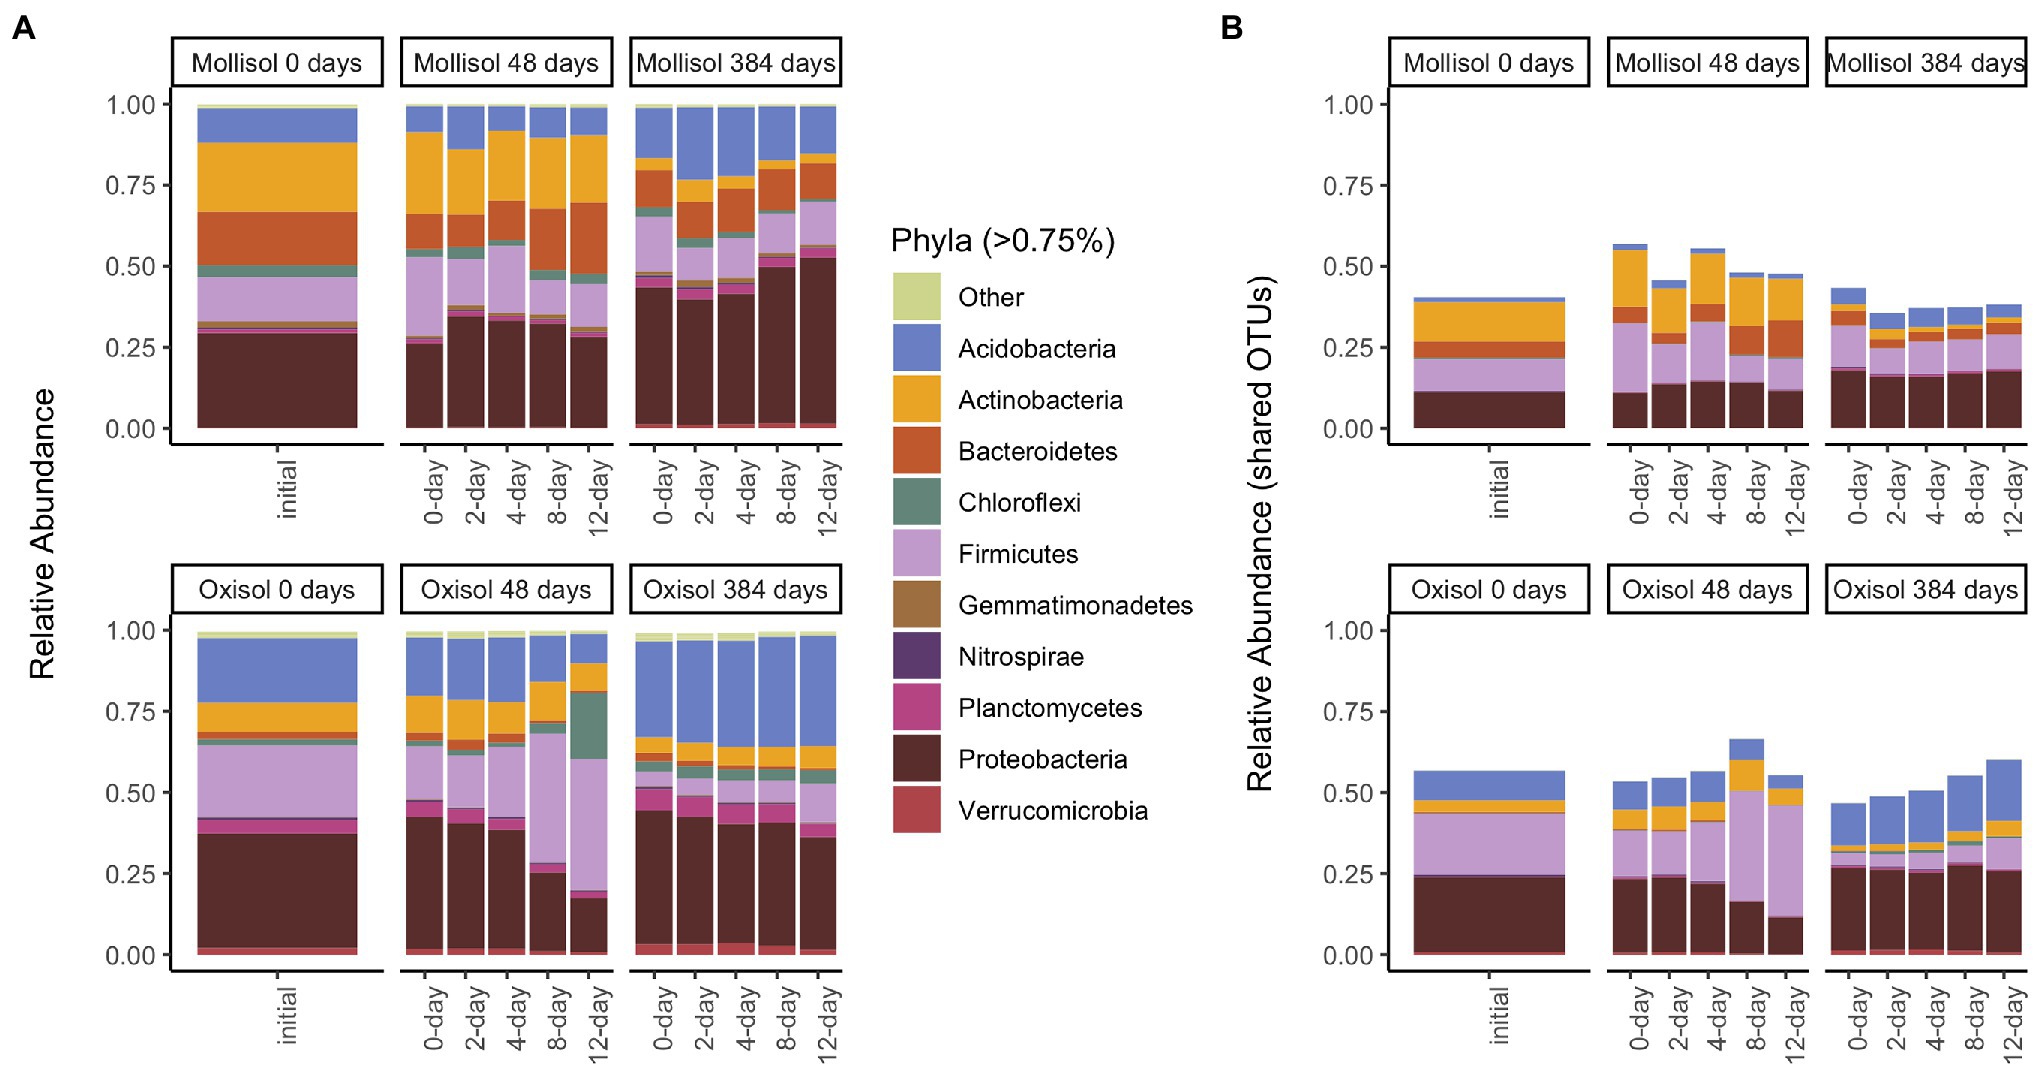
Figure 2. Mean sequence relative abundance shaded by phylum and plotted by experimental treatment and sampling date, including all OTUs (A), or only OTUs that occurred in >2 samples in both soils (B). Phyla comprising >0.75% of sequences in a given treatment are labeled (33 additional phyla are denoted “Other”). Panels represent sampling timepoints for each soil (0, 48, and 384 d), and bars within a panel represent means of headspace treatments (0, 2, 4, 8, or 12 d of anoxic conditions alternating with 4 d of oxic conditions).
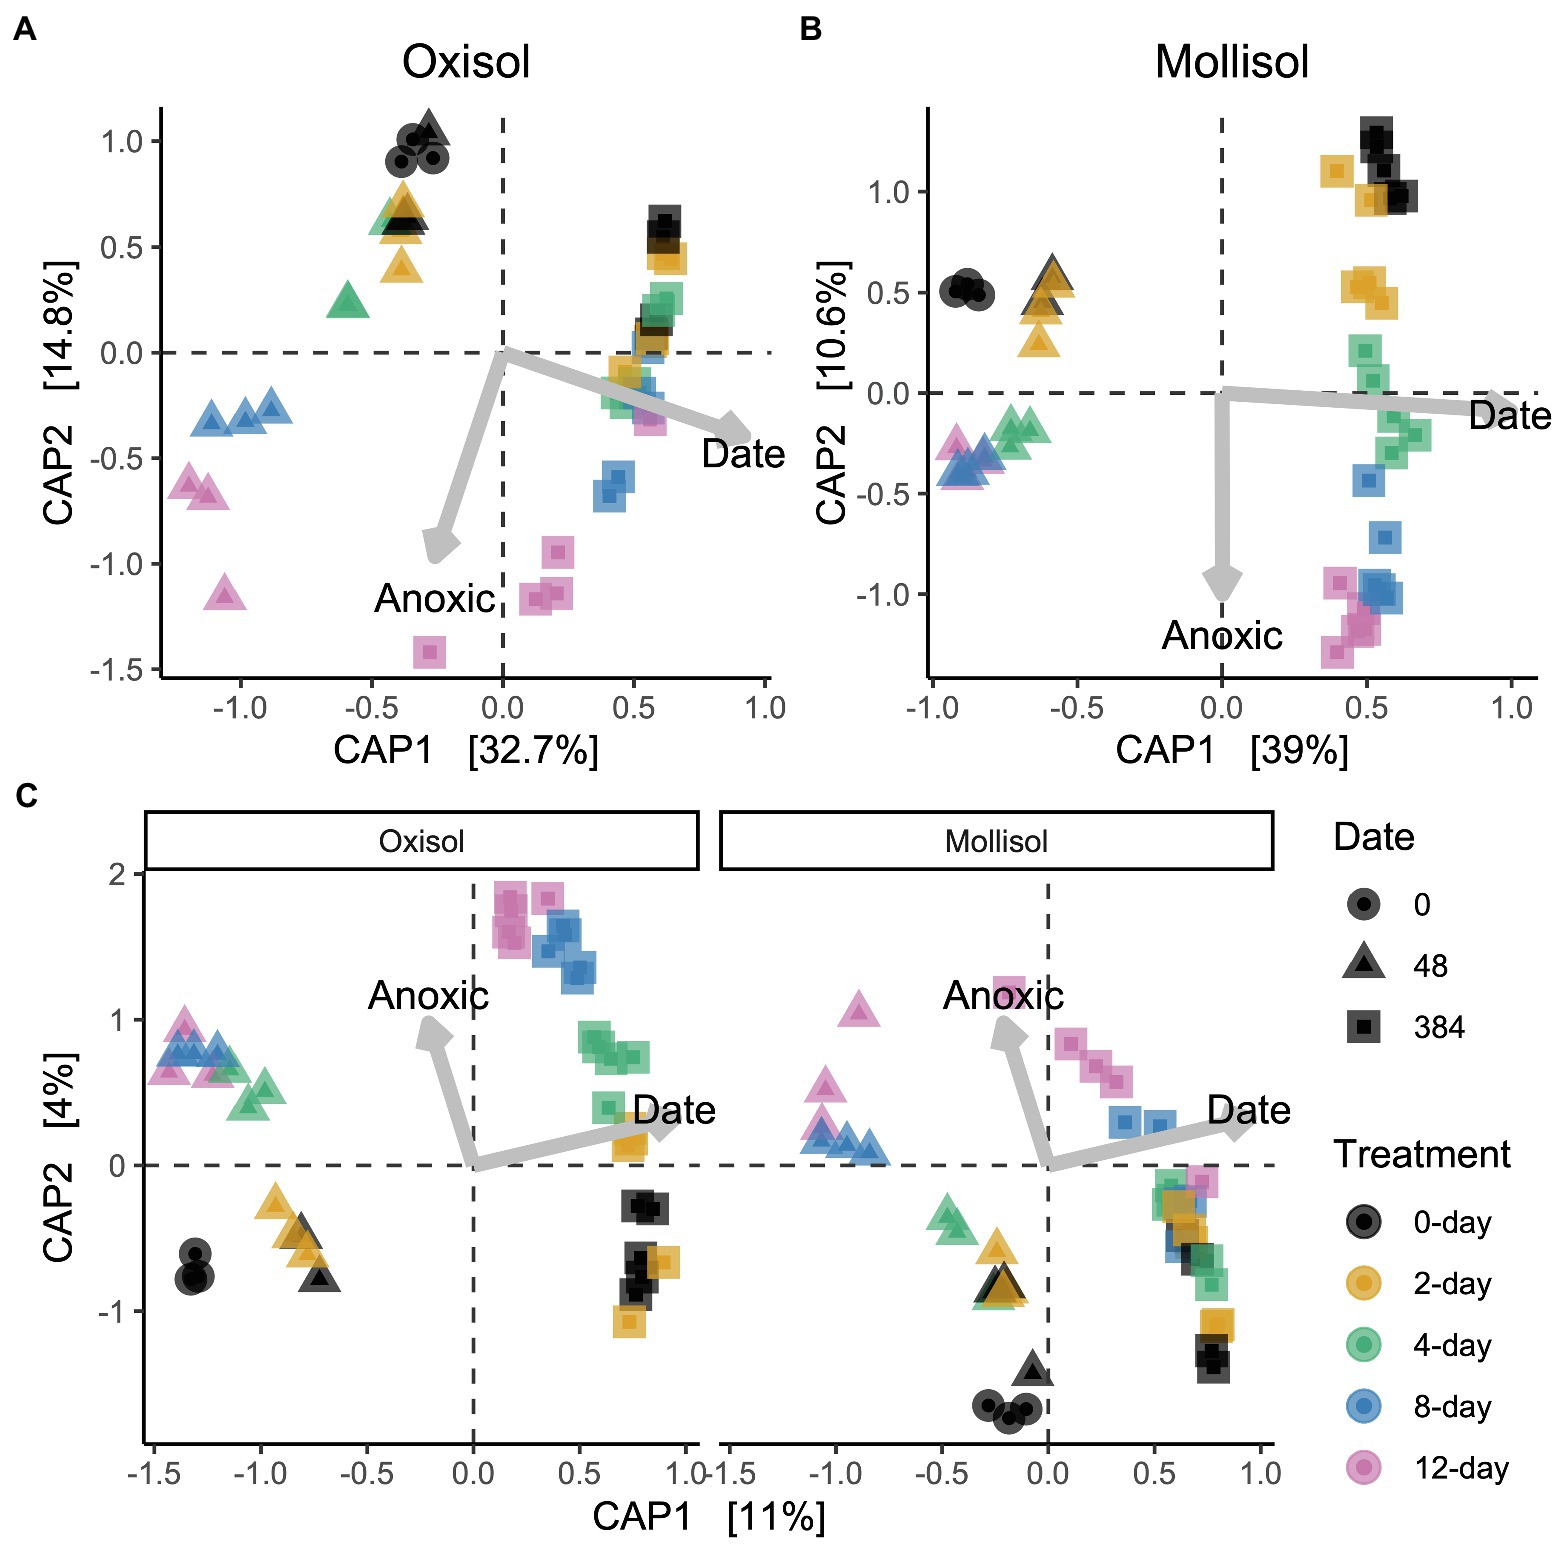
Figure 3. Distance-based redundancy analysis (dbRDA) ordinations of microbial communities in the Oxisol (A) or Mollisol (B), and a combined ordination with data from both soils, where only OTUs present in both are included (C), and soils are shown in separate panels for clarity (axis scores for the left and right panels of (C) are for the same ordination). CAP1 and CAP2 denote the first and second axes of the dbRDA ordination and values in brackets indicate variation explained by each axis. Scale values indicate correlation coefficients of numerical predictors (sampling date and anoxic treatment duration) with the respective axis.
The permutational multivariate ANOVA of the entire microbial community dataset measured after 384 d similarly indicated that soil type was the dominant predictor (R2 = 0.40, p < 0.0001), with a secondary role for anoxic treatment duration (R2 = 0.03, p = 0.005). After accounting for these variables, there were relatively weak relationships between community composition and cumulative CH4 production (R2 = 0.02, p = 0.02) and cumulative CO2 production (R2 = 0.01, p = 0.13). However, within individual soils, slightly stronger relationships emerged between community composition and C flux data. Cumulative CO2, cumulative CH4, and anoxic treatment duration had relatively similar marginal relationships to community composition in the Oxisol (R2 = 0.08, p = 0.01; R2 = 0.10, p = 0.003; R2 = 0.08, p = 0.01) and in the Mollisol (R2 = 0.07, p = 0.02; R2 = 0.09, p = 0.005; R2 = 0.14, p = 0.0002).
Consistency of Responses to Anoxic Duration Among Taxonomic Groups
The consistency of response of shared microbial groups to anoxic duration varied across taxonomic levels. At levels of phylum, class, and order, there was no significant overall shared response to anoxic duration in both soils. That is, increases or decreases in particular groups at these taxonomic levels as a function of anoxic duration were not shared between soils as indicated by pairwise comparisons of log2-fold change values (calculated by differential expression analysis) or by chi-squared tests for a similar direction of response (Supplementary Figure S2). However, we did observe a weakly significant anoxic response among shared families (p = 0.02, chi-squared test; Supplementary Figure S2D) and a strongly consistent anoxic response for shared OTUs (Figure 4). There were 88 combinations of OTUs and sampling dates where significant responses to anoxic duration occured in both soils (Figure 4), and 71 displayed a consistent positive or negative anoxic response in both soils—much greater than expected under the null hypothesis of independence (p < 0.0001, chi-squared test). Of these 71 OTU/sampling date combinations, 4 OTUs had significant responses to anoxic duration in both soils at both dates (48 and 384 d), such that 67 unique OTUs displayed consistent and significant responses to anoxic duration in both soils during our experiment (Supplementary Data Sheet S1). These OTUs were also disproportionately abundant, with six-fold greater (0.027%) median relative abundance than the other OTUs (0.0044%) in a given sample, considering all sequences measured at 48 d and 384 d (p < 0.0001). Considering all shared OTUs, log2-fold change values for anoxic duration response were also significantly correlated between soils (Figure 4; regression statistics are shown in the caption).
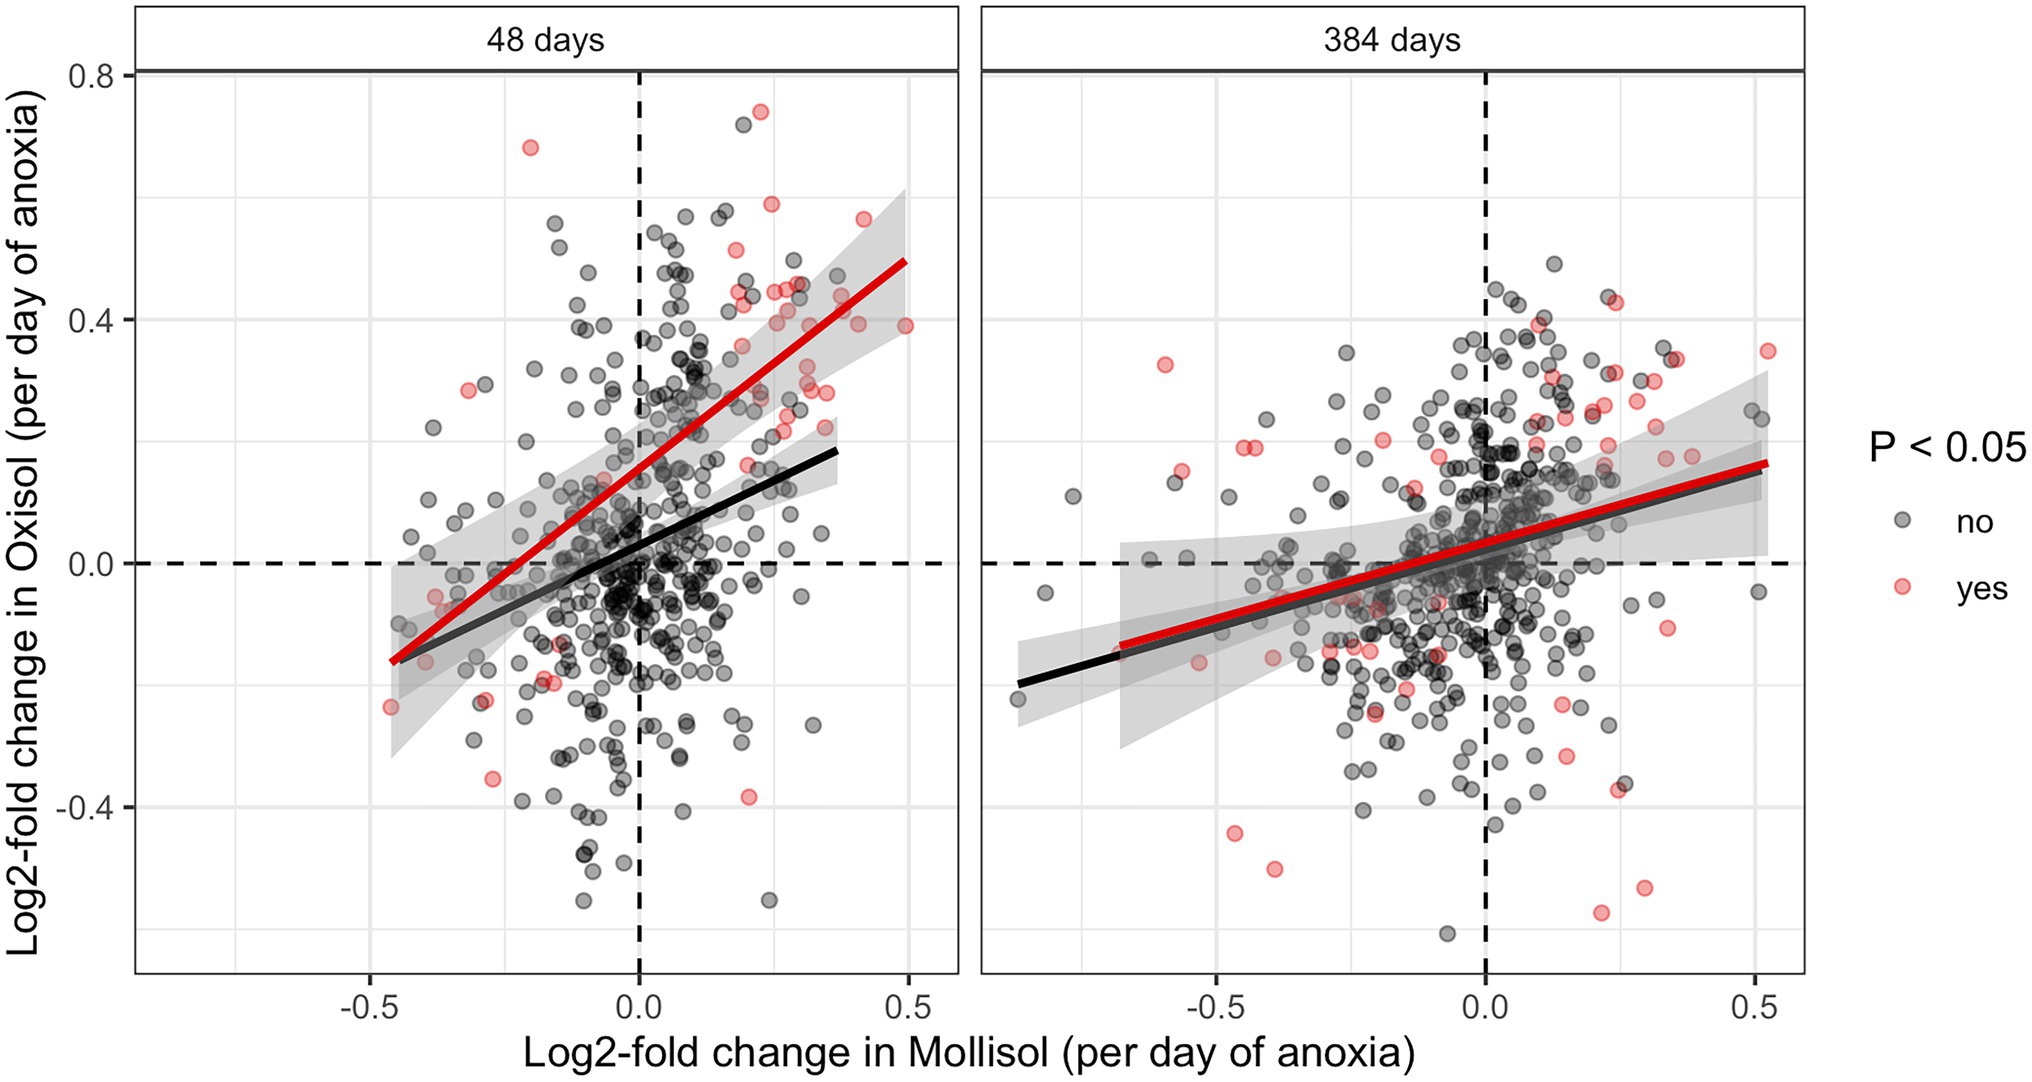
Figure 4. Pairwise comparisons of log2-fold change values calculated by DESeq for OTUs shared in both soils at 48 d or 384 d. Axis units are log2-fold change per day of anoxic period, so an OTU with a value of 0.083 d−1 would have an estimated log2-fold change of 1 in the 12-day anoxic treatment relative to the 0-day anoxic treatment (i.e., it doubled vs. the 0-day treatment). OTUs with statistically significant increases or decreases in both soils are shaded red (denoted “yes” in the legend); OTUs without a statistically significant change are shown in black (denoted “no” in the legend). Regressions including significant or non-significant OTUs are indicated by red and black lines, respectively (the former approach is more conservative; the latter is shown for completeness). The R2 and p values are as follows: 48 d, significant OTUs (R2 = 0.46, p < 0.0001); 48 d, non-significant OTUs (R2 = 0.09, p < 0.0001); 384 d, significant OTUs (R2 = 0.08, p = 0.05); 384 d, non-significant OTUs (R2 = 0.08 p < 0.0001).
Responses of Individual Taxonomic Groups to Anoxic Duration
Although many taxonomic groups did not show a consistent response to anoxic duration in both soils, many other groups did respond to anoxic duration in one soil at either 48 d or 384 d. Overall, sequences belonging to a group with a significant anoxic response accounted for 58% (phylum), 53% (class), 44% (order), 49% (family), and 34% (OTU) of sequences (Figure 5A; Supplementary Table S1). However, consistency of response of particular taxonomic groups to anoxic duration varied greatly between soils and over time. For example, the phylum Bacteroidetes increased with anoxic duration in the Mollisol but decreased in the Oxisol after 48 d, whereas Firmicutes showed no response in the Mollisol but strongly increased in the Oxisol (Figure 2). The responses of individual OTUs within these phyla generally corresponded to the phylum as a whole (Supplementary Figure S3). However, in contrast to the more abundant phyla, Nitrospirae and Euryarcheaota did respond strongly and consistently to anoxic duration in both soils after 384 d (decreasing and increasing, respectively; Supplementary Data Sheet S1). The Euryarcheaota that we detected in these soils were largely methanogens (class Methanomicrobia; Supplementary Figure S4).
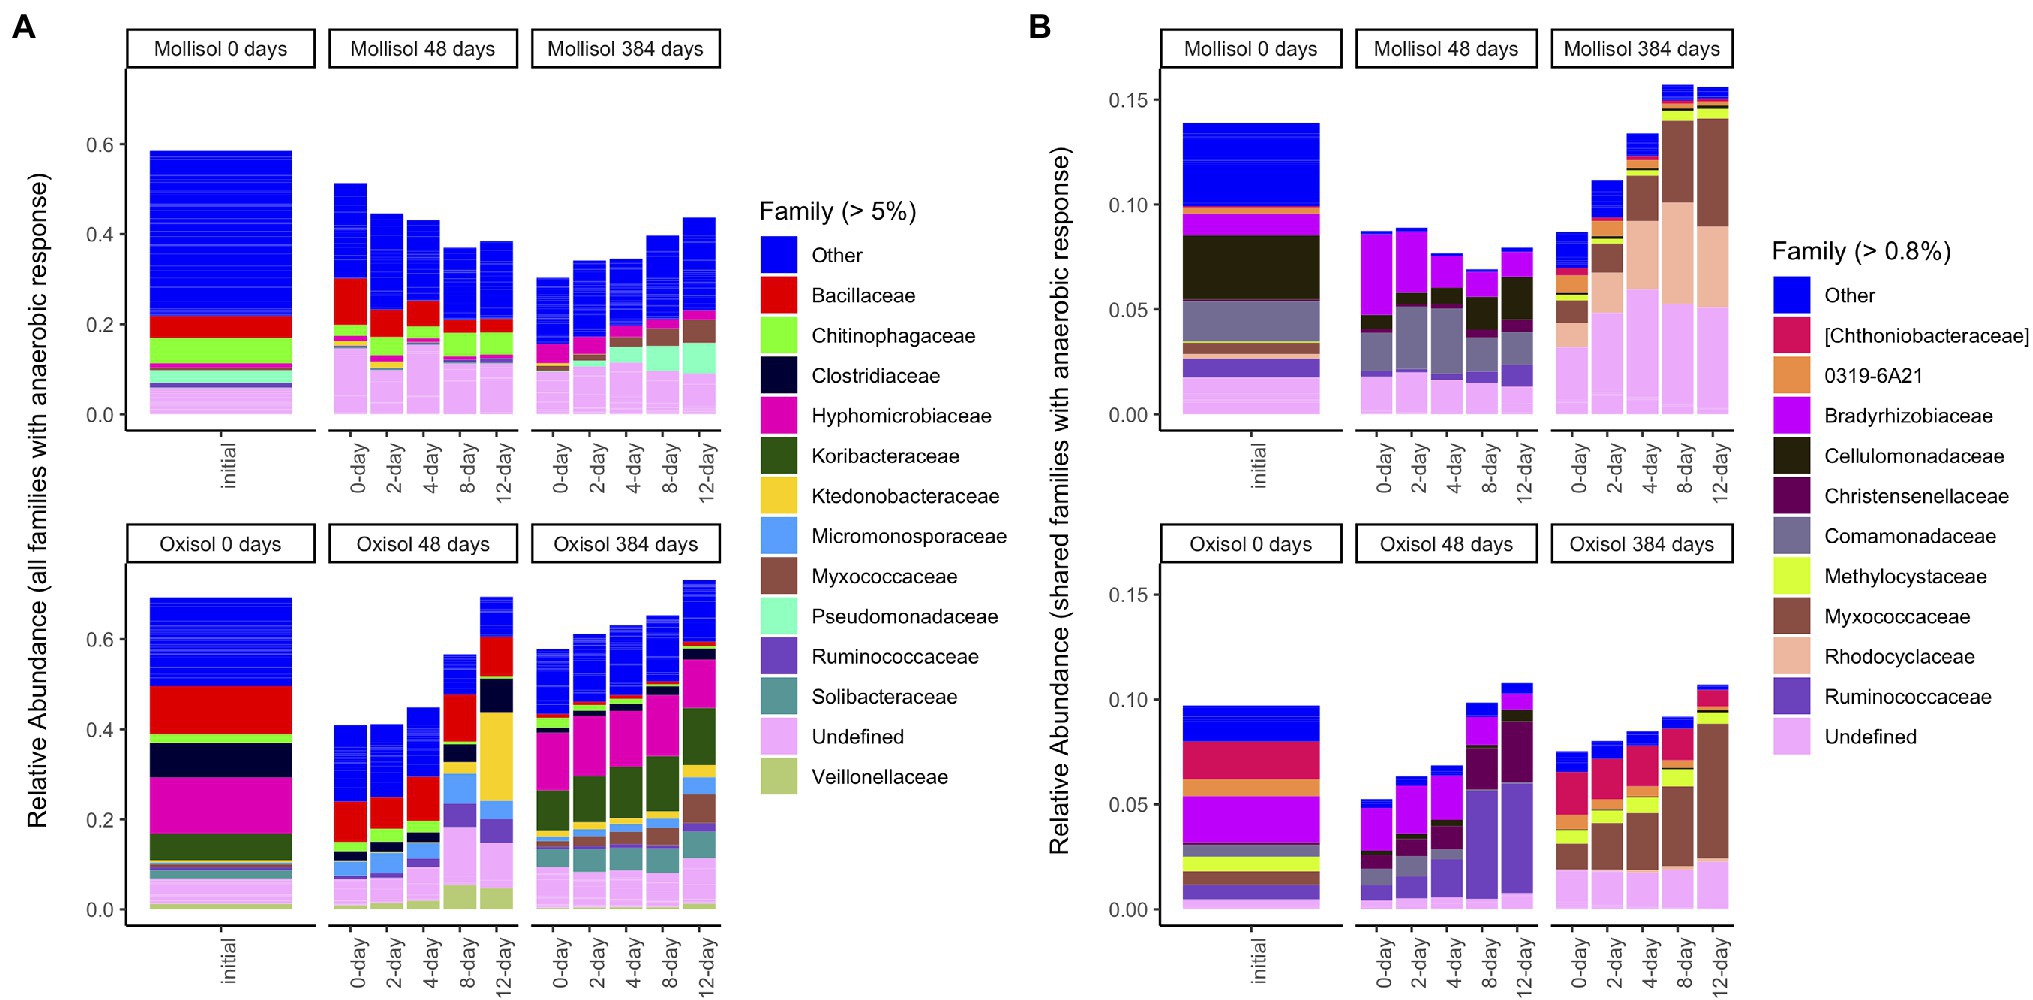
Figure 5. Mean sequence relative abundance by treatment, including all families that significantly responded to anoxic duration in a given soil/sampling date (A), or only families with a significant response to anoxic duration that was consistent in both soils on a given date (B). For clarity, only families comprising >5% (A) or 0.8% (B) of total sequences are labeled (other families are grouped as “Other”); un-named families are labeled as “Undefined.” Barplots of the initial (0-day) samples in (B) include sequences from families that responded significantly to anoxic duration after either 48 d or 384 d in the respective soil. Bars within a panel represent headspace treatment means (0, 2, 4, 8, or 12 d of anoxic conditions alternating with 4 d of oxic conditions).
Similar to the phylum level, responses to anoxic duration at the levels of class and order were also generally inconsistent between soils, with several exceptions (Supplementary Data Sheet S1). The class OPB41 (Actinobacteria) increased with anoxic duration in both soils after 48 d and 384 d, Anaerolineae increased after 48 d, and Solibacteres and Deltaproteobacteria increased after 384 d. Chthonomonadetes, Gemm-1 (Gemmatimonadetes), PAUC37f (Acidobacteria), and OM190 (Planctomycetes) decreased with anoxic duration in both soils after 384 d. No orders responded consistently to anoxic duration after 48 d, but 15 responded after 384 d. In particular, orders belonging to different classes of Proteobacteria had consistent responses of differing direction: Rhodocyclales and Myxococcales increased with anoxic duration whereas Rhodobacterales, Entotheonellales, and HTCC2188 decreased. Overall, classes with consistent responses to anoxic duration in both soils comprised 0.1–1.3% (mean 0.5%) of sequences after 48 d, increasing to 11.6–22.3% (mean 15.2%) after 384 d, while orders comprised 14.1–21.1% (mean 17.8%) after 384 d (Supplementary Table S1).
Families with a consistent response to anoxic duration had generally similar relative abundances at both 48 d and 384 d, comprising 5–16% (mean 9%) of sequences (Figure 4B; Supplementary Table S1; Supplementary Data Sheet S1). Two families responded consistently to anoxic duration in both soils at both timepoints: an unnamed family in Solibacterales decreased while Cellulomonadaceae increased. After 48 d, several families in Proteobacteria decreased with anoxic duration in both soils (Bradyrhizobiaceae, Comamonadaceae, Haliangiaceae, Coxiellaceae), whereas several families in Clostridiales increased (Christensenellaceae, Peptococcaceae, Ruminococcaceae). Of these families, only Bradyrhizobiaceae had similar relative abundance in both soils after 48 d; the other families tended to be much more abundant in one soil than the other (Figure 5B). After 384 d, several unnamed families in Planctomycetes decreased with anoxic duration in both soils, while families within Acidobacteria, Actinobacteria, and Proteobacteria showed both positive and negative responses. For example, within the Alphaproteobacteria, Methylocystaceae increased with anoxic duration while Hyphomonadaceae decreased. Of the relatively abundant families (> 0.8% of sequences) that responded consistently after 384 d, three had approximately similar relative abundances in both soils: Myxococcaceae, Methylocystaceae, and 0319-6A21, a family in the Nitrospirales (Figure 5B).
OTUs with consistent responses to anoxic duration in both soils comprised a smaller proportion of total sequences than observed at the other taxonomic levels (1–8%, mean 4%), but responses between soils were more likely to be consistent for a given OTU (Figure 4). Four OTUs (two each in Micromonosporaceae and Bradyrhizobiaceae) decreased significantly with anoxic duration in both soils at both sampling dates, with log2-fold change values of −0.2 d−1 to −0.7 d−1 (Supplementary Data Sheet S1). These OTUs also had relatively similar mean abundances in the static oxic (0-day) treatment in both soils at both timepoints (0.01–0.04% of sequences). Of the many other OTUs that showed consistent responses to anoxic duration in both soils at either 48 d or 384 d, most belonged to the groups discussed above (Supplementary Figure S5; Supplementary Data Sheet S1). Several OTUs with a strong anoxic response in both soils were at least occasionally abundant, comprising >1% of sequences in a given sample. These included multiple OTUs in the genus Dactylosporangium (Actinobacteria, Micromonosporaceae) which responded positively, as well as in Anaeromyxobacter (Deltaproteobacteria, Myxococcaceae), Candidatus Koribacter (Acidobacteria, Koribacteraceae), and Ruminococcaceae. Three abundant Sinobacteraceae OTUs decreased with anoxic duration. OTUs from the Fe-reducing genus Geobacter showed a mixed response to anoxic duration (positive in the Mollisol and negative in the Oxisol), while OTUs from the putative Fe-reducing genus Pelosinus increased significantly with anoxic duration only in the Oxisol.
Diversity and Evenness Responses to Anoxic Duration
Inverse Simpson and Shannon Index values did not show consistent trends with anoxic duration throughout the experiment (Figure 6). In the Mollisol, inverse Simpson and Shannon Index values did not vary consistently with anoxic duration after 48 d. In the Oxisol, both indices decreased with anoxic duration after 48 d (p < 0.0001, linear regression), but the decreases were most pronounced in the 8- and 12-day anoxic treatments. After 384 d, inverse Simpson and Shannon Index values significantly (p < 0.05, linear regression) declined with anoxic treatment duration in both soils. However, in the Mollisol, indices actually tended to be higher in the 2- and 4-day anoxic treatments than the 0-d treatment (i.e., oxic control), and only declined consistently under the 8- and 12-day treatments. Similarly, in the Oxisol, these indices also tended to have similar values among the 0-, 2-, and 4-day treatments, and were only markedly lower in the 8- and 12-day treatments (Figure 6).
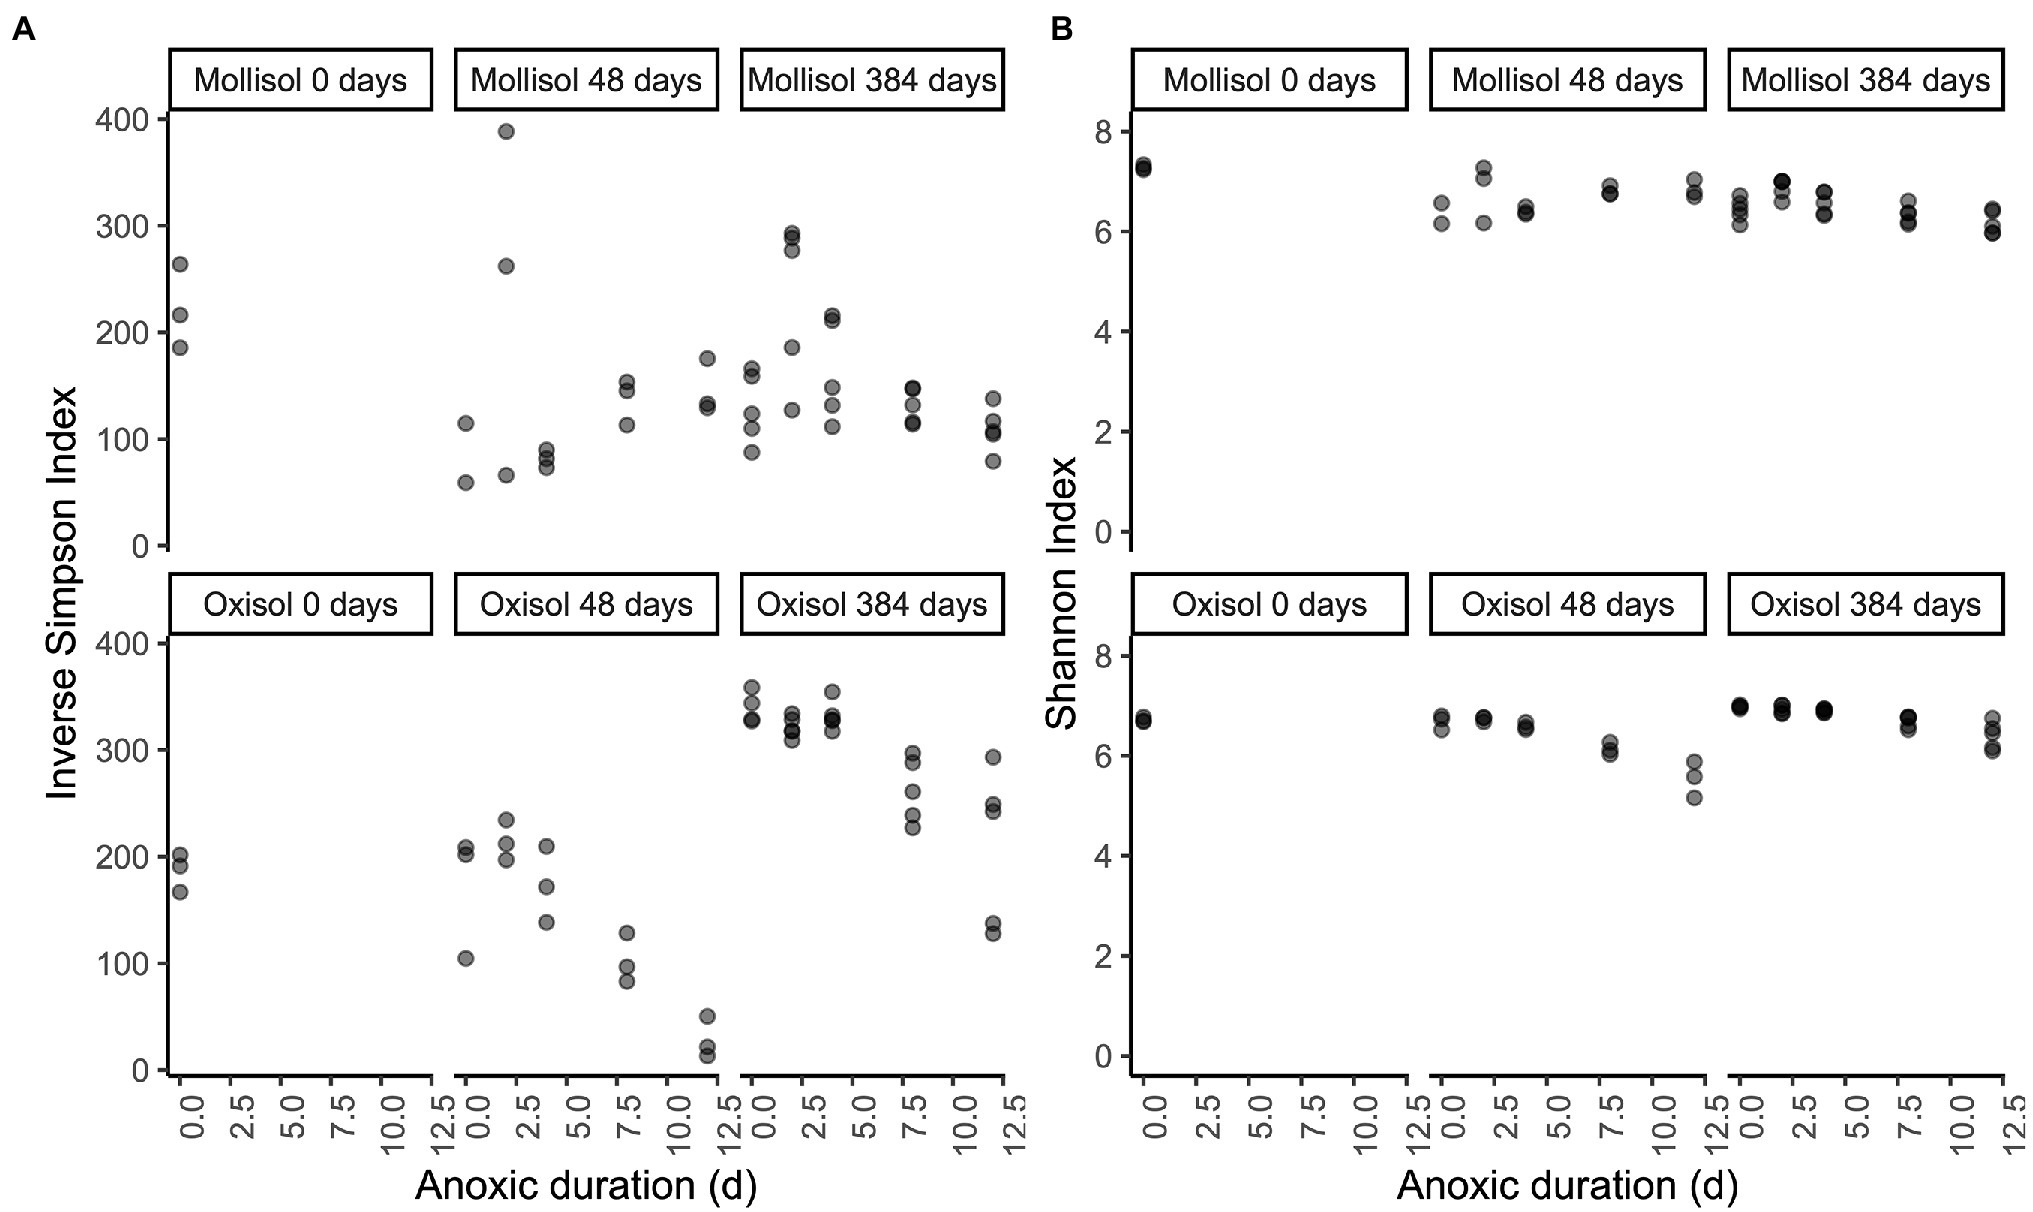
Figure 6. Inverse Simpson (A) and Shannon (B) diversity indices plotted by soil type and treatment. The x-axis indicates the duration of the anoxic period, plotted as a numeric variable (d). Panels represent sampling timepoints for each soil (0, 48, and 384 d), and x-axis values within a panel indicate the duration of the cyclic anoxic headspace treatment (0, 2, 4, 8, or 12 d of anoxic conditions alternating with 4 d of oxic conditions).
Discussion
Supporting our first hypothesis, we found that both soils displayed large directional shifts in microbial community composition at multiple levels of taxonomic resolution when exposed to cyclic anoxic periods of increasing duration. Partially contradicting our second hypothesis, taxonomic groups occurring in both soils often responded differently to increased anoxic duration, particularly at coarse taxonomic resolution. However, in partial support of our second hypothesis, shared OTUs that did respond to anoxic duration had a strong tendency to respond in similar directions in both soils, and these 67 OTUs became disproportionately abundant during the experiment. Although the distinctly different initial communities in these two soils responded to O2 limitation in different ways, communities in both soils did vary systematically with increasing anoxic duration, and a core group of redox-sensitive taxa responded similarly even in the radically different environments (Table 1) of our rainforest Oxisol and cropland Mollisol.
Systematic Community Responses to Anoxic Duration
A number of previous experiments have assessed impacts of fluctuating oxic/anoxic conditions on microbial community composition (Pett-Ridge and Firestone, 2005; DeAngelis et al., 2010; Frindte et al., 2016; Mejia et al., 2016; Randle-Boggis et al., 2018; Winkler et al., 2019; Pronk et al., 2020) but it was often difficult to discern whether increasing the relative durations of anoxic vs. oxic periods caused systematic changes, and whether these differences were sustained over time. Here, our treatments corresponded to cumulative anoxic durations of 0, 33, 50, 66, and 75% of the experiment. We found directional shifts in community composition at the level of OTUs (Figure 3) and in coarser taxonomic groups (Figures 1, 4) in both soils as anoxic period duration increased from 0 to 12 d. Temporal changes across all treatments were even larger than the effects of anoxic duration (Figure 3) and were likely influenced by gradual decreases in C availability and changes in C molecular composition over time (Huang et al., 2021), given the strong linkages between microbial composition and decomposition rate observed elsewhere (Fierer et al., 2007). Notably, however, the magnitude of community change with increasing anoxic duration was similar in both soils (Figure 3), and it persisted at both timepoints despite the large temporal change in community composition over the course of the 384-d experiment. This finding suggests that a generalizable imprint of periodic anoxia on microbial community composition, manifested by taxon relative abundance or perhaps taxon presence, might be detectable across diverse soils, even if it has a smaller overall effect than other controlling factors such as pH (Delgado-Baquerizo et al., 2018).
Groups and Taxa That Consistently Responded to Anoxia
When high-level taxonomic groups responded to anoxic duration, responses generally differed between soils (Figure 2; Supplementary Figure S2) with a few notable exceptions. Consistent with their known physiologies, nitrifiers in the phylum Nitrospirae and methanogens in the class Methanomicrobia showed strong negative and positive relationships with anoxic duration, respectively, in both soils. Soil Nitrospirae also declined following a 6-week anaerobic disinfestation treatment (van Agtmaal et al., 2015); our results showed that even brief but periodic O2 deprivation can suppress these organisms in favor of anaerobes. The presence of Methanomicrobia in most soils and treatments (Supplementary Figure S4) implied that these organisms could either tolerate periodic O2 incursions or that anoxic microsites persisted throughout the experiment, consistent with observations of reduced Fe in all treatments (Huang et al., 2021) and gross methane production observed from other soils in oxic environments (von Fischer and Hedin, 2002). Putative aerobic methane-oxidizers (Methylocystaceae) also increased with anoxic treatment duration, implying that benefits of increased methane availability during the oxic periods outweighed stress during the anoxic period, possibly due to use of alternative metabolic pathways or formation of resting stages (Knief, 2019).
The general lack of consistent phylum-level responses to anoxic duration between soils resulted from contrasting responses of nested taxonomic groups, many of which did respond similarly in both soils. In particular, multiple Actinobacteria subgroups showed consistent positive or negative responses to anoxic duration. The uncultured class OPB41 strongly increased with anoxic duration in both soils at both timepoints, and elsewhere this class co-occurred with methanogens in iron-rich aquatic environments (in’t Zandt et al., 2019) and in coal beds (Kirk et al., 2015). The Actinobacteria family Micromonosporaceae was highly sensitive to anoxic duration, and several OTUs showed consistent increasing or decreasing responses in both soils. The genus Dactylosporangium even contained multiple OTUs with differing anoxic responses (positive or negative) that were consistent in both soils. This putatively slow-growing genus was found to be abundant in hypoxic but not oxygenated lake water, possibly because of increased competitive ability under hypoxic conditions (de Menezes et al., 2012). The consistent sensitivity of these Actinobacteria classes, families, genera, and OTUs to anoxic duration across our two contrasting soils highlights the possible ecological importance of this group and its potential utility as an indicator of soil redox history.
Similar to the Actinobacteria, the Acidobacteria also showed strong but occasionally differing responses to anoxic duration at multiple taxonomic levels. The class Solibacteres and order Solibacterales increased with anoxic duration in both soils after 384 d; these groups occurred in other variable redox environments including Arctic peat (Lipson et al., 2013) and wastewater treatment bioreactors (Zhang et al., 2017) and increased after a pasture soil was flooded (Randle-Boggis et al., 2018). Two OTUs in the genus Candidatus Solibacter decreased with anoxic duration at 48 d. Genomic analyses suggest that these organisms are slow-growing aerobic heterotrophs (Ward et al., 2009), but they became increasingly abundant in paddy soils following long-term organic matter amendments (Yu et al., 2019), implying that they required time to proliferate under the conditions of our experiment. Solibacterales and Koribacteraceae also increased in agricultural soils under continuous corn cultivation, which was interpreted by the authors as a response to nutrient limitation (Soman et al., 2017). The strong response of these groups to anoxic duration in our experiment suggest that differences in anoxic microsites between cropping systems might also have contributed. Candidatus Koribacter may oxidize metals at redox interfaces (Ward et al., 2009; Allward et al., 2018), and this group increased with anoxic duration after 384 d in both of our soils, indicating their possible role in oxidizing reduced iron (Fe) or manganese during the oxic phases.
Both soils reduced and oxidized Fe at rates of tens to hundreds of μg Fe per g soil per anoxic/oxic cycle, as indicated by comparisons of FeII concentrations between oxic and anoxic treatment phases during the first 48 d of the experiment (Huang et al., 2021). The 16S data implicated several taxa that might have contributed to Fe reduction. Deltaproteobacteria showed contrasting responses among subgroups but Myxococcaeae and 10 OTUs from Anaeromyxobacter increased strongly with anoxic duration in both soils. This genus contains taxa capable of dissimilatory Fe reduction as well as aerobic respiration (Treude et al., 2003) and it increased elsewhere following Fe addition to rice paddy soils (Wang et al., 2020). Myxococcales also increased under redox fluctuation treatments in other experiments (DeAngelis et al., 2010; Randle-Boggis et al., 2018; Winkler et al., 2019). In a separate soil sample collected at the same site where our Puerto Rican Oxisol was obtained, meta-transcriptomic analyses indicated that Geobacter, Pelosinus, and Anaeromyxobacter were likely the most important Fe-reducing organisms (Wilmoth et al., 2018). However, in our Oxisol samples, Geobacter OTUs were rare, similar to the results of DeAngelis et al. (2010), who also used samples from this same site. Pelosinus OTUs were present in both soils but only significantly responded to anoxic duration in the Oxisol. The relatively high abundance of Anaeromyxobacter OTUs and their consistent increase with anoxic duration suggest that they may have contributed to measured Fe reduction in both soils.
Microbes that increased with anoxic duration in our experiment often corresponded with groups identified previously in wetland soils, anaerobic digestors, and in anaerobic disinfestation experiments (where soils were amended with C substrates and covered with impermeable material to kill pathogens). Several Ruminococcaceae OTUs increased with anoxic duration, consistent with their dominance following reductive disinfestation (Huang et al., 2019) and their increase in rice-paddy soil following straw amendment (Wegner and Liesack, 2016). The Chloroflexi class Anaerolineae increased with anoxic duration; this group was abundant in rice-paddy soil under current-producing conditions (Cabezas et al., 2015) or following iron mineral addition (Huang et al., 2020a), and was a core member of anaerobic digestor communities (Rivière et al., 2009). Taxa that responded negatively to anoxic duration included multiple classes and orders in the Planctomycetes which declined following anaerobic disinfestation (van Agtmaal et al., 2015) and in anoxic horizons of tundra soils (Lipson et al., 2015). Several Bradyrhizobiaceae OTUs consistently decreased with anoxic duration, and this broader group (Rhizobiales) also decreased in flooded pasture soils (Randle-Boggis et al., 2018). The functional attributes of these particular Bradyrhizobiaceae are unclear, but because of the abundance and ubiquity of this group here and elsewhere (Delgado-Baquerizo et al., 2018) they deserve attention as indicators of O2 availability.
Conclusion
Some Core Taxa May Respond Consistently to Periodic Oxygen Limitation
Oxygen availability has been proposed as a core driver of soil microbial community composition (Fierer, 2017) but we are unaware of experiments that explicitly tested the impacts of temporal gradients in O2 availability in diverse environments. Using two soils with greatly differing biological and geochemical characteristics, we identified a core guild of O2-sensitive microbes across multiple taxonomic levels. Responses were most consistent between soils at the OTU level. Shifts in the abundance and presence of the particular taxa identified may therefore hold promise in recording the recent history of O2 availability. Many O2-sensitive OTUs identified here were also common and prevalent members in global soil communities (Delgado-Baquerizo et al., 2018; Supplementary Data Sheet S1). It remains to be seen, however, whether these taxa also might consistently respond to O2 variation in other soils, and experiments comparing a broader range of soils are needed to expand on the proof-of-concept experiment we report in this paper. Although O2 tolerance/sensitivity may be a strongly conserved trait for some taxonomic groups, other groups showed disparate responses to anoxic period duration at relatively fine taxonomic resolution (Supplementary Data Sheet S1), indicating a potential for adaptation or niche partitioning. Furthermore, the O2-sensitive OTUs identified here which were not commonly or consistently observed in previous syntheses of soil microbes may also prove useful in delineating soils that experience periodic O2 deficiency from consistently oxic environments. Notably, shared responses of OTUs to O2 deficiency occurred despite large differences between our study soils in pH and other environmental attributes (Table 1) and their greatly contrasting initial community compositions (Figure 2). Along with variables such as pH, temperature, C availability, and moisture (Fierer and Jackson, 2006; Fierer et al., 2007; Delgado-Baquerizo et al., 2018; Frindte et al., 2019), our results support the hypothesis (Fierer, 2017) that time-integrated O2 availability might serve as a core driver of microbial composition across diverse terrestrial soils from humid environments. Given the tremendous spatiotemporal heterogeneity of O2 in terrestrial soils and the challenges of directly measuring this key biogeochemical variable at scales relevant to microbial physiology (Sexstone et al., 1985; Silver et al., 1999; Hall et al., 2013; Keiluweit et al., 2016), microbial community datasets deserve further attention as proxies for redox history.
Data Availability Statement
The datasets presented in this study can be found in online repositories. The names of the repository/repositories and accession number(s) can be found at: https://www.ncbi.nlm.nih.gov/, PRJNA693044; https://doi.org/10.6073/pasta/1ee938a080a0000dca8c138add8f9930, edi.1125.1.
Author Contributions
WH and SH designed the experiment. WH conducted the experiment. SN and ER performed bioinformatic analyses. SH analyzed the OTU data and wrote the paper with contributions from all authors. All authors contributed to the article and approved the submitted version.
Funding
This research was supported in part by NSF grants DEB-1457805 and EAR-1331841. Funds for 16S rRNA gene amplicon sequencing were provided by a University of Wisconsin-Madison Microbiome Initiative award to EER. The open access publication fees for this article were paid by the Iowa State University Library.
Conflict of Interest
The authors declare that the research was conducted in the absence of any commercial or financial relationships that could be construed as a potential conflict of interest.
Publisher’s Note
All claims expressed in this article are solely those of the authors and do not necessarily represent those of their affiliated organizations, or those of the publisher, the editors and the reviewers. Any product that may be evaluated in this article, or claim that may be made by its manufacturer, is not guaranteed or endorsed by the publisher.
Acknowledgments
We thank Anthony Mirabito and Lucio Reyes for laboratory assistance.
Supplementary Material
The Supplementary Material for this article can be found online at: https://www.frontiersin.org/articles/10.3389/fmicb.2022.866828/full#supplementary-material
References
Allward, N. E., Gregory, B. S., Sotddart, A. K., and Gagnon, G. A. (2018). Potential for manganese biofouling in water transmission lines using model reactors. Environ. Sci. Water Res. Technol. 4, 761–772. doi: 10.1039/C8EW00074C
Barcellos, D., O’Connell, C. S., Silver, W., Meile, C., and Thompson, A. (2018). Hot spots and hot moments of soil moisture explain fluctuations in iron and carbon cycling in a humid tropical forest soil. Soil Syst. 2:59. doi: 10.3390/soilsystems2040059
Barka, E. A., Vatsa, P., Sanchez, L., Gaveau-Vaillant, N., Jacquard, C., Klenk, H.-P., et al. (2016). Taxonomy, physiology, and natural products of Actinobacteria. Microbiol. Mol. Biol. Rev. 80, 1–43. doi: 10.1128/MMBR.00019-15
Bier, R. L., Voss, K. A., and Bernhardt, E. S. (2015). Bacterial community responses to a gradient of alkaline mountaintop mine drainage in central Appalachian streams. ISME J. 9, 1378–1390. doi: 10.1038/ismej.2014.222
Blazewicz, S. J., Barnard, R. L., Daly, R. A., and Firestone, M. K. (2013). Evaluating rRNA as an indicator of microbial activity in environmental communities: limitations and uses. ISME J. 7, 2061–2068. doi: 10.1038/ismej.2013.102
Cabezas, A., Pommerenke, B., Boon, N., and Friedrich, M. W. (2015). Geobacter, Anaeromyxobacter and Anaerolineae populations are enriched on anodes of root exudate-driven microbial fuel cells in rice field soil. Environ. Microbiol. Rep. 7, 489–497. doi: 10.1111/1758-2229.12277
Caporaso, J. G., Bittinger, K., Bushman, F. D., DeSantis, T. Z., Andersen, G. L., and Knight, R. (2010a). PyNAST: a flexible tool for aligning sequences to a template alignment. Bioinformatics 26, 266–267. doi: 10.1093/bioinformatics/btp636
Caporaso, J. G., Kuczynski, J., Stombaugh, J., Bittinger, K., Bushman, F. D., Costello, E. K., et al. (2010b). QIIME allows analysis of high-throughput community sequencing data. Nat. Methods 7, 335–336. doi: 10.1038/nmeth.f.303
Chacon, N., Silver, W. L., Dubinsky, E. A., and Cusack, D. F. (2006). Iron reduction and soil phosphorus solubilization in humid tropical forest soils: the roles of labile carbon pools and an electron shuttle compound. Biogeochemistry 78, 67–84. doi: 10.1007/s10533-005-2343-3
de Menezes, A. B., McDonald, J. E., Allison, H. E., and McCarthy, A. J. (2012). Importance of Micromonospora spp. as colonizers of cellulose in freshwater lakes as demonstrated by quantitative reverse transcriptase PCR of 16S rRNA. Appl. Environ. Microbiol. 78, 3495–3499. doi: 10.1128/AEM.07314-11
DeAngelis, K. M., Silver, W. L., Thompson, A. W., and Firestone, M. K. (2010). Microbial communities acclimate to recurring changes in soil redox potential status. Environ. Microbiol. 12, 3137–3149. doi: 10.1111/j.1462-2920.2010.02286.x
Delgado-Baquerizo, M., Oliverio, A. M., Brewer, T. E., Benavent-González, A., Eldridge, D. J., Bardgett, R. D., et al. (2018). A global atlas of the dominant bacteria found in soil. Science 359, 320–325. doi: 10.1126/science.aap9516
Edgar, R. C. (2010). Search and clustering orders of magnitude faster than BLAST. Bioinformatics 26, 2460–2461. doi: 10.1093/bioinformatics/btq461
Fierer, N. (2017). Embracing the unknown: disentangling the complexities of the soil microbiome. Nat. Rev. Microbiol. 15, 579–590. doi: 10.1038/nrmicro.2017.87
Fierer, N., Bradford, M., and Jackson, R. (2007). Toward an ecological classification of soil bacteria. Ecology 88, 1354–1364. doi: 10.1890/05-1839
Fierer, N., and Jackson, R. (2006). The diversity and biogeography of soil bacterial communities. Proc. Natl. Acad. Sci. 103, 626–631. doi: 10.1073/pnas.0507535103
Frindte, K., Allgaier, M., Grossart, H.-P., and Eckert, W. (2016). Redox stability regulates community structure of active microbes at the sediment–water interface. Environ. Microbiol. Rep. 8, 798–804. doi: 10.1111/1758-2229.12441
Frindte, K., Pape, R., Werner, K., Löffler, J., and Knief, C. (2019). Temperature and soil moisture control microbial community composition in an arctic–alpine ecosystem along elevational and micro-topographic gradients. ISME J. 13, 2031–2043. doi: 10.1038/s41396-019-0409-9
García-García, N., Tamames, J., Linz, A. M., Pedrós-Alió, C., and Puente-Sánchez, F. (2019). Microdiversity ensures the maintenance of functional microbial communities under changing environmental conditions. ISME J. 13, 2969–2983. doi: 10.1038/s41396-019-0487-8
Hall, S. J., McDowell, W. H., and Silver, W. L. (2013). When wet gets wetter: decoupling of moisture, redox biogeochemistry, and greenhouse gas fluxes in a humid tropical forest soil. Ecosystems 16, 576–589. doi: 10.1007/s10021-012-9631-2
Huang, W., and Hall, S. J. (2017). Elevated moisture stimulates carbon loss from mineral soils by releasing protected organic matter. Nat. Commun. 8:1774. doi: 10.1038/s41467-017-01998-z
Huang, X., Liu, L., Zhao, J., Zhang, J., and Cai, Z. (2019). The families Ruminococcaceae, Lachnospiraceae, and Clostridiaceae are the dominant bacterial groups during reductive soil disinfestation with incorporated plant residues. Appl. Soil Ecol. 135, 65–72. doi: 10.1016/j.apsoil.2018.11.011
Huang, J., Ma, K., Xia, X., Gao, K., and Lu, Y. (2020a). Biochar and magnetite promote methanogenesis during anaerobic decomposition of rice straw. Soil Biol. Biochem. 143:107740. doi: 10.1016/j.soilbio.2020.107740
Huang, W., Wang, K., Ye, C., Hockaday, W. C., Wang, G., and Hall, S. J. (2021). High carbon losses from oxygen-limited soils challenge biogeochemical theory and model assumptions. Glob. Chang. Biol. 27, 6166–6180. doi: 10.1111/gcb.15867
Huang, W., Ye, C., Hockaday, W. C., and Hall, S. J. (2020b). Trade-offs in soil carbon protection mechanisms under aerobic and anaerobic conditions. Glob. Chang. Biol. 26, 3726–3737. doi: 10.1111/gcb.15100
in’t Zandt, M. H., Kip, N., Frank, J., Jansen, S., van Veen, J. A., Jetten, M. S. M., et al. (2019). High-level abundances of Methanobacteriales and Syntrophobacterales may help to prevent corrosion of metal sheet piles. Appl. Environ. Microbiol. 85:e01369. doi: 10.1128/AEM.01369-19
Keiluweit, M., Nico, P. S., Kleber, M., and Fendorf, S. (2016). Are oxygen limitations under recognized regulators of organic carbon turnover in upland soils? Biogeochemistry 127, 157–171. doi: 10.1007/s10533-015-0180-6
Kirk, M. F., Wilson, B. H., Marquart, K. A., Zeglin, L. H., Vinson, D. S., and Flynn, T. M. (2015). Solute concentrations influence microbial methanogenesis in coal-bearing strata of the Cherokee basin, USA. Front. Microbiol. 6:1287. doi: 10.3389/fmicb.2015.01287
Knief, C. (2019). “Diversity of methane cycling microorganisms in soils and their relation to oxygen” in Methylotrophs and Methylotroph Communities. ed. L. Chistoserdova (Poole, UK: Caister Academic Press), 23–56.
Koch, H., Lücker, S., Albertsen, M., Kitzinger, K., Herbold, C., Spieck, E., et al. (2015). Expanded metabolic versatility of ubiquitous nitrite-oxidizing bacteria from the genus Nitrospira. PNAS 112, 11371–11376. doi: 10.1073/pnas.1506533112
Lipson, D. A., Haggerty, J. M., Srinivas, A., Raab, T. K., Sathe, S., and Dinsdale, E. A. (2013). Metagenomic insights into anaerobic metabolism along an arctic peat soil profile. PLoS One 8:e64659. doi: 10.1371/journal.pone.0064659
Lipson, D. A., Raab, T. K., Parker, M., Kelley, S. T., Brislawn, C. J., and Jansson, J. (2015). Changes in microbial communities along redox gradients in polygonized Arctic wet tundra soils. Environ. Microbiol. Rep. 7, 649–657. doi: 10.1111/1758-2229.12301
Liptzin, D., Silver, W. L., and Detto, M. (2011). Temporal dynamics in soil oxygen and greenhouse gases in two humid tropical forests. Ecosystems 14, 171–182. doi: 10.1007/s10021-010-9402-x
Love, M. I., Huber, W., and Anders, S. (2014). Moderated estimation of fold change and dispersion for RNA-seq data with DESeq2. Genome Biol. 15, 550. doi: 10.1186/s13059-014-0550-8
Martin, A., Kaleita, A. L., and Soupir, M. L. (2019). Inundation patterns of farmed pothole depressions with varying subsurface drainage. Trans. ASABE 62, 1579–1590. doi: 10.13031/trans.13435
McMurdie, P. J., and Holmes, S. (2013). Phyloseq: an R package for reproducible interactive analysis and graphics of microbiome census data. PLoS One 8:e61217. doi: 10.1371/journal.pone.0061217
McNicol, G., and Silver, W. L. (2014). Separate effects of flooding and anaerobiosis on soil greenhouse gas emissions and redox sensitive biogeochemistry. J. Geophys. Res. Biogeosci. 119, 557–566. doi: 10.1002/2013JG002433
Mejia, J., Roden, E. E., and Ginder-Vogel, M. (2016). Influence of oxygen and nitrate on Fe (hydr)oxide mineral transformation and soil microbial communities during redox cycling. Environ. Sci. Technol. 50, 3580–3588. doi: 10.1021/acs.est.5b05519
O’Connell, C. S., Ruan, L., and Silver, W. L. (2018). Drought drives rapid shifts in tropical rainforest soil biogeochemistry and greenhouse gas emissions. Nat. Commun. 9:1348. doi: 10.1038/s41467-018-03352-3
Oksanen, J., Blanchet, F. G., Friendly, M., Kindt, R., Legendre, P., McGlinn, D., et al. (2019). Vegan: Community ecology package. R package version 2.5-5.
Peralta, A. L., Ludmer, S., Matthews, J. W., and Kent, A. D. (2014). Bacterial community response to changes in soil redox potential along a moisture gradient in restored wetlands. Ecol. Eng. 73, 246–253. doi: 10.1016/j.ecoleng.2014.09.047
Peters, V., and Conrad, R. (1995). Methanogenic and other strictly anaerobic bacteria in desert soil and other oxic soils. Appl. Environ. Microbiol. 61, 1673–1676. doi: 10.1128/aem.61.4.1673-1676.1995
Pett-Ridge, J., and Firestone, M. K. (2005). Redox fluctuation structures microbial communities in a wet tropical soil. Appl. Environ. Microb. 71, 6998–7007. doi: 10.1128/AEM.71.11.6998-7007.2005
Pett-Ridge, J., Silver, W. L., and Firestone, M. K. (2006). Redox fluctuations frame microbial community impacts on N-cycling rates in a humid tropical forest soil. Appl. Environ. Microb. 81, 95–110. doi: 10.1007/s10533-006-9032-8
Philippot, L., Andersson, S. G. E., Battin, T. J., Prosser, J. I., Schimel, J. P., Whitman, W. B., et al. (2010). The ecological coherence of high bacterial taxonomic ranks. Nat. Rev. Microbiol. 8, 523–529. doi: 10.1038/nrmicro2367
Placella, S. A., Brodie, E. L., and Firestone, M. K. (2012). Rainfall-induced carbon dioxide pulses result from sequential resuscitation of phylogenetically clustered microbial groups. Proc. Natl. Acad. Sci. 109, 10931–10936. doi: 10.1073/pnas.1204306109
Pronk, G. J., Mellage, A., Milojevic, T., Smeaton, C. M., Engel, K., Neufeld, J. D., et al. (2020). Carbon turnover and microbial activity in an artificial soil under imposed cyclic drainage and imbibition. Vadose Zone J. 19:e20021. doi: 10.1002/vzj2.20021
Quast, C., Pruesse, E., Yilmaz, P., Gerken, J., Schweer, T., Yarza, P., et al. (2013). The SILVA ribosomal RNA gene database project: improved data processing and web-based tools. Nucleic Acids Res. 41, D590–D596. doi: 10.1093/nar/gks1219
Ramírez-Flandes, S., González, B., and Ulloa, O. (2019). Redox traits characterize the organization of global microbial communities. PNAS 116, 3630–3635. doi: 10.1073/pnas.1817554116
Randle-Boggis, R. J., Ashton, P. D., and Helgason, T. (2018). Increasing flooding frequency alters soil microbial communities and functions under laboratory conditions. Microbiol. Open 7:e00548. doi: 10.1002/mbo3.548
Rivière, D., Desvignes, V., Pelletier, E., Chaussonnerie, S., Guermazi, S., Weissenbach, J., et al. (2009). Towards the definition of a core of microorganisms involved in anaerobic digestion of sludge. ISME J. 3, 700–714. doi: 10.1038/ismej.2009.2
Sexstone, A., Revsbech, N., Parkin, T., and Tiedje, J. (1985). Direct measurement of oxygen profiles and denitrification rates in soil aggregates. Soil Sci. Soc. Am. J. 49, 645–651. doi: 10.2136/sssaj1985.03615995004900030024x
Silver, W. L., Lugo, A. E., and Keller, M. (1999). Soil oxygen availability and biogeochemistry along rainfall and topographic gradients in upland wet tropical forest soils. Biogeochemistry 44, 301–328. doi: 10.1023/A:1006034126698
Soman, C., Li, D., Wander, M. M., and Kent, A. D. (2017). Long-term fertilizer and crop-rotation treatments differentially affect soil bacterial community structure. Plant Soil 413, 145–159. doi: 10.1007/s11104-016-3083-y
Treude, N., Rosencrantz, D., Liesack, W., and Schnell, S. (2003). Strain FAc12, a dissimilatory iron-reducing member of the Anaeromyxobacter subgroup of Myxococcales. FEMS Microbiol. Ecol. 44, 261–269. doi: 10.1016/S0168-6496(03)00048-5
van Agtmaal, M., van Os, G., Hol, G., Hundscheid, M., Runia, W., Hordijk, C., et al. (2015). Legacy effects of anaerobic soil disinfestation on soil bacterial community composition and production of pathogen-suppressing volatiles. Front. Microbiol. 6:701. doi: 10.3389/fmicb.2015.00701
von Fischer, J., and Hedin, L. (2002). Separating methane production and consumption with a field-based isotope pool dilution technique. Global Biogeochem. Cycles 16, 8-1–8-13. doi: 10.1029/2001GB001448
Wang, K., Jia, R., Li, L., Jiang, R., and Qu, D. (2020). Community structure of Anaeromyxobacter in Fe(III) reducing enriched cultures of paddy soils. J. Soils Sediments 20, 1621–1631. doi: 10.1007/s11368-019-02529-7
Ward, N. L., Challacombe, J. F., Janssen, P. H., Henrissat, B., Coutinho, P. M., Wu, M., et al. (2009). Three genomes from the phylum Acidobacteria provide insight into the lifestyles of these microorganisms in soils. Appl. Environ. Microbiol. 75, 2046–2056. doi: 10.1128/AEM.02294-08
Wegner, C.-E., and Liesack, W. (2016). Microbial community dynamics during the early stages of plant polymer breakdown in paddy soil. Environ. Microbiol. 18, 2825–2842. doi: 10.1111/1462-2920.12815
Wellington, E. M. H., and Toth, I. K. (1994). “Actinomycetes” in Methods of Soil Analysis: Part II Microbiological and Biochemical Properties. eds. R. W. Weaver, S. Angle, P. Bottomley, D. Bezdicek, S. Smith, and A. Tabatabai, et al. (Madison, WI, USA: Soil Science Society of America), 269–290.
Whitman, W. B., Bowen, T. L., and Boone, D. R. (2014). “The methanogenic bacteria” in The Prokaryotes: Other Major Lineages of Bacteria and The Archaea. eds. E. Rosenberg, E. F. DeLong, S. Lory, E. Stackebrandt, and F. Thompson (Berlin: Springer), 123–163.
Wilmoth, J. L., Moran, M. A., and Thompson, A. (2018). Transient O2 pulses direct Fe crystallinity and Fe(III)-reducer gene expression within a soil microbiome. Microbiome 6, 189. doi: 10.1186/s40168-018-0574-5
Winkler, P., Kaiser, K., Jahn, R., Mikutta, R., Fiedler, S., Cerli, C., et al. (2019). Tracing organic carbon and microbial community structure in mineralogically different soils exposed to redox fluctuations. Biogeochemistry 143, 31–54. doi: 10.1007/s10533-019-00548-7
Yu, W., Lawrence, N. C., Sooksa-nguan, T., Smith, S. D., Tenesaca, C., Howe, A. C., et al. (2021). Microbial linkages to soil biogeochemical processes in a poorly drained agricultural ecosystem. Soil Biol. Biochem. 156:108228. doi: 10.1016/j.soilbio.2021.108228
Yu, Y., Wu, M., Petropoulos, E., Zhang, J., Nie, J., Liao, Y., et al. (2019). Responses of paddy soil bacterial community assembly to different long-term fertilizations in Southeast China. Sci. Total Environ. 656, 625–633. doi: 10.1016/j.scitotenv.2018.11.359
Keywords: anaerobic, anoxic, methane, oxygen, 16S rRNA, redox, wetland, iron reduction and oxidation
Citation: Hall SJ, Huang W, Napieralski SA and Roden E (2022) Shared Microbial Taxa Respond Predictably to Cyclic Time-Varying Oxygen Limitation in Two Disparate Soils. Front. Microbiol. 13:866828. doi: 10.3389/fmicb.2022.866828
Edited by:
Marcus A. Horn, Leibniz University Hannover, GermanyReviewed by:
Claudia Knief, University of Bonn, GermanyMalak M. Tfaily, University of Arizona, United States
Copyright © 2022 Hall, Huang, Napieralski and Roden. This is an open-access article distributed under the terms of the Creative Commons Attribution License (CC BY). The use, distribution or reproduction in other forums is permitted, provided the original author(s) and the copyright owner(s) are credited and that the original publication in this journal is cited, in accordance with accepted academic practice. No use, distribution or reproduction is permitted which does not comply with these terms.
*Correspondence: Steven J. Hall, c3RldmVuamhAaWFzdGF0ZS5lZHU=