 Gage R. Coon
 Paul D. Duesing
 Raegan Paul
 Jennifer A. Baily
 Karen G. Lloyd
- Department of Microbiology, The University of Tennessee, Knoxville, TN, United States
Introduction: Anaerobic oxidation of methane (AOM) is hypothesized to occur through reverse hydrogenotrophic methanogenesis in marine sediments because sulfate reducers pull hydrogen concentrations so low that reverse hydrogenotrophic methanogenesis is exergonic. If true, hydrogenotrophic methanogenesis can theoretically co-occur with sulfate reduction if the organic matter is so labile that fermenters produce more hydrogen than sulfate reducers can consume, causing hydrogen concentrations to rise. Finding accumulation of biologically-produced methane in sulfate-containing organic-rich sediments would therefore support the theory that AOM occurs through reverse hydrogenotrophic methanogenesis since it would signal the absence of net AOM in the presence of sulfate.
Methods: 16S rRNA gene libraries were compared to geochemistry and incubations in high depth-resolution sediment cores collected from organic-rich Cape Lookout Bight, North Carolina.
Results: We found that methane began to accumulate while sulfate is still abundant (6–8 mM). Methane-cycling archaea ANME-1, Methanosarciniales, and Methanomicrobiales also increased at these depths. Incubations showed that methane production in the upper 16 cm in sulfate-rich sediments was biotic since it could be inhibited by 2-bromoethanosulfonoic acid (BES).
Discussion: We conclude that methanogens mediate biological methane production in these organic-rich sediments at sulfate concentrations that inhibit methanogenesis in sediments with less labile organic matter, and that methane accumulation and growth of methanogens can occur under these conditions as well. Our data supports the theory that H2 concentrations, rather than the co-occurrence of sulfate and methane, control whether methanogenesis or AOM via reverse hydrogenotrophic methanogenesis occurs. We hypothesize that the high amount of labile organic matter at this site prevents AOM, allowing methane accumulation when sulfate is low but still present in mM concentrations.
1. Introduction
Atmospheric methane concentrations from all sources have more than doubled from 0.7 to 1.9 ppmv since the pre-industrial era (Etheridge et al., 1998; US Department of Commerce, 2023). Methane contributes 20% of total greenhouse gas emissions, largely originating from the microbial process of methanogenesis (Wuebbles and Hayhoe, 2002). Methanogenesis has three main pathways: hydrogenotrophic using hydrogen and carbon dioxide, acetoclastic using acetate, and methylotrophic using methylated compounds, with hydrogenotrophic methanogenesis often being the most prevalent type in marine sediments (Liu and Whitman, 2008). All types of methanogenic pathways use the methyl coenzyme M reductase (MCR) enzyme to catalyze the final step of methane production. The same gene is used in reverse methanogenesis, also called the anaerobic oxidation of methane (AOM), as well (Hallam et al., 2004; Scheller et al., 2010; Soo et al., 2016; Yu et al., 2022). In many types of marine sediments, more than eight times more methane is biotically produced in the sediment than is released into the overlying water (Reeburgh et al., 1991; Mau et al., 2017; Ruffine et al., 2018). This disparity is predominantly due to sulfate-dependent AOM, which oxidizes much of the methane to carbon dioxide before it can escape the sediment column (Reeburgh, 2007), though AOM can also rely on other electron acceptors like nitrate, nitrite, and metal ions (Muyzer and Stams, 2008; Beal et al., 2009; Haroon et al., 2013; Timmers et al., 2017; Zhang et al., 2022).
In marine sediment, sulfate-dependent AOM can occur through either reverse hydrogenotrophic methanogenesis coupled to sulfate reduction, also known as interspecies hydrogen transfer (Hoehler et al., 1994, 1998; Timmers et al., 2017) or via direct interspecies electron transfer to a sulfate reducer (McGlynn et al., 2015; Wegener et al., 2015). AOM defines methane dynamics in marine sediment, so understanding the role of these two different mechanisms is key. Evidence for reverse hydrogenotrophic methanogenesis coupled to sulfate reduction comes from the fact that net methane oxidation only occurs when hydrogen concentrations drop low enough to make reverse hydrogenotrophic methanogenesis sufficiently exergonic to meet microbial energy demands (Hoehler et al., 1994). Hydrogen has been shown to control the direction of methane production or oxidation in enrichments of methanogen-like archaea Methanosarciniales (ANME-2) and ANME-1 (Yoshinaga et al., 2014; Wegener et al., 2015). Pure cultures of methanogens produce hydrogen from methane while under low-hydrogen conditions, though they do not sustain this process at a high rate for more than a few hours (Valentine et al., 2000). Methanosarcina barkeri, another methanogen, has recently been characterized as capable of AOM (Yu et al., 2022). On the other hand, evidence that the mechanism of AOM occurs through direct electron transfer, independently of a molecular intermediate comes from the presence of nanowire-like appendages on ANME-1 (Wegener et al., 2015) and multiheme cytochromes on consortia of the Methanosarciniales (ANME-2) that have been shown to conduct electricity (McGlynn et al., 2015). ANME-2 exhibits the use of artificial electron acceptors for methanotrophy (Scheller et al., 2016), suggesting that sulfate is not necessary as the sink for electrons from methane oxidation, though some mean of transporting electrons is necessary. These studies with direct electron transfer were conducted in deeply-sourced methane seeps, so they deserve more study in coastal marine sediments.
If the mechanism of the apparent sulfate-driven control of methane is due to the balance between biological hydrogen production and consumption, rather than direct electron transfer from methane to sulfate, then AOM and methanogenesis should be decoupled from the presence of sulfate in areas of high organic matter content where hydrogen supply can overwhelm sulfate reduction. In one example of this, high concentrations of fermentative products in highly labile sludge reactors support simultaneous sulfate reduction and methanogenesis (Santegoeds et al., 1999). Additionally, incubations of marine sediments show methane production occurring with sulfate present, even when methane does not accumulate (Timmers et al., 2015; Sela-Adler et al., 2017; Xiao et al., 2017; Maltby et al., 2018; Kevorkian et al., 2022). AOM and methanogenesis should also occur nearly simultaneously when hydrogen concentrations get low, regardless of the organic matter content, since pockets of sulfate depletion may allow hydrogen to increase in microenvironments, supporting ephemeral methanogenesis even during AOM (Knab et al., 2008). In support of this, radioactive tracer experiments have shown hydrogenotrophic methane production at depths where AOM prevents methane accumulation (Hoehler et al., 1994; Parkes et al., 2007; Beulig et al., 2019; Krause et al., 2023). Biotic methane production has been shown to occur in the upper few cm of marine sediments in the presence of abundant sulfate (Xiao et al., 2017, 2018). This is partly due to methylotrophic methanogens which do not have to compete with sulfate reducers (Xiao et al., 2018), yet hydrogenotrophic methanogens also are present, suggesting that hydrogenotrophic methanogenesis also contributes (Xiao et al., 2017). The MCR-containing microorganisms present in sulfate-rich non-methane-accumulating sediments have been found to be diverse, spanning many genera within Methanomicrobiales, Methanosarciniales, and ANME-1 (Lloyd et al., 2011; Kevorkian et al., 2021; Krause et al., 2023). Cultured representatives of the Methanomicrobiales generally use hydrogen with carbon dioxide or formate, and those from the Methanosarciniales can also use acetate and methylated compounds, some obligately so. There are no pure cultures from ANME-1, but enrichments and experiments on natural sediments suggest they may alternate between AOM and hydrogenotrophic methanogenesis (Lloyd et al., 2011; Kevorkian et al., 2021; Krause et al., 2023).
To help distinguish between the two mechanisms, we examined downcore geochemistry and microbiology in marine sediments. Methane usually does not accumulate in marine sediments until a depth where sulfate, which diffuses into sediments from the overlying water, is depleted (Reeburgh, 2007). This is due to two reasons: (1) sulfate-reducing bacteria keep the hydrogen and acetate produced by fermentation of organic matter low enough that most methanogenesis is thermodynamically inhibited, and (2) AOM occurs either because sulfate reducers pull hydrogen concentrations low enough that reverse hydrogenotrophic methanogenesis is exergonic or because anaerobic methanotrophs pass electrons directly from methane to sulfate (Reeburgh, 2007; Larowe et al., 2008). Below the depth where sulfate is consumed, hydrogen increases, methanogenesis is no longer inhibited, and methane accumulates (Hoehler et al., 2001). Observing methane accumulation due to diffusion from below and no AOM in the presence of sulfate in sediments would provide another piece of support for the theory that AOM occurs through reversible hydrogenotrophic methanogenesis via interspecies hydrogen transfer to a sulfate reducer. Such a result would suggest that methanogenesis and AOM are indirectly dependent on the presence of sulfate, and that AOM can be inefficient, even when sulfate is present. Organic-rich sediments such as those of Cape Lookout Bight (CLB), North Carolina (Hoehler et al., 1994; Martens et al., 1998) and Beidagang Wetland Nature Reserve, China (La et al., 2022) have been shown to lack AOM through radiotracers, sulfate and methane profiles, and stable carbon isotopes, even in the presence of millimolar concentrations of sulfate. In CLB, this is because the hydrogen concentrations do not drop low enough to make reverse methanogenesis exergonic past the minimum energetically profitable ΔG of less than −10 kJ/mol (Hoehler et al., 2001). This happens because the site has a high sedimentation rate (up to 10 cm/yr) of highly labile organic carbon (Martens et al., 1998).
We examined biological methane accumulation in CLB through downcore geochemistry and 16S rRNA gene amplicon surveys, as well as incubations of whole sediments with and without 2-bromoethanesulfonoic acid (BES). BES has been shown to drive in-vitro inhibition of the MCR protein (Alperin and Reeburgh, 1985; Webster et al., 2016), therefore inhibiting methane production via BES can show if methane is being actively produced by microorganisms rather than just diffusing out of sediments after diffusing in from elsewhere. Here, we explore the biogeochemistry of these sediments by observing the changes between methane production vs. methane accumulation in sulfate-rich sediments and its relationship to the distribution of bacteria and archaea in organic-rich CLB sediments.
2. Methods
2.1. Site characteristics
Cape Lookout Bight is a 10 m deep lagoon with brackish water located on the coast of North Carolina. This site has both high organic matter and sediment deposition rates (Chanton et al., 1983; Martens et al., 1992). Sediments have been shown to be anoxic below 2 mm (Canuel and Martens, 1993).
2.2. Sample collection
Sediment samples were collected from Cape Lookout Bight, NC (34.6205 N, 76.5500 W) using SCUBA divers June 2021. We collected two large duplicate sediment cores (42 cm) and three small sediment cores (<20 cm) by pushing a polypropylene tube into the sediment and capping the ends of the tube with rubber stoppers. The large cores were sectioned at a 2 cm vertical resolution, where sediment for DNA extraction was placed into cut-off 10 mL syringes, flash frozen in dry ice, and stored at −20°C. 1 mL of sediment was placed in screw cap tubes to measure porosity. For methane measurements, 4 mL of sediment was sampled with cut-off 5 mL plastic syringes and placed in 60 mL glass serum vials containing 1 mL 0.1 M KOH and capped with butyl rubber stoppers. Methane vials were shaken to mix the KOH into the sediment and then stored upside down until measurement to prevent methane from escaping. Sediment was also centrifuged then filtered (0.2 μm) and stored in 1% ZnCl2 to measure sulfide and in 1 N HCl to measure sulfate. The three small cores were stored in the tubes used to collect them until used for incubation experiments.
2.3. DNA extraction and sequencing
DNA was extracted from 2 g of wet sediment using QIAGEN’s RNeasy Powersoil Total RNA Kit with the RNeasy Powersoil DNA Elution Kit. All steps in the supplied protocols were followed. The V4 region of the 16S rRNA gene was amplified using polymerase chain reaction (PCR) from the Earth Microbiome Project (EMB) 16S Illumina amplicon protocol and Caporaso 515F (GTGCCAGCMGCCGCGGTAA) and 806R (GGACTACHVGGGTWTCTAAT) primers. The amplified 16S rRNA products were prepared using the Illumina DNA prep kit and sequenced using an Illumina MiSeq system.
2.4. Data analysis
The sequences were analyzed in R (RStudio Team, 2020; R Core Team, 2021) with the Divisive Amplicon Denoising Algorithm (DADA2) pipeline (Callahan et al., 2016), version 1.22.0, to remove chimeras, control sequence read quality, and trim primers. Samples with poor read quality were removed from the dataset. Contaminants were removed based on the potential contaminant genera identified previously (Sheik et al., 2018) and shown in Supplementary Table S1. Taxonomy was applied by a Naïve Bayes classifier using SILVA reference sequences (Quast et al., 2013; Yilmaz et al., 2014), version 138.1, to identify taxonomy up to the genus level (assignTaxonomy function from the DADA2 package).
The resulting table contained 24,987 ASVs and a total of 4,746,347 reads over 36 samples for an average of 131,843 reads per sample (Supplementary Table S1). The relative abundance of ASVs was calculated based on ASV counts and the sum of total ASV counts. Alpha diversity (Chao 1, Shannon, and Simpson indices) and beta diversity using non-metric multidimensional scaling (NMDS) ordination and Bray–Curtis dissimilarity distances were calculated using the phyloseq package (McMurdie and Holmes, 2013), version 1.38.0.
Plots of taxonomic abundance were plotted using the ggplot2 package (Wickham, 2016) to aid in data visualization. All helper packages and versions are listed in Supplementary Table S2. All raw sequences have been deposited in the NCBI bank under the Accession ID PRJNA949635. All code is available on GitHub at https://github.com/gagecoon/clb21.
2.5. Porewater measurements
2.5.1. Porosity
Sediment from the large cores were weighed in plastic screw cap 2 mL tubes. 1 mL of sample was taken from each 2 cm interval sectioned from the core. The screwcap tubes were placed without a lid in an oven for 1 month at 55°C. After 1 month, the samples were weighed, and porosity (Φ) was calculated using the following formula:
Where mw denotes the wet mass, md denotes the dry mass, ρpw denotes the porewater density, and ρsm denotes the solid matter density. Porewater density was assumed to be 1.025 g/cm3 and solid matter density was previously measured as 2.34 g/cm3 (Alperin, 1988). This procedure was repeated once again after the first results were collected for validation.
2.5.2. Sulfide
Hydrogen sulfide samples were preserved in 1% ZnCl2 and measured with an adapted Cline assay for S− measurements. Dilutions of sulfide samples were added to plastic cuvettes with diamine and Fe3+ to yield methylene blue (Cline, 1969). The methylene blue product was measured at 667 nm using a NanoDrop 2000 spectrophotometer and corrected for the dilutions used to maintain absorbance between 0.1 and 0.9.
2.5.3. Sulfate
Sulfate tubes were measured via ion chromatography (IC) using a Dionex ICS-2100 system equipped with a 4 mm × 250 mm IonPac AS18 hydroxide-selective anion-exchange column using KOH as the eluent. Single samples ran for 24 min each to allow chloride and sulfate anion separation.
2.6. Methane
Methane samples were collected in closed serum vials and measured with a flame ionized detector on a gas chromatograph. Vials were shaken vigorously for 1 min prior to measurement. 0.1 mL of standards and samples were injected into the gas chromatograph in triplicate. Methane concentrations in mM were calculated from the formula:
Where ppm is calculated from the standard curve with the same volume injected into the GC as the samples, Vh is the volume of the headspace (55 mL), R is the universal gas constant (0.082057 L*atm/mol*K), T is the temperature of the site at the time of measurement (295 K), Φ is the sediment porosity, Vs is the volume of the sediment in the sampled serum vial (4 mL), and 1,000 is a conversion factor so concentrations are in mM.
2.7. Sediment geochemical analysis
Carbon and nitrogen concentrations (total, organic, and inorganic) and isotopic signatures (δ13C and δ15N) were measured by grinding dry sediment in a mortar and pestle to create a fine powder. To determine organic content, sediment was subsampled into unacidified sediment and acidified sediment. Acidified sediment was treated with 1 mL of 1 N HCl per 0.3 g sediment. 20–25 mg of dry sediment in tin capsules was measured using a Costech ECS4010 Elemental Analyzer paired to a Thermo-Finnigan Delta + XL mass spectrometer via a Thermo-Finnigan Conflo III. The setup used helium gas and a high temperature, >1,000°C, to analyze the sediment. Organic concentrations of carbon and nitrogen were calculated by the difference between inorganic and total carbon and nitrogen concentrations, respectively.
2.8. BES incubation—methanogenesis inhibition
2.8.1. Experiment 1
For Experiment 1, one 23 cm deep core was homogenized and 30 mL of sediment was placed into each of 17 autoclaved 60 mL glass serum vials and capped with thick rubber butyl stoppers. Samples had 5 mL of either 0, 20, or 30 mM of autoclaved 2-bromoethanesulfonic acid (BES) in autoclaved anoxic saline solution (0.29 M NaCl). There were three replicates with 0 mM BES (controls), seven with 20 mM BES, and seven with 30 mM BES, where these concentrations are final volumes accounting for mixing with porewater. Headspaces were gassed out, i.e., sparged with one gas line and two needles, with O2-scrubbed N2 to create anoxic conditions. These vials were incubated at 37°C while being shaken in the dark. Vials were removed from incubation and the headspace measured for methane and CO2 concentrations and methane δ13C values periodically. Serum vials were shaken for 1 min before some of the headspace (1–5 mL to keep methane concentrations in range) was injected into a Picarro SSIM2 module, diluted with zero air to be a sufficient volume for the analyzer (100 mL total), and measured for methane and CO2 concentrations and methane δ13C values on the Picarro G2201-i cavity ring-down spectrometer.
2.8.2. Experiment 2
Experiment 2 was a long-term incubation of two halves of two 16 cm cores – 0–8 cm and 8–16 cm depth sections. Each half of each core was homogenized and 30 mL of sediment was separated into five subsamples, three of which were treated with 5 mL of 20 mM (final volume) autoclaved BES in autoclaved anoxic saline solution (0.29 M NaCl) and two of which were treated with 5 mL of anoxic saline solution to act as controls. This sediment was placed in autoclaved 60 mL glass serum vials and capped with thick rubber butyl stoppers. In total, there were six vials treated with BES for 0–8 cm, three from one core and three from the other, six vials treated with BES for 8–16 cm, three from each core, four treated with no BES for 0–8 cm, two from each core, and four treated with no BES for 8–16 cm, two from each core. These were gassed out, i.e., sparged, with O2-scrubbed N2 to create anoxic solutions, incubated at 37°C while being shaken in the dark, and measured identically as experiment 1. Serum vials were shaken for 1 min before some of the headspace (1–5 mL to keep methane concentrations in range) was injected into a Picarro SSIM2 module, diluted with zero air to be a sufficient volume for the analyzer (100 mL total), and measured for methane and CO2 concentrations and methane δ13C values on the Picarro G2201-i cavity ring-down spectrometer.
3. Results
3.1. Sediment geochemistry and porewater analysis
Methane and sulfide increase while sulfate decreases with depth in both cores (Figure 1); however, a canonical sulfate methane transition zone, where methane only begins to accumulate when sulfate is depleted, is not present in either core. Instead, methane begins accumulating while sulfate is abundant, at 6 mM and 8 mM for cores 1 and 2, respectively. Methane concentrations increase linearly rather than concave-up, e.g., with a strong methanocline, indicating a lack of net AOM, consistent with previous results from this site (Hoehler et al., 1994; Martens et al., 1998). The concavity of sulfate concentrations in core 1 and the increase in sulfide with depth in both cores demonstrate biological sulfate reduction, even as methane increases below 32 cm in core 1 and 34 cm in core 2. In core 1, methane remains less than 0.1 mM until 32 cm below sea floor (cmbsf) where it increases steadily. Methane accumulates to full saturation (1.5 mM) while sulfate concentrations are still around 5 mM at ~40 cmbsf. In core 2, methane gradually increases up to more than 0.7 mM with sulfate around 5 mM at ~40 cmbsf but never reaches full saturation within the depths sampled. The decrease in sulfate strongly correlates with the increase in sulfide between both cores (R2 = 0.75, p-value = 2.412e-12, DF = 36, t-value = −10.36, Supplementary Figure S5). Porosity mostly ranged from 70 to 85% and trended down with depth in both cores which can increase the potential aqueous methane concentrations as lower porosity increases calculated aqueous methane values (Supplementary Figure S1). DNA yields also decreased with depth (Supplementary Figure S1). Total organic carbon (TOC) concentrations ranged from 2.4 to 5.4% and C/N ratios were 9–14 (Figure 2), typical for high organic matter sites (Fuller et al., 2021). Organic matter was largely a mixture of terrestrial run-off and phytoplankton production (Buongiorno et al., 2019) with δ13C values −18 to −23 ‰ (Figure 2).
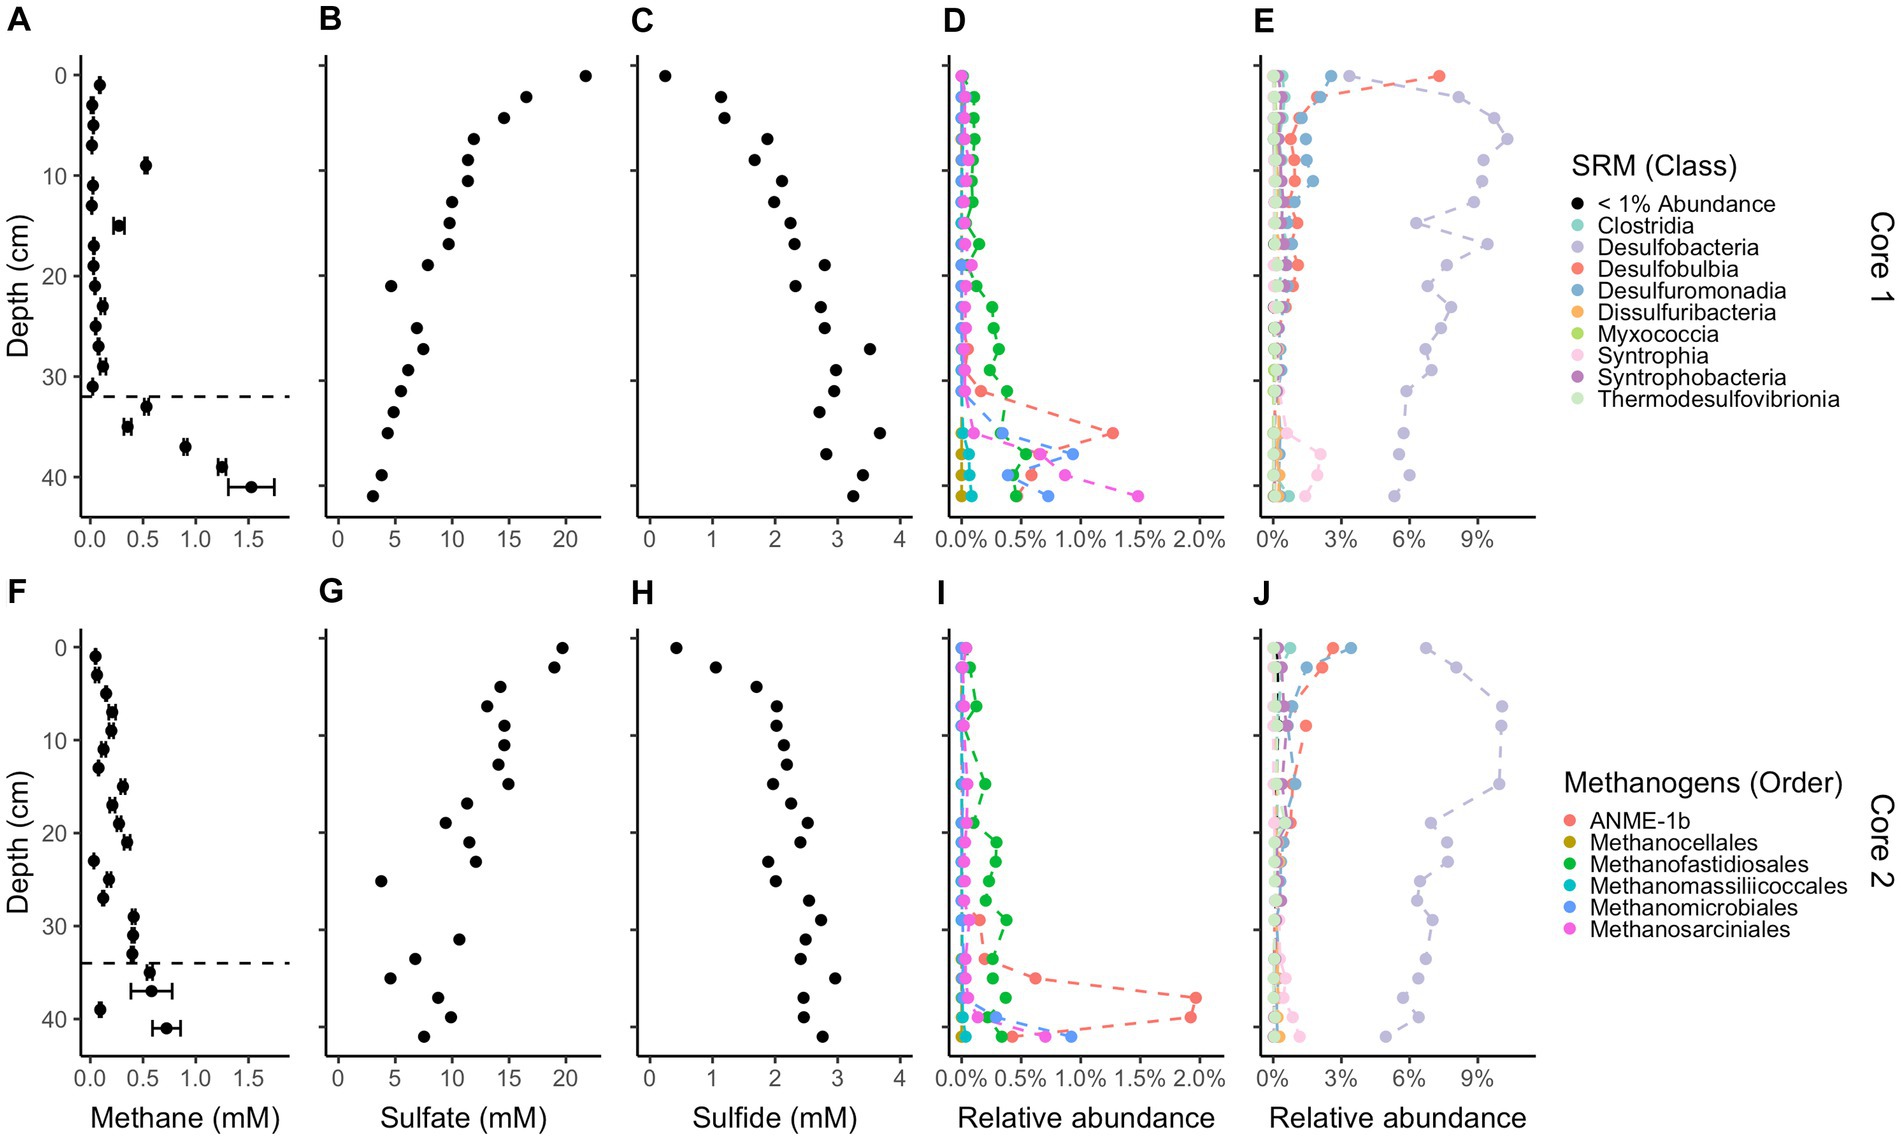
Figure 1. Downcore geochemistry and microbial composition. Concentrations of methane (A,F), sulfate (B,G), and sulfide (C,H). 16S rRNA gene amplicon relative abundances for likely methane-cycling archaea (D,I), and likely sulfate-reducing microbes (E,J), identified based on their similarity to cultured organisms (Muyzer and Stams, 2008; Winderl et al., 2010; Waite et al., 2020; Boeuf et al., 2021; Murphy et al., 2021; Umezawa et al., 2021; Malfertheiner et al., 2022; Seidel et al., 2023). Core 1 is on top and core 2 is on the bottom. Methane error bars denote triplicate measurements on a single sample. Dashed lines on methane plots denote the depths where methane accumulates below. Legends for likely methanogens/methanotrophs and likely sulfate-reducing microbes are the same for each core.
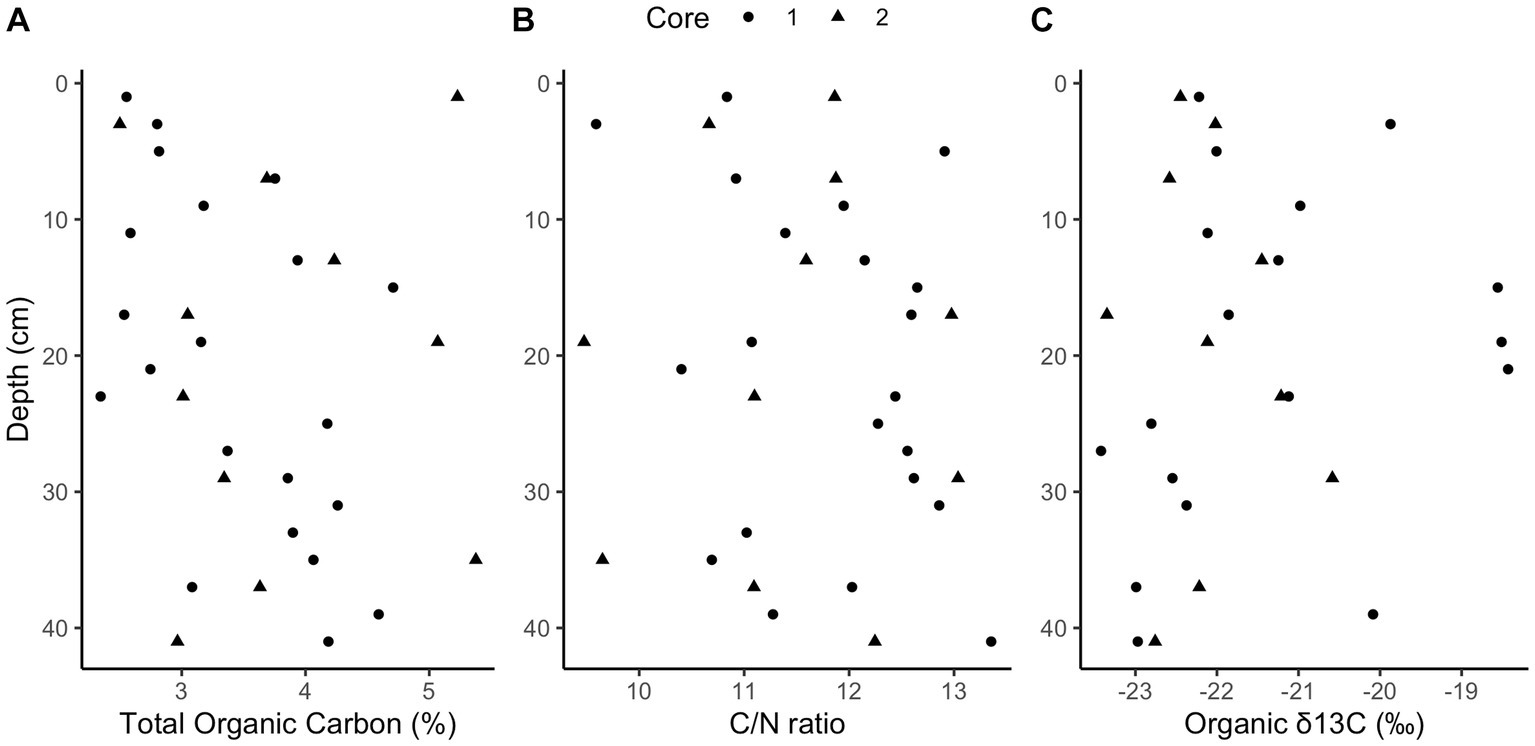
Figure 2. Elemental analysis. Downcore total organic carbon (TOC) concentrations (A, ranging from 2.4 to 5.4%), carbon to nitrogen ratios (B, ranging from 9 to 14), and organic stable isotope ratios (C, ranging from −18 to −23‰).
3.2. Microbial diversity of Cape Lookout Bight
Alpha diversity (Shannon index) of the 16S rRNA gene ASVs is 8.10 for all ASVs and 7.99 and 8.12 for core 1 and 2, respectively (Supplementary Figure S2). Non-metric multidimensional scaling (NMDS) ordination (stress <0.1) of Bray-Curtis dissimilarity distances for analyzing beta diversity show a strong correlation in taxonomy based on depth rather than which core they are from, signaling depth is a driving factor of microbial diversity present (Figure 3). Points on the NMDS plot are more distant at shallow depths while deeper microbial communities are more similar to each another, representing a convergence in communities with depth. Of the 24,987 observed ASVs (4,746,347 reads), 84.5% are Bacteria while the other 15.5% are Archaea. The total microbial distribution of phyla is shown in Supplementary Figure S3. There are 27 phyla with more than 1% abundance by ASV, and those with less than 1% are grouped into one category.
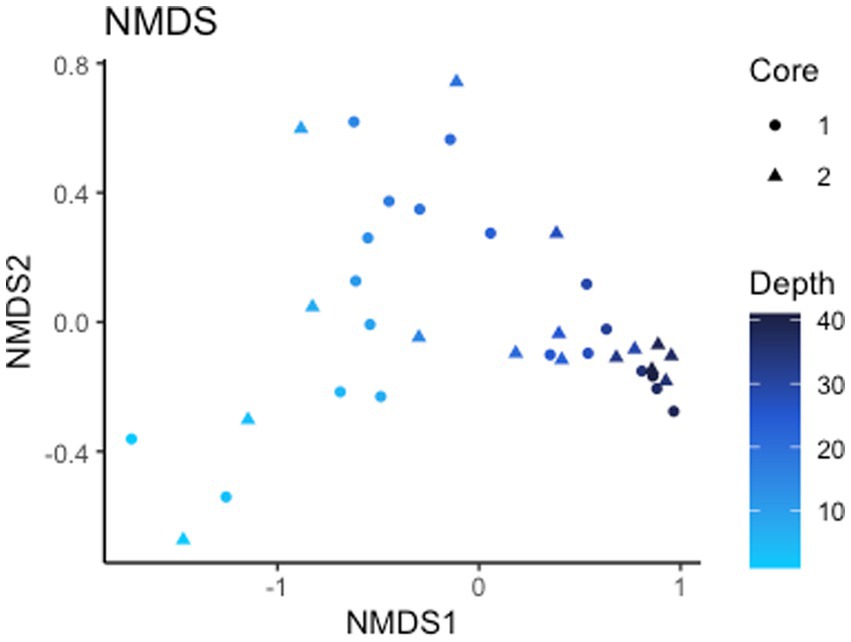
Figure 3. Beta diversity. NMDS of Bray-Curtis dissimilarity distances signifying depth is a driving factor of 16S rRNA gene ASV diversity.
3.3. Composition of methane-cycling archaea and sulfate-reducing bacteria
While sulfate is still in the mM range, total methanogen abundance in sediment is 0.64% by amplicon count and 1.98% below 32 cm. The exact averaged percent between cores per depth is in Supplementary Table S2. For both cores combined, ANME-1b (Ca. Methanophagales) comprises 94% of the ANME archaea population by amplicon read abundance (12,533 ANME-1b reads/13,289 ANME archaea reads), which has the most abundant reads among likely methanogens/methanotrophs, at 36.1%. The rest of the community of likely methanogens/methanotrophs consists of 27.6% Methanofastidiosales, 20.4% Methanosarciniales, 16.3% Methanomicrobiales, 1.7% Methanomassiliicoccales, and <0.1% Methanocellales. Methanomassiliicoccales and Methanofastidiosales are known to only use methylated compounds for methane production (Nobu et al., 2016; Vanwonterghem et al., 2016; Kröninger et al., 2017; Söllinger and Urich, 2019). Cultured representatives of all other methanogens can use the hydrogenotrophic pathway except Methanosarciniales which is capable of using all three methanogenic pathways, hydrogenotrophic, methylotrophic, and acetoclastic (Buan, 2018). Methanofastidiosales reads have no family-level assignment, Methanosarciniales are 58.6% Methanosaetaceae, 34.8% Methanosarcinaceae, and 10% ANME 2a/2b and 2c. Methanomicrobiales are 62.7% Methanomicrobiaceae, <0.1% Methanospirillaceae, and the rest have no family-level assignment. There is a large abundance of reads for sulfate-reducing bacteria with Desulfatiglans having the most at 159,603 reads, SEEP-SRB1 having 51,198 reads, SVA0081 sediment group having 43,336 reads, and the rest having less than 10,000 reads. The most populous class is Desulfobacteria (Figure 1) and contributes the majority of class-level taxonomy identified. On average, Desulfobacteria makes up 6–9% of total abundance. Methanofastidiosales (WSA2) and Methanosarciniales, both likely capable of methylotrophic methanogenesis (Reeve et al., 1997; Nobu et al., 2016), were present in the depths with little to no methane accumulation (Figure 1). The relative abundance of ANME-1 and Methanomicrobiales increase rapidly below 34 cmbsf in both cores, showing growth of the hydrogenotrophic methanogen community when methane accumulation occurs. The total relative abundance of likely sulfate-reducing bacteria remains similar throughout the cores. SEEP-SRB1, a sulfate-reducing bacteria with established connections to ANME archaea via consortia (Orphan et al., 2001), decreases with depth (R2 = 0.19, p-value = 0.004913, DF = 34, t-value = −3.009). 16S rRNA gene amplicon relative abundance of ANME-3, in the Methanococcoides, correlates with those of cultured groups of hydrogenotrophic methanogens seen during methane accumulation in Supplementary Figure S4. Likely methanogens/methanotrophs and sulfate reducers comprise a small proportion (<10%) of the total microbial population, as is commonly found in marine sediments (Colwell et al., 2008; Beulig et al., 2019; Kevorkian et al., 2022).
3.4. BES incubation—methanogenesis inhibition
Whole sediment incubations with BES (both 20 mM and 30 mM BES) in incubation experiment 1 show inhibition of methane production relative to BES-free controls for at least 28 days (p < 0.01 for 0 mM vs. 20 mM and 30 mM treatments, two-tailed t-test, DF = 7; Figure 4). During this time, the BES-free controls increased headspace methane concentrations to ~1,500 ppm, while methane did not increase at all in the vials with 20 mM and 30 mM BES (Figure 4). After the first month, BES inhibition was alleviated, since the 20 mM and 30 mM BES incubations increased in headspace methane concentrations. Biological BES degradation has previously been observed in microbial fuel cells (Rago et al., 2015) and community changes have been observed in BES incubations (Whiticar, 1999), suggesting that degradation of BES over time may have decreased its ability to inhibit methanogenesis. In all incubations, δ13C values for methane decrease, showing 13C-depletion from methanogenic inputs, about 20 days after methane concentrations start to increase. This lag time could show initial methylotrophic methanogenesis which does not have such a large isotopic fractionation as hydrogenotrophic or acetoclastic methanogenesis (Conrad, 2005; Salvador et al., 2019). The CO2 production was similar in all three experimental conditions, suggesting that the BES-inhibition of methane production was not due to general toxicity of BES to the microbial community.
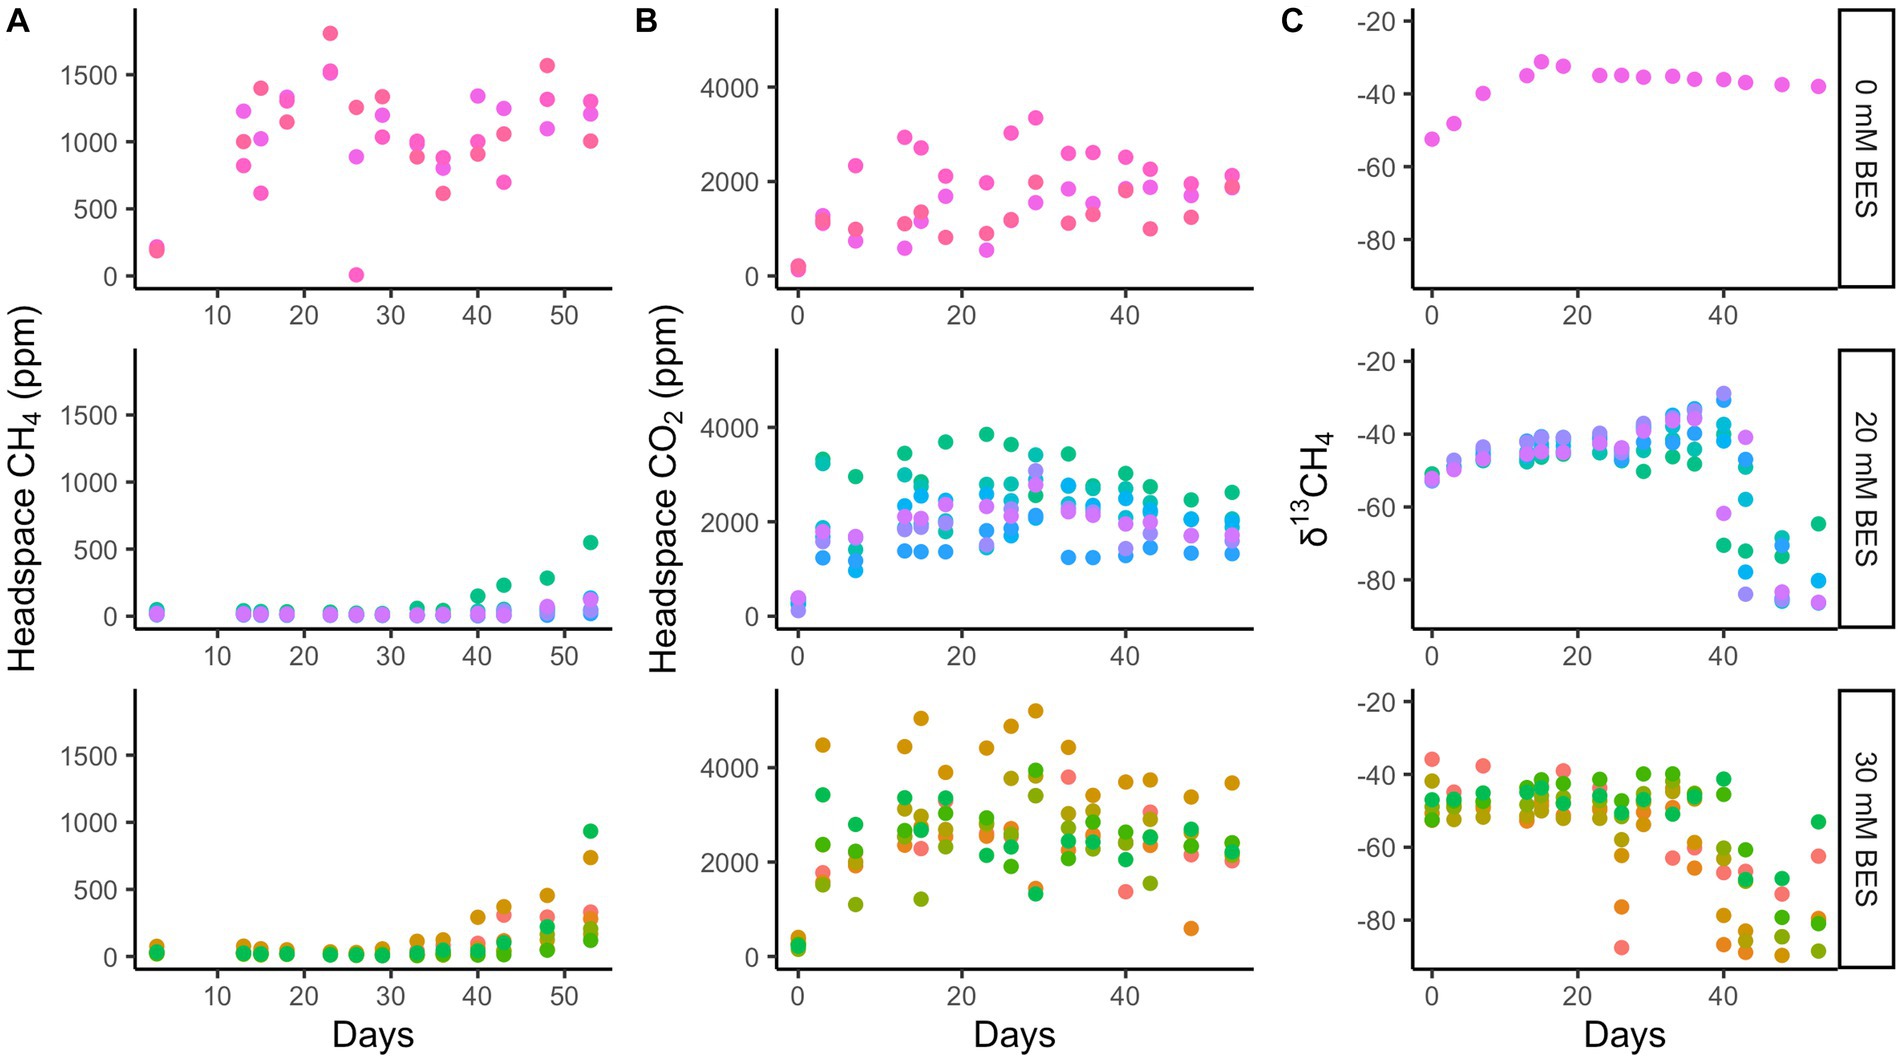
Figure 4. Incubation experiment 1. Bromoethanesulfonate (BES) experiment 1 results show suppression of methane production (A) with BES for 28 days, while CO2 production was enhanced with BES (B) and δ13CH4 shows no decrease until 40 days with BES (C). The different colors represent replicate incubations and are only there to help track one replicate throughout the whole time. Rows show 0 mM, 20 mM, and 30 mM BES, top to bottom.
In incubation experiment 2, methane production is inhibited in both the 0–8 cm and 8–16 cm sediment sections, since uninhibited headspace methane concentrations increased to a max of ~6,750 ppm over 35 days, while no increase occurred with 20 mM BES (p < 0.02 for 0 mM vs. 20 mM treatment, two-tailed t-test, DF = 11; Figure 5). As with experiment 1, inhibition of methane production was alleviated after this point, and δ13C values later decreased. The continual production of CO2 under all experimental conditions suggests that heterotrophy was not negatively affected by BES. Sediments from 0 to 8 cm produced more methane than sediments from 8 to 16 cm, especially after ~30 days in the BES experiments, after BES-inhibition was alleviated.
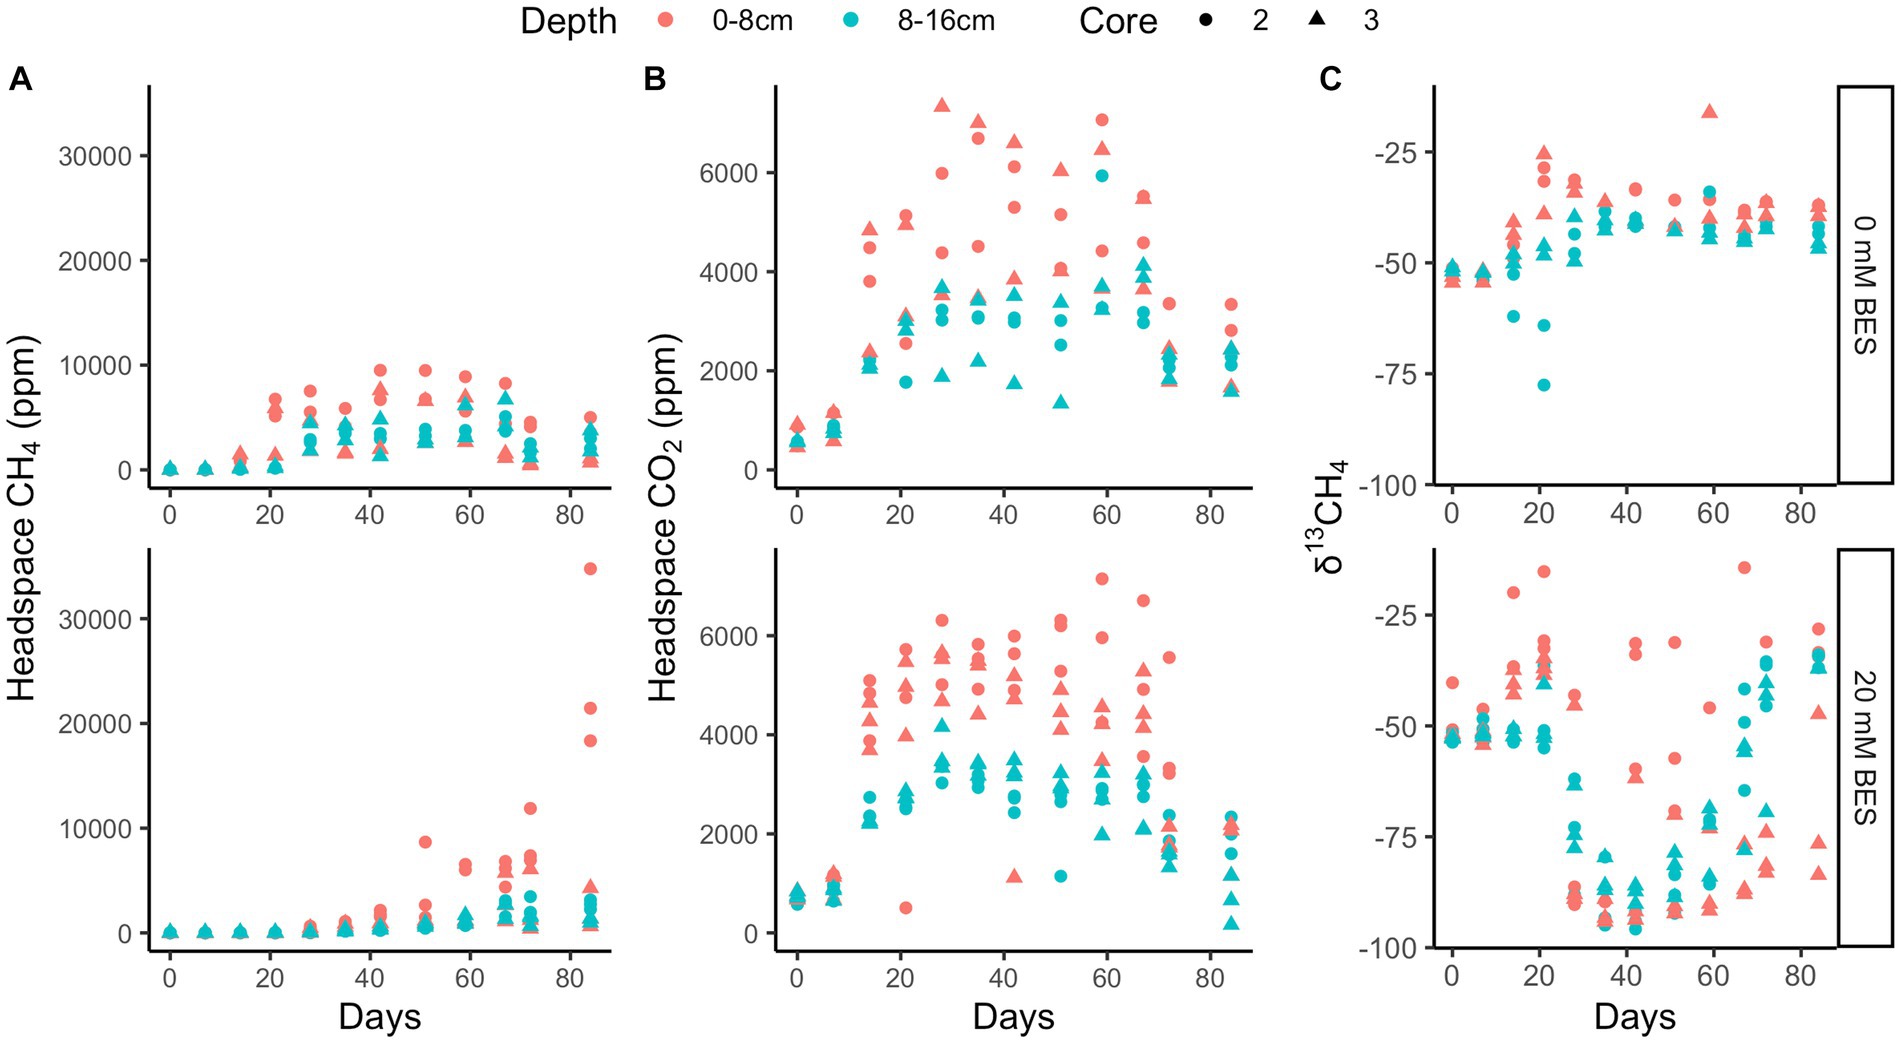
Figure 5. Incubation experiment 2. BES experiment 2 results show higher methane production both post-inhibition in 0–8 cm than 8–16 cm depth layers that is inhibited by 20 mM BES over 20 days and 0 mM treated incubations (A), higher CO2 production in 0–8 cm than 8–16 cm depth layers that persists in the presence of 20 mM BES (B) and δ13CH4 showing methanogenesis post-inhibition at 20 days (C). The different shapes represent replicate incubations.
4. Discussion
Downcore changes in concentrations of methane and sulfate, 16S rRNA gene amplicon surveys, and incubation results suggest that methane accumulation due to a lack of net AOM occurs simultaneously to sulfate reduction while sulfate is still abundant (6–8 mM) in Cape Lookout Bight, NC.
4.1. Methane accumulation in the sulfate-rich sediments of Cape Lookout Bight
Previous studies have shown that the shift from net methane oxidation to net methane production occurs at the inflection point where the methane curve switches from concave up to concave down (Lloyd et al., 2011). Above this depth in sediments where net AOM occurs, the δ13C values of methane show net AOM by their gradual enrichment in 13C as methane fluxes upwards, delineating the shift from biological removal to biological production (Alperin et al., 1992). This depth often has equimolar concentrations of methane and sulfate (Iversen and Jorgensen, 1985), and methane only begins to accumulate below this depth where sulfate concentrations are very low (<0.5 mM). These trends have been observed in Eckernförde Bay (Martens et al., 1998), White Oak River estuary (Lloyd et al., 2011), Skagerrak Bay (Beulig et al., 2019), Aarhus Bay (Krause et al., 2023), Santa Barbara Basin (Komada et al., 2016), and elsewhere. In contrast to these canonical methane and sulfate profiles, our results show that methane concentrations increase below ~30 cm while sulfate concentrations are high (6 and 8 mM) and reach >0.5 mM while sulfate concentrations are still high (~5 mM) in both cores. Sulfate and sulfide concentrations profiles show that this methane accumulation occurs at depth layers where sulfate reduction also occurs. Others have reported similar profiles in CLB (Hoehler et al., 1994; Martens et al., 1998; Sturdivant and Shimizu, 2017) and Beidagang Wetland Nature Reserve (La et al., 2022). This means that in CLB, sulfate may not need to be completely depleted and sulfate reduction may not need to stop before methane accumulation begins.
The increase in methane concentrations at 32 cm in core 1 and 34 cm in core 2 coincides with an increase in MCR-containing groups of archaea, such as Methanomicrobiales, Methanosarciniales, and ANME-1, all capable of hydrogenotrophic methanogenesis (Buan, 2018). We attribute these methanogens as the main drivers of methane accumulation in our samples. The only other highly prevalent methanogen, Methanofastidiosales, does not peak after 30 cm but rather gradually increases and is predicted to be only capable of methyl-based methanogenesis (Nobu et al., 2016; Vanwonterghem et al., 2016). Methanofastidiosales may be a key driver of methane production in the upper cm of sediment before methane accumulation begins. This set of methane-producing archaea are commonly seen in marine sediments (Oremland and Polcin, 1982; Thauer et al., 2008; Xiao et al., 2017). When sediment from this same site was incubated previously, many of the same archaea were present (Zhuang et al., 2017). The presence of ANME-1 in a site with no evidence for net AOM in any season provides some evidence for the ability of this clade to produce methane and drive methane accumulation in marine sediment [as suggested in Lloyd et al. (2011) and Beulig et al. (2019)], though as stated earlier there may be instances of AOM while the general process in these sediments is not methane oxidation. In estuarine sediments where AOM occurs, peaks in ANME-1 coincide with peaks in sulfate reducers (Kevorkian et al., 2021), which is not the case in our current study.
4.2. Biological methane production accounts for methane accumulation in sulfate-rich sediments
The addition of 20 or 30 mM BES stops methane from accumulating for at least 20–28 days compared to BES-free incubations. As BES inhibits the MCR enzyme essential for methanogenesis and AOM (Alperin and Reeburgh, 1985; Webster et al., 2016) and the addition inhibits methane accumulation, the methane production seen in the controls must be from a biotic source for sediments up to 23 cmbsf in experiment 1 and up to 16 cmbsf in experiment 2. This shows that depths before sulfate depletion are capable of biological methane production, whether it accumulates or not. In fact, the 0–8 cmbsf section, where sulfate concentrations were higher, has greater methane production than deeper samples.
4.3. Methylotrophic methanogenesis throughout the sulfate-rich sediments
The potential for methane production above the depth where it begins to accumulate in sulfate-rich sediments is supported by 16S rRNA results showing that methylotrophic methanogens Methanosarciniales and Methanofastidiosales are present, which have been observed in other marine sediments (Nobu et al., 2016; Zhuang et al., 2017, 2018; Xu et al., 2021). Dominance of methylotrophic methanogens in these conditions makes sense, as it has been shown that methanogens can use methylated compounds for which sulfate reducers do not compete (Zhuang et al., 2016). While methylated compounds have been shown to be at low abundance in marine sediments, depleting rapidly with depth (Henrichs and Reeburgh, 1987; LaRowe et al., 2020), thermodynamic favorability was still observed in many studies (Martens and Klump, 1984; Canfield, 1989; Xiao et al., 2017). These methylotrophic methanogens may support the small concentrations of methane above ~30 cm in these cores. Our BES inhibition experiments support the possibility of methylotrophic methanogenesis in upper sediments since the initial methane increases were not accompanied by decreases in δ13CH4 values. It is also possible that the greater methane production in the 0–8 cm (vs. the 8–16 cm sediments) after alleviation of BES inhibition was due to demethylation of BES or its degradation products. This post-inhibition methane production was much greater than that observed in the controls.
4.4. Reversible hydrogenotrophic methanogenesis
Previous work provides a possible explanation for why methane accumulates before sulfate is depleted in our cores. To meet microbial maintenance requirements, a chemical reaction cannot simply be exergonic (i.e., negative ΔG value). It must exceed the energetic demand for maintenance energy, called the “biological energy quantum,” which has been measured to be ~10 kJ/mol for hydrogenotrophic methanogenesis in CLB sediments (Hoehler et al., 2001). Given that hydrogen has a stoichiometry of 4 relative to all the other products and reactants of hydrogenotrophic methanogenesis (4H2 + CO2 → CH4 + 2H2O), hydrogen largely controls the value of ΔG (Figure 6). Hydrogen has been shown to increase slightly as sulfate starts to become energetically limiting and hydrogen concentrations rise to compensate (Hoehler et al., 2001; Zhuang et al., 2017; Kevorkian et al., 2022). Many values for hydrogen fall within the “no reaction zone” where neither forward or reverse hydrogenotrophic methanogenesis meets the biological energy quantum and therefore neither supports cellular maintenance or growth. As sulfate is depleted, the increase in hydrogen, and presumably other intermediates like acetate, enables forward hydrogenotrophic methanogenesis to support cellular maintenance. Since the CLB is an area of very high organic matter lability, hydrogen concentrations may rise high enough to prevent AOM even when sulfate is present because the fermentative hydrogen flux is so high that sulfate reducers are limited by something other than hydrogen and no longer pull it to its lowest thermodynamic limit. Evidence of this increased fermentative hydrogen flux comes from the previously mentioned high rates of sedimentation and our high TOC measurements with the main drivers of fermentation likely Chloroflexi and Bacteroidota in CLB. In sites where organic matter is more recalcitrant, simultaneous sulfate reduction and methane accumulation are often not observed (Lloyd et al., 2011). In general, there is far less energy to be gained from AOM than from hydrogenotrophic methanogenesis, not because it is an inherently less energetic reaction but because there is a lower limit on hydrogen concentrations in marine sediments. The range of hydrogen concentrations that have been previously measured in marine sediments allow for a minimum ΔG of about −25 kJ/mol for AOM and a much more energetic minimum of −45 kJ/mol for hydrogenotrophic methanogenesis (Figure 6). The exact amounts depend on the concentrations of all other constituents in the reaction, but the mathematical dominance of hydrogen on ΔG allows these estimations to be useful for comparing sediments with different hydrogen concentrations. When ΔG is more negative than −10 kJ/mol, AOM through reverse hydrogenotrophic methanogenesis meets the biological energy quantum and can support cell maintenance. When ΔG is more positive than 10 kJ/mol, hydrogenotrophic methanogenesis meets the biological energy quantum and can support cell maintenance. Between −10 and +10 kJ/mol the biological energy quantum is not met and no biologically catalyzed reaction will occur. The disparity in possible energy yields for AOM vs. methanogenesis may explain why culturing archaea in low hydrogen conditions to stimulate AOM leads to slow or no replication since having enough energy to replicate would require much lower hydrogen conditions than needed to just meet the BEQ. If AOM occurred through direct interspecies electron transfer at CLB sediments, then it should prevent the accumulation of methane when sulfate is present. Since that does not occur, reversible hydrogenotrophic methanogenesis is a more likely explanation.
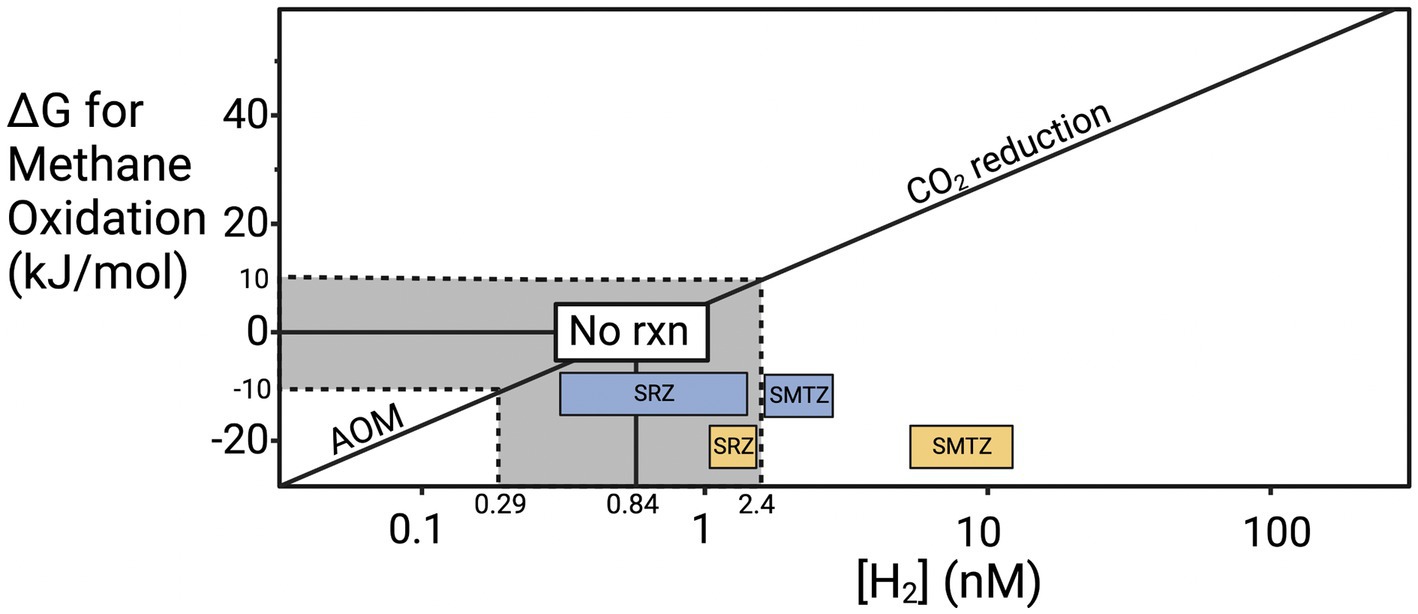
Figure 6. Hydrogen controls on the ΔG of anaerobic methane oxidation. Update of the “Biological energy quantum” plot from Hoehler et al. (1994), showing the ΔG values for AOM at the range of H2 concentrations that have been measured in marine environments (0.14–205 nM) under typical conditions at CLB (Conrad et al., 1985; Hoehler et al., 1998, 2001; Lin et al., 2012; Zhuang et al., 2017; Kevorkian et al., 2022; Lappan et al., 2023). The line modeling the ΔG values was calculated based on average CH4 and HCO3− concentrations back calculated from Klump and Martens (1989) and Boehme (1993) (CH4 ≈ 0.53 mM and HCO3− ≈ 48.4 mM).
This proposed mechanism relies on excess hydrogen from high fermentation rates. Two known common phyla of fermenters are present and potentially producing much of the available hydrogen by fermenting the relatively high concentrations of organic matter (Kendall et al., 2007). Chloroflexi and Bacteroidota (also known as Bacteroidetes) are roughly a quarter of the population by amplicon count (Supplementary Figure S3). The high TOC seen in Figure 2 and the previously measured high anaerobic remineralization rates (Martens et al., 1998; Sprenger et al., 2000; Underwood et al., 2016; Kevorkian et al., 2018) suggest high levels of fermentation from these phyla and potentially others, which would yield hydrogen to help power methanogenesis in the presence of sulfate.
5. Conclusion
We present 16S rRNA data for microbial communities in duplicate cores of organic-rich sediments of Cape Lookout Bight, NC, where methane accumulates in the presence of 6–8 mM sulfate while sulfate reduction also occurs. This lack of AOM during sulfate reduction may be the result of the highly labile organic matter allowing for fermentation to supply excess hydrogen that sulfate-reducing bacteria do not completely use. Methane accumulation below ~30 cm in the sulfate-rich sediments is accompanied by increases in ANME-1, Methanosarciniales and Methanomicrobiales, but not sulfate-reducing bacteria. Methanofastidiosales is present throughout the sediments and may account for methylotrophic methanogenesis which results in little methane accumulation. Methane production throughout these sediments is biotic since it is inhibited by BES. These results support the theory of reversible hydrogenotrophic methanogenesis as the main driver for AOM and methanogenesis in coastal marine sediments since the presence of sulfate alone is insufficient to prevent methane accumulation.
Data availability statement
The datasets presented in this study can be found in online repositories. The names of the repository/repositories and accession number(s) can be found at: https://www.ncbi.nlm.nih.gov/, PRJNA949635.
Author contributions
GC: Conceptualization, Data curation, Formal analysis, Investigation, Methodology, Resources, Software, Visualization, Writing – original draft, Writing – review & editing. PD: Conceptualization, Investigation, Methodology, Resources, Writing – review & editing. RP: Investigation, Resources, Software, Visualization, Writing – review & editing. JB: Investigation, Resources, Software, Writing – review & editing. KL: Conceptualization, Funding acquisition, Methodology, Project administration, Resources, Supervision, Writing – review & editing.
Funding
The author(s) declare financial support was received for the research, authorship, and/or publication of this article. This project was funded by NSF Chemical Oceanography grant #OCE-1948720. US Department of Energy, Office of Science, Office of Biological and Environmental Research, Genomic Science Program (DE-SC0020369).
Acknowledgments
We thank Joy Buongiorno, Katie Sipes, Howard P. Mendlovitz, Zachary W. Hudspeth, Josh Morningstar, Timothy J. Rogers, and Christopher S. Martens for help retrieving sediment samples, Niels Lindquist for the use of his lab space at the UNC Institute for Marine Sciences, Veronica Brown for DNA sequencing expertise, Anthony Faiia for his elemental analysis expertise, Frank Löffler for use of his ion and gas chromatographs, Cynthia Swift for operating chromatographs, and Marc Alperin for helping with ΔG calculations.
Conflict of interest
The authors declare that the research was conducted in the absence of any commercial or financial relationships that could be construed as a potential conflict of interest.
Publisher’s note
All claims expressed in this article are solely those of the authors and do not necessarily represent those of their affiliated organizations, or those of the publisher, the editors and the reviewers. Any product that may be evaluated in this article, or claim that may be made by its manufacturer, is not guaranteed or endorsed by the publisher.
Supplementary material
The Supplementary material for this article can be found online at: https://www.frontiersin.org/articles/10.3389/fmicb.2023.1268361/full#supplementary-material
References
Alperin, M. J.. The carbon cycle in an anoxic marine sediment: Concentrations, rates, isotope ratios, and diagenetic models. (1988). Available at: https://scholarworks.alaska.edu/handle/11122/5340 (Accessed August 19, 2023).
Alperin, M. J., Blair, N. E., Albert, D. B., Hoehler, T. M., and Martens, C. S. (1992). Factors that control the stable carbon isotopic composition of methane produced in an anoxic marine sediment. Glob. Biogeochem. Cycles 6, 271–291. doi: 10.1029/92GB01650
Alperin, M. J., and Reeburgh, W. S. (1985). Inhibition experiments on anaerobic methane oxidation. Appl. Environ. Microbiol. 50, 940–945. doi: 10.1128/aem.50.4.940-945.1985
Beal, E. J., House, C. H., and Orphan, V. J. (2009). Manganese- and Iron-dependent marine methane oxidation. Science 325, 184–187. doi: 10.1126/science.1169984
Beulig, F., Røy, H., McGlynn, S. E., and Jørgensen, B. B. (2019). Cryptic CH 4 cycling in the sulfate–methane transition of marine sediments apparently mediated by ANME-1 archaea. ISME J. 13, 250–262. doi: 10.1038/s41396-018-0273-z
Boehme, S. E. (1993). The carbon isotope biogeochemistry of a methanogenic marine sediment. North Carolina State University.
Boeuf, D., Eppley, J. M., Mende, D. R., Malmstrom, R. R., Woyke, T., and DeLong, E. F. (2021). Metapangenomics reveals depth-dependent shifts in metabolic potential for the ubiquitous marine bacterial SAR324 lineage. Microbiome 9:172. doi: 10.1186/s40168-021-01119-5
Buan, N. R. (2018). Methanogens: pushing the boundaries of biology. Emerg. Top. Life Sci. 2, 629–646. doi: 10.1042/ETLS20180031
Buongiorno, J., Herbert, L. C., Wehrmann, L. M., Michaud, A. B., Laufer, K., Røy, H., et al. (2019). Complex microbial communities drive Iron and sulfur cycling in Arctic Fjord sediments. Appl. Environ. Microbiol. 85, e00949–e00919. doi: 10.1128/AEM.00949-19
Callahan, B. J., McMurdie, P. J., Rosen, M. J., Han, A. W., Johnson, A. J. A., and Holmes, S. P. (2016). DADA2: high-resolution sample inference from Illumina amplicon data. Nat. Methods 13, 581–583. doi: 10.1038/nmeth.3869
Canfield, D. E. (1989). Sulfate reduction and oxic respiration in marine sediments: implications for organic carbon preservation in euxinic environments. Deep Sea Res. Part Oceanogr. Res. Pap. 36, 121–138. doi: 10.1016/0198-0149(89)90022-8
Canuel, E. A., and Martens, C. S. (1993). Seasonal variations in the sources and alteration of organic matter associated with recently-deposited sediments. Curric. Mar. Sci. 20, 563–577. doi: 10.1016/0146-6380(93)90024-6
Chanton, J. P., Martens, C. S., and Kipphut, G. W. (1983). Lead-210 sediment geochronology in a changing coastal environment, vol. 47 S’. London, United Kingdom: Pergamon Press Ltd, 1791–1804.
Cline, J. (1969). Spectrophotometric determination of hydrogen sulfide in natural waters. Limnol. Oceanogr. 14, 454–458. doi: 10.4319/lo.1969.14.3.0454
Colwell, F. S., Boyd, S., Delwiche, M. E., Reed, D. W., Phelps, T. J., and Newby, D. T. (2008). Estimates of biogenic methane production rates in deep marine sediments at hydrate ridge, Cascadia margin. Appl. Environ. Microbiol. 74, 3444–3452. doi: 10.1128/AEM.02114-07
Conrad, R. (2005). Quantification of methanogenic pathways using stable carbon isotopic signatures: a review and a proposal. Org. Geochem. 36, 739–752. doi: 10.1016/j.orggeochem.2004.09.006
Conrad, R., Phelps, T. J., and Zeikus, J. G. (1985). Gas metabolism evidence in support of the juxtaposition of hydrogen-producing and methanogenic bacteria in sewage sludge and lake sediments. Appl. Environ. Microbiol. 50, 595–601. doi: 10.1128/aem.50.3.595-601.1985
Etheridge, D. M., Steele, L. P., Francey, R. J., and Langenfelds, R. L. (1998). Atmospheric methane between 1000 A.D. and present: evidence of anthropogenic emissions and climatic variability. J. Geophys. Res. Atmospheres. 103, 15979–15993. doi: 10.1029/98JD00923
Fuller, K. M., Fox, A. L., Jacoby, C. A., and Trefry, J. H. (2021). Biological abundance and diversity in organic-rich sediments from a Florida Barrier Island lagoon. Front. Mar. Sci. 8:768083. doi: 10.3389/fmars.2021.768083
Hallam, S. J., Putnam, N., Preston, C. M., Detter, J. C., Rokhsar, D., Richardson, P. M., et al. (2004). Reverse Methanogenesis: testing the hypothesis with Environmental genomics. Science 305, 1457–1462. doi: 10.1126/science.1100025
Haroon, M. F., Hu, S., Shi, Y., Imelfort, M., Keller, J., Hugenholtz, P., et al. (2013). Anaerobic oxidation of methane coupled to nitrate reduction in a novel archaeal lineage. Nature 500, 567–570. doi: 10.1038/nature12375
Henrichs, S. M., and Reeburgh, W. S. (1987). Anaerobic mineralization of marine sediment organic matter: rates and the role of anaerobic processes in the oceanic carbon economy. Geomicrobiol J. 5, 191–237. doi: 10.1080/01490458709385971
Hoehler, T. M., Alperin, M. J., Albert, D. B., and Martens, C. S. (1998). Thermodynamic control on hydrogen concentrations in anoxic sediments. Geochim. Cosmochim. Acta 62, 1745–1756. doi: 10.1016/S0016-7037(98)00106-9
Hoehler, T. M., Alperin, M. J., Albert, D. B., and Martens, C. S. (2001). Apparent minimum free energy requirements for methanogenic Archaea and sulfate-reducing bacteria in an anoxic marine sediment. FEMS Microbiol. Ecol. 38, 33–41. doi: 10.1111/j.1574-6941.2001.tb00879.x
Hoehler, T. M., Alperin, M. J., Albert, D. B., and Martins, C. S. (1994). Field and laboratory studies of methane oxidation in an anoxic marine sediment: evidence for a methanogen-sulfate reducer consortium. Glob. Biogeochem. Cycles 8, 451–463. doi: 10.1029/94GB01800
Iversen, N., and Jorgensen, B. B. (1985). Anaerobic methane oxidation rates at the sulfate-methane transition in marine sediments from Kattegat and Skagerrak (Denmark)1. Limnol. Oceanogr. 30, 944–955. doi: 10.4319/lo.1985.30.5.0944
Kendall, M. M., Wardlaw, G. D., Tang, C. F., Bonin, A. S., Liu, Y., and Valentine, D. L. (2007). Diversity of Archaea in marine sediments from Skan Bay, Alaska, including cultivated methanogens, and description of Methanogenium boonei sp. nov. Appl. Environ. Microbiol. 73, 407–414. doi: 10.1128/AEM.01154-06
Kevorkian, R., Bird, J. T., Shumaker, A., and Lloyd, K. G. (2018). Estimating population turnover rates by relative quantification methods reveals microbial dynamics in marine sediment. Appl. Environ. Microbiol. 84:e01443-17. doi: 10.1128/AEM.01443-17
Kevorkian, R. T., Callahan, S., Winstead, R., and Lloyd, K. G. (2021). ANME-1 archaea may drive methane accumulation and removal in estuarine sediments. Environ. Microbiol. Rep. 13, 185–194. doi: 10.1111/1758-2229.12926
Kevorkian, R. T., Sipes, K., Winstead, R., Paul, R., and Lloyd, K. G. (2022). Cryptic methane-cycling by methanogens during multi-year incubation of estuarine sediment. Front. Microbiol. 13:13. doi: 10.3389/fmicb.2022.847563
Klump, J. V., and Martens, C. S. (1989). The seasonality of nutrient regeneration in an organic-rich coastal sediment: kinetic modeling of changing pore-water nutrient and sulfate distributions. Limnol. Oceanogr. 34, 559–577. doi: 10.4319/lo.1989.34.3.0559
Knab, N. J., Cragg, B. A., Hornibrook, E. R. C., Holmkvist, L., Borowski, C., Parkes, R. J., et al. (2008). Regulation of anaerobic methane oxidation in sediments of the Black Sea. Biogeosci. Discuss. 5:2305. doi: 10.5194/bg-6-1505-2009
Komada, T., Burdige, D. J., Li, H. L., Magen, C., Chanton, J. P., and Cada, A. K. (2016). Organic matter cycling across the sulfate-methane transition zone of the Santa Barbara Basin, California Borderland. Geochim. Cosmochim. Acta 176, 259–278. doi: 10.1016/j.gca.2015.12.022
Krause, S. J. E., Liu, J., Yousavich, D. J., Robinson, D., Hoyt, D., Qin, Q., et al. (2023). Evidence of cryptic methane cycling and non-methanogenic methylamine consumption in the sulfate-reducing zone of sediment in the Santa Barbara Basin, California. EGUsphere 2023, 1–38. doi: 10.5194/egusphere-2023-909
Kröninger, L., Gottschling, J., and Deppenmeier, U. (2017). Growth characteristics of Methanomassiliicoccus luminyensis and expression of methyltransferase encoding genes. Archaea 2017:e2756573, 1–12. doi: 10.1155/2017/2756573
La, W., Han, X., Liu, C. Q., Ding, H., Liu, M., Sun, F., et al. (2022). Sulfate concentrations affect sulfate reduction pathways and methane consumption in coastal wetlands. Water Res. 217:118441. doi: 10.1016/j.watres.2022.118441
Lappan, R., Shelley, G., Islam, Z. F., Leung, P. M., Lockwood, S., Nauer, P. A., et al. (2023). Molecular hydrogen in seawater supports growth of diverse marine bacteria. Nat. Microbiol. 8, 581–595. doi: 10.1038/s41564-023-01322-0
LaRowe, D. E., Arndt, S., Bradley, J. A., Estes, E. R., Hoarfrost, A., Lang, S. Q., et al. (2020). The fate of organic carbon in marine sediments - new insights from recent data and analysis. Earth-Sci. Rev. 204:103146. doi: 10.1016/j.earscirev.2020.103146
Larowe, D. E., Dale, A. W., and Regnier, P. (2008). A thermodynamic analysis of the anaerobic oxidation of methane in marine sediments. Geobiology 6, 436–449. doi: 10.1111/j.1472-4669.2008.00170.x
Lin, Y. S., Heuer, V. B., Goldhammer, T., Kellermann, M. Y., Zabel, M., and Hinrichs, K. U. (2012). Towards constraining H2 concentration in subseafloor sediment: a proposal for combined analysis by two distinct approaches. Geochim. Cosmochim. Acta 77, 186–201. doi: 10.1016/j.gca.2011.11.008
Liu, Y., and Whitman, W. B. (2008). “Metabolic, phylogenetic, and ecological diversity of the methanogenic archaea” in Annals of the new York Academy of Sciences, vol. 1125 (Oxford, United Kingdom: Blackwell Publishing Inc.), 171–189.
Lloyd, K. G., Alperin, M. J., and Teske, A. (2011). Environmental evidence for net methane production and oxidation in putative ANaerobic MEthanotrophic (ANME) archaea. Environ. Microbiol. 13, 2548–2564. doi: 10.1111/j.1462-2920.2011.02526.x
Malfertheiner, L., Martínez-Pérez, C., Zhao, Z., Herndl, G. J., and Baltar, F. (2022). Phylogeny and metabolic potential of the candidate phylum SAR324. Biology 11:599. doi: 10.3390/biology11040599
Maltby, J., Steinle, L., Löscher, C. R., Bange, H. W., Fischer, M. A., Schmidt, M., et al. (2018). Microbial methanogenesis in the sulfate-reducing zone of sediments in the Eckernförde Bay, SW Baltic Sea. Biogeosciences 15, 137–157. doi: 10.5194/bg-15-137-2018
Martens, C. S., Albert, D. B., and Alperin, M. J. (1998). Biogeochemical processes controlling methane in gassy coastal sediments-part 1. A model coupling organic matter flux to gas production, oxidation and transport. Continen. Shelf Res. 18, 1741–1770. doi: 10.1016/S0278-4343(98)00056-9
Martens, C. S., Haddad, R. I., and Chanton, J. P. (1992). Organic matter accumulation. Remineralization Buriel Anoxic Coastal Sediment, 82–98.
Martens, C. S., and Klump, J. V. (1984). Biogeochemical cycling in an organic-rich coastal marine basin 4. An organic carbon budget for sediments dominated by sulfate reduction and methanogenesis. Geochim. Cosmochim. Acta 48, 1987–2004. doi: 10.1016/0016-7037(84)90380-6
Mau, S., Römer, M., Torres, M. E., Bussmann, I., Pape, T., Damm, E., et al. (2017). Widespread methane seepage along the continental margin off Svalbard-from Bjørnøya to Kongsfjorden. Sci. Rep. 7:7. doi: 10.1038/srep42997
McGlynn, S. E., Chadwick, G. L., Kempes, C. P., and Orphan, V. J. (2015). Single cell activity reveals direct electron transfer in methanotrophic consortia. Nature 526, 531–535. doi: 10.1038/nature15512
McMurdie, P. J., and Holmes, S. (2013). Phyloseq: an R package for reproducible interactive analysis and graphics of microbiome census data. PLoS One 8:e61217. doi: 10.1371/journal.pone.0061217
Murphy, C. L., Yang, R., Decker, T., Cavalliere, C., Andreev, V., Bircher, N., et al. (2021). Genomes of novel Myxococcota reveal severely curtailed machineries for predation and cellular differentiation. Appl. Environ. Microbiol. 87, e01706–e01721. doi: 10.1128/AEM.01706-21
Muyzer, G., and Stams, A. J. M. (2008). The ecology and biotechnology of sulphate-reducing bacteria. Nat. Rev. Microbiol. 6, 441–454. doi: 10.1038/nrmicro1892
Nobu, M. K., Narihiro, T., Kuroda, K., Mei, R., and Liu, W. T. (2016). Chasing the elusive Euryarchaeota class WSA2: genomes reveal a uniquely fastidious methyl-reducing methanogen. ISME J. 10, 2478–2487. doi: 10.1038/ismej.2016.33
Oremland, R. S., and Polcin, S. (1982). Methanogenesis and sulfate reduction: competitive and noncompetitive substrates in estuarine sediments. Appl. Environ. Microbiol. 44, 1270–1276. Available from: https://journals.asm.org/journal/aem
Orphan, V. J., House, C. H., Hinrichs, K. U., McKeegan, K. D., and DeLong, E. F. (2001). Methane-consuming archaea revealed by directly coupled isotopic and phylogenetic analysis. Science. 293, 484–7. doi: 10.1126/science.1061338
Parkes, R. J., Cragg, B. A., Banning, N., Brock, F., Webster, G., Fry, J. C., et al. (2007). Biogeochemistry and biodiversity of methane cycling in subsurface marine sediments (Skagerrak, Denmark). Environ. Microbiol. 9, 1146–1161. doi: 10.1111/j.1462-2920.2006.01237.x
Quast, C., Pruesse, E., Yilmaz, P., Gerken, J., Schweer, T., Yarza, P., et al. (2013). The SILVA ribosomal RNA gene database project: improved data processing and web-based tools. Nucleic Acids Res. 41, D590–D596. doi: 10.1093/nar/gks1219
R Core Team. R: A language and environment for statistical computing. R Foundation for Statistical Computing: Vienna; (2021). Available at: https://www.R-project.org/.
Rago, L., Guerrero, J., Baeza, J. A., and Guisasola, A. (2015). 2-Bromoethanesulfonate degradation in bioelectrochemical systems. Bioelectrochem. Amst Neth. 105, 44–49. doi: 10.1016/j.bioelechem.2015.05.001
Reeburgh, W. S. (2007). Oceanic methane biogeochemistry. Chem. Rev. 107, 486–513. doi: 10.1021/cr050362v
Reeburgh, W. S., Ward, B. B., Whalen, S. C., Sandbeck, K. A., Kilpatrick, K. A., and Kerkhoft, L. J. (1991). Black Sea methane geochemistry. Deep Sea Res. 38, S1189–S1210. doi: 10.1016/S0198-0149(10)80030-5
Reeve, J. N., Nölling, J., Morgan, R. M., and Smith, D. R. (1997). Methanogenesis: genes, genomes, and who’s on first? J. Bacteriol. 179, 5975–5986. doi: 10.1128/jb.179.19.5975-5986.1997
RStudio Team. RStudio: Integrated development for R. Boston, MA: RStudio, PBC; (2020). Available at: http://www.rstudio.com/.
Ruffine, L., Donval, J. P., Croguennec, C., Burnard, P., Lu, H., Germain, Y., et al. (2018). Multiple gas reservoirs are responsible for the gas emissions along the Marmara fault network. Deep Sea Res. Part II Top. Stud. Oceanogr. 153, 48–60. doi: 10.1016/j.dsr2.2017.11.011
Salvador, A. F., Cavaleiro, A. J., Paulo, A. M. S., Silva, S. A., Guedes, A. P., Pereira, M. A., et al. (2019). Inhibition studies with 2-Bromoethanesulfonate reveal a novel syntrophic relationship in anaerobic Oleate degradation. Appl. Environ. Microbiol. 85, e01733–e01718. doi: 10.1128/AEM.01733-18
Santegoeds, C. M., Damgaard, L. R., Hesselink, G., Zopfi, J., Lens, P., Muyzer, G., et al. (1999). Distribution of sulfate-reducing and methanogenic bacteria in anaerobic aggregates determined by microsensor and molecular analyses. Appl. Environ. Microbiol. 65, 4618–4629. doi: 10.1128/AEM.65.10.4618-4629.1999
Scheller, S., Goenrich, M., Boecher, R., Thauer, R. K., and Jaun, B. (2010). The key nickel enzyme of methanogenesis catalyses the anaerobic oxidation of methane. Nature 465, 606–608. doi: 10.1038/nature09015
Scheller, S., Yu, H., Chadwick, G. L., McGlynn, S. E., and Orphan, V. J. (2016). Artificial electron acceptors decouple archaeal methane oxidation from sulfate reduction. Science 351, 703–707. doi: 10.1126/science.aad7154
Seidel, L., Sachpazidou, V., Ketzer, M., Hylander, S., Forsman, A., and Dopson, M. (2023). Long-term warming modulates diversity, vertical structuring of microbial communities, and sulfate reduction in coastal Baltic Sea sediments. Front. Microbiol. 14:1099445. doi: 10.3389/fmicb.2023.1099445
Sela-Adler, M., Ronen, Z., Herut, B., Antler, G., Vigderovich, H., Eckert, W., et al. (2017). Co-existence of methanogenesis and sulfate reduction with common substrates in sulfate-rich estuarine sediments. Front. Microbiol. 8:8(MAY). doi: 10.3389/fmicb.2017.00766
Sheik, C. S., Reese, B. K., Twing, K. I., Sylvan, J. B., Grim, S. L., Schrenk, M. O., et al. (2018). Identification and removal of contaminant sequences from ribosomal gene databases: lessons from the census of deep life. Front. Microbiol. 9:9(APR). doi: 10.3389/fmicb.2018.00840
Söllinger, A., and Urich, T. (2019). Methylotrophic methanogens everywhere — physiology and ecology of novel players in global methane cycling. Biochem. Soc. Trans. 47, 1895–1907. doi: 10.1042/BST20180565
Soo, V. W. C., McAnulty, M. J., Tripathi, A., Zhu, F., Zhang, L., Hatzakis, E., et al. (2016). Reversing methanogenesis to capture methane for liquid biofuel precursors. Microb. Cell Factories 15:11. doi: 10.1186/s12934-015-0397-z
Sprenger, W. W., van Belzen, M. C., Rosenberg, J., Hackstein, J. H., and Keltjens, J. T. (2000). Methanomicrococcus blatticola gen. nov., sp. nov., a methanol-and methylamine-reducing methanogen from the hindgut of the cockroach Periplaneta americana. Int. J. Syst. Evol. Microbiol. 50, 1989–1999.
Sturdivant, S. K., and Shimizu, M. S. (2017). In situ organism-sediment interactions: bioturbation and biogeochemistry in a highly depositional estuary. PLoS One 12:e0187800. doi: 10.1371/journal.pone.0187800
Thauer, R. K., Kaster, A. K., Seedorf, H., Buckel, W., and Hedderich, R. (2008). Methanogenic archaea: ecologically relevant differences in energy conservation. Nat. Rev. Microbiol. 6, 579–591. doi: 10.1038/nrmicro1931
Timmers, P. H. A., Welte, C. U., Koehorst, J. J., Plugge, C. M., Jetten, M. S. M., and Stams, A. J. M. (2017). Reverse Methanogenesis and respiration in Methanotrophic Archaea. Archaea 2017:e1654237, 1–22. doi: 10.1155/2017/1654237
Timmers, P., Widjaja-Greefkes, H. C., Ramiro-Garcia, J., Plugge, C., and Stams, A. (2015). Growth and activity of ANME clades with different sulfate and sulfide concentrations in the presence of methane. Front. Microbiol. 6:988. doi: 10.3389/fmicb.2015.00988
Umezawa, K., Kojima, H., Kato, Y., and Fukui, M. (2021). Dissulfurispira thermophila gen. Nov., sp. nov., a thermophilic chemolithoautotroph growing by sulfur disproportionation, and proposal of novel taxa in the phylum Nitrospirota to reclassify the genus Thermodesulfovibrio. Syst. Appl. Microbiol. 44:126184. doi: 10.1016/j.syapm.2021.126184
Underwood, S., Lapham, L., Teske, A., and Lloyd, K. G. (2016). Microbial community structure and methane-cycling activity of subsurface sediments at Mississippi canyon 118 before the Deepwater horizon disaster. Deep Sea Res. Part II Top. Stud. Oceanogr. 129, 148–156. doi: 10.1016/j.dsr2.2015.01.011
US Department of Commerce. Global monitoring laboratory - carbon cycle greenhouse gases. (2023). Available at: https://gml.noaa.gov/ccgg/trends_ch4/ (Accessed August 26, 2023).
Valentine, D. L., Blanton, D. C., and Reeburgh, W. S. (2000). Hydrogen production by methanogens under low-hydrogen conditions. Arch. Microbiol. 174, 415–421. doi: 10.1007/s002030000224
Vanwonterghem, I., Evans, P. N., Parks, D. H., Jensen, P. D., Woodcroft, B. J., Hugenholtz, P., et al. (2016). Methylotrophic methanogenesis discovered in the archaeal phylum Verstraetearchaeota. Nat. Microbiol. 1:1. doi: 10.1038/nmicrobiol.2016.170
Waite, D. W., Chuvochina, M., Pelikan, C., Parks, D. H., Yilmaz, P., Wagner, M., et al. (2020). Proposal to reclassify the proteobacterial classes Deltaproteobacteria and Oligoflexia, and the phylum Thermodesulfobacteria into four phyla reflecting major functional capabilities. Int. J. Syst. Evol. Microbiol. 70, 5972–6016. doi: 10.1099/ijsem.0.004213
Webster, T. M., Smith, A. L., Reddy, R. R., Pinto, A. J., Hayes, K. F., and Raskin, L. (2016). Anaerobic microbial community response to methanogenic inhibitors 2-bromoethanesulfonate and propynoic acid. MicrobiologyOpen 5, 537–550. doi: 10.1002/mbo3.349
Wegener, G., Krukenberg, V., Riedel, D., Tegetmeyer, H. E., and Boetius, A. (2015). Intercellular wiring enables electron transfer between methanotrophic archaea and bacteria. Nature 526, 587–590. doi: 10.1038/nature15733
Whiticar, M. J. (1999). Carbon and hydrogen isotope systematics of bacterial formation and oxidation of methane. Chem. Geol. 161, 291–314. doi: 10.1016/S0009-2541(99)00092-3
Wickham, H. ggplot2: Elegant graphics for data analysis. Springer-Verlag New York; (2016). Available at: https://ggplot2.tidyverse.org.
Winderl, C., Penning, H., von Netzer, F., Meckenstock, R. U., and Lueders, T. (2010). DNA-SIP identifies sulfate-reducing Clostridia as important toluene degraders in tar-oil-contaminated aquifer sediment. ISME J. 4, 1314–1325. doi: 10.1038/ismej.2010.54
Wuebbles, D. J., and Hayhoe, K. (2002). Atmospheric methane and global change. Earth Sci. Rev. 57, 177–210. doi: 10.1016/S0012-8252(01)00062-9
Xiao, K. Q., Beulig, F., Kjeldsen, K. U., Jørgensen, B. B., and Risgaard-Petersen, N. (2017). Concurrent methane production and oxidation in surface sediment from Aarhus Bay, Denmark. Front. Microbiol. 8:1198. doi: 10.3389/fmicb.2017.01198
Xiao, K. Q., Beulig, F., Røy, H., Jørgensen, B. B., and Risgaard-Petersen, N. (2018). Methylotrophic methanogenesis fuels cryptic methane cycling in marine surface sediment. Limnol. Oceanogr. 63, 1519–1527. doi: 10.1002/lno.10788
Xu, L., Zhuang, G. C., Montgomery, A., Liang, Q., Joye, S. B., and Wang, F. (2021). Methyl-compounds driven benthic carbon cycling in the sulfate-reducing sediments of South China Sea. Environ. Microbiol. 23, 641–651. doi: 10.1111/1462-2920.15110
Yilmaz, P., Parfrey, L. W., Yarza, P., Gerken, J., Pruesse, E., Quast, C., et al. (2014). The SILVA and “all-species living tree project (LTP)” taxonomic frameworks. Nucleic Acids Res. 42, D643–D648. doi: 10.1093/nar/gkt1209
Yoshinaga, M. Y., Holler, T., Goldhammer, T., Wegener, G., Pohlman, J. W., Brunner, B., et al. (2014). Carbon isotope equilibration during sulphate-limited anaerobic oxidation of methane. Nat. Geosci. 7, 190–194. doi: 10.1038/ngeo2069
Yu, L., He, D., Yang, L., Rensing, C., Zeng, R. J., and Zhou, S. (2022). Anaerobic methane oxidation coupled to ferrihydrite reduction by Methanosarcina barkeri. Sci. Total Environ. 844:157235. doi: 10.1016/j.scitotenv.2022.157235
Zhang, Z., Zhang, C., Yang, Y., Zhang, Z., Tang, Y., Su, P., et al. (2022). A review of sulfate-reducing bacteria: metabolism, influencing factors and application in wastewater treatment. J. Clean. Prod. 376:134109. doi: 10.1016/j.jclepro.2022.134109
Zhuang, G. C., Elling, F. J., Nigro, L. M., Samarkin, V., Joye, S. B., Teske, A., et al. (2016). Multiple evidence for methylotrophic methanogenesis as the dominant methanogenic pathway in hypersaline sediments from the Orca Basin, Gulf of Mexico. Geochim. Cosmochim. Acta 187, 1–20. doi: 10.1016/j.gca.2016.05.005
Zhuang, G. C., Heuer, V. B., Lazar, C. S., Goldhammer, T., Wendt, J., Samarkin, V. A., et al. (2018). Relative importance of methylotrophic methanogenesis in sediments of the Western Mediterranean Sea. Geochim. Cosmochim. Acta 224, 171–186. doi: 10.1016/j.gca.2017.12.024
Keywords: marine sediments, methanogenesis, sulfate reduction, AOM, hydrogen, thermodynamics
Citation: Coon GR, Duesing PD, Paul R, Baily JA and Lloyd KG (2023) Biological methane production and accumulation under sulfate-rich conditions at Cape Lookout Bight, NC. Front. Microbiol. 14:1268361. doi: 10.3389/fmicb.2023.1268361
Edited by:
Amelia-Elena Rotaru, University of Southern Denmark, DenmarkReviewed by:
Edgardo I. Valenzuela, Monterrey Institute of Technology and Higher Education (ITESM), MexicoJames F. Holden, University of Massachusetts Amherst, United States
Copyright © 2023 Coon, Duesing, Paul, Baily and Lloyd. This is an open-access article distributed under the terms of the Creative Commons Attribution License (CC BY). The use, distribution or reproduction in other forums is permitted, provided the original author(s) and the copyright owner(s) are credited and that the original publication in this journal is cited, in accordance with accepted academic practice. No use, distribution or reproduction is permitted which does not comply with these terms.
*Correspondence: Karen G. Lloyd, a2xsb3lkQHV0ay5lZHU=
†ORCID: Gage R. Coon, https://orcid.org/0000-0003-2795-8000
Raegan Paul, https://orcid.org/0000-0002-6413-082X
Jennifer A. Baily, https://orcid.org/0009-0006-8866-3977
Karen G. Lloyd, https://orcid.org/0000-0003-0914-6375