 Yongcan Jiang1,2
 Yinlong Shao1
 Jiafang Huang3*Yunling Du1Yu Wen1Hong Tang1
 Jianming Xu2Dengzhou Gao3
 Xianbiao Lin4
 Dongyao Sun5*
- 1Power China Huadong Engineering Corporation Ltd., Hangzhou, Zhejiang Province, China
- 2College of Environmental and Resource Sciences, Institute of Soil and Water Resources and Environmental Science, Zhejiang University, Hangzhou, Zhejiang Province, China
- 3Institute of Geography, Fujian Normal University, Fuzhou, China
- 4Frontiers Science Center for Deep Ocean Multispheres and Earth System, Key Laboratory of Marine Chemistry Theory and Technology, Ministry of Education, Ocean University of China, Qingdao, China
- 5School of Geography Science and Geomatics Engineering, Suzhou University of Science and Technology, Suzhou, China
Invasive Spartina alterniflora (S. alterniflora) has significant impacts on sediment biogeochemical cycling in the tidal wetlands of estuaries and coasts. However, the impact of exotic Spartina alterniflora invasion on greenhouse gases (GHGs) production dynamics in sediments remain limited. Here, we investigated the dynamics of sediment physicochemical properties, GHGs production rates, and microbial gene abundances in a native Cyperus malacensis habitat and three invasive S. alterniflora habitats (6-, 10-, and 14-year) in the Minjiang River Estuary, China. The methane (CH4), carbon dioxide (CO2), and nitrous oxide (N2O) production rates varied both spatially and seasonally, while microbial gene abundances (bacterial and fungal gene abundances) and organic matter (TOC and TN) only varied spatially. GHGs production rates were also characterized by higher values in surface sediment (0–10 cm) compared to subsurface sediment (10–20 cm) and by seasonal variations with higher values in summer than in winter. S. alterniflora invasion can significantly increase CH4 and CO2 production rates, organic matter, and microbial gene abundances (p < 0.05). Temperature, organic matter and microbial gene abundances were the most dominating factor controlling the spatio-temporal variations of CH4 and CO2 production rates. Overall, our findings highlighted the significant role of S. alterniflora invasion in regulating GHGs production rates in coastal wetland sediments and provided fundamental data for estimating GHGs emissions and carbon sequestration in the complex tidal wetlands.
1 Introduction
In 1979, Spartina alterniflora (S. alterniflora) was intentionally introduced to the estuarine and coastal wetlands of China with the objective of promoting siltation and coastal protection (Lu and Zhang, 2013). Over the last forty years, it has rapidly invaded the bare flats, salt marshes, and mangroves along coastal zone, and has expanded its presence to cover ∼344.51 km2 of land (Wang and Lin, 2023; Wu et al., 2024). S. alterniflora is a salt-tolerant plant, which can effectively protect coastlines, withstand typhoons, reduce pollution and provide habitats for many benthic species (Cagle et al., 2020; Wang et al., 2022). Nevertheless, its rapid growth comes with certain disadvantages, including obstructing waterways, biodiversity loss and posing a threat to native communities (Liao et al., 2008; Wu et al., 2024). Meanwhile, S. alterniflora invasion may alter ecosystem structure and material cycling processes, which in turn have a substantial impact on sediment biogeochemical cycles and ultimately altering ecosystem functions and services (Li et al., 2009). Hence, the impact of S. alterniflora invasion on the biogeochemical cycles of carbon (C) and nitrogen (N) in coastal sediments has garnered significant attentions.
Previous studies have shown that S. alterniflora, a C4 plant, can substantially increase sediment C and N stocks after invading the bare flat and C3 plants (Zhang et al., 2010a; Feng et al., 2017). This invasive plant characterized by the C4 photosynthetic pathway, has a higher net primary productivity than native plants such as Phragmites australis, Suaeda salsa, and Cyperus malacensis (C. malacensis) thereby increasing the storage of C and N in biomass (Zhang et al., 2010a). For instance, S. alterniflora invasion has been shown to significantly elevate sediment organic carbon, total nitrogen, and total phosphorus levels compared to nearby bare flats (Wang et al., 2016). This is mainly because S. alterniflora invasion can increase the organic matter contents in sediment by decomposing plant litter and roots, promoting sedimentation, and adsorbing organic matter (Gao et al., 2017). Under normal circumstances, S. alterniflora invasion can increase the abundances and diversity of microorganisms in sediments of bare flat and native C3 plants (Lin et al., 2022). Nevertheless, it can also reduce the species diversity and abundance or density of benthic animals of the native herbs (Phragmites australis and Suaeda salsa) (Yu et al., 2022). In addition, S. alterniflora invasion can also speed up the rates of organic carbon sequestration and N conversion, enhance N mineralization rates, and boost N-fixation rates (Chen et al., 2016; He et al., 2019). Consequently, it is commonly found that S. alterniflora invasion in bare flats and native C3 plants can effectively enhance C and N storage in sediment, subsequently expediting sediment C and N recycling.
With the intensification of S. alterniflora spreading in tidal wetlands, its impact on the environment is becoming increasingly apparent. Among these impacts, the impact of S. alterniflora invasion on GHGs production in tidal wetlands has attracted considerable attention. Although numerous studies have been carried out to examine sediment GHGs emissions in S. alterniflora salt marsh ecosystems (Cheng et al., 2010; Tong et al., 2012; Yin et al., 2015; Yuan et al., 2015), there is little consensus on the impact of S. alterniflora invasion on sediment GHGs emissions. For instance, S. alterniflora invasion can lead to a notable increase in methane (CH4) emissions after invaded bare flats or C3 plants due to its higher plant biomass (Cheng et al., 2010; Zhang et al., 2010b; Tong et al., 2012; Yuan et al., 2014). In contrast, S. alterniflora invasion was reported to decrease in nitrous oxide (N2O) emissions after invaded bare flats or C3 plants (Yuan et al., 2015; Gao et al., 2019), and to reduce carbon dioxide (CO2) emissions after invaded mangrove wetland sediment in southeastern China (Gao et al., 2018). Also, a previous study found that there were no significant differences in GHGs emissions between S. alterniflora and Phragmites australis stands in a New England marsh. In addition, S. alterniflora invasion was reported to enhance CO2 while reduce CH4 emissions after invaded native P. australis marshes in Yancheng National Nature Reserve, China (Xu et al., 2014). This inconsistency implies that suggests that the impact of S. alterniflora encroachment on the carbon and nitrogen cycles within sedimentary ecosystems is multifaceted. As the rapid expansion of S. alterniflora in China’s coastal wetlands, it has become critically imperative to reveal the sediment GHGs emission from wetland as well as its driven factors according to the degree of S. alterniflora invasion.
In summary, despite numerous previous studies on the response of sediment GHGs emissions to S. alterniflora invasion in bare flats, C3 plants or mangrove (Tong et al., 2012; Yuan et al., 2014; Xiang et al., 2015; Gao et al., 2018; Bu et al., 2019; He et al., 2021), systematic research on the role of S. alterniflora in regulating the spatio-temporal variations of GHGs and influencing mechanism in C. malacensis wetland following invasion chronosequences remains unclear. Here, sediment GHGs production rates, physicochemical properties and microbial gene abundances were measured following S. alterniflora invasion in a chronosequence of 6-, 10-, and 14-year-old by comparing with native C. malacensis in the Minjiang River Estuary, China. The aims of our research were (1) to explore spatio-temporal variations of sediment GHGs production rates in C. malacensis wetland invaded by S. alterniflora; (2) to elucidate the key environmental factors regulating sediment GHGs production rates in C. malacensis wetland invaded by S. alterniflora; (3) to offer fundamental data for evaluating the ecological and environmental impacts resulting from S. alterniflora invasion into C. malacensis ecosystems.
2 Materials and methods
2.1 Research location and sediment collection
Shanyutan (26.01–26.06°N, 119.57–119.69°E) is the largest intertidal wetlands in the Minjiang Estuary, China (Figures 1A,B). It is characterized by a typical subtropical monsoon climate with an annual mean temperature of ∼19°C and annual mean precipitation of ∼1300 mm (Mou et al., 2018). The commonest native plants in this estuarine wetlands are Scirpus triqueter, C. malacensis, and Phragmites australis, which mainly grow in low, middle, and high intertidal zones, respectively (Gao et al., 2017). In 2002, the introduction of S. alterniflora to the study area led to its rapid expansion and colonization of the native C. malacensis habitat in the middle intertidal zone over the following two decades (Mou et al., 2014). Superimposing and analyzing Landsat 8 (2014), SPOT5 (2010), and aerial (2006) images were employed to identify sampling locations showcasing varying chronosequences of invasive S. alterniflora (Jin et al., 2017). The sampling locations consisted of a native habitat (CM, C. malacensis) and three invasive S. alterniflora habitats that took over the native habitat during different time periods: SA-6 (2010–2014), SA-10 (2006–2010), and SA-14 (2002–2006) (Figure 1C). The four habitats mentioned above were selected as sampling points, representing varying degrees of invasion by S. alterniflora. The sampling locations (CM, SA-6, SA-10, and SA-14) were located in the middle intertidal zone, which had similar sediment and hydrodynamic properties prior to the invasion of S. alternifolia. Within each sampling habitat, three sediment samples were randomly collected at two depths (0–10 cm and 10–20 cm) using a stainless steel sediment cylinder with a diameter of 10 cm in July and December 2016. We transported all samples to the laboratory on ice. Three parallel sediments from each site were mixed thoroughly under anaerobic conditions in the laboratory. Sediment were divided into three parts. One part was frozen at −20°C for physical and chemical parameter analysis, the second part was stored at 4°C to determine GHGs production rates, and the remaining part was kept at −80°C for microbiological analysis.
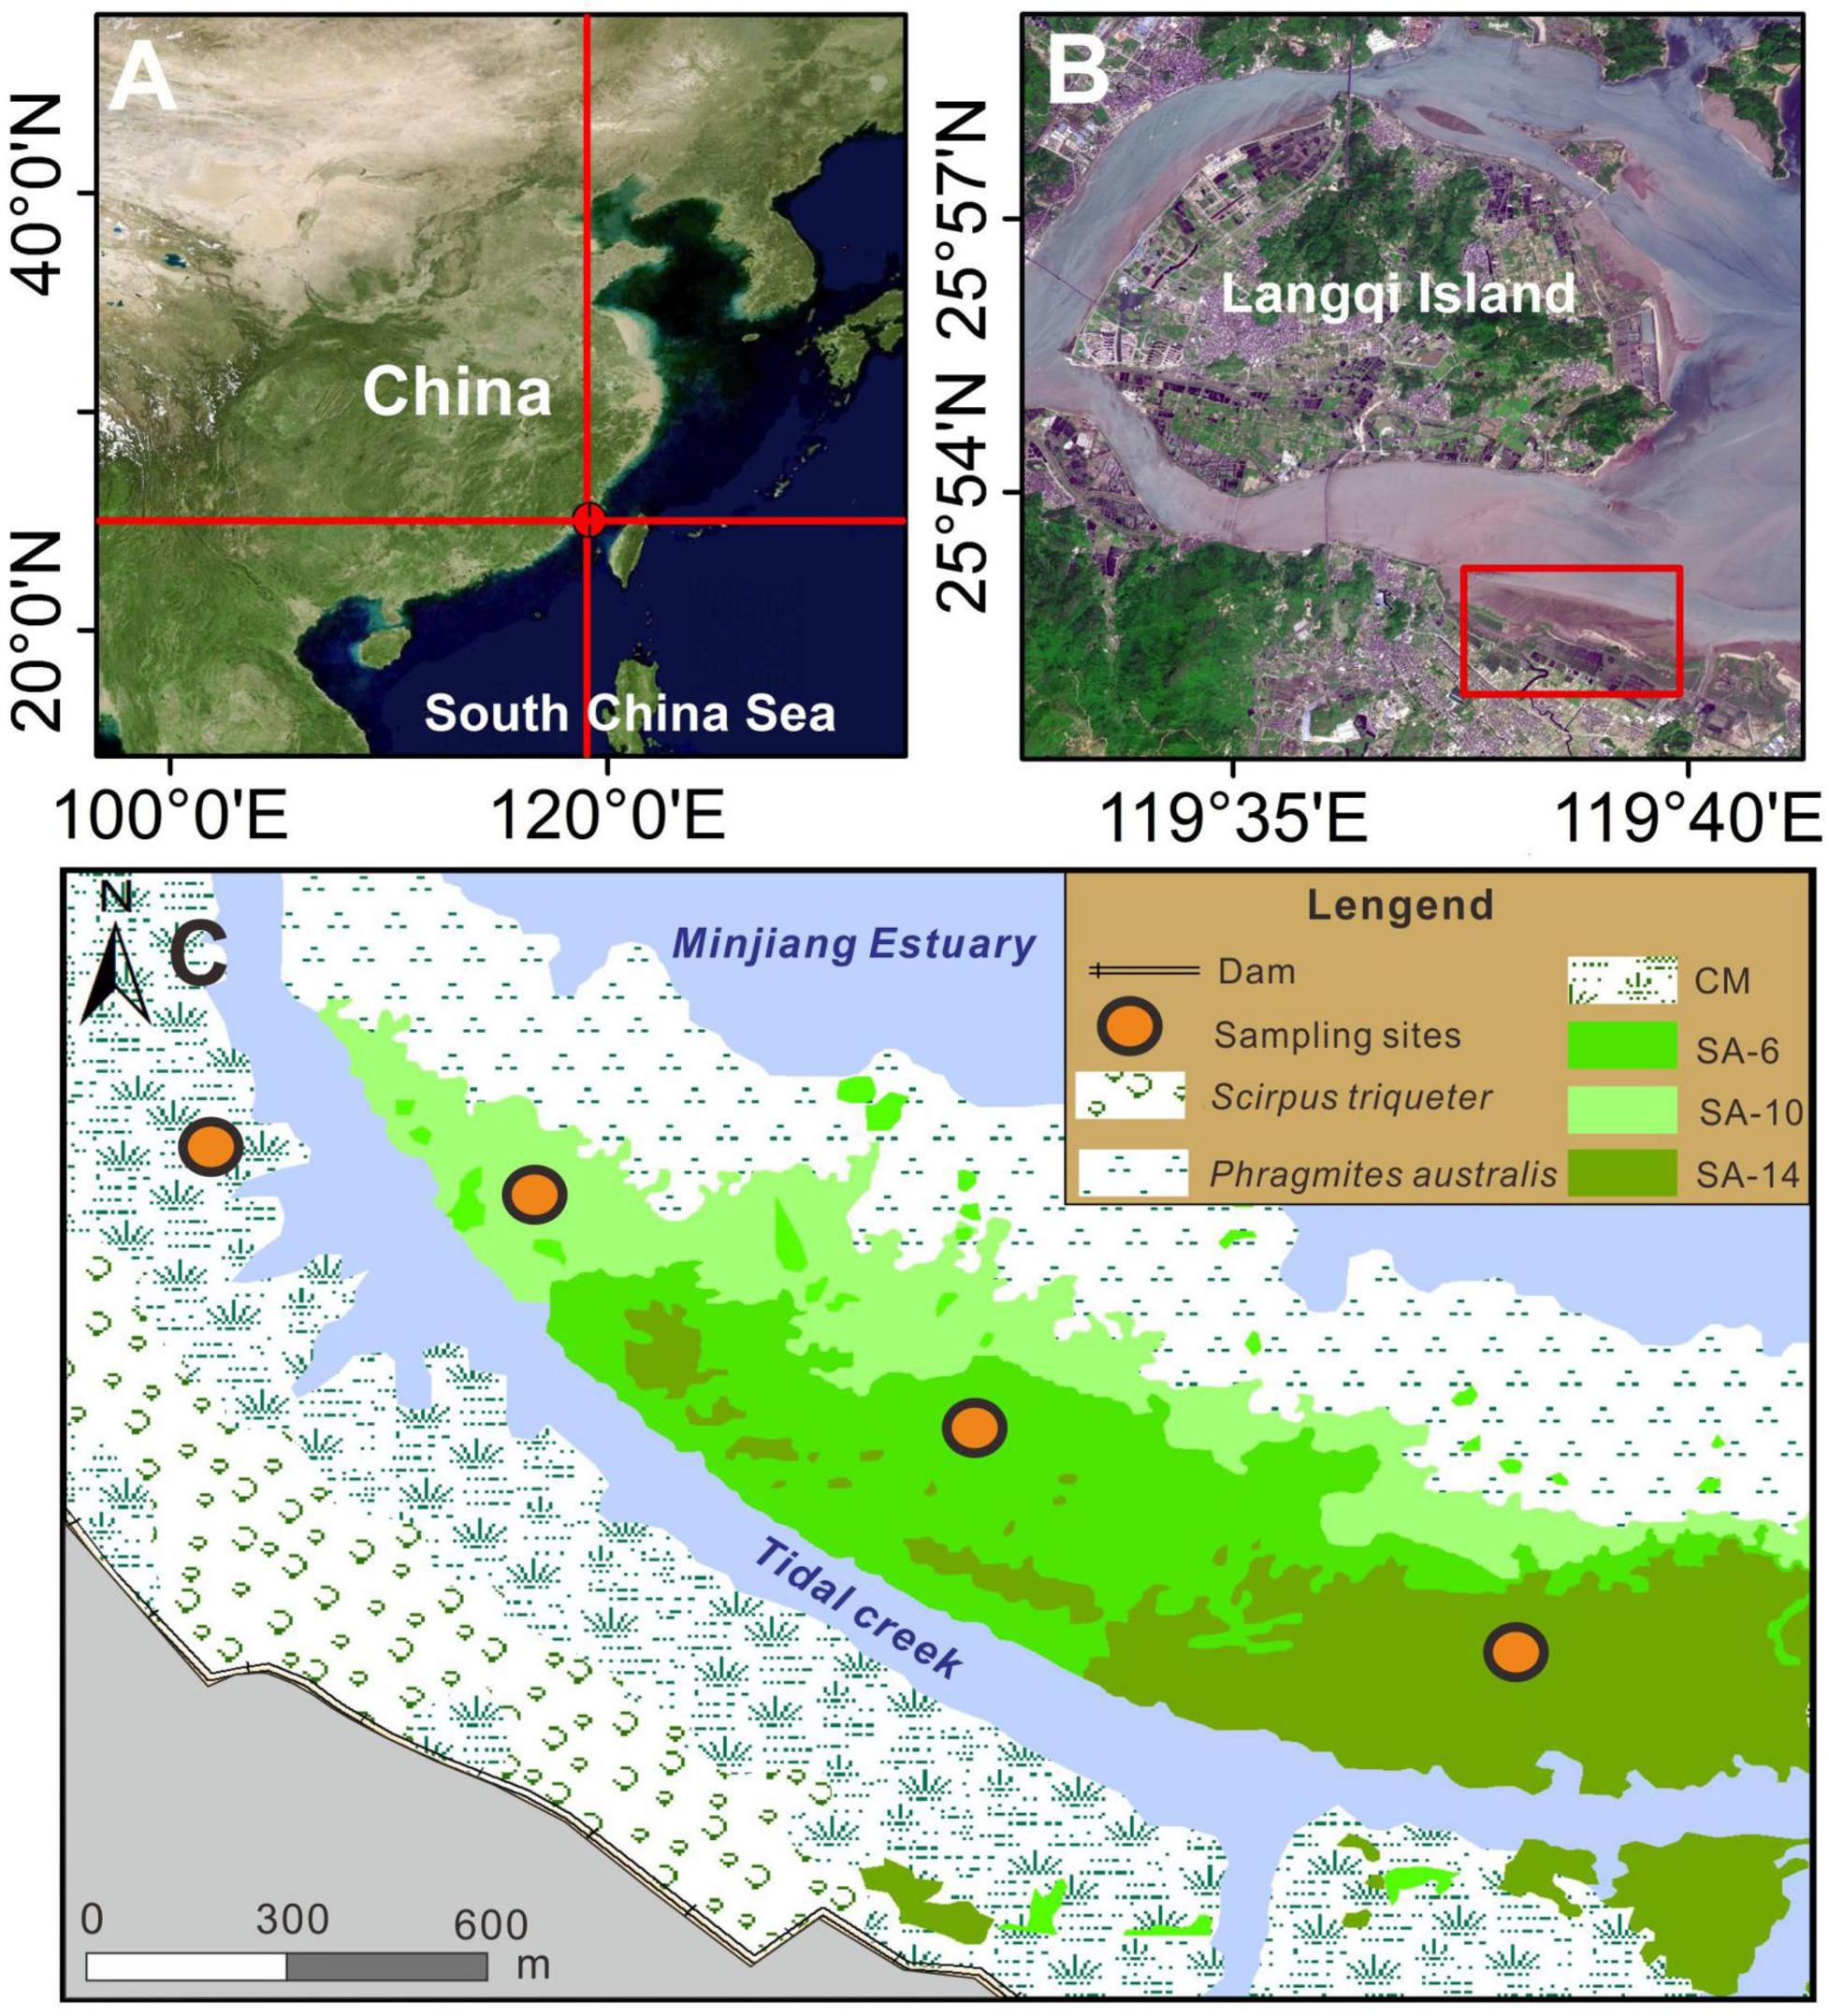
Figure 1. Study area (A,B) and sampling locations (C), which was modified according to a previous study (Gao et al., 2017). The CM denotes C. malacensis habitat, and the SA-6, SA-10, and SA-14 denote S. alterniflora habitats for 2–6 years, 6–10 years, and 10–14 years, respectively.
2.2 Analysis of sediment physicochemical characteristics
The portable thermometer was used to measure soil temperatures. Sediment pH and electrical conductivity (EC) were determined by the handheld pH (IQ Scientific Instruments, USA) and EC tester (Spectrum Technologies Inc., USA), respectively. The oven-drying (fresh sediment at 60°C to a constant weight) and cutting-ring methods were used to analyze sediment moisture and density, respectively. Total organic carbon (TOC) and total nitrogen (TN) contents in sediments were measured based on a CHNS analyzer (Vario EL, Elementar, Germany) after pretreatment of the sediment with 5% HCl to remove inorganic carbon with (Lin and Lin, 2022). The potassium chloride solution (KCl, purged with N2 for 15 min) of 2 M was applied to extract sediment ammonium (NH4+), nitrate (NO3–) and nitrite (NO2–), and their contents were measured by an automatic injection analyzer (Skalar SAN++, the Netherlands) (Huang et al., 2021). Sediment sulfide (S2–) contents were assessed via methylene blue spectrophotometry (Lin et al., 2017).
2.3 Determination of GHGs production rates and their temperature sensitivity
In this study, all samples were incubated anaerobically at in situ temperature in the dark for 24 h. In brief, three brown glass bottles (250 mL) were prepared for each sediment sample. 10 g fresh sediment was placed in each bottle. Anaerobic glass bottles and three sediment-free controls were flushed with N2 for 5 min and then sealed with airtight butyl rubber stopper for 24 h to allow the accumulation of GHGs (Lang et al., 2011). Then, ∼12 mL of headspace gas samples were collected from each bottle (after vigorous shaking) using a syringe, and then stored in 12 mL evacuated vials. CO2, CH4, and N2O concentrations were determined via gas chromatography Shimadzu GC-2014B using Porapak-N and HayeSep-D and Molecular Sieve MS13 columns and equipped with TCD, FID, and ECD detectors (Morrissey and Franklin, 2015). GHGs production rates were calculated based on the accumulation of gas production within the incubation period using linear regression. To obtain the overall GHGs production rate, three GHGs rates were converted to a common unit (CO2-equivalent) and added together using the Global Warming Potential over a 100-year timeframe of 28 for CH4 and 273 for N2O set by the Intergovernmental Panel on Climate Change (IPCC, 2021).
To determine the temperature response of sediment GHGs production rates, temperature sensitivity (Q10) was estimated based on the modified van’t Hoff’s equation, which is shown as follows (Equation 1):
where RT1 and RT2 are sediment GHGs production rates in summer and winter, respectively. Ts and Tw are incubation temperature in summer and winter, respectively (Figure 2A).
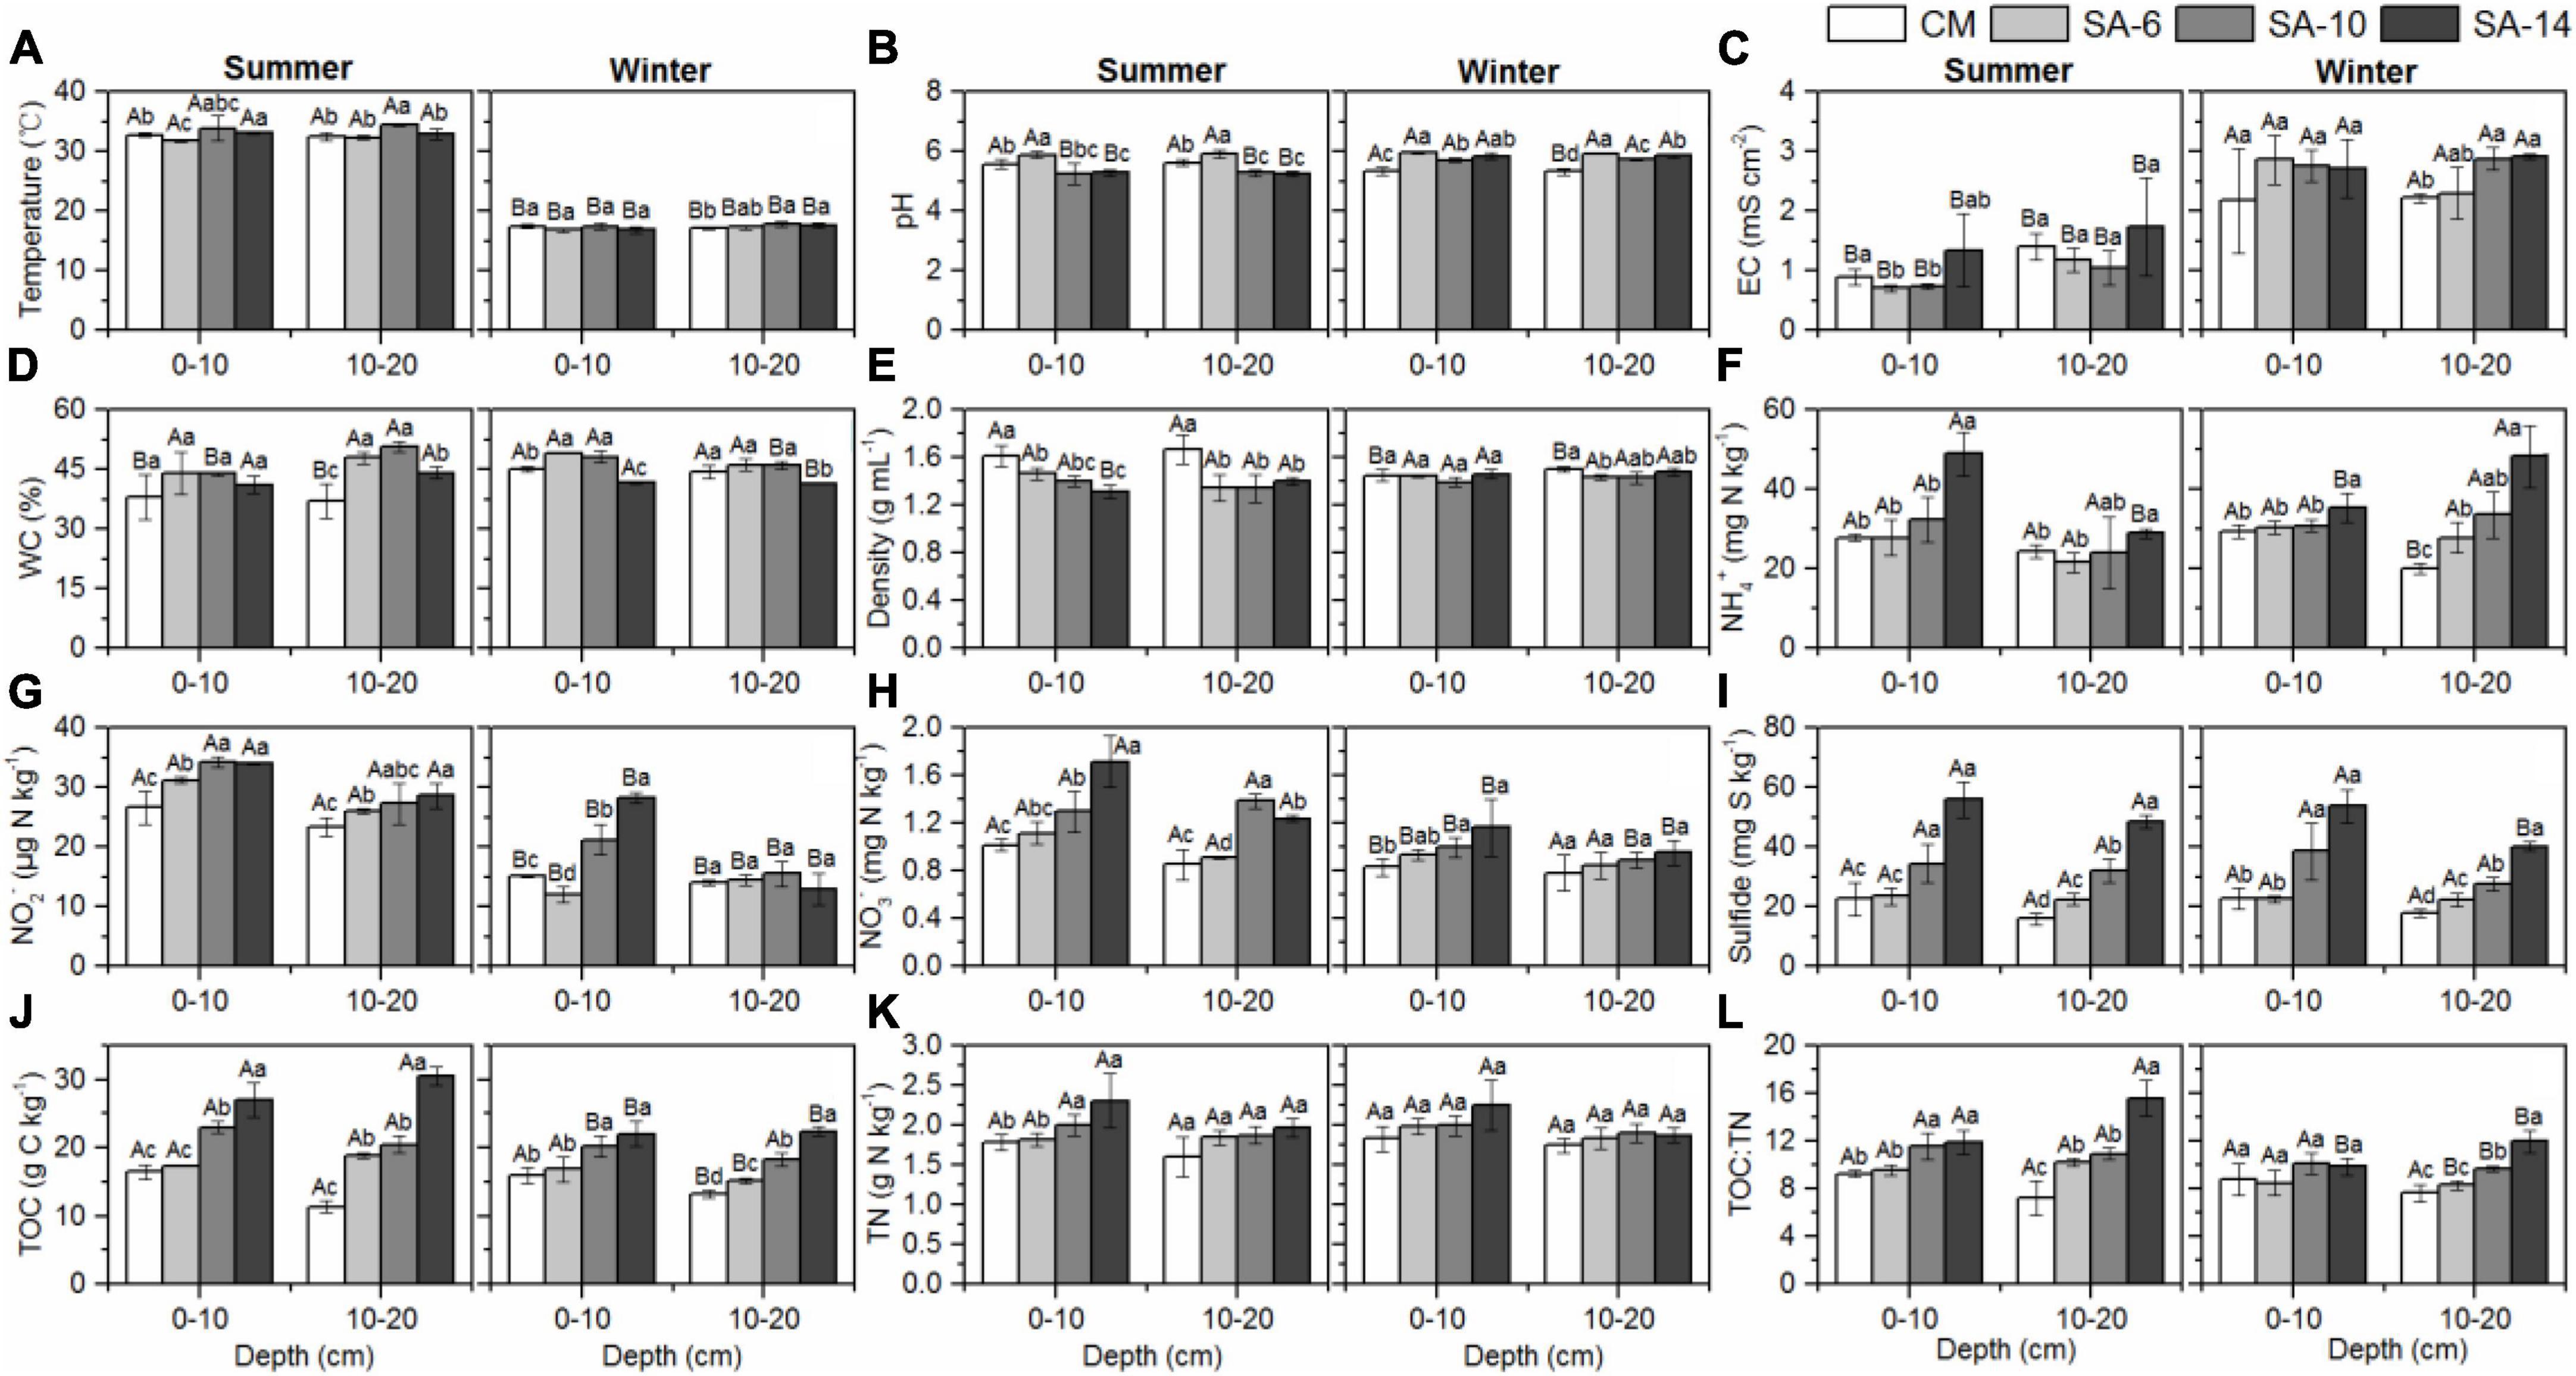
Figure 2. The effects of invasive S. alternifolia on sediment physicochemical properties (Mean ± SD) along four habitats. Sediment physicochemical properties including temperature (A), pH (B), electrical conductivity (C), water content (D), sediment bulk density (E), exchangeable inorganic N (F–H), sulfide (I), TOC (J), TN (K), and TOC:TN (L) were measured in summer and winter. The CM denotes C. malacensis habitat, and the SA-6, SA-10, and SA-14 denote S. alterniflora habitats for 2–6, 6–10, and 10–14 years, respectively. Different lowercase letters are used to denote statistical differences (p < 0.05) across four habitats in the same depth, while upper case letters are used to denote significant differences (p < 0.05) between the summer and winter in each habitat.
2.4 Microbial analysis
DNA extraction from sediment samples was carried out using the FastDNA spin kit for sediment (MP Biomedical, USA) according to the manufacturer’s instructions. The concentration and purity of the extracted DNA were assessed using a NanoDrop spectrophotometer (ND-2000C, Thermo Scientific, USA). The size and quality of DNA fragments were evaluated by 1% agarose gel electrophoresis. To quantify the gene abundances (Bacterial 16S rRNA, Fungal) in the microbial communities, qPCR assays (Applied Biosystems, USA) were performed on an ABI 7500 Fast real-time qPCR system (Applied Biosystems, USA). Abundance of bacterial 16S rRNA genes was quantified via Quantitative PCR using 341F and 519R primers (Muyzer et al., 1993). Fungal genes abundance was determined using PCR primers SSU0817F and 1196R (Borneman and Hartin, 2000).
2.5 Statistical analysis
All data analysis was performed using the SPSS 19.0 and Origin 2021. Data were assessed for normal distribution and the requirement for any potential transformations prior to conducting the statistical analysis. The significant differences of sediment physicochemical properties, GHGs production, and microbial abundances between different habitats were analyzed by one-way ANOVA, Turkey test (p < 0.05, equal variances assumed). The significant differences of sediment physicochemical properties, GHGs production rates, and microbial gene abundances between summer and winter, and between surface and subsurface sediments were both tested by independent-samples t-test (p < 0.05). Linear regression analyses and the Pearson correlation test (two-tailed, p < 0.05) were used to examine the relationships between variables. Multiple stepwise regression analyses were employed to investigate the relationships between GHGs production rates and various environmental variables.
3 Results
3.1 Sediment properties
Sediment temperature ranged from 16.80 to 33.83°C, with summer temperatures (32.95 ± 1.09°C) being significantly higher than those in winter (17.28 ± 0.47°C) (Figure 2A). During summer, sediment pH ranged from 5.18 to 5.91, with the highest levels observed in SA-6 habitats, followed by the CM habitats, and the lowest levels recorded in the SA-14 and SA-10 habitats. In winter, sediment pH was notably higher in S. alterniflora habitats (SA-14, SA-6, and SA-10) compared to the C. malacensis habitat (Figure 2B). Sediment electrical conductivity (EC) ranged from 0.70 to 1.73 mS cm–2 and 2.17 to 2.91 mS cm–2 in summer and winter, respectively. The highest values were consistently observed in the SA-14 habitats (Figure 2C). Sediment water contents ranged from 32.09% to 51.74% and from 41.24% to 49.63% in summer and winter, respectively (Figure 2D). Sediment bulk density were in a range of 1.22-1.74 mg mL–1 and 1.36-1.52 mg mL–1 in summer and winter, respectively (Figure 2E). In general, sediment sulfide, NH4+, NO3– and NO2–, TN, TOC, and TOC:TN increased with the invasion degree of S. alterniflora (Figures 2F–L). In addition, sediment TN, NH4+, NO3– and NO2– contents at the surface (0-10 cm) were higher than those at the subsurface (10-20 cm), except for winter NH4+ in SA-10 and SA-14 habitats (Figures 2F–H, L). No obvious differences in temperature, pH, water contents, and density were observed between 0-10 cm and 10-20 cm depth (Figures 2A, B, D, E).
3.2 Sediment GHGs production rates
Sediment GHGs production rates varied both spatially and seasonally. Spatially, GHGs production rates generally increased from CM to SA-6 to SA-10 then to SA-14, and all the values in 0-10 cm sediment layer were higher than those in 10-20 cm sediment layer in these four habitats. Seasonally, all rates were higher in summer than in winter with a marked seasonal difference within these four habitats (p < 0.05, Figure 3).
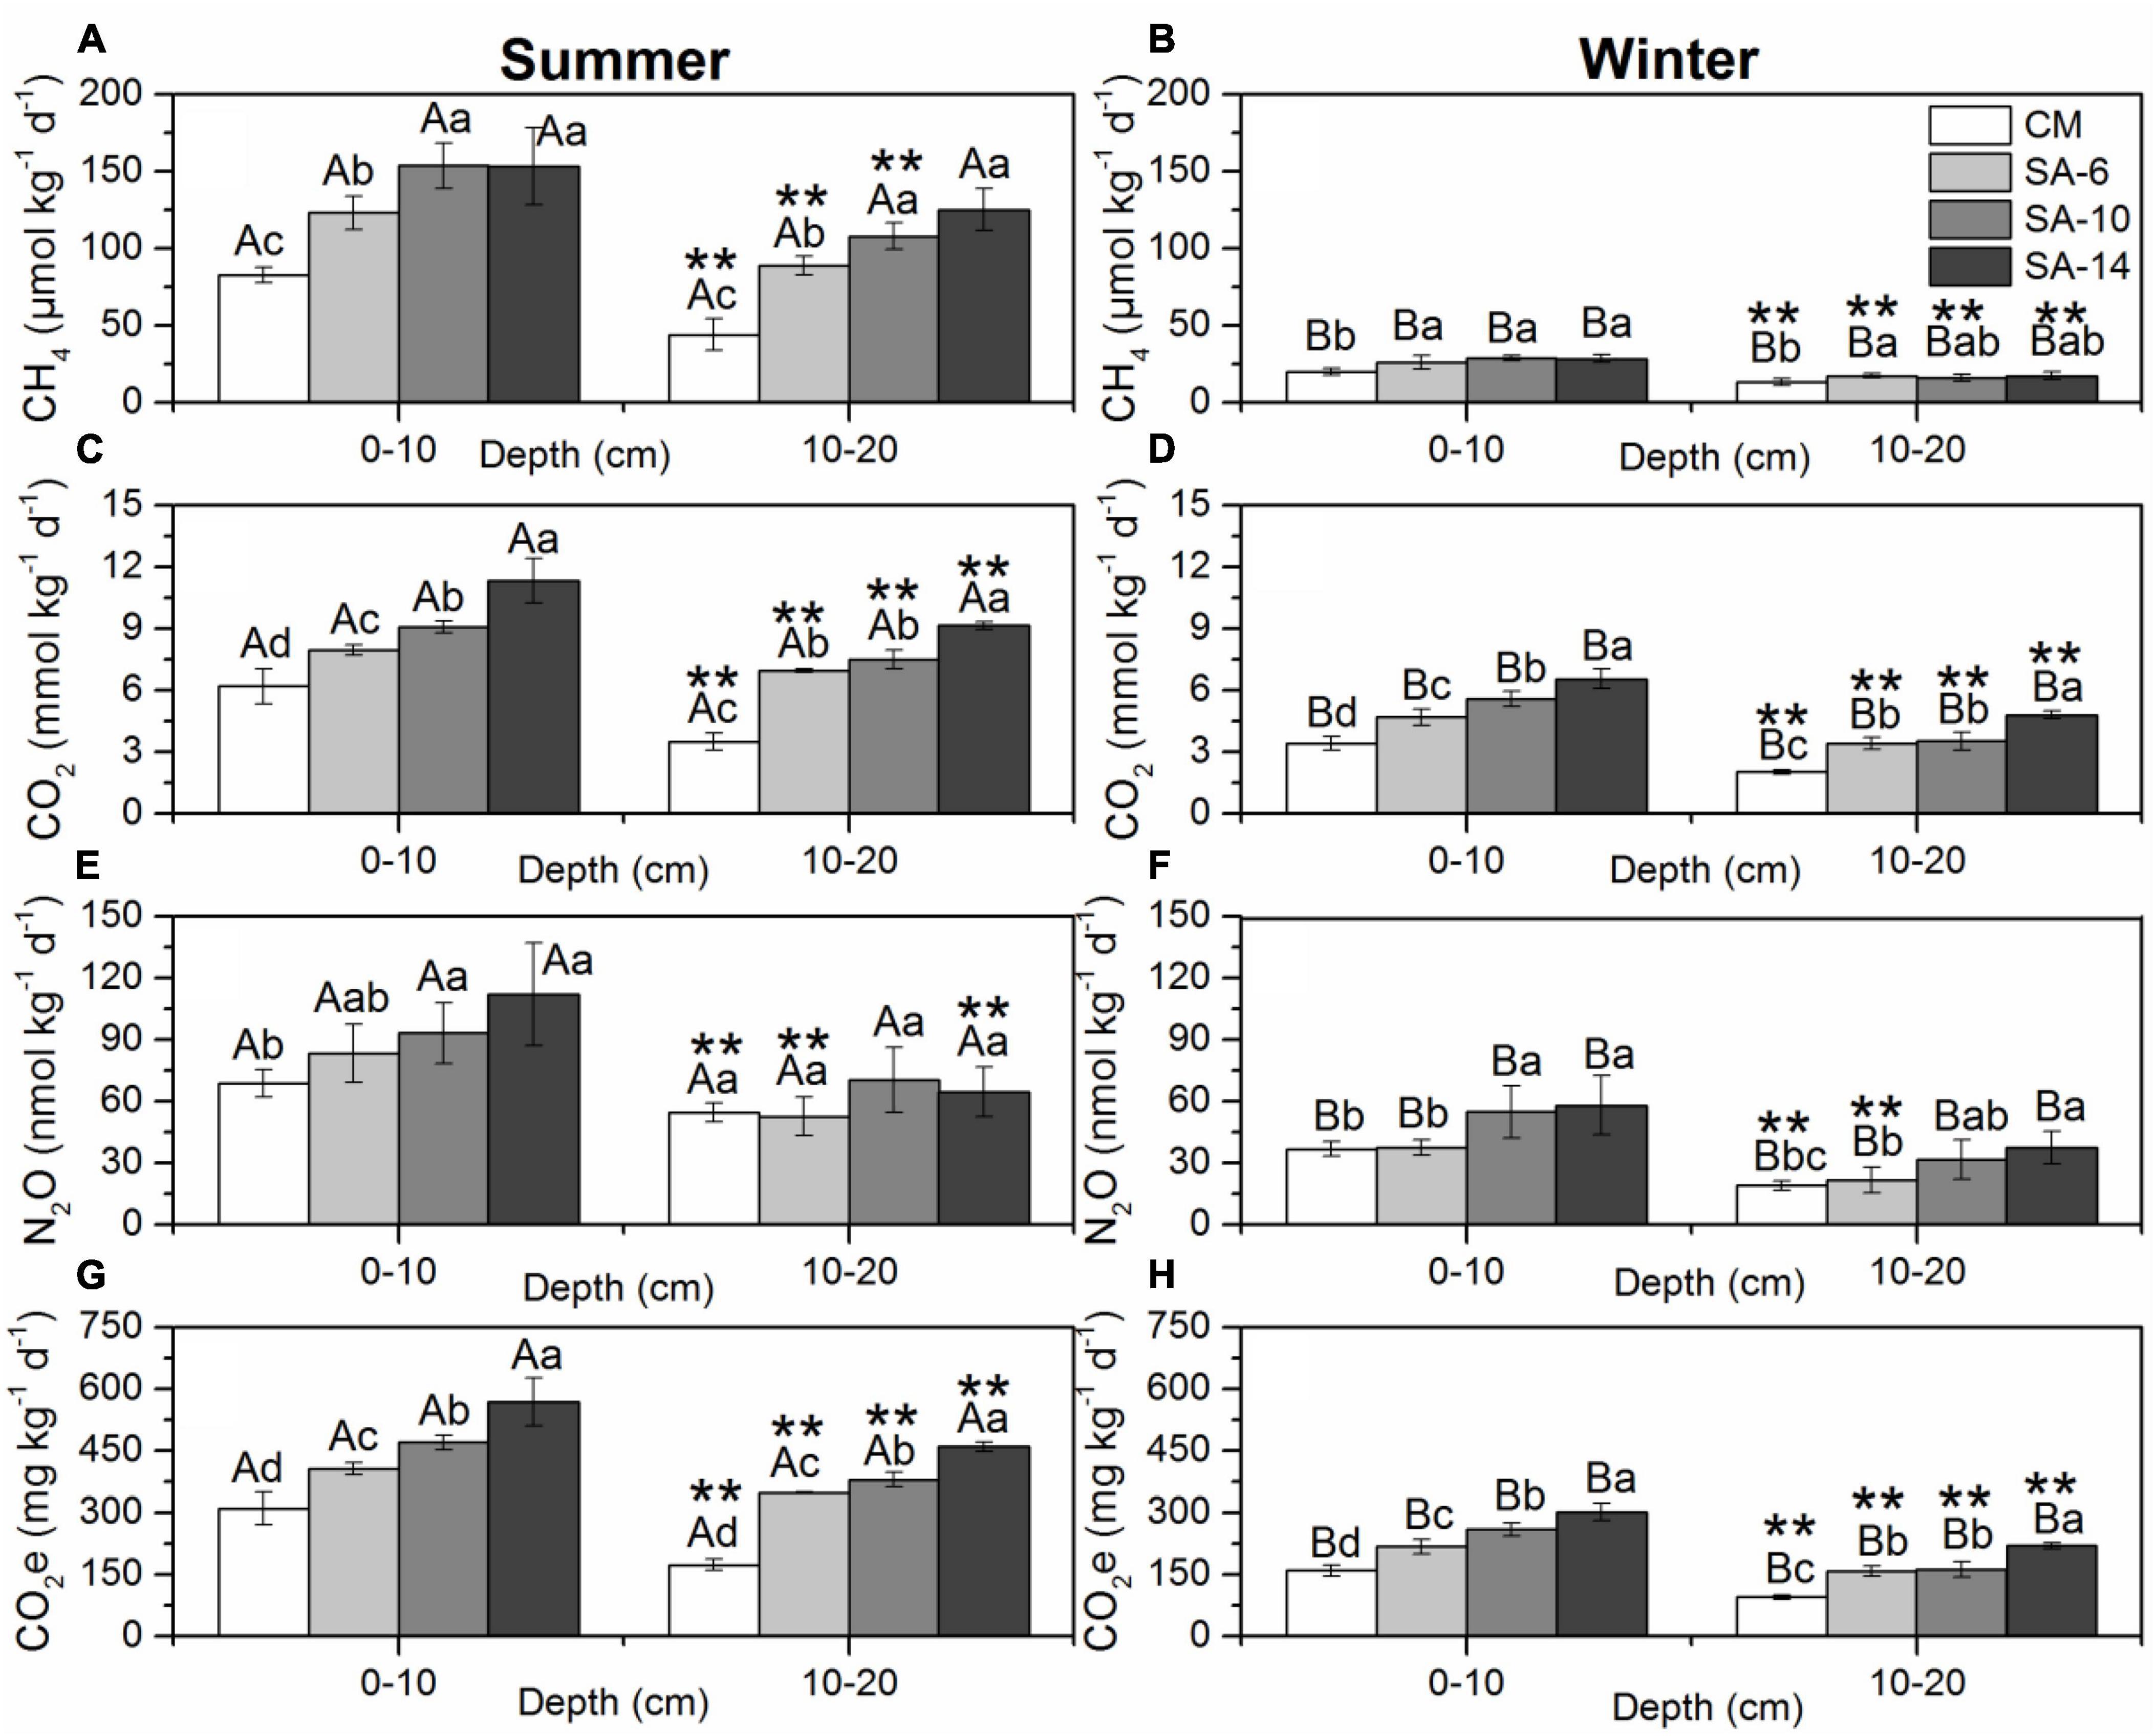
Figure 3. The effects of invasive S. alternifolia on sediment GHGs production rates (Mean ± SD) along four habitats. Sediment GHGs production rates including CH4 production rates (A,B), CO2 production rates (C,D), N2O production rates (E,F), and total GHG production rates (G,H) were measured in summer and winter. The CM denotes C. malacensis habitat, and the SA-6, SA-10, and SA-14 denote S. alterniflora habitats for 2–6 years, 6–10 years, and 10–14 years, respectively. Different lowercase letters are used to denote statistical differences (p < 0.05) across four habitats in the same depth, while upper case letters are used to denote significant differences (p < 0.05) between the summer and winter in each habitat. ** are used to denote significant differences (p < 0.05) between surface and subsurface sediments.
Sediment CH4 production rates varied from 35.61 to 181.29 μmol kg–1 d–1 with an average value of 109.94 ± 37.27 μmol kg–1 d–1 in summer and from 35.61 to 30.88 μmol kg–1 d–1 with an average value of 20.99 ± 6.16 μmol kg–1 d–1 in winter and varied significantly with seasonal variations (Figures 3A, B, p < 0.05 for all). The spatial distribution of sediment CH4 production rates showed a similar pattern in both summer and winter with increased from CM to SA-6 to SA-10 then to SA-14. The values in C. malacensis habitat were significantly higher than those in S. alterniflora habitats (p < 0.05, Figure 3A). The values in surface sediments (0-10 cm) were generally significantly higher than those in the subsurface sediments (10-20 cm) (p < 0.05 for all, excluding SA-14). Stepwise multiple regression analysis showed that sediment CH4 production rates were correlated positively to sediment bacterial abundances, TOC, and fungal gene abundances contents and correlated negatively with sulfide contents in summer, and were correlated positively to sediment bacterial abundances, and water contents and correlated negatively with sediment depth in winter (Table 1).
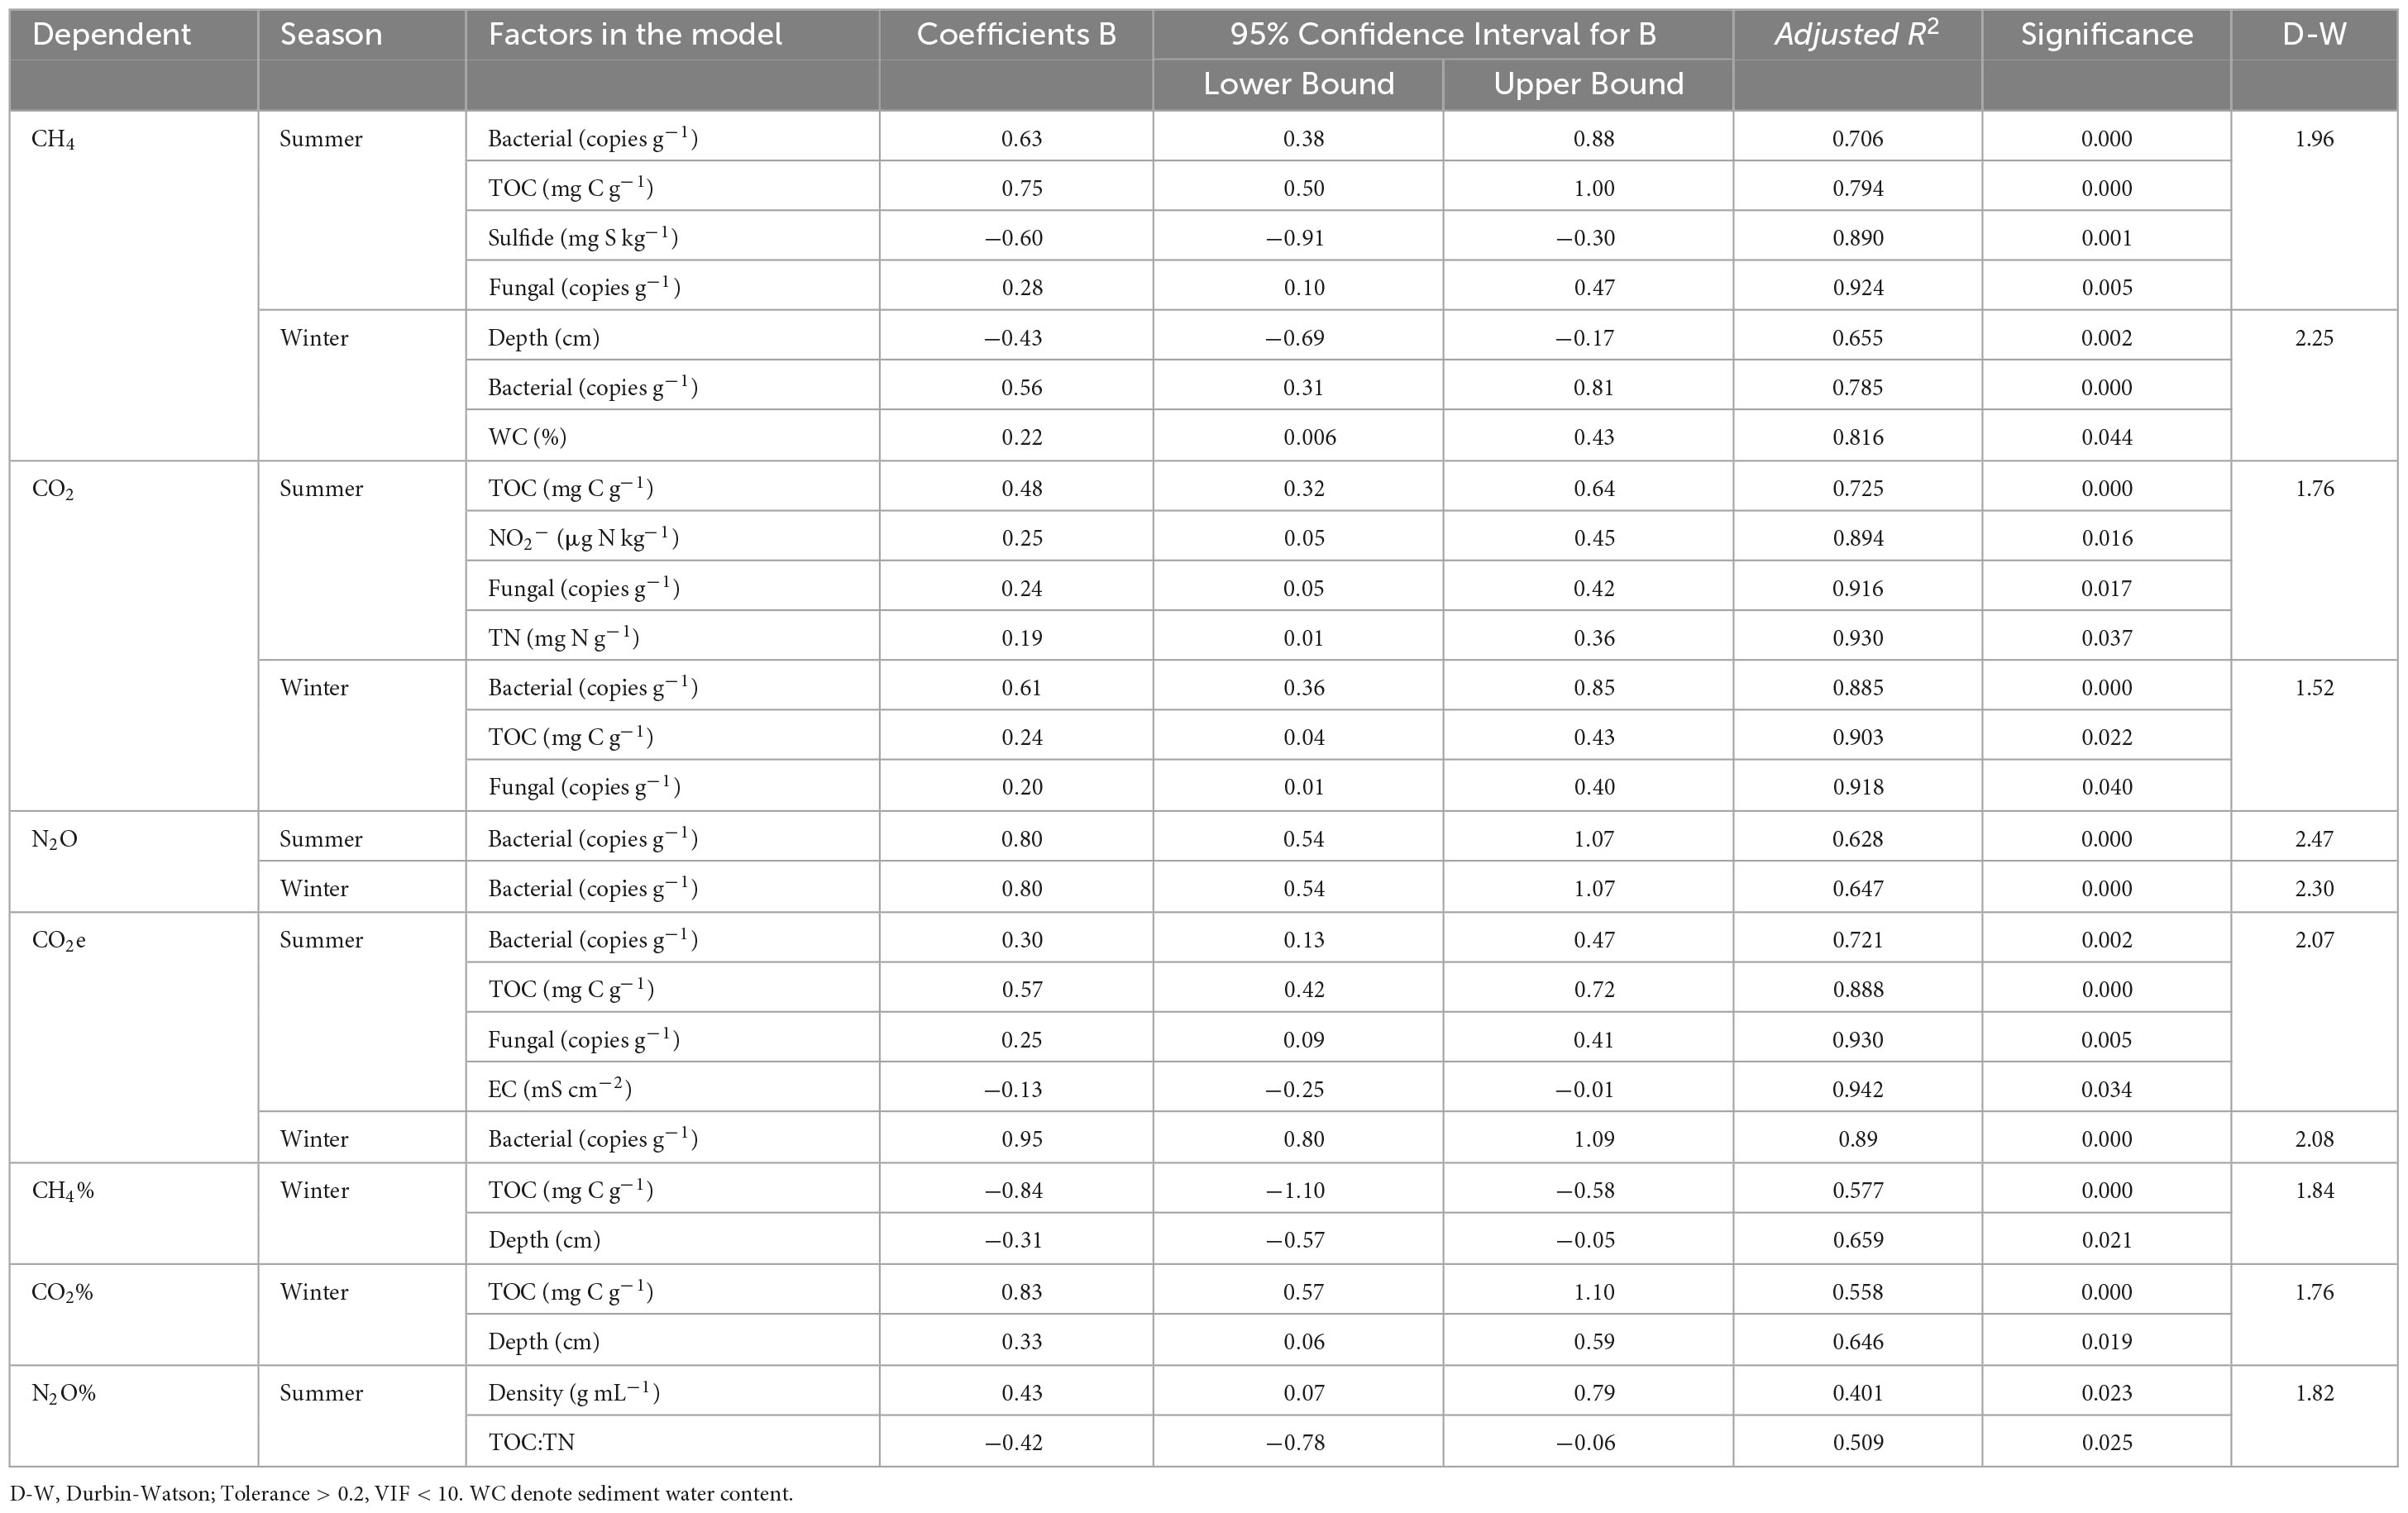
Table 1. The dependency of the CH4, CO2, N2O, CO2e, CH4%, CO2%, and N2O% in the multiple regression analyses using the stepwise method.
Sediment CO2 production rates ranged from 3.02 to 12.42 mmol kg–1 d–1 with an average value of 7.71 ± 2.27 mmol kg–1 d–1 in summer and from 1.89 to 7.12 mmol kg–1 d–1 with an average value of 4.26 ± 1.40 mmol kg–1 d–1 in winter and varied significantly with seasonal variations (Figures 3C, D, p < 0.05 for all). Spatially, sediment CO2 production rates resembled the distribution patterns of CH4 production rates, namely they increased with the increasing invasion period of S. alterniflora. The annual mean rates among these four habitats varied spacially (p < 0.05 for all, excluding between SA-6 and SA-10 in 10-20 cm sediment layer). The rates at 0-10 cm sediment layer were significantly higher than those at 10-20 cm sediment layer both in summer and winter (p < 0.05). Moreover, sediment CO2 production rates correlated positively with sediment TOC, NO2–, fungal gene abundances, and TN in summer, and correlated positively with sediment bacterial gene abundances, TOC, and fungal gene abundances in winter when considering all sites (Table 1).
Sediment N2O production rates varied from 42.44 to 136.71 nmol kg–1 d–1 with an average value of 74.95 ± 22.62 mmol kg–1 d–1 in summer and from 15.81 to 66.49 nmol kg–1 d–1 with an average value of 37.14 ± 15.08 mmol kg–1 d–1 in winter and varied significantly with seasonal variations (Figures 3E, F, p < 0.05 for all). In general, sediment N2O production rates increased with the increasing invasion period of S. alterniflora. The rates in SA-10 and SA-14 were both significantly higher than those in CM in the surface sediments (0-10 cm) (p < 0.05), and the winter rates in SA-14 were significantly higher than those in CM and SA-6 in subsurface sediments (10-20 cm) (p < 0.05 for both). The rates at the surface (0-10 cm) were also significantly higher than those at the subsurface (10-20 cm) (p < 0.05 for all). Moreover, we found that sediment N2O production rates were correlated positively to sediment bacterial gene abundances in both summer and winter (Table 1).
The total GHG production rates were determined by converting the rates of CH4 and N2O production to CO2-equivalent (CO2e) rates and then adding the CO2e rates of CO2, CH4, and N2O together. Total GHGs rates ranged from 158.46 to 629.29 mg CO2 kg–1 d–1 with an average value of 389.54 ± 115.72 mmol kg–1 d–1 in summer and from 89.51 to 325.53 mg CO2 kg–1 d–1 with an average value of 197.08 ± 64.09 mmol kg–1 d–1 in winter, respectively and varied significantly with seasonal variations (Figures 3G, H, p < 0.05 for all). The total GHG production rates showed similar distribution patterns to those of sediment CH4 and CO2 production rates. Signiffcant spatial differences in the total GHG production rates in those habitats were observed (p < 0.05 for all; excluding between SA-6 and SA-10 in winter). The rates at the surface (0-10 cm) were significantly higher than those at subsurface (10-20 cm) both in summer and winter (p < 0.05). Additionally, the total GHG production rates were correlated positively with sediment sediment bacterial gene abundances, TOC, fungal gene abundances, and EC in summer, and correlated positively with sediment bacterial gene abundances in winter (Table 1).
The contribution of sediment CH4, CO2, and N2O production rates to total GHG production rates was expressed as CH4%, CO2%, and N2O%, respectively. There is no obvious change pattern in space in three values. CO2 was the predominant component of the total GHGs emissions (in CO2e) in both summer (87.22 ± 1.71%) and winter (94.83 ± 1.06%). The values were lower in summer than in winter with a marked seasonal difference within these four habitats (p < 0.05; Figures 4C, D). CO2% were correlated positively to sediment TOC and depth in winter (Table 1). CH4 represented 12.54 ± 1.71% of total GHGs emissions in summer and represented 4.95 ± 1.04% of total GHGs emissions in winter. CH4% was higher in summer than in winter with a significant seasonal variation (p < 0.05; Figures 4A, B). CH4% were correlated negatively to sediment TOC and depth in winter (Table 1). N2O was of minor importance to total GHGs emissions, which contributed 0.24 ± 0.07% and 0.23 ± 0.05% to total GHGs emissions in summer and winter, respectively. No seasonal variation in N2O% was observed in those four habitats in both two layers (p > 0.05; Figures 4E, F). N2O% were correlated positively to sediment bulk density and correlated negatively to sediment depth in summer (Table 1).
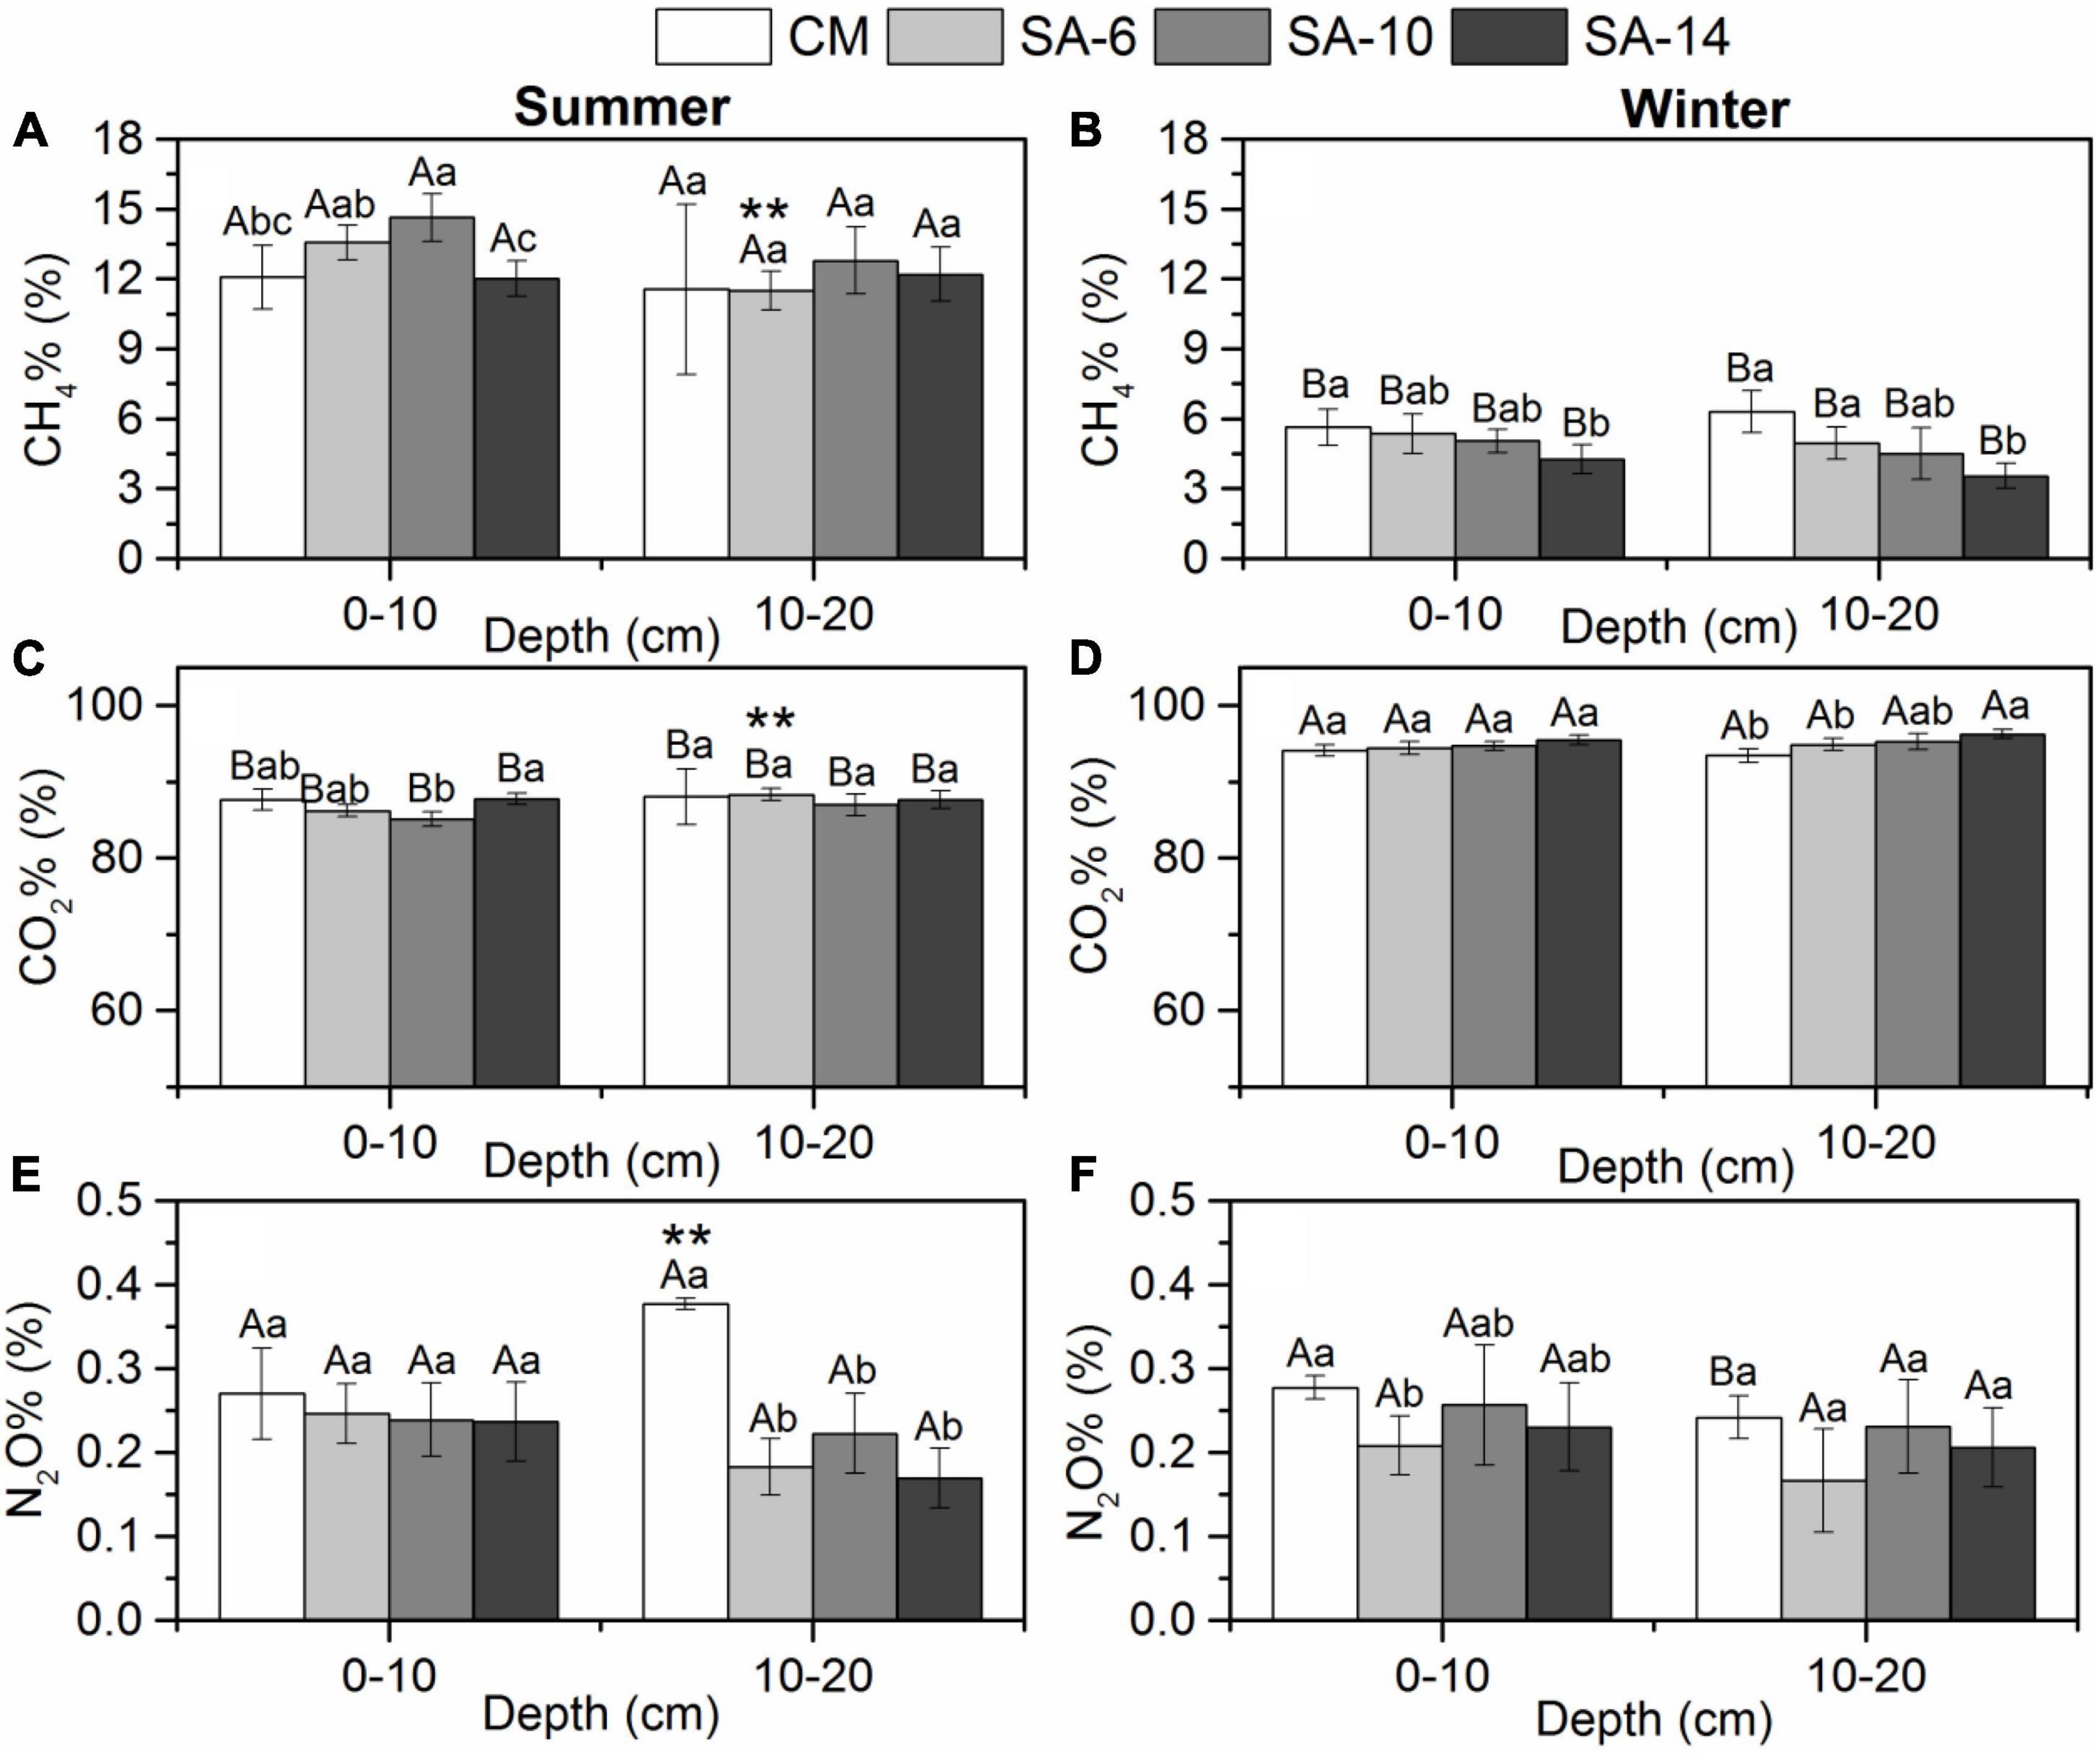
Figure 4. The effects of invasive S. alternifolia on sediment CH4% (A,B), CO2% (C,D), and N2O% (E,F) along four habitats (Mean ± SD). The CM denotes C. malacensis habitat, and the SA-6, SA-10, and SA-14 denote S. alterniflora habitats for 2–6, 6–10, and 10–14 years, respectively. Different lowercase letters are used to denote statistical differences (p < 0.05) across four habitats in the same depth, while upper case letters are used to denote significant differences (p < 0.05) between summer and winter in each habitat. ** are used to denote significant differences (p < 0.05) between surface and subsurface sediments.
3.3 Sediment microbial characteristics
The bacterial 16S rRNA abundances ranged between 1.08–9.29 × 10⁹, and 0.72–9.36 × 10⁹ copies g–1 in summer and winter, respectively, showing no significant temporal differences (Figures 5A, B). Spatial distribution of sediment bacterial 16S rRNA abundances showed a similar pattern in both summer and winter with increased from CM to SA-6 to SA-10 then to SA-14. Significant spatial differences in bacterial 16S rRNA abundances observed among all habitats in summer and winter (p < 0.05). Also, the bacterial 16S rRNA abundances at 0-10 cm sediment layer were significantly higher than those at 10-20 cm sediment layer both in summer and winter (p < 0.05).
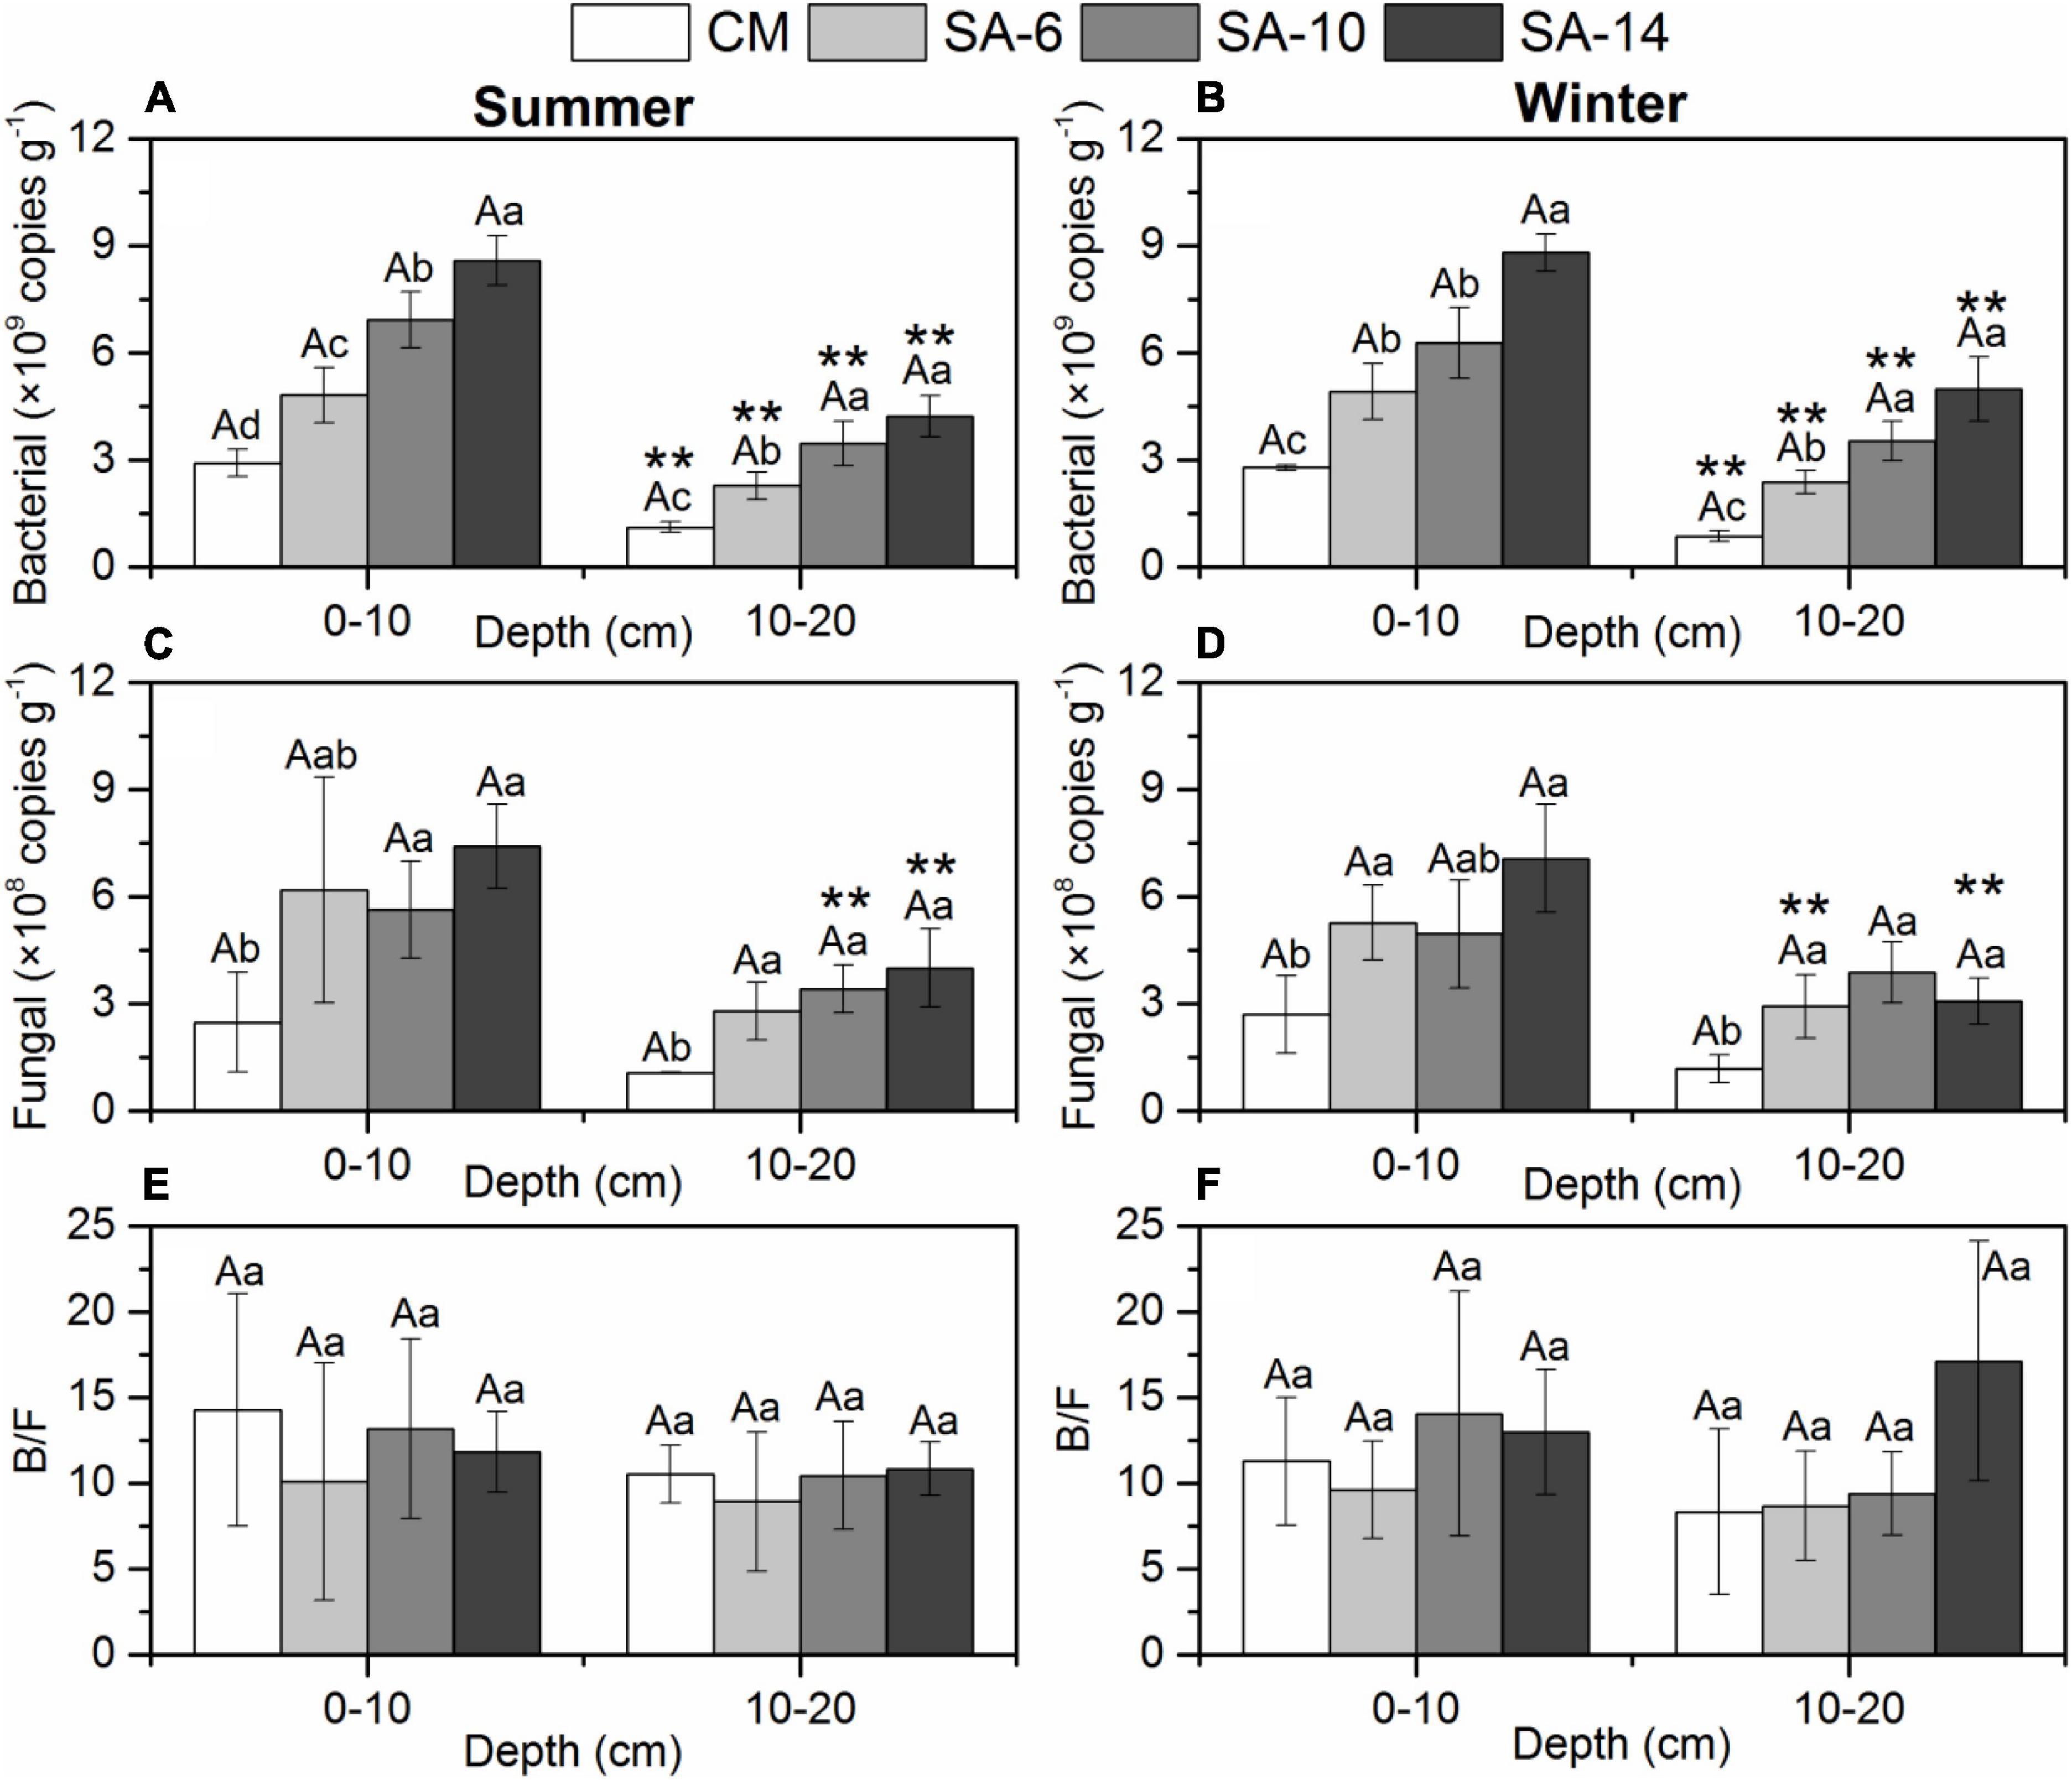
Figure 5. Sediment bacterial gene abundances (A,B), fungal gene abundances (C,D), and the ratio of B/F (E,F) along four habitats. Lowercase letters are used to indicate significant differences (p < 0.05) among different plant communities, while uppercase letters are used to show significant differences (p < 0.05) between summer and winter within each habitat. The error bars represent standard deviation. ** are used to denote significant differences (p < 0.05) between surface and subsurface sediments.
Fungal gene abundances were in a range of 1.03–9.37 × 10⁸, and 0.74–8.52 × 10⁸ copies g–1 in summer and winter, respectively, showing no significant temporal differences (Figures 5C, D). In general, this gene abundances increased with the increase in the invasion period of S. alterniflora. This values in CM habitat were generally significantly higher than those in S. alterniflora habitats (SA-6, SA-10, and SA-14) (p < 0.05 for all; Figures 5C, D). The fungal gene abundances in surface sediments (0-10 cm) were generally higher than those in subsurface sediments (10-20 cm). In addition, there is no significant seasonal and spatial difference in the ratio of bacterial gene abundances to fungal gene abundances (B/F) in our study (Figures 5E, F).
4 Discussion
Estuarine coastal wetland serve as transitional zones connecting terrestrial and marine ecosystems, which plays a significant role in the global C and N cycles and serve as an important source of GHGs emissions (Tan et al., 2020). The abundant vegetation found within wetlands can influence the production, consumption, and transport processes of GHGs, making it a key factor in regulating the “source” and “sink” functions of GHGs in wetland systems. This study focuses on the Minjiang Estuary as the research area, investigating the impact of different invasion durations of S. alterniflora on the potential GHGs production rates in sediments of the native salt marsh wetlands. We examined the patterns in GHGs production rates in surface and subsurface sediments across four habitats (CM, SA-6, SA-10, and SA-14) in the Minjiang Estuary. Seasonally, the production rates of GHGs were significantly higher in summer compared to winter (p < 0.05; Figure 3), and the seasonal fluctuations in these three rates were closely linked to changes in temperature. Spatially, sediment GHGs production rates increase from CM to SA-6 to SA-10 finally to SA-14. This spatial variation pattern in response to increasing sediment organic matter and microbial gene abundances (Figures 3, 5). Furthermore, these rates in the upper sediment layers (0-10 cm) were consistently observed to be significantly higher than those in the deeper layers (10-20 cm) (Figure 3). Thus, spatio-temporal variation characteristics of sediment GHGs production rates in the complex tidal flat wetlands are comprehensively influenced by various factors, including seasonal temperature fluctuations, vegetation types, and sediment depth. A comprehensive understanding of the environmental factors that drive the variability in sediment GHGs production rates in native C. malacensis invaded by S. alterniflora is crucial for evaluating the ecological impacts of this invasion.
Our findings provide important insights into the dynamics of sediment GHGs production rates in native C. malacensis wetlands invaded by S. alterniflora. Seasonally, sediment GHGs production rates were significantly higher in summer (32.97 ± 1.11°C) compared to winter (17.28 ± 0.47°C) in both surface and subsurface sediments among these habitats (p < 0.05 for all, Figure 3). Temperature has been identified as a significant factor that can impact GHGs emissions by influencing soil/sediment organic matter mineralization, chemical reaction rate, and gases diffusion (Baldock et al., 2012; Inglett et al., 2012). Numerous studies have demonstrated that increasing temperatures can enhance GHGs emissions from soil, potentially triggering a positive feedback loop to climate change (Davidson and Janssens, 2006; Bonnett et al., 2013; Li et al., 2020; Zhang et al., 2020). Also, GHGs emissions are predicted to raise the mean global temperature by 2.6–4.8°C by the end of the century (IPCC, 2014). Thus, seasonal temperature fluctuations as a key controlling factor driving seasonal variations in the GHGs production in estuarine and coastal sediments.
S. alterniflora invasion can slightly increase the temperature sensitivities (Q10) of sediment CH4, CO2, and N2O production rates, but without significant differences (Figure 7). This is mainly attributed to the fact that S. alterniflora invasion can lead to an increase in sediment organic matter (substrates), but the degree of increase is not significant (Figure 2). Interestingly, we found that S. alterniflora invasion significantly increased the temperature sensitivity of total GHGs production rates in sub-surface sediments, but no significant difference was observed in surface sediments (Figure 6D). This finding is likely due to S. alterniflora having more developed root systems and a higher underground biomass than those of native C. malacensis (Jin et al., 2017). Developed root systems can effectively promote organic matter in deeper soil layers. Namely by changing the substrates concentrations required for GHGs production, it can affect the Q10 of GHGs production in the subsurface sediments. Nevertheless, there was no significant variation in the Q10 values of sediment GHGs production rates between surface and subsurface sediments (Figures 6A–D), suggesting that both surface and subsurface layers exhibited similar responses to increasing temperatures. Overall, S. alterniflora invasion has a limited impact on Q10 of sediment GHGs production rates, especially in surface sediments.
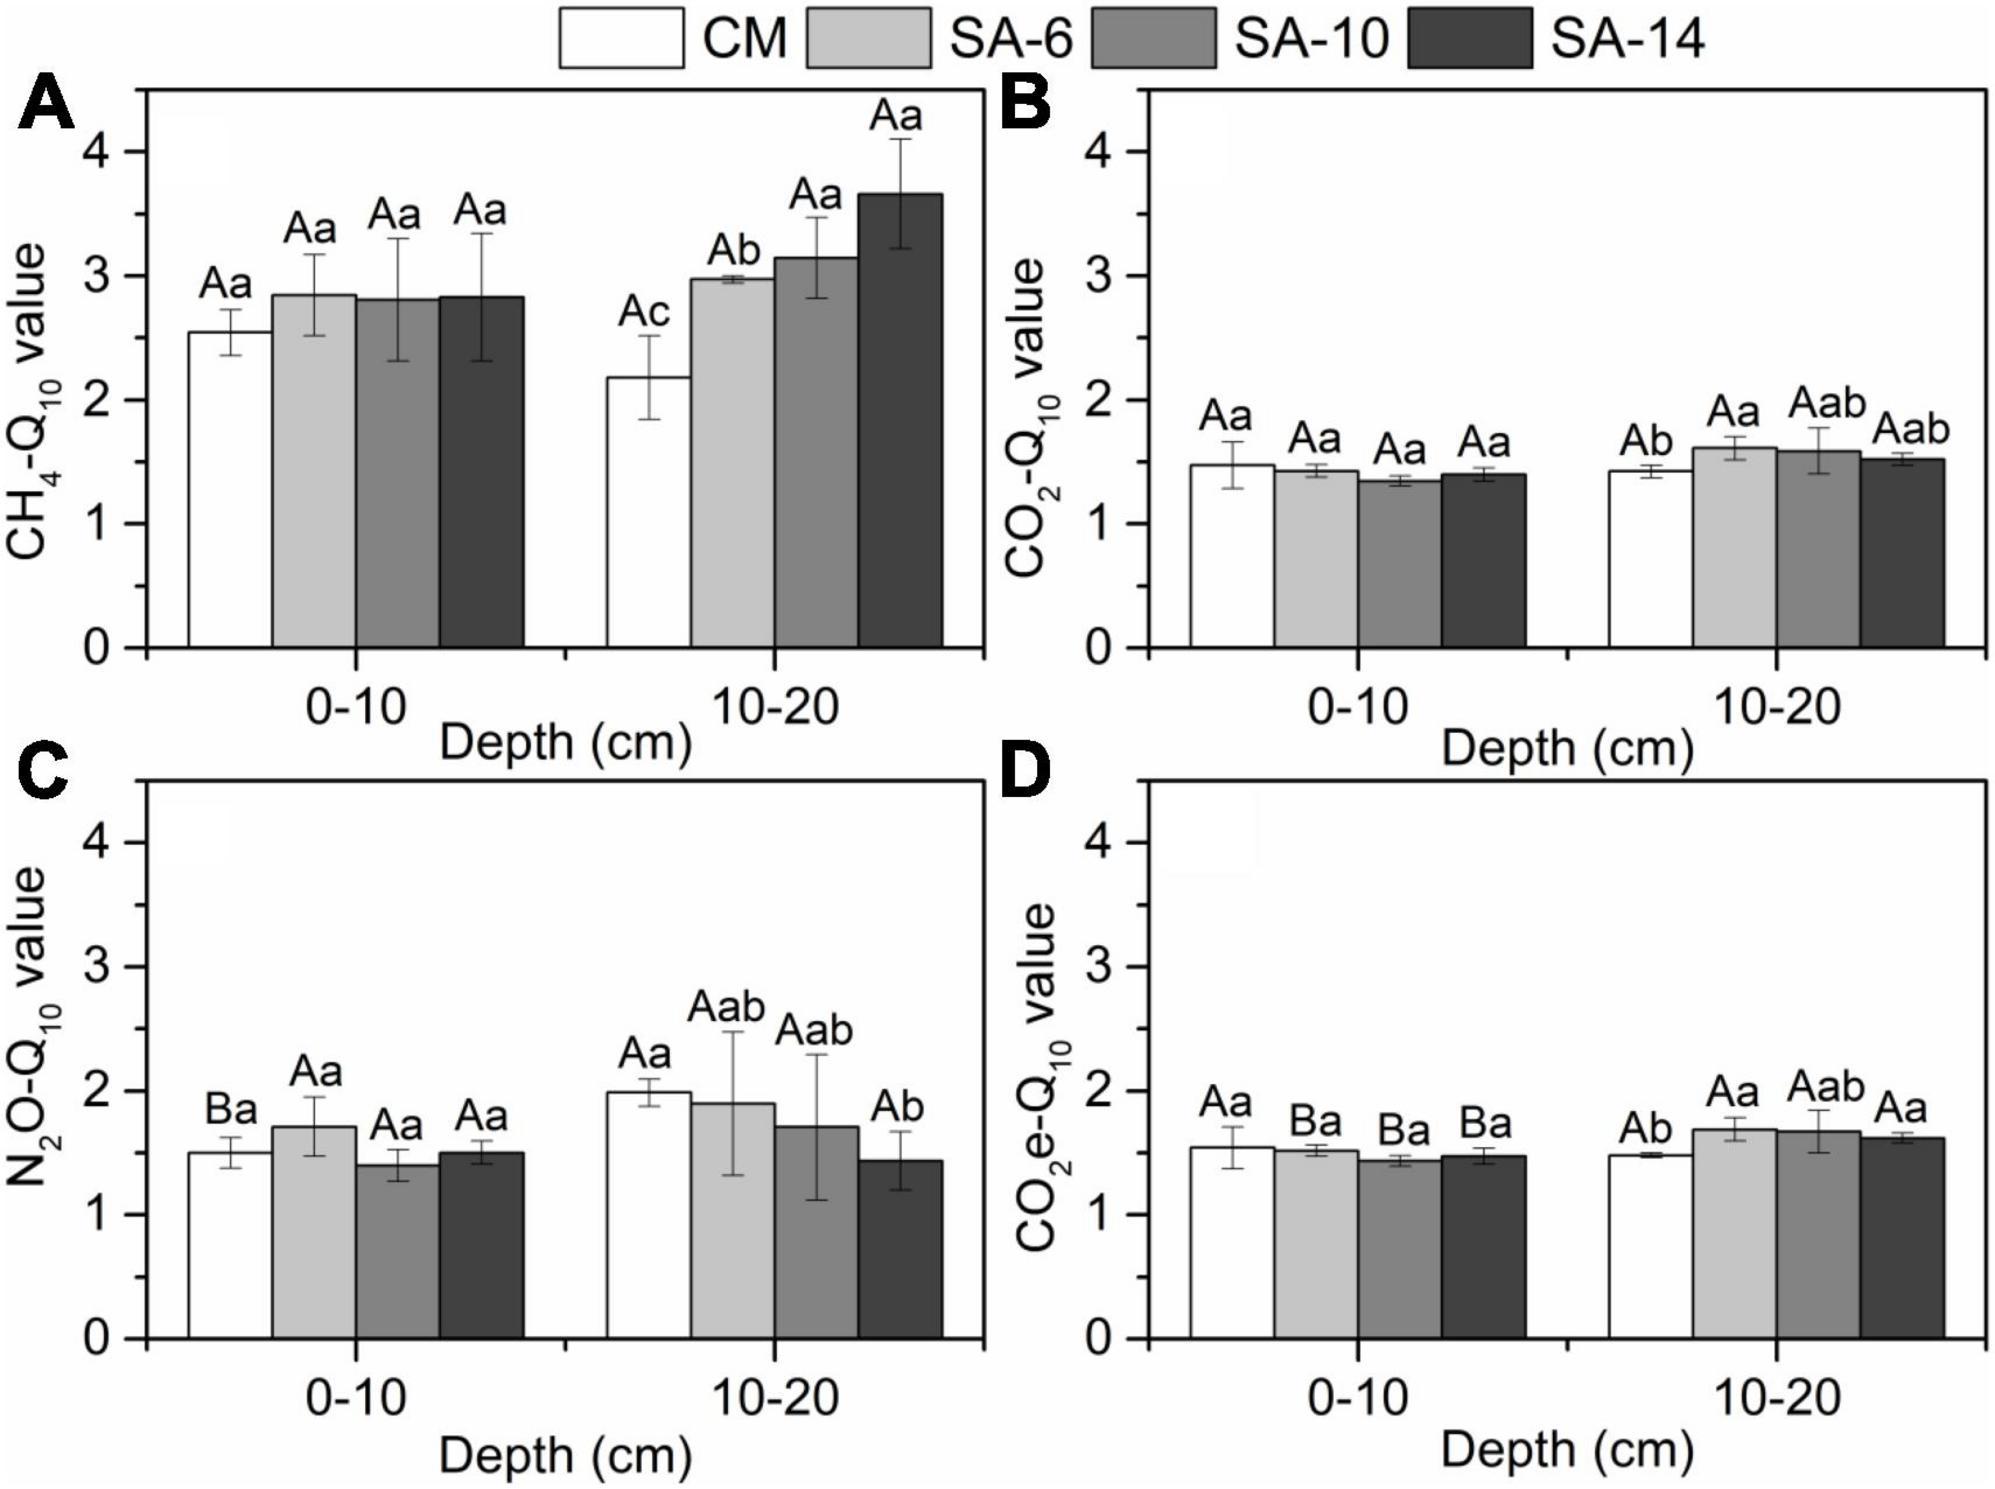
Figure 6. Variations in the temperature sensitivity (Q10) of sediment GHGs production rates (A–D) along four habitats. Different lower case letters indicate significant differences among these habitats, and upper case letters denote significant differences between the surface and subsurface sediments within each habitat. The errors represent standard deviation.
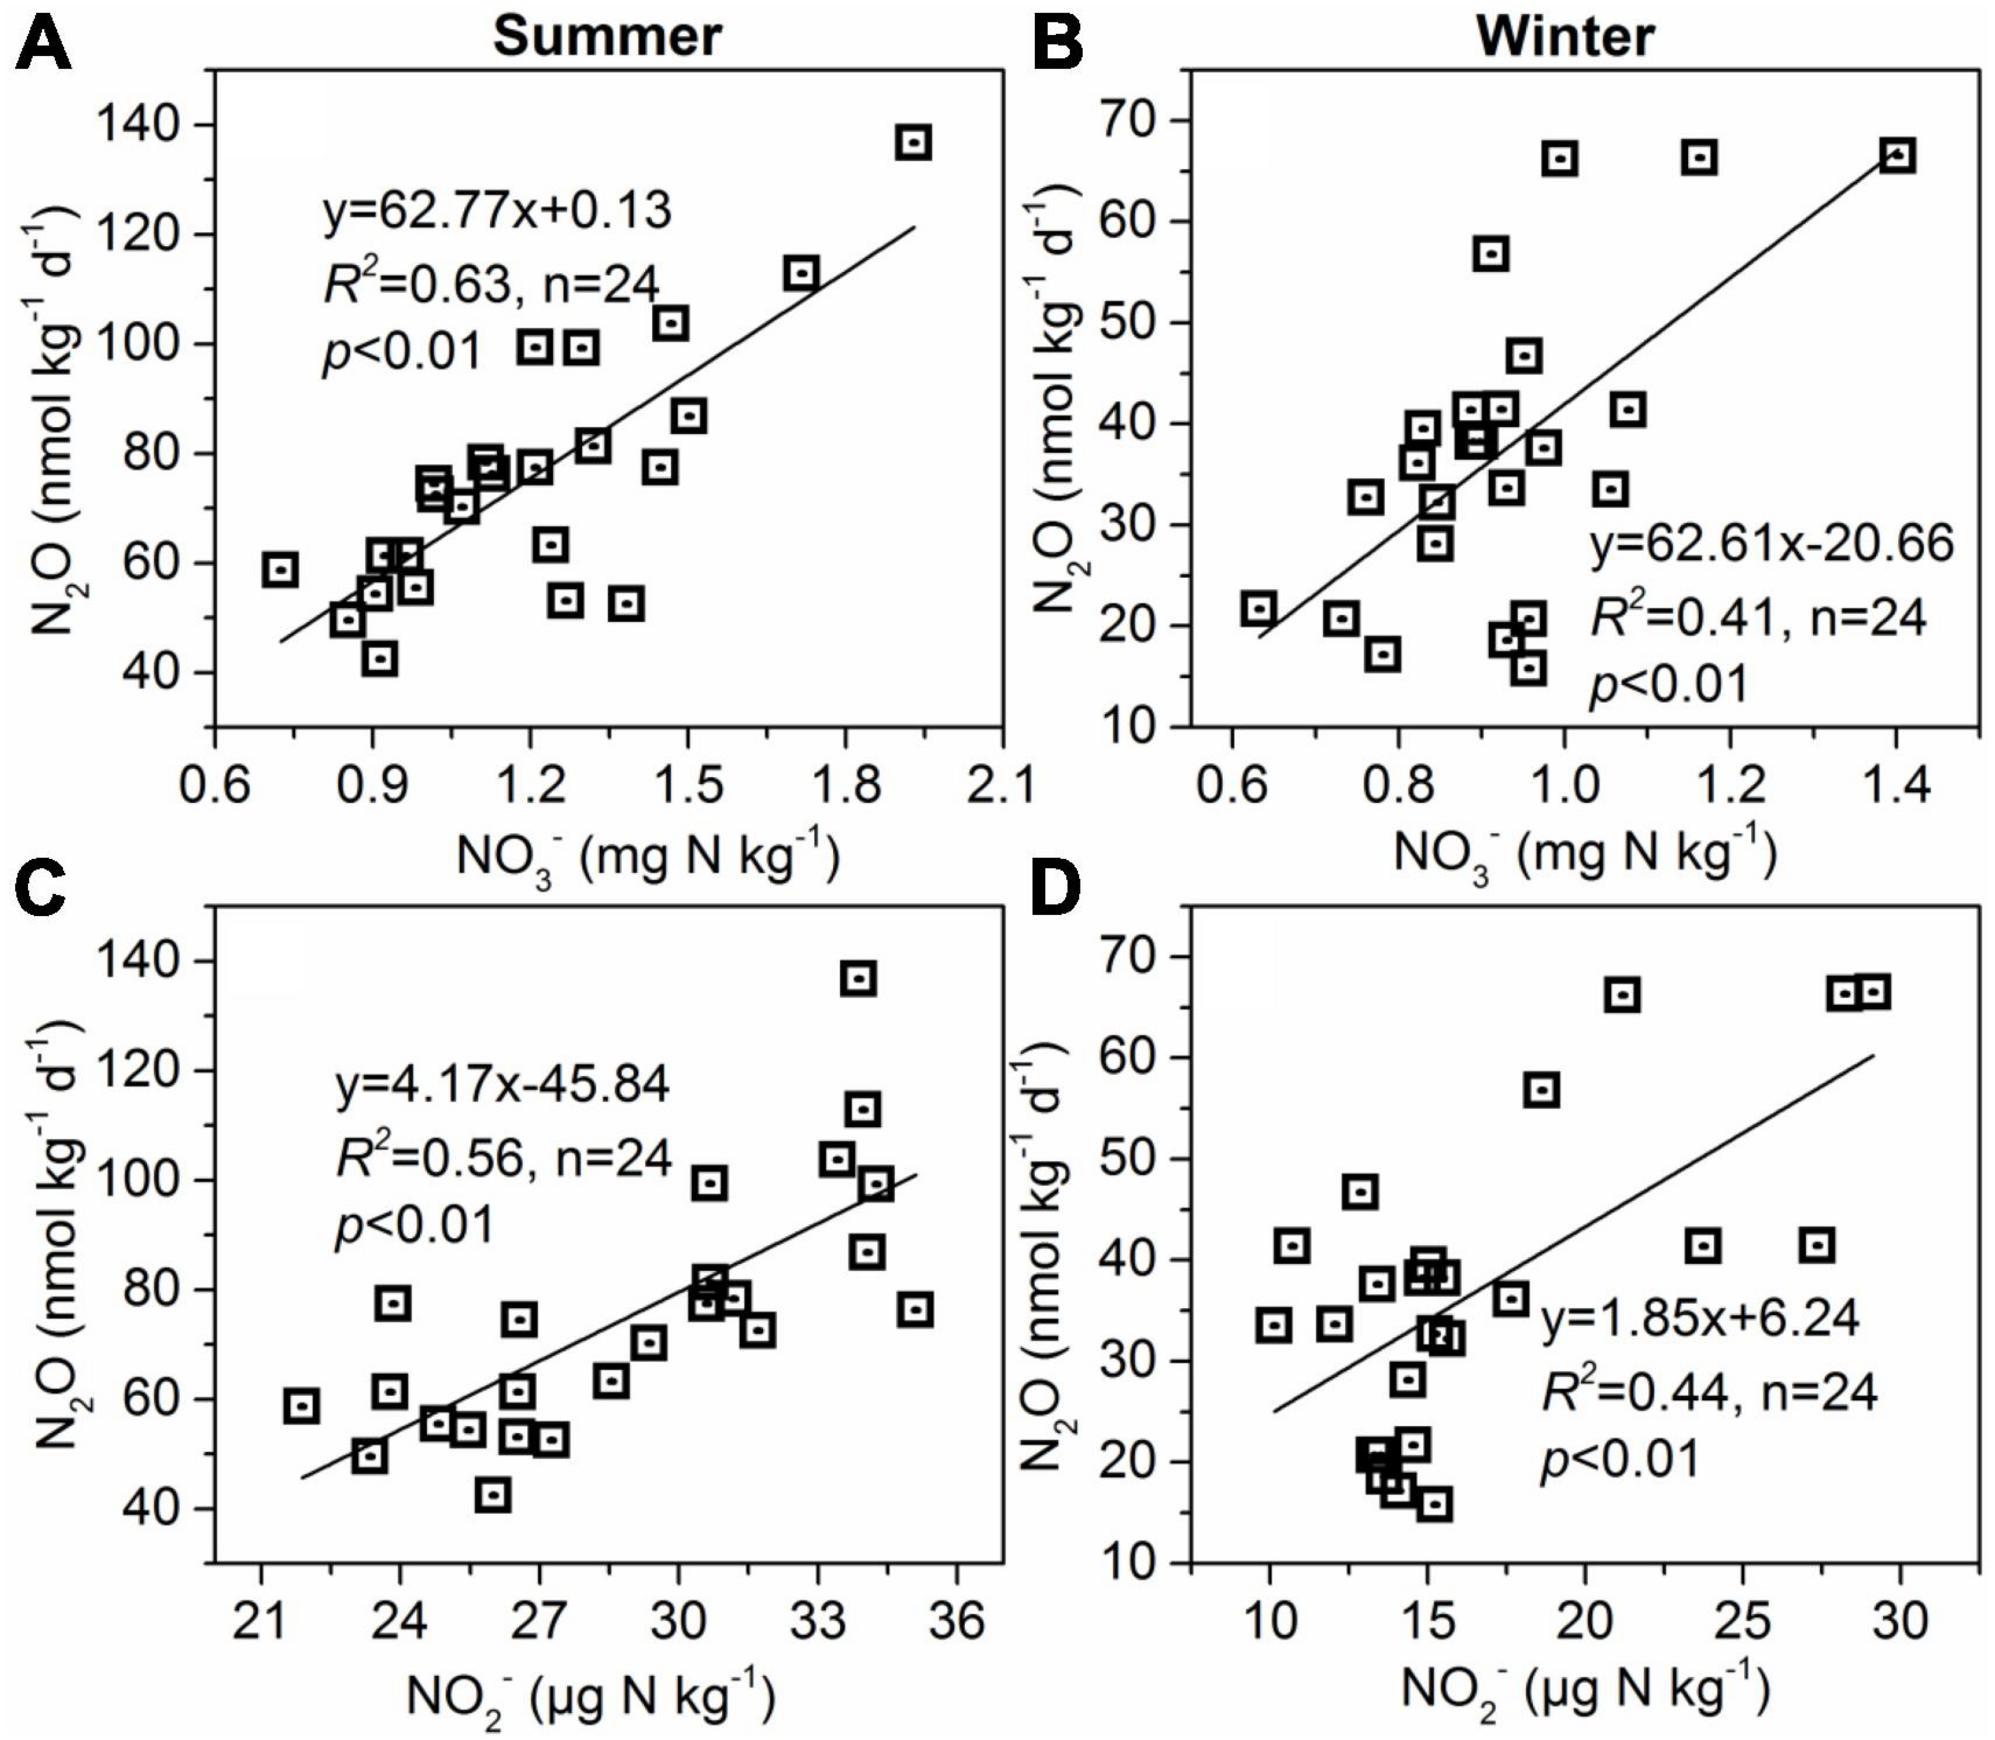
Figure 7. Relationships between sediment N2O production rates and sediment NO3– (A,B) and NO2– (C,D) contents in summer and winter.
Meanwhile, temperature sensitivity of CH4 production rates calculated from seasonal temperature differences is significantly higher than that of the other two GHGs in the study (Figure 5A), and the CH4% in summer was obvious higher that in winter (Figures 4A, B). Considering that our study area is located in a subtropical monsoon climate zone, the salinity in the estuarine area is significantly lower in summer than in winter due to seasonal influences. CH4 emission is more responsive to salinity compared to the other two GHGs. Previous studies have generally shown a significant negative correlation between salinity and CH4 emission rates (Nyman and DeLaune, 1991; Marton et al., 2012; Neubauer, 2013). This is mainly due to the increase in the concentration of sulfate ions (SO42–) available for sulfate-reducing bacteria with increasing salinity, leading to a shift from CH4 production processes to sulfate reduction processes in marsh wetlands, thereby reducing CH4 production rates (Sotomayor et al., 1994; Weston et al., 2006). In addition, sulfate-reducing bacteria can oxidize CH4, leading to a decrease in sediment CH4 emission (Devol and Ahmed, 1981; Iversen and Jørgensen, 1985). Thus, the seasonal variation characteristics of GHGs production rates, especially CH4, are also controlled by seasonal salinity change in estuarine and coastal sediments.
Our measured sediment GHGs production rates and organic matter (TOC and TN) showed a similar spatial distribution pattern (Figures 2, 3). Sediment GHGs production rates were larger in S. alterniflora than in C. malacensis, and the values increased with the invasion degree of S. alterniflora. We also found the sediment GHGs production rates were correlated positively to TOC (Table 1). It’s well believed that labile organic carbon is considered highly reactive indicator of GHGs emission in various ecosystems (Inubushi et al., 2003; Chen et al., 2010; Lin and Lin, 2022). The CO2 or CH4 release from sediment depend on mineralization, decomposition, or fermentation of organic carbon. In general, sediment organic matter concentrations in estuarine and coastal wetlands are closely linked to the growth of vegetation, and higher net primary production can increase their concentrations through litter and root inputs (Tong et al., 2011; Teng and Lin, 2024). It has been demonstrated that S. alterniflora exhibited higher above ground and root biomass in comparison to C. malacensis (Gao et al., 2017), which explained well the changes in TOC mentioned above. For N2O, the pathways of N2O production in tidal flat wetland sediments mainly include denitrification and nitrification processes. Previous studies have demonstrated that organic carbon plays a key role in controlling the heterotrophic denitrification process in sediment/soil from various ecosystems (Cheng et al., 2016; Huang et al., 2021; Zhang et al., 2023), organic carbon can function both as electron donors and as a source of energy for denitrifying bacteria (Shan et al., 2016). In anaerobic-dominated estuarine tidal flat sediments, the production of N2O may predominantly arise from denitrification processes. Thus, the organic carbon content in sediments shapes spatial variations in sediment N2O production rates by directly influencing heterotrophic denitrification processes.
In the vertical profile, we found that sediment TOC was higher in the top layer than in the subsurface in C. malacensis, while there were similar levels between these two depths in S. alterniflora (Figure 2). It is well known that sediment organic matter level in the surface layer is expected to be higher than that in the deeper layer due to the inputs of fallen twigs and leaves (Xia et al., 2021). This divergent outcome could be linked to variations in root systems across these habitats (Emery and Fulweiler, 2014). S. alterniflora has more extensive and developed root systems than C. malacensis, leading to a lack of significant decrease in organic matter contents at the subsurface layer (10-20 cm) in the S. alterniflora. Therefore, S. alternifolia invasion changed the vertical distribution characteristics of sediment organic matter. However, this alteration did not affect the vertical differences in GHGs production rates. We found that sediment GHGs production rates in surface sediments were significantly higher than those in subsurface sediments in both C. malacensis and S. alterniflora habitats. This maybe due to the fact that sediment GHGs production rates are mainly controlled by the microbial gene abundances in our study (Table 1), and the S. alterniflora invasion did not alter their vertical distribution characteristics (Figure 5).
The stepwise multiple regression analysis in the present study shows that bacterial 16S rRNA abundances in sediment was the key contributing factor to N2O production, accounting for 62.8% and 64.7% of the variation in summer and winter, respectively (Table 1). It is well known that microbial-driven nitrification and denitrification processes occurring in tidal marsh wetland sediments are the main sources of N2O production (Morse and Bernhardt, 2013). These two processes are primarily biological processes, thus the nitrifying and denitrifying bacteria are crucial in influencing N2O production in esturine and coastal wetland sediments (Wang et al., 2007). In addition, although sediment NH4+, NO2–, and NO3– were not included in the model as a key factor controlling sediment N2O production rates through multiple regression analysis in our study (Table 1), linear correlation analysis showed significant correlations between N2O production rates and NO2– and NO3– (Figures 7A–D). Probably, denitrification was the major process for N2O production in these anaerobic environments in this study.
Previous research findings confirmed that S. alterniflora invasion generated higher CH4 emissions than those from Phragmites australis, Scirpus mariqueter, Cyperus malacensis, and bare tidal flats in estuarine and coastal wetlands, and it is consistent with our results (Table 2). S. alterniflora, as a C4 plant, can significantly increase sediment TOC, TN, MBC, humic substances and nutrient contents in tidal flat sediments. S. alterniflora invasion can increase soil CH4 emissions by changing sediment environmental conditions. Previous studies have demonstrated that under anaerobic conditions, CH4 can be transformed through the utilization of alternative electron acceptors, including sulfate, NO3–, Fe(III), Mn(III, IV), and humic substances (Bridgham et al., 2013). Also, S. alterniflora invasion inhibited the expression of CH4 oxidation-associated functional genes. In the S. alterniflora habitat, a greater relative abundance of type II methanotrophs and a lower relative abundance of type I methanotrophs were observed compared to the Scirpus mariqueter habitat (He et al., 2021). The significant increase in CH4 production was facilitated by the invasion of S. alterniflora should be taken seriously, given that the global warming potential of CH4 is about 28 times greater than that of CO2.
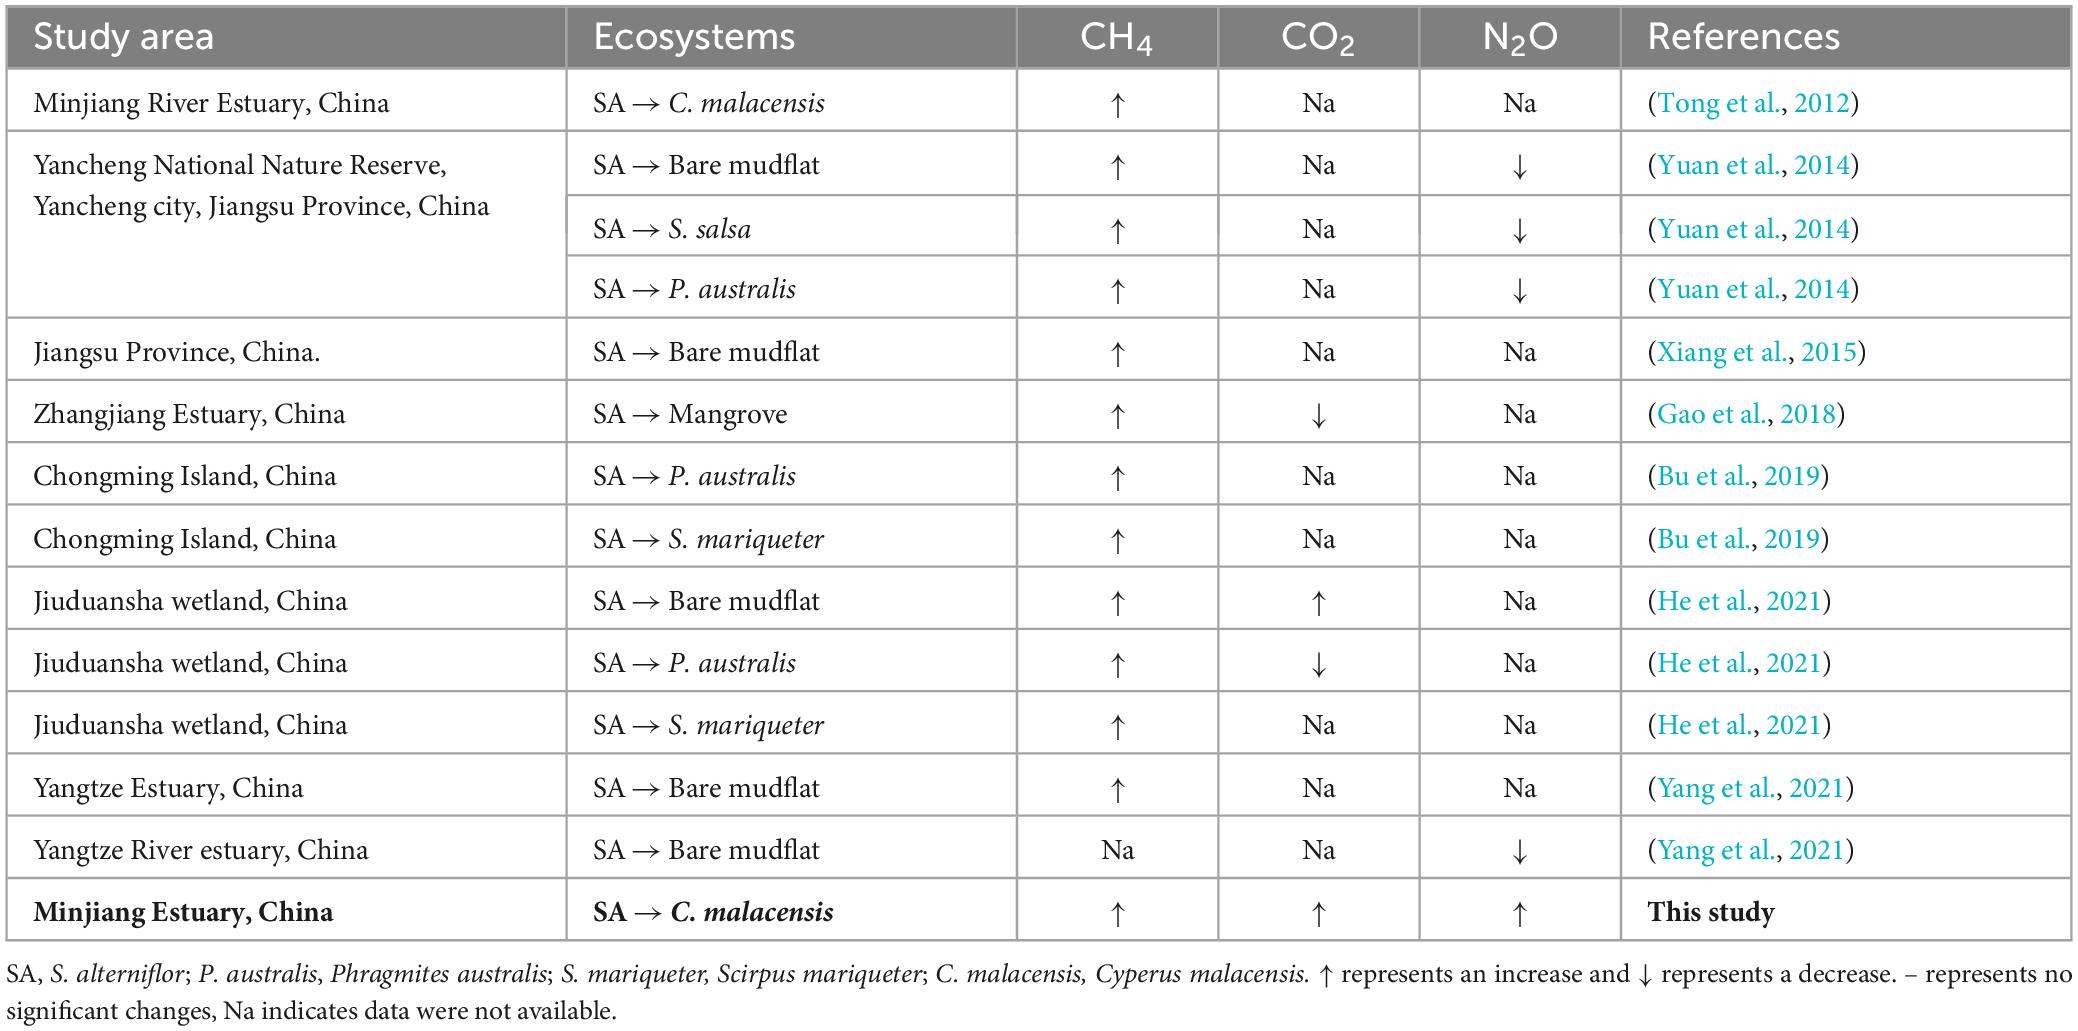
Table 2. Response of GHGs emission/production from to S. alterniflora in this study and other estuarine and coastal wetlands.
For CO2, the invasion of S. alterniflora, a C4 plant, can enhance sediment CO2 production rates when invading C3 plants or bare mudflat. However, when invading mangrove wetlands, it may reduce the sediment CO2 production rates. Additionally, there are studies indicating that the invasion of S. alterniflora into Phragmites australis has no significant impact on CO2 emissions. From the perspective of GHGs emission reduction, if sediment organic carbon in ecosystems needs to be cycled and released into the atmosphere, we prefer it to be released in the form of CO2 rather than CH4.
It should be noted that our measured potential GHGs production rates may overestimate the GHGs emissions from wetlands and should only be considered as indicative. Future research should conduct a large number of field studies (a static closed chamber method) to obtain more accurate and realistic field survey data reflecting the emissions fluxes of GHGs in outdoor environments. In addition, salt marsh ecosystems are important blue carbon systems on Earth, but their sediments remain a significant source of GHGs emissions. It is essential to have a clearer understanding of the GHGs emissions from different media in salt marsh ecosystems to provide accurate foundational data support for carbon mitigation initiatives.
Our findings suggest that the presence of invasive S. alterniflora led to elevated organic matter levels in sediment within estuarine and coastal wetlands, potentially promoting C accumulation and storage (Figure 8). Nevertheless, the decomposition and mineralization potential of organic matter also rose with the degree of S. alterniflora invasion, leading to an acceleration in CH4, CO2, and N2O emissions that could impact climate change. Therefore, as the expansion of S. alterniflora continues and displaces native plants, there is a possibility of simultaneous increases in carbon accumulation and greenhouse gas emissions. Indeed, there are debates surrounding the ecological and environmental implications following the invasion of S. alterniflora, highlighting the need for further investigation. To gain a deeper insight into the dynamics of GHGs emissions in response to the invasive S. alterniflora, future studies should also focus on more about sediment microbial communities associated with GHGs production. Overall, our findings underscored the significance of S. alterniflora invasion in regulating GHGs production in coastal wetland sediments, providing essential data for estimating GHGs emissions and carbon sequestration in these intricate tidal wetland ecosystems.
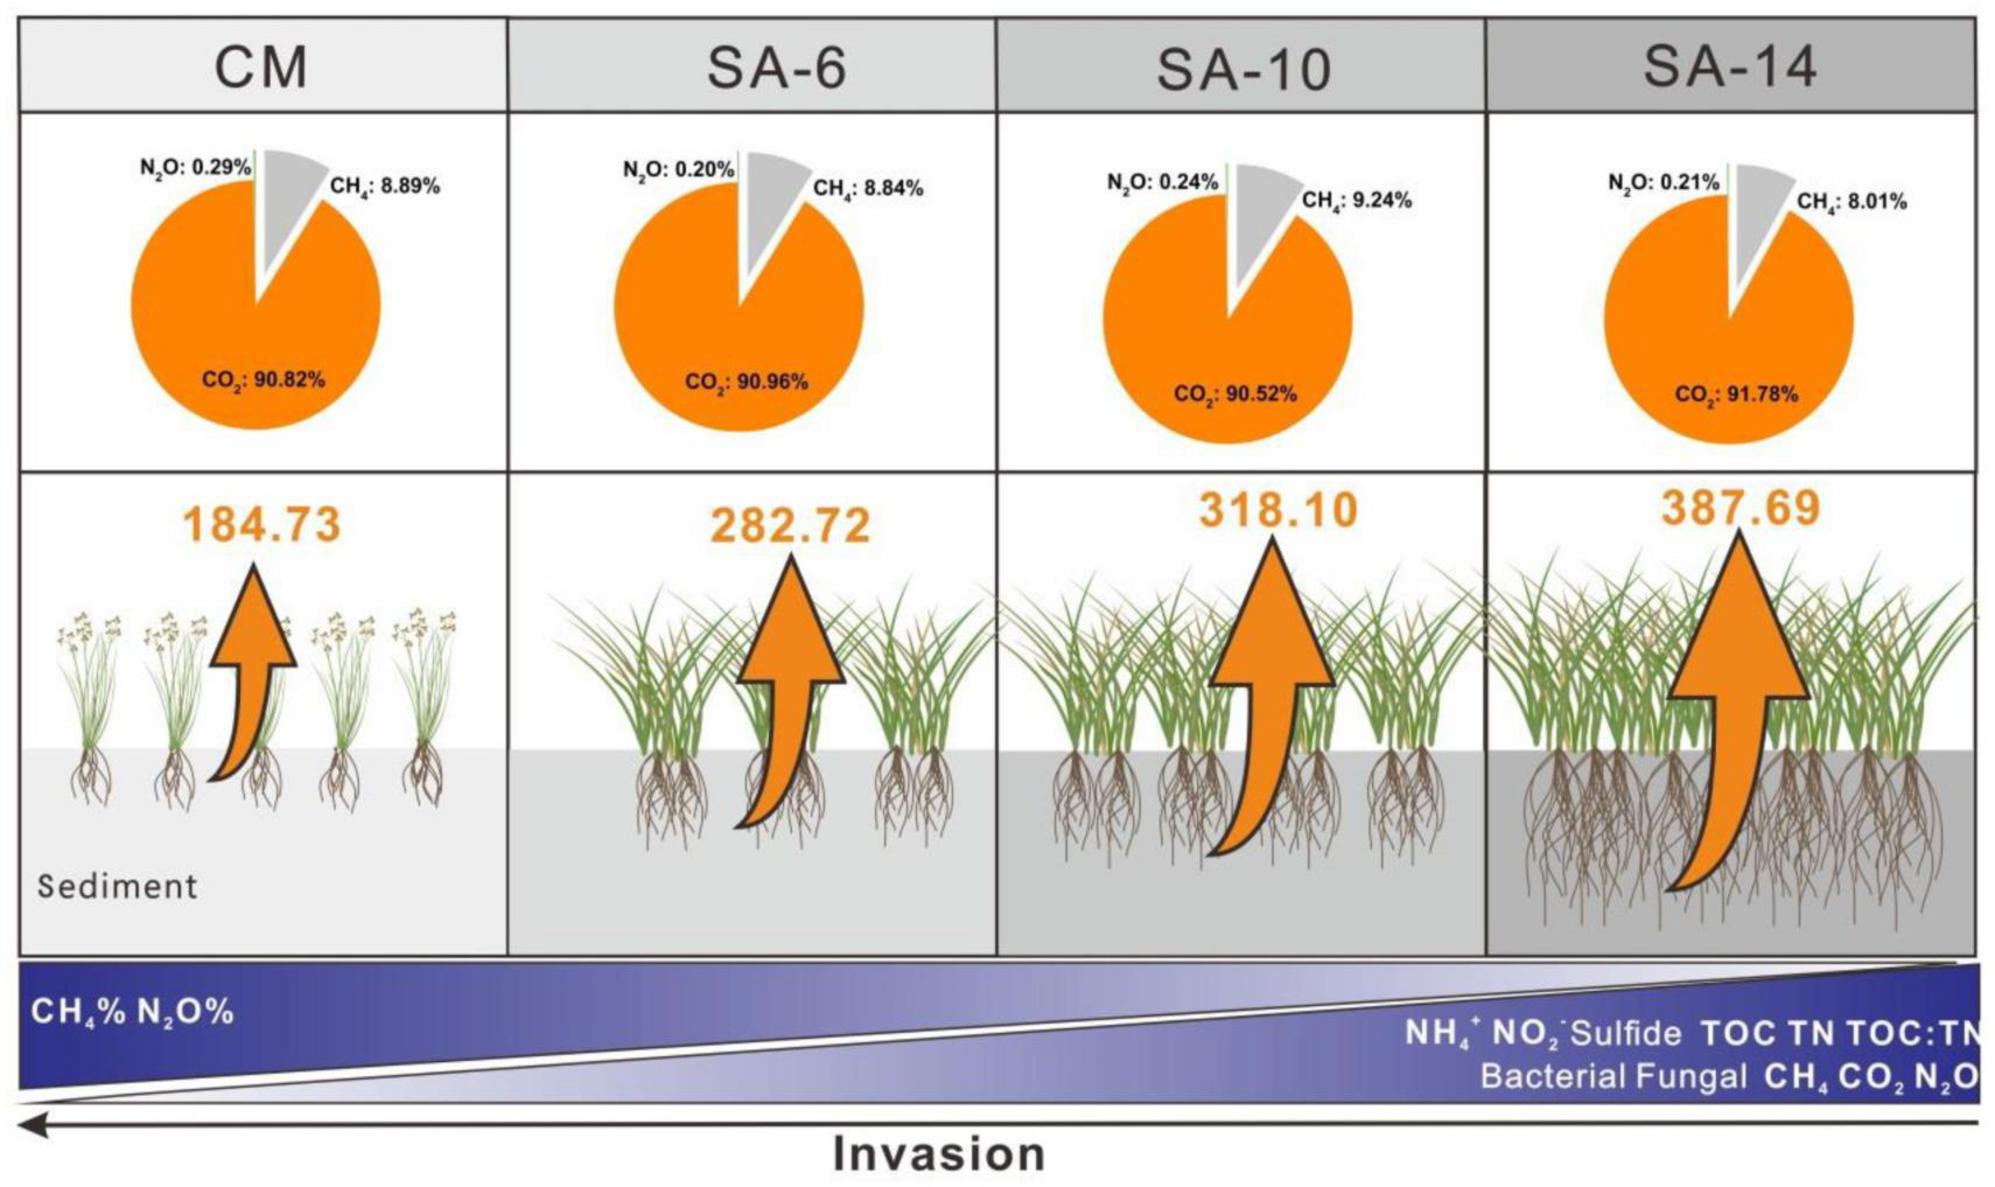
Figure 8. Sediment (0-20 cm) GHGs production rates and relative contributions along four types of plant community. The values are average for summer and winter. The orange arrows indicate the GHGs production rates, and the size of the arrow represents the magnitude of the rates. The CM denotes C. malacensis habitat, and the SA-6, SA-10, and SA-14 denote S. alterniflora habitats for 2–6 years, 6–10 years, and 10–14 years, respectively.
5 Conclusion
Our study reported the variations in sediment physicochemical properties, GHGs production, and microbial gene abundances dynamics along invasion degrees of S. alterniflora in a subtropical estuarine wetland of China. Invasive S. alterniflora generally raised sediment organic matter and microbial gene abundances. Sediment GHGs production rates were also obviously influenced by S. alterniflora invasion, and their values increased with the degree of this exotic plant invasion. The GHGs production rates were characterized by higher values at the surface compared to the subsurface layer and by seasonal changes with higher values in summer than in winter. Temperature, organic matter and microbial gene abundances were found to be the key factors influencing the spatio-temporal variations of GHGs production rates. Overall, our findings showed the importance of S. alterniflora invasion in controlling GHGs production in coastal wetland sediments and provided fundamental data for estimating GHGs emissions and carbon sequestration in the complex tidal wetlands.
Data availability statement
The data presented in the study are deposited in the figshare repository, it can be found online at https://figshare.com/authors/Xianbiao_Lin/18816934.
Author contributions
DS: Conceptualization, Funding acquisition, Investigation, Project administration, Supervision, Writing–review and editing. YJ: Formal analysis, Funding acquisition, Investigation, Writing–original draft, Writing–review and editing. YS: Writing–review and editing. JH: Conceptualization, Formal analysis, Funding acquisition, Methodology, Supervision, Writing–review and editing. YD: Formal analysis, Writing–review and editing. YW: Writing–review and editing. HT: Writing–review and editing. JX: Writing–review and editing. DG: Investigation, Writing–review and editing. XL: Investigation, Writing–review and editing.
Funding
The author(s) declare financial support was received for the research, authorship, and/or publication of the article. This work was supported by the Natural Science Foundation of China (grant number: 42206237, 42301088) and Science and Technology Project of Huadong Engineering (Fujian) Corporation (ZKY2022-FJ-02-02). It was also funded by the Public Welfare Project of Fujian Science and Technology Department (2022R1002007).
Acknowledgments
This work was supported by the Natural Science Foundation of China (grant number: 42206237, 42301088) and Science and Technology Project of Huadong Engineering (Fujian) Corporation (ZKY2022-FJ-02-02). It was also funded by the Public Welfare Project of Fujian Science and Technology Department (2022R1002007). We are grateful to the editor and reviewers for constructive comments on this manuscript.
Conflict of interest
The authors declare that the research was conducted in the absence of any commercial or financial relationships that could be construed as a potential conflict of interest.
The author(s) declared that they were an editorial board member of Frontiers, at the time of submission. This had no impact on the peer review process and the final decision.
Publisher’s note
All claims expressed in this article are solely those of the authors and do not necessarily represent those of their affiliated organizations, or those of the publisher, the editors and the reviewers. Any product that may be evaluated in this article, or claim that may be made by its manufacturer, is not guaranteed or endorsed by the publisher.
References
Baldock, J. A., Wheeler, I., and McKenzie, N. (2012). Soils and climate change: Potential impacts on carbon stocks and greenhouse gas emissions, and future research for Australian agriculture. Crop Pasture Sci. 63, 269–283. doi: 10.1071/CP11170
Bonnett, S. A. F., Blackwell, M. S. A., Leah, R., Cook, V., O’Connor, M., Maltby, E., et al. (2013). Temperature response of denitrification rate and greenhouse gas production in agricultural river marginal wetland soils. Geobiology 11, 252–267. doi: 10.1111/gbi.12032
Borneman, J., and Hartin, R. J. (2000). PCR primers that amplify fungal rRNA genes from environmental samples. Appl. Environ. Microbiol. 66, 4356–4360. doi: 10.1128/AEM.66.10.4356-4360.2000
Bridgham, S. D., Cadillo-Quiroz, H., Keller, J. K., and Zhuang, Q. (2013). Methane emissions from wetlands: Biogeochemical, microbial, and modeling perspectives from local to global scales. Glob. Change Biol. 19, 1325–1346. doi: 10.1111/gcb.12131
Bu, N., Wu, S., and Yang, X. (2019). Spartina alterniflora invasion affects methane emissions in the Yangtze River estuary. J. Soils Sediments 19, 579–587. doi: 10.1007/s11368-018-2073-5
Cagle, G., Lin, Q., Graham, S. A., Mendelssohn, I., Fleeger, J. W., Deis, D., et al. (2020). Planting Spartina alterniflora in a salt marsh denuded of vegetation by an oil spill induces a rapid response in the soil microbial community. Ecol. Eng. 151:105815. doi: 10.1016/j.ecoleng.2020.105815
Chen, G. C., Tam, N. F. Y., and Ye, Y. (2010). Summer fluxes of atmospheric greenhouse gases N2O, CH4 and CO2 from mangrove soil in South China. Sci. Total Environ. 408, 2761–2767. doi: 10.1016/j.scitotenv.2010.03.007
Chen, Z., Zhang, J., Xiong, Z., Pan, G., and Müller, C. (2016). Enhanced gross nitrogen transformation rates and nitrogen supply in paddy field under elevated atmospheric carbon dioxide and temperature. Soil Biol. Biochem. 94, 80–87. doi: 10.1016/j.soilbio.2015.11.025
Cheng, L., Li, X., Lin, X., Hou, L., Liu, M., Li, Y., et al. (2016). Dissimilatory nitrate reduction processes in sediments of urban river networks: Spatio-temporal variations and environmental implications. Environ. Pollut. 219, 545–554. doi: 10.1016/j.envpol.2016.05.093
Cheng, X., Luo, Y., Xu, Q., Lin, G., Zhang, Q., Chen, J., et al. (2010). Seasonal variation in CH4 emission and its 13C-isotopic signature from Spartina alterniflora and Scirpus mariqueter soils in an estuarine wetland. Plant Soil 327, 85–94. doi: 10.1007/s11104-009-0033-y
Davidson, E. A., and Janssens, I. A. (2006). Temperature sensitivity of soil carbon decomposition and feedbacks to climate change. Nature 440, 165–173. doi: 10.1038/nature04514
Devol, A. H., and Ahmed, S. I. (1981). Are high rates of sulphate reduction associated with anaerobic oxidation of methane? Nature 291, 407–408. doi: 10.1038/291407a0
Emery, H. E., and Fulweiler, R. W. (2014). Spartina alterniflora and invasive Phragmites australis stands have similar greenhouse gas emissions in a New England marsh. Aquat. Bot. 116, 83–92. doi: 10.1016/j.aquabot.2014.01.010
Feng, J., Zhou, J., Wang, L., Cui, X., Ning, C., Wu, H., et al. (2017). Effects of short-term invasion of Spartina alterniflora and the subsequent restoration of native mangroves on the soil organic carbon, nitrogen and phosphorus stock. Chemosphere 184, 774–783. doi: 10.1016/j.chemosphere.2017.06.060
Gao, D., Li, X., Lin, X., Wu, D., Jin, B., Huang, Y., et al. (2017). Soil dissimilatory nitrate reduction processes in the Spartina alterniflora invasion chronosequences of a coastal wetland of southeastern China: Dynamics and environmental implications. Plant Soil 421, 383–399. doi: 10.1007/s11104-017-3464-x
Gao, G. F., Li, P. F., Shen, Z. J., Qin, Y. Y., Zhang, X. M., Ghoto, K., et al. (2018). Exotic Spartina alterniflora invasion increases CH4 while reduces CO2 emissions from mangrove wetland soils in southeastern China. Sci. Rep. 8:9243.
Gao, G. F., Li, P. F., Zhong, J. X., Shen, Z. J., Chen, J., Li, Y. T., et al. (2019). Spartina alterniflora invasion alters soil bacterial communities and enhances soil N2O emissions by stimulating soil denitrification in mangrove wetland. Sci. Total Environ. 653, 231–240. doi: 10.1016/j.scitotenv.2018.10.277
He, C., Wang, X., and Wang, D. (2021). Impact of Spartina alterniflora invasion on soil bacterial community and associated greenhouse gas emission in the Jiuduansha wetland of China. Appl. Soil Ecol. 168:104168. doi: 10.1016/j.apsoil.2021.104168
He, Y., Zhou, X., Cheng, W., Zhou, L., Zhang, G., Zhou, G., et al. (2019). Linking improvement of soil structure to soil carbon storage following invasion by a C4 plant Spartina alterniflora. Ecosystems 22, 859–872. doi: 10.1007/s10021-018-0308-3
Huang, F., Lin, X., Hu, W., Zeng, F., He, L., and Yin, K. (2021). Nitrogen cycling processes in sediments of the pearl river estuary: Spatial variations, controlling factors, and environmental implications. Catena 206:105545. doi: 10.1016/j.catena.2021.105545
Inglett, K. S., Inglett, P. W., Reddy, K. R., and Osborne, T. Z. (2012). Temperature sensitivity of greenhouse gas production in wetland soils of different vegetation. Biogeochemistry 108, 77–90. doi: 10.1007/s10533-011-9573-3
Inubushi, K., Furukawa, Y., Hadi, A., Purnomo, E., and Tsuruta, H. (2003). Seasonal changes of CO2, CH4 and N2O fluxes in relation to land-use change in tropical peatlands located in coastal area of South Kalimantan. Chemosphere 52, 603–608. doi: 10.1016/S0045-6535(03)00242-X
IPCC (2014). “Climate change 2014: Synthesis report,” in Contribution of working groups I, II and III to the 5th assessment report of the intergovernmental panel on climate change, (Geneva: IPCC), 151.
IPCC (2021). “Global carbon and other biogeochemical cycles and feedbacks,” in Climate change 2021: The physical science basis. Contribution of working group I to the 6th assessment report of the intergovernmental panel on climate change, eds J. G. Canadell, P. M. S. Monteiro, M. H. Costa, L. Cotrim da, P. M. Cunha, A. V. Eliseev, et al. (Cambridge: Cambridge University Press), 673–816. doi: 10.1017/9781009157896.007
Iversen, N., and Jørgensen, B. B. (1985). Anaerobic methane oxidation rates at the sulfate-methane transition in marine sediments from Kattegat and Skagerrak (Denmark) 1. Limnol. Oceanogr. 30, 944–955. doi: 10.4319/lo.1985.30.5.0944
Jin, B., Lai, D. Y. F., Gao, D., Tong, C., and Zeng, C. (2017). Changes in soil organic carbon dynamics in a native C4 plant-dominated tidal marsh following Spartina alterniflora invasion. Pedosphere 27, 856–867. doi: 10.1016/S1002-0160(17)60396-5
Lang, M., Cai, Z., and Chang, S. X. (2011). Effects of land use type and incubation temperature on greenhouse gas emissions from Chinese and Canadian soils. J. Soils Sediments 11, 15–24. doi: 10.1007/s11368-010-0260-0
Li, B. O., Liao, C., Zhang, X., Chen, H., Wang, Q., Chen, Z., et al. (2009). Spartina alterniflora invasions in the Yangtze River estuary, China: An overview of current status and ecosystem effects. Ecol. Eng. 35, 511–520. doi: 10.1016/j.ecoleng.2008.05.013
Li, L., Zheng, Z., Wang, W., Biederman, J. A., Xu, X., Ran, Q., et al. (2020). Terrestrial N2O emissions and related functional genes under climate change: A global meta-analysis. Glob. Change Biol. 26, 931–943. doi: 10.1111/gcb.14847
Liao, C., Peng, R., Luo, Y., Zhou, X., Wu, X., Fang, C., et al. (2008). Altered ecosystem carbon and nitrogen cycles by plant invasion: A meta-analysis. New Phytol. 177, 706–714. doi: 10.1111/j.1469-8137.2007.02290.x
Lin, G., and Lin, X. (2022). Bait input altered microbial community structure and increased greenhouse gases production in coastal wetland sediment. Water Res. 218:118520. doi: 10.1016/j.watres.2022.118520
Lin, X., Liu, M., and Hou, L. (2017). Nitrogen losses in sediments of the East China Sea: Spatio-temporal variations, controlling factors, and environmental implications. J. Geophys. Res. Biogeosci. 122, 2699–2715. doi: 10.1002/2017JG004036
Lin, Y., Hu, H. W., Yang, P., and Ye, G. (2022). Spartina alterniflora invasion has a greater impact than non-native species, Phragmites australis and Kandelia obovata, on the bacterial community assemblages in an estuarine wetland. Sci. Total Environ. 822:153517. doi: 10.1016/j.scitotenv.2022.153517
Lu, J., and Zhang, Y. (2013). Spatial distribution of an invasive plant Spartina alterniflora and its potential as biofuels in China. Ecol. Eng. 52, 175–181. doi: 10.1016/j.ecoleng.2012.12.107
Marton, J. M., Herbert, E. R., and Craft, C. B. (2012). Effects of salinity on denitrification and greenhouse gas production from laboratory-incubated tidal forest soils. Wetlands 32, 347–357. doi: 10.1007/s13157-012-0270-3
Morrissey, E. M., and Franklin, R. B. (2015). Evolutionary history influences the salinity preference of bacterial taxa in wetland soils. Front. Microbiol. 6:1013. doi: 10.3389/fmicb.2015.01013
Morse, J. L., and Bernhardt, E. S. (2013). Using 15N tracers to estimate N2O and N2 emissions from nitrification and denitrification in coastal plain wetlands under contrasting land-uses. Soil Biol. Biochem. 57, 635–643. doi: 10.1016/j.soilbio.2012.07.025
Mou, X. J., Liu, X. T., Sun, Z. G., Tong, C., Huang, J. F., Wan, S., et al. (2018). Effects of anthropogenic disturbance on sediment organic carbon mineralization under different water conditions in coastal wetland of a subtropical estuary. Chin. Geogr. Sci. 28, 400–410. doi: 10.1007/s11769-018-0956-4
Mou, X., Liu, X. T., Tong, C., and Sun, Z. G. (2014). Responses of CH4 emissions to nitrogen addition and Spartina alterniflora invasion in Minjiang River estuary, southeast of China. Chin. Geogr. Sci. 24, 562–574. doi: 10.1007/s11769-014-0692-3
Muyzer, G., De Waal, E. C., and Uitterlinden, A. G. (1993). Profiling of complex microbial populations by denaturing gradient gel electrophoresis analysis of polymerase chain reaction-amplified genes coding for 16S rRNA. Appl. Environ. Microbiol. 59, 695–700. doi: 10.1128/aem.59.3.695-700.1993
Neubauer, S. C. (2013). Ecosystem responses of a tidal freshwater marsh experiencing saltwater intrusion and altered hydrology. Estuaries Coasts 36, 491–507. doi: 10.1007/s12237-011-9455-x
Nyman, J. A., and DeLaune, R. D. (1991). CO2 emission and soil Eh responses to different hydrological conditions in fresh, brackish, and saline marsh soils. Limnol. Oceanogr. 36, 1406–1414. doi: 10.4319/lo.1991.36.7.1406
Shan, J., Zhao, X., Sheng, R., Xia, Y., Ti, C., Quan, X., et al. (2016). Dissimilatory nitrate reduction processes in typical Chinese paddy soils: Rates, relative contributions, and influencing factors. Environ. Sci. Technol. 50, 9972–9980. doi: 10.1021/acs.est.6b01765
Sotomayor, D., Corredor, J. E., and Morell, J. M. (1994). Methane flux from mangrove sediments along the southwestern coast of Puerto Rico. Estuaries 17, 140–147. doi: 10.2307/1352563
Tan, L., Ge, Z., and Zhou, X. (2020). Conversion of coastal wetlands, riparian wetlands, and peatlands increases greenhouse gas emissions: A global meta-analysis. Glob. Change Biol. 26, 1638–1653. doi: 10.1111/gcb.14933
Teng, Z., and Lin, X. (2024). Sediment nitrates reduction processes affected by non-native Sonneratia apetala plantation in South China. Sci. Total Environ. 906:167523. doi: 10.1016/j.scitotenv.2023.167523
Tong, C., Wang, W. Q., Huang, J. F., Gauci, V., Zhang, L., and Zeng, C. (2012). Invasive alien plants increase CH4 emissions from a subtropical tidal estuarine wetland. Biogeochemistry 111, 677–693. doi: 10.1007/s10533-012-9712-5
Tong, C., Zhang, L., Wang, W., Gauci, V., Marrs, R., Liu, B., et al. (2011). Contrasting nutrient stocks and litter decomposition in stands of native and invasive species in a sub-tropical estuarine marsh. Environ. Res. 111, 909–916. doi: 10.1016/j.envres.2011.05.023
Wang, B., and Lin, X. (2023). Exotic Spartina alterniflora invasion enhances sediment N-loss while reducing N retention in mangrove wetland. Geoderma 431:116362. doi: 10.1016/j.geoderma.2023.116362
Wang, D., Chen, Z., Wang, J., Xu, C., Yang, H., Chen, H., et al. (2007). Summer-time denitrification and nitrous oxide exchange in the intertidal zone of the Yangtze Estuary. Estuarine Coast. Shelf Sci. 73, 43–53. doi: 10.1016/j.ecss.2006.11.002
Wang, D., Huang, W., Liang, R., and Li, F. (2016). Effects of Spartina alterniflora invasion on soil quality in coastal wetland of Beibu Gulf of South China. PLoS One 11:e0168951. doi: 10.1371/journal.pone.0168951
Wang, Y., Wang, Z., and Zheng, X. (2022). Influence of Spartina alterniflora invasion on mercury storage and methylation in the sediments of Yangtze River estuarine wetlands. Estuarine Coast. Shelf Sci. 265:107717. doi: 10.1016/j.ecss.2021.107717
Weston, N. B., Dixon, R. E., and Joye, S. B. (2006). Ramifications of increased salinity in tidal freshwater sediments: Geochemistry and microbial pathways of organic matter mineralization. J. Geophys. Res. Biogeosci. 111:71. doi: 10.1029/2005JG000071
Wu, Z., Wang, X., Chen, M., Lai, Y., and Lin, X. (2024). Changes in sediment N mineralization and immobilization in association with Spartina alterniflora invasion in mangrove wetland. Plant Soil 52, 1–20. doi: 10.1007/s11104-024-06532-x
Xia, S., Wang, W., Song, Z., Kuzyakov, Y., Guo, L., Van Zwieten, L., et al. (2021). Spartina alterniflora invasion controls organic carbon stocks in coastal marsh and mangrove soils across tropics and subtropics. Glob. Change Biol. 27, 1627–1644. doi: 10.1111/gcb.15516
Xiang, J., Liu, D., Ding, W., Yuan, J., and Lin, Y. (2015). Invasion chronosequence of Spartina alterniflora on methane emission and organic carbon sequestration in a coastal salt marsh. Atmosph. Environ. 112, 72–80. doi: 10.1016/j.atmosenv.2015.04.035
Xu, X., Zou, X., Cao, L., and Zhamangulova, N. (2014). Seasonal and spatial dynamics of greenhouse gas emissions under various vegetation covers in a coastal saline wetland in southeast China. Ecol. Eng. 73, 469–477. doi: 10.1016/j.ecoleng.2014.09.087
Yang, B., Li, X., Lin, S., Jiang, C., Xue, L., Wang, J., et al. (2021). Invasive Spartina alterniflora changes the Yangtze Estuary salt marsh from CH4 sink to source. Estuarine Coast. Shelf Sci. 252:107258. doi: 10.1016/j.ecss.2021.107258
Yin, S., An, S., Deng, Q., Zhang, J., and Ji, H. (2015). Spartina alterniflora invasions impact CH4 and N2O fluxes from a salt marsh in eastern China. Ecol. Eng. 81, 192–199. doi: 10.1016/j.ecoleng.2015.04.044
Yu, D., Han, G., Wang, X., Han, Y., and Zhang, M. (2022). Effects of Spartina alterniflora invasion on morphological characteristics of tidal creeks and plant community distribution in the Yellow River Estuary. Chin. J. Ecol. 41:42.
Yuan, J., Ding, W., Liu, D., Kang, H., Freeman, C., Xiang, J., et al. (2015). Exotic Spartina alterniflora invasion alters ecosystem–atmosphere exchange of CH4 and N2O and carbon sequestration in a coastal salt marsh in China. Glob. Change Biol. 21, 1567–1580. doi: 10.1111/gcb.12797
Yuan, J., Ding, W., Liu, D., Xiang, J., and Lin, Y. (2014). Methane production potential and methanogenic archaea community dynamics along the Spartina alterniflora invasion chronosequence in a coastal salt marsh. Appl. Microbiol. Biotechnol. 98, 1817–1829. doi: 10.1007/s00253-013-5104-6
Zhang, H., Yao, X., Zeng, W., and Fang, Y. (2020). Depth dependence of temperature sensitivity of soil carbon dioxide, nitrous oxide and methane emissions. Soil Biol. Biochem. 149:107956. doi: 10.1016/j.soilbio.2020.107956
Zhang, X., Yao, C., Zhang, B., Tan, W., Gong, J., Wang, G. Y., et al. (2023). Dynamics of benthic nitrate reduction pathways and associated microbial communities responding to the development of seasonal deoxygenation in a coastal mariculture zone. Environ. Sci. Technol. 57, 15014–15025. doi: 10.1021/acs.est.3c03994
Zhang, Y., Ding, W., Luo, J., and Donnison, A. (2010a). Changes in soil organic carbon dynamics in an Eastern Chinese coastal wetland following invasion by a C4 plant Spartina alterniflora. Soil Biol. Biochem. 42, 1712–1720. doi: 10.1016/j.soilbio.2010.06.006
Keywords: greenhouse gases, Spartina alterniflora invasion, estuarine and coastal wetland, sediment, CH4, CO2, N2O
Citation: Jiang Y, Shao Y, Huang J, Du Y, Wen Y, Tang H, Xu J, Gao D, Lin X and Sun D (2024) Changes in sediment greenhouse gases production dynamics in an estuarine wetland following invasion by Spartina alterniflora. Front. Microbiol. 15:1420924. doi: 10.3389/fmicb.2024.1420924
Received: 21 April 2024; Accepted: 03 June 2024;
Published: 12 July 2024.
Edited by:
Min Luo, Fuzhou University, ChinaReviewed by:
Jiapeng Wu, Guangzhou University, ChinaYinghui Jiang, Jiangxi Normal University, China
Copyright © 2024 Jiang, Shao, Huang, Du, Wen, Tang, Xu, Gao, Lin and Sun. This is an open-access article distributed under the terms of the Creative Commons Attribution License (CC BY). The use, distribution or reproduction in other forums is permitted, provided the original author(s) and the copyright owner(s) are credited and that the original publication in this journal is cited, in accordance with accepted academic practice. No use, distribution or reproduction is permitted which does not comply with these terms.
*Correspondence: Dongyao Sun, ZG9uZ3lhb3NAMTI2LmNvbQ==; Jiafang Huang, d2FodWdlb0Bmam51LmVkdS5jbg==