 Veronica Martinez-Rios
 Resadije Idrizi
 Paw Dalgaard
 Lisbeth Truelstrup Hansen
 Tina Beck Hansen
- The National Food Institute (DTU Food), Technical University of Denmark, Kongens Lyngby, Denmark
Pathogenic Bacillus cereus s.l. can survive cooking of starchy foods and grow at chilled storage temperatures, highlighting foods with extended chilled shelf life as a risk factor. Some food administrations encourage use of predictive microbiology to support decisions of safe shelf lives. Therefore, the present study embarked on identifying a model from literature and/or expanding an existing model to enable accurate predictions of growth and no-growth responses of relevant B. cereus s.l. in starchy ready-to-eat and ready-to-cook foods when stored at temperatures at or below 12°C. The study focused on isolates belonging to psychrotolerant or mesophilic-psychrotolerant intermediary thermotypes in panC-groups II, IV, V, or VI and generated data for growth kinetics for various pH (4.8–7.8), aw (0.935–0.999) and storage temperatures (6.0–11.7°C) in 42 starchy foods (bulgur, couscous, pasta, potatoes, rice) and eight composite foods containing at least one starchy ingredient. Using 21 of the growth kinetics obtained for starchy foods, the five best performing of 10 available growth models were selected for improvement by product calibration and/or expansion with terms to consider the effect of interactions between temperature, pH and aw. Of 410 updated models, nine showed promising performance and were evaluated using the remaining 21 growth kinetics obtained in starchy foods. Two models could be considered validated for these products with Bf/Af –values of 0.87/1.21 and 1.01/1.32, respectively. Both models provided ≥75% correct predictions of the growth/no-growth responses and did not provide any fail-dangerous predictions. Further evaluation of these models for predictions of maximum specific growth rates (μmax, h−1) and growth/no-growth responses for a broader range of starchy foods used 33 challenge tests from the scientific literature and eight challenge tests from the present study, and remarkably showed that the performance of both models was poor for composite protein-rich starchy foods with Bf –values ≤0.64 and Af –values ≥1.96, meaning these models should not be used for such products as μmax might be under-predicted creating unsafe situations. However, for other starchy foods, one of the validated models was found to be acceptable on the safe side with Bf – and Af –values of 1.34 and 1.57, respectively.
1 Introduction
Several species from the Bacillus cereus group, also known as Bacillus cereus sensu lato, are known as significant foodborne hazards warranting food safety management in processed ready-to-eat and ready-to-cook foods (Daelman et al., 2013a,b,c; Webb et al., 2019). B. cereus s.l. are sporeformers and their endospores are widely distributed in the environment from where they can contaminate many kinds of food raw materials (Vos et al., 2011). Recently, a systematic review pointed to cereals, beans, and vegetables as raw materials with presence of B. cereus s.l. in 37–45% of samples (Rahnama et al., 2022). As the endospores are highly heat-tolerant, they can survive cooking of food (den Besten et al., 2018; Le Marc et al., 2022; Luu-Thi et al., 2014), meaning B. cereus s.l. are also readily detected from heat-treated foods (Rosenquist et al., 2005; Samapundo et al., 2011; Turner et al., 2006).
B. cereus s.l. have been found to cause foodborne outbreaks, with 413 strong-evidence outbreaks reported to EFSA’s Zoonoses database during the eight-year period from 2007 to 2014 (EFSA BIOHAZ Panel, 2016). In 2022 alone, 306 outbreaks caused by B. cereus s.l. were registered in EU, which increased to 474 in 2023 indicating an increasing number of reported outbreaks (EFSA and ECDC, 2023, 2024). Bakery products, cereal products (including rice and seeds), and mixed foods (e.g., paella, risotto and curries) are typical foods associated with outbreaks caused by B. cereus s.l. (EFSA BIOHAZ Panel, 2016). Thus, starchy foods and/or composite foods containing starchy ingredients are significant sources for foodborne outbreaks related to B. cereus s.l. Rice-based products and starchy foods, together with vegetable-based dishes have also been highlighted as important sources of B. cereus s.l. outbreaks in European large scale catering (Osimani et al., 2018). A recent analysis, from the Zhejiang Province in China, found that B. cereus s.l. caused 5.6% of all registered outbreaks from 2010 to 2020 (Chen et al., 2022). Most of the Chinese B. cereus s.l. outbreaks were traced back to cereals or flour products confirming that heat-treated foods containing starch should be considered as particularly important sources of B. cereus s.l., which will require implementation of food safety management for mitigation of the risk.
The risk of outbreaks occurring is mainly associated with growth of B. cereus s.l. in foods where spores have survived the heat-treatment to go on to germinate and grow, e.g., during improper cooling or holding of foods for too long at ambient temperatures (Osimani et al., 2018). Moreover, since some B. cereus s.l. sub-groups grow at chilled temperatures, cooked products with extended chilled shelf life also represent a risk factor (Carlin et al., 2013; Daelman et al., 2013a; Webb et al., 2019). Foods, where product characteristics and storage temperature will allow growth of B. cereus s.l. sub-groups to more than 105 cfu/g before consumption, should be considered hazardous as cells or spores may cause toxico-infection and/or formation of cereulide that can cause intoxication in consumers (EFSA BIOHAZ Panel, 2016; Webb et al., 2019). The ability to grow at chilled storage temperatures is confined to specific B. cereus s.l. sub-groups and partial sequencing of the pantoate beta-alanine ligase (panC) gene has been widely used to divide isolates into phylogenetic sub-groups with different ability to grow at low temperatures (Carroll et al., 2022; Fiedoruk et al., 2017; Guinebretière et al., 2008).
Chilled storage has been specified as the keeping of foods at temperatures of 8°C or below in many European countries. However, European Food authorities, including the Danish Veterinary and Food Administration, are considering allowing producers of food more flexibility in the setting of storage temperatures and encourage their use of predictive food microbiology to establish safe shelf lives that correspond to the new storage temperature (EFSA, 2015; Ministeriet for Fødevarer, Landbrug og Fiskeri, 2013). Some mathematical models are available to predict growth of B. cereus depending on product storage temperature, pH and salt or water activity (aw) (Carlin et al., 2013; Sutherland et al., 1996; Zwietering et al., 1996). Nevertheless, few validation studies have documented the ability of these models to accurately predict growth of B. cereus s.l. sub-groups in different types of chilled foods. This is important because available growth models were developed using liquid laboratory broth or milk and it is known also for other bacteria that growth rates in liquid substrates may differ from those in food products with similar temperature, pH and aw. Therefore, available B. cereus s.l. growth models may need to be calibrated to provide realistic growth rate predictions for starchy foods (Buss da Silva et al., 2017; Koukou et al., 2021).
The present study focused on B. cereus s.l. isolates able to grow at or below 12°C and belonging to psychrotolerant or mesophilic-psychrotolerant intermediary thermotypes in panC-groups II, IV, V or VI. The objective was to identify a model from the literature and/or expand an existing model so that it can accurately predict growth and no-growth responses of relevant B. cereus s.l. sub-groups in starchy ready-to-eat and ready-to-cook foods when stored at temperatures at or below 12°C. Firstly, data for growth kinetics, product characteristics and storage temperatures were generated in three series of challenge tests. Secondly, a part of these data was used to select the best performing available growth models. Thirdly, selected models were product calibrated and/or expanded with terms to consider the effect of interactions between their factors (temperature, pH and aw). Finally, the performance of the most suitable models was evaluated using a different part of the generated data as well as data from studies available in the scientific literature.
2 Materials and methods
2.1 New growth responses and product characteristics generated from challenge tests
2.1.1 Isolates, sporulation and stock of spores
Ten B. cereus s.l. isolates were selected for new challenge tests performed as part of the present study (Table 1). Isolates included two from diarrheal outbreaks, six from foods, one from environment and the type strain (Table 1). Stock cultures (−80°C) were grown (30°C, 24 h) in Brain Heart Infusion broth (BHI) (CM1135, Oxoid, Basingstoke, UK) to obtain vegetative cells. Spore stocks were then prepared from these using Nutrient Agar (CM0003, Oxoid) supplemented with Manganese sulfate (M2643, Sigma, Darmstadt, Germany) (NAMS agar) (30°C, 3 days) as described by Beuchat et al. (1997). Spores were harvested using a few modifications of the Beuchat et al. (1997) method. Briefly, 5 mL of saline (0.85% NaCl, 1.06404.1000, Supelco, Darmstadt, Germany) was deposited onto the surface of each agar plate which was gently rubbed with a sterile L-shaped drigalski spatula to release the colony material from the agar surface into the saline obtaining a suspension of spores and vegetative cells. The suspension was filtered through sterile glass wool to remove debris originating from the agar surface, centrifuged at 2,600 × g (5°C) for 20 min, and the supernatant discarded. The resulting pellet was suspended in 50 mL of saline and washed twice by centrifugation at 5°C using 6,000 × g for 10 min. The final pellet was suspended in 10 mL saline (spore stock) and stored at 6 ± 0.5°C for use in subsequent challenge tests. The concentration of spores in each spore stock was determined by spread-plating 100 μL of appropriate serial dilutions (in 0.85% NaCl) of heat-treated spore stocks on Tryptone Soya Agar (TSA) (CM131B, Oxoid) (30°C, 24 h). The heat-treatment (5 min, 80°C, Beuchat et al., 1997) was conducted on 1-mL aliquots of 100× diluted spore stocks in a heating block (Eppendorf Thermomixer comfort, Eppendorf Nordic A/S, Hørsholm, Denmark).
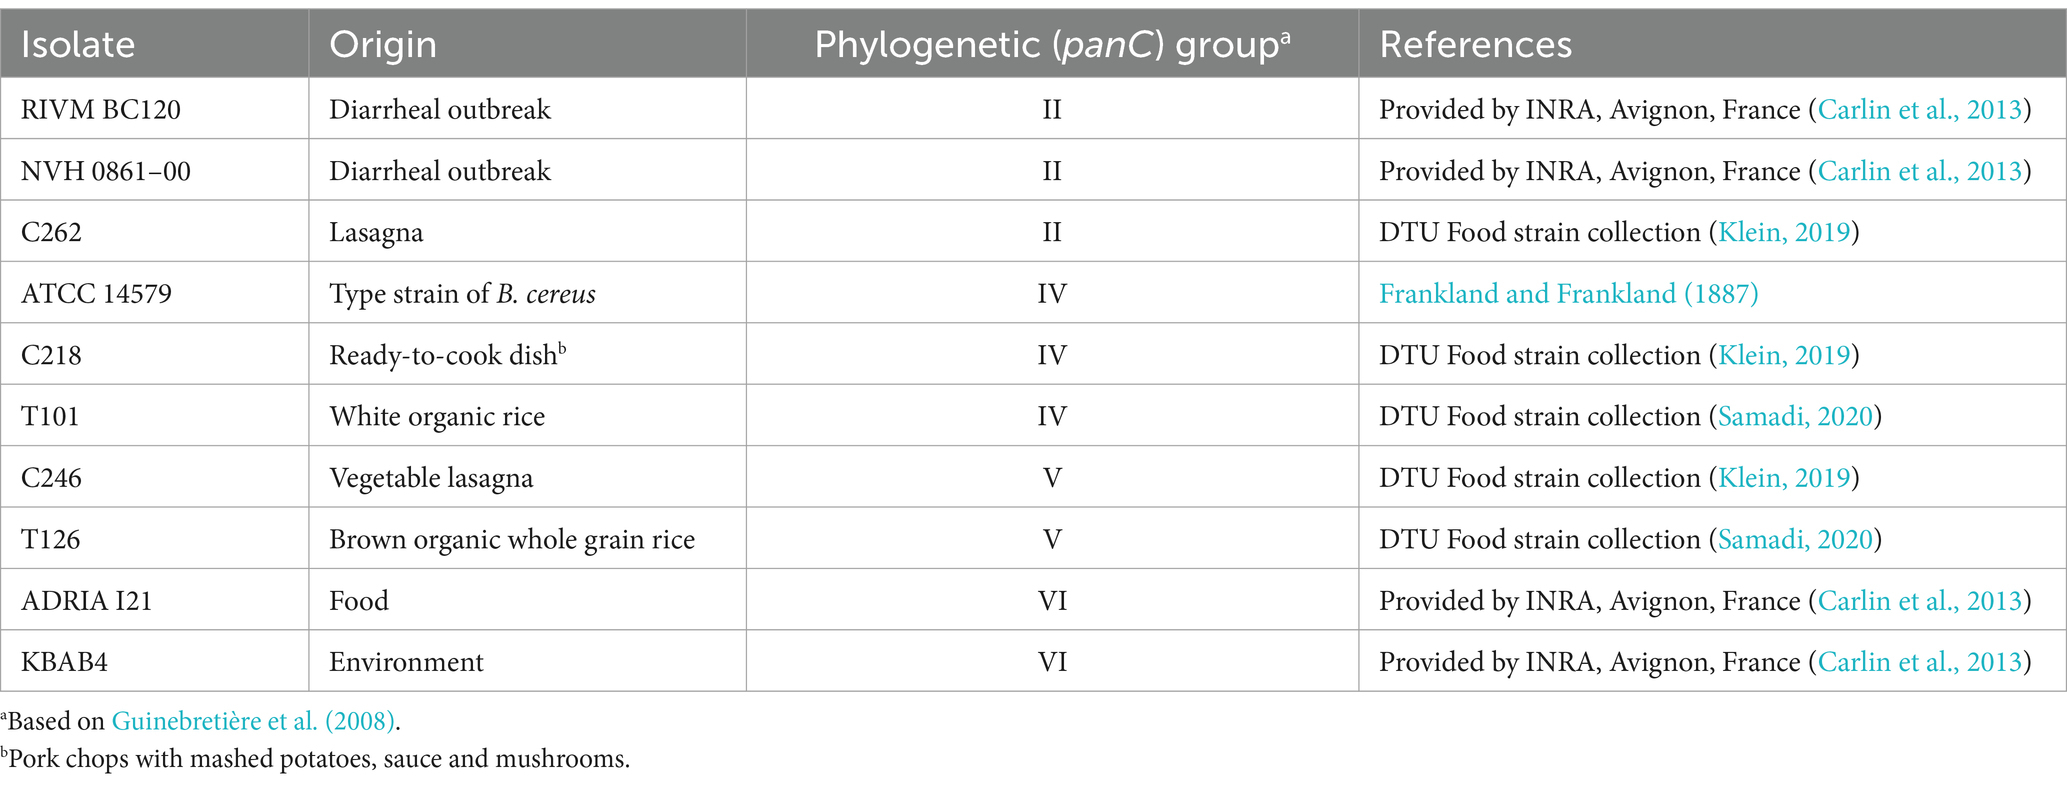
Table 1. Bacillus cereus sensu lato isolates used for challenge testing in the present study.
2.1.2 Experimental design and challenge tests with single component starchy or composite foods to generate growth responses
A compiled dataset including seven preliminary challenge tests and 35 challenge tests (total n = 42), planned by using a statistical design of experiment (DOE), were split into two sets of 21 challenge tests. One set (n = 21, Table 2) was used to evaluate available growth models and then product calibrating these models with or without including a term for the inhibiting effect of interactions between product characteristics (see sections 2.2 and 2.4). The other set (n = 21, Table 3) was then used to select the best performing models (see section 2.5).
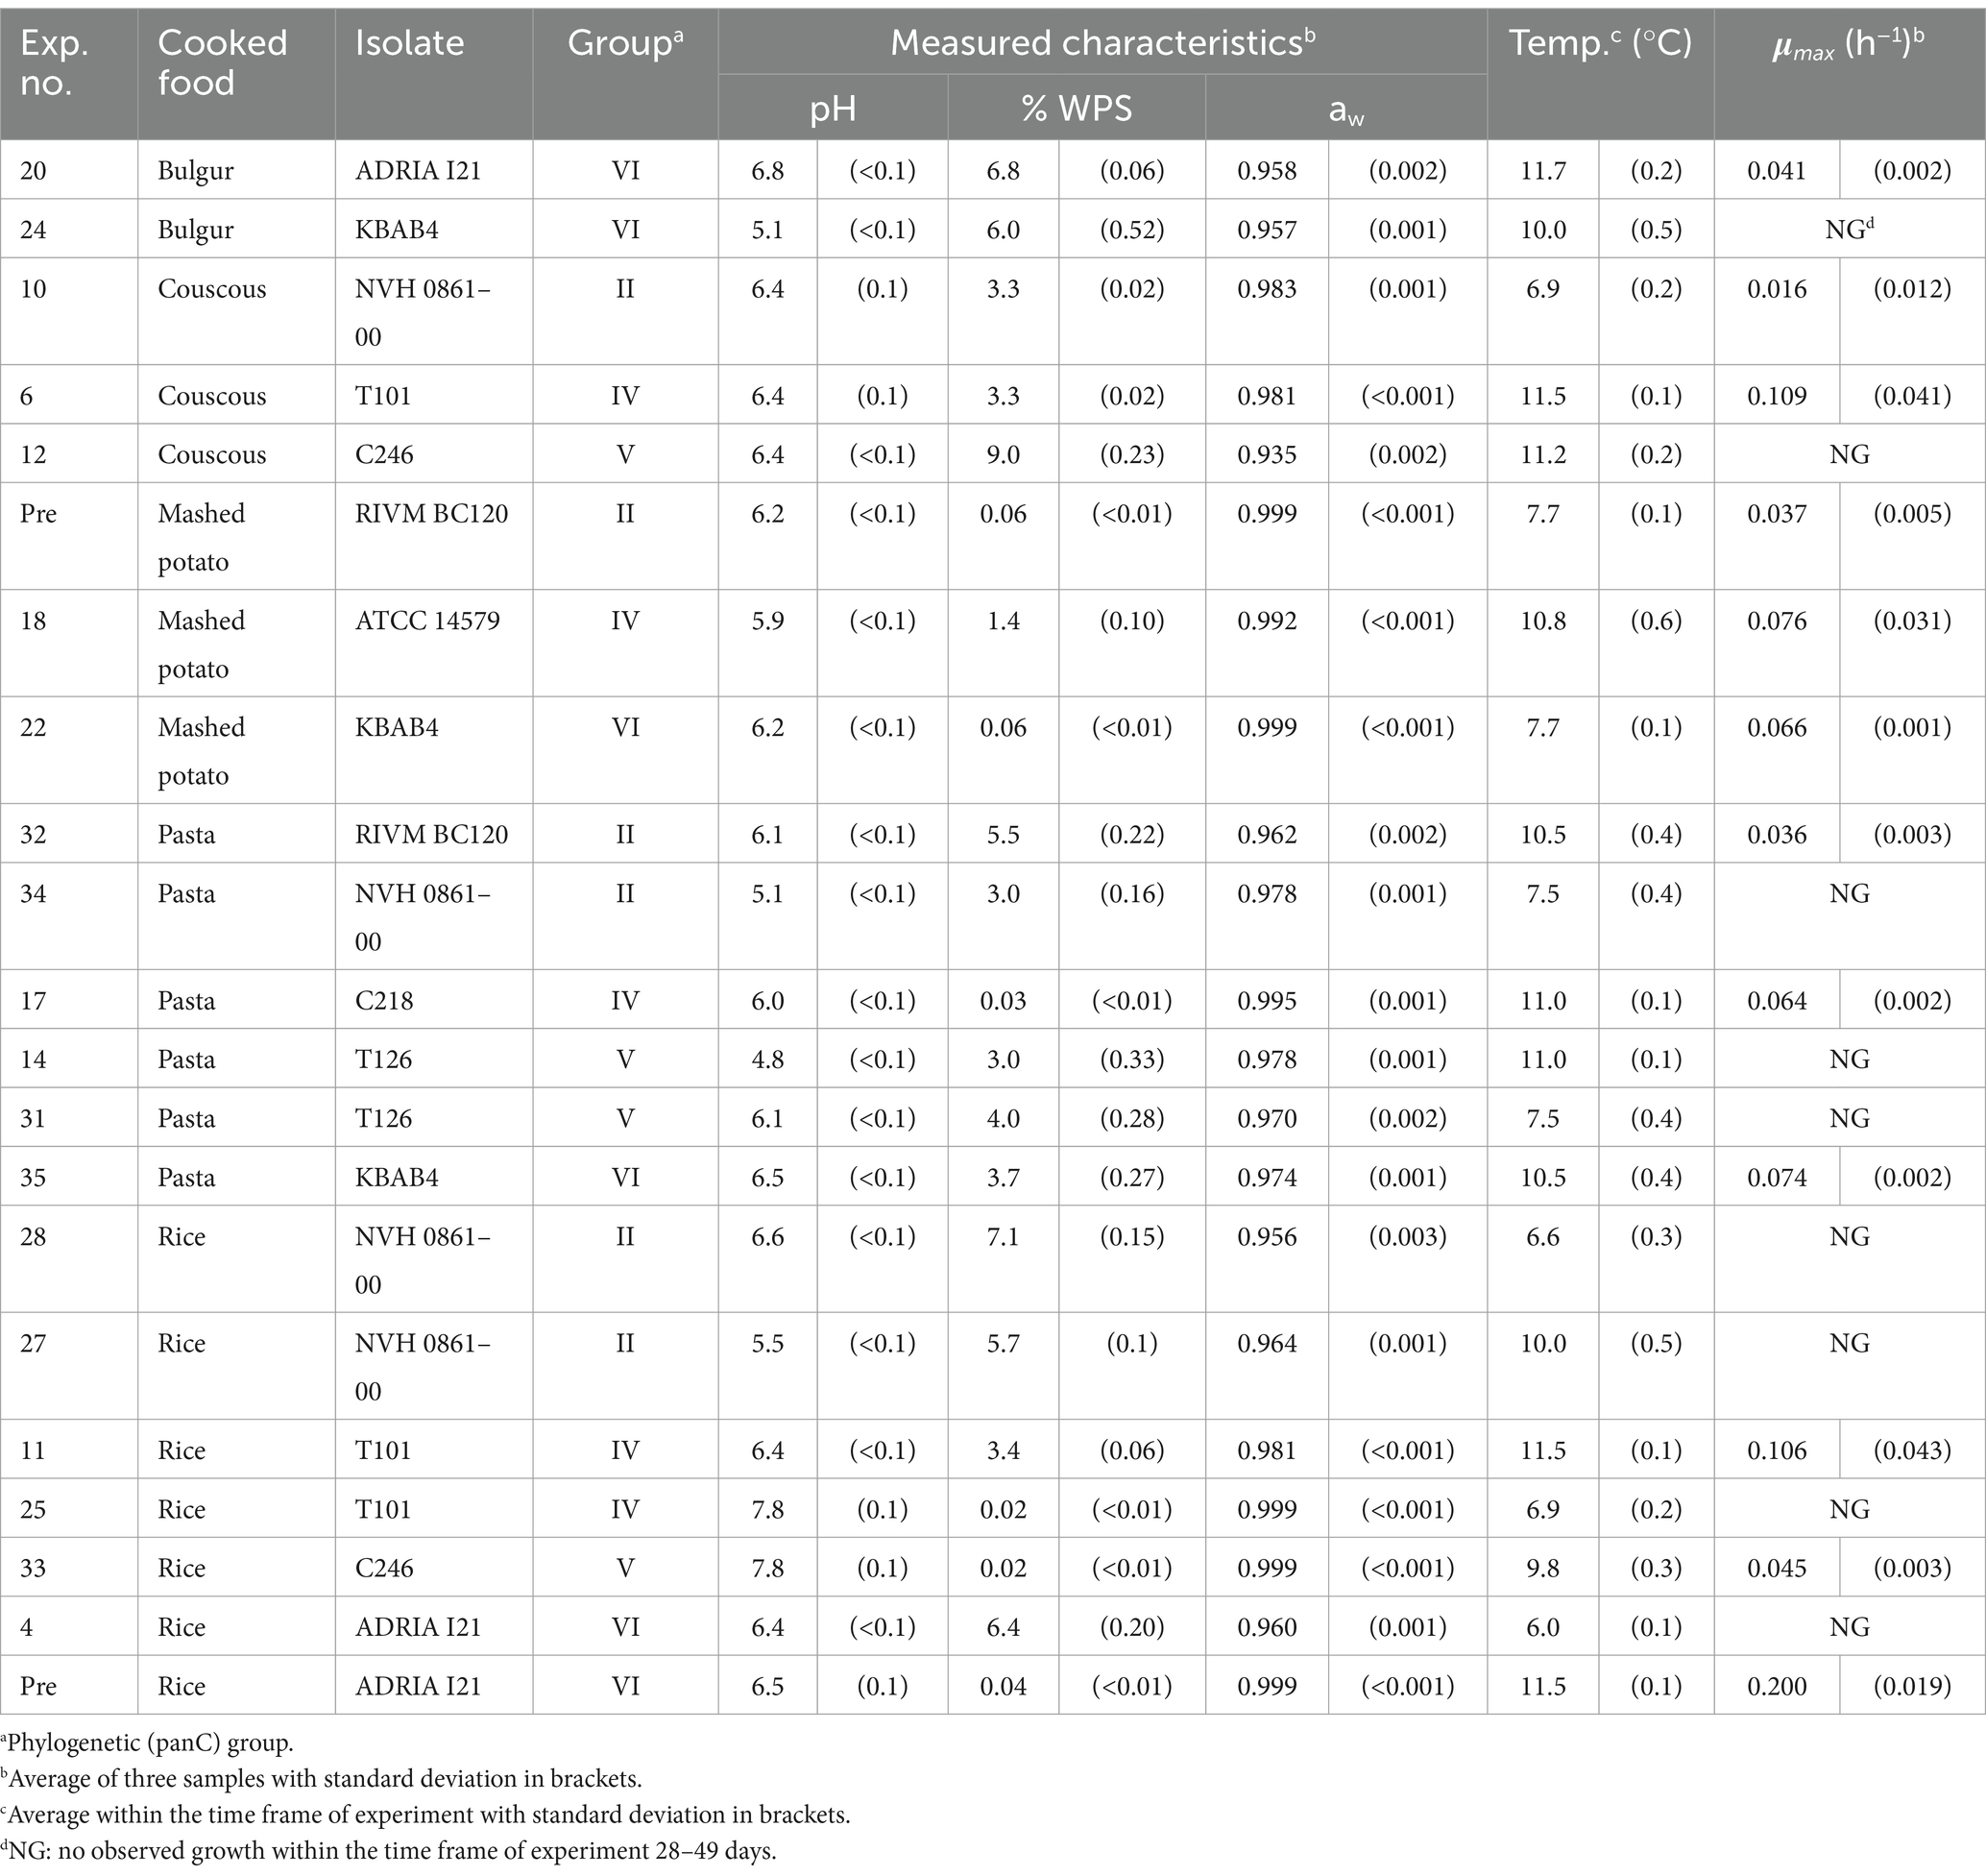
Table 2. Product characteristics, storage conditions and estimates of maximum specific growth rates (μmax) for challenge tests with single starchy foods used for the evaluation and updating of Bacillus cereus sensu lato growth models from literature.
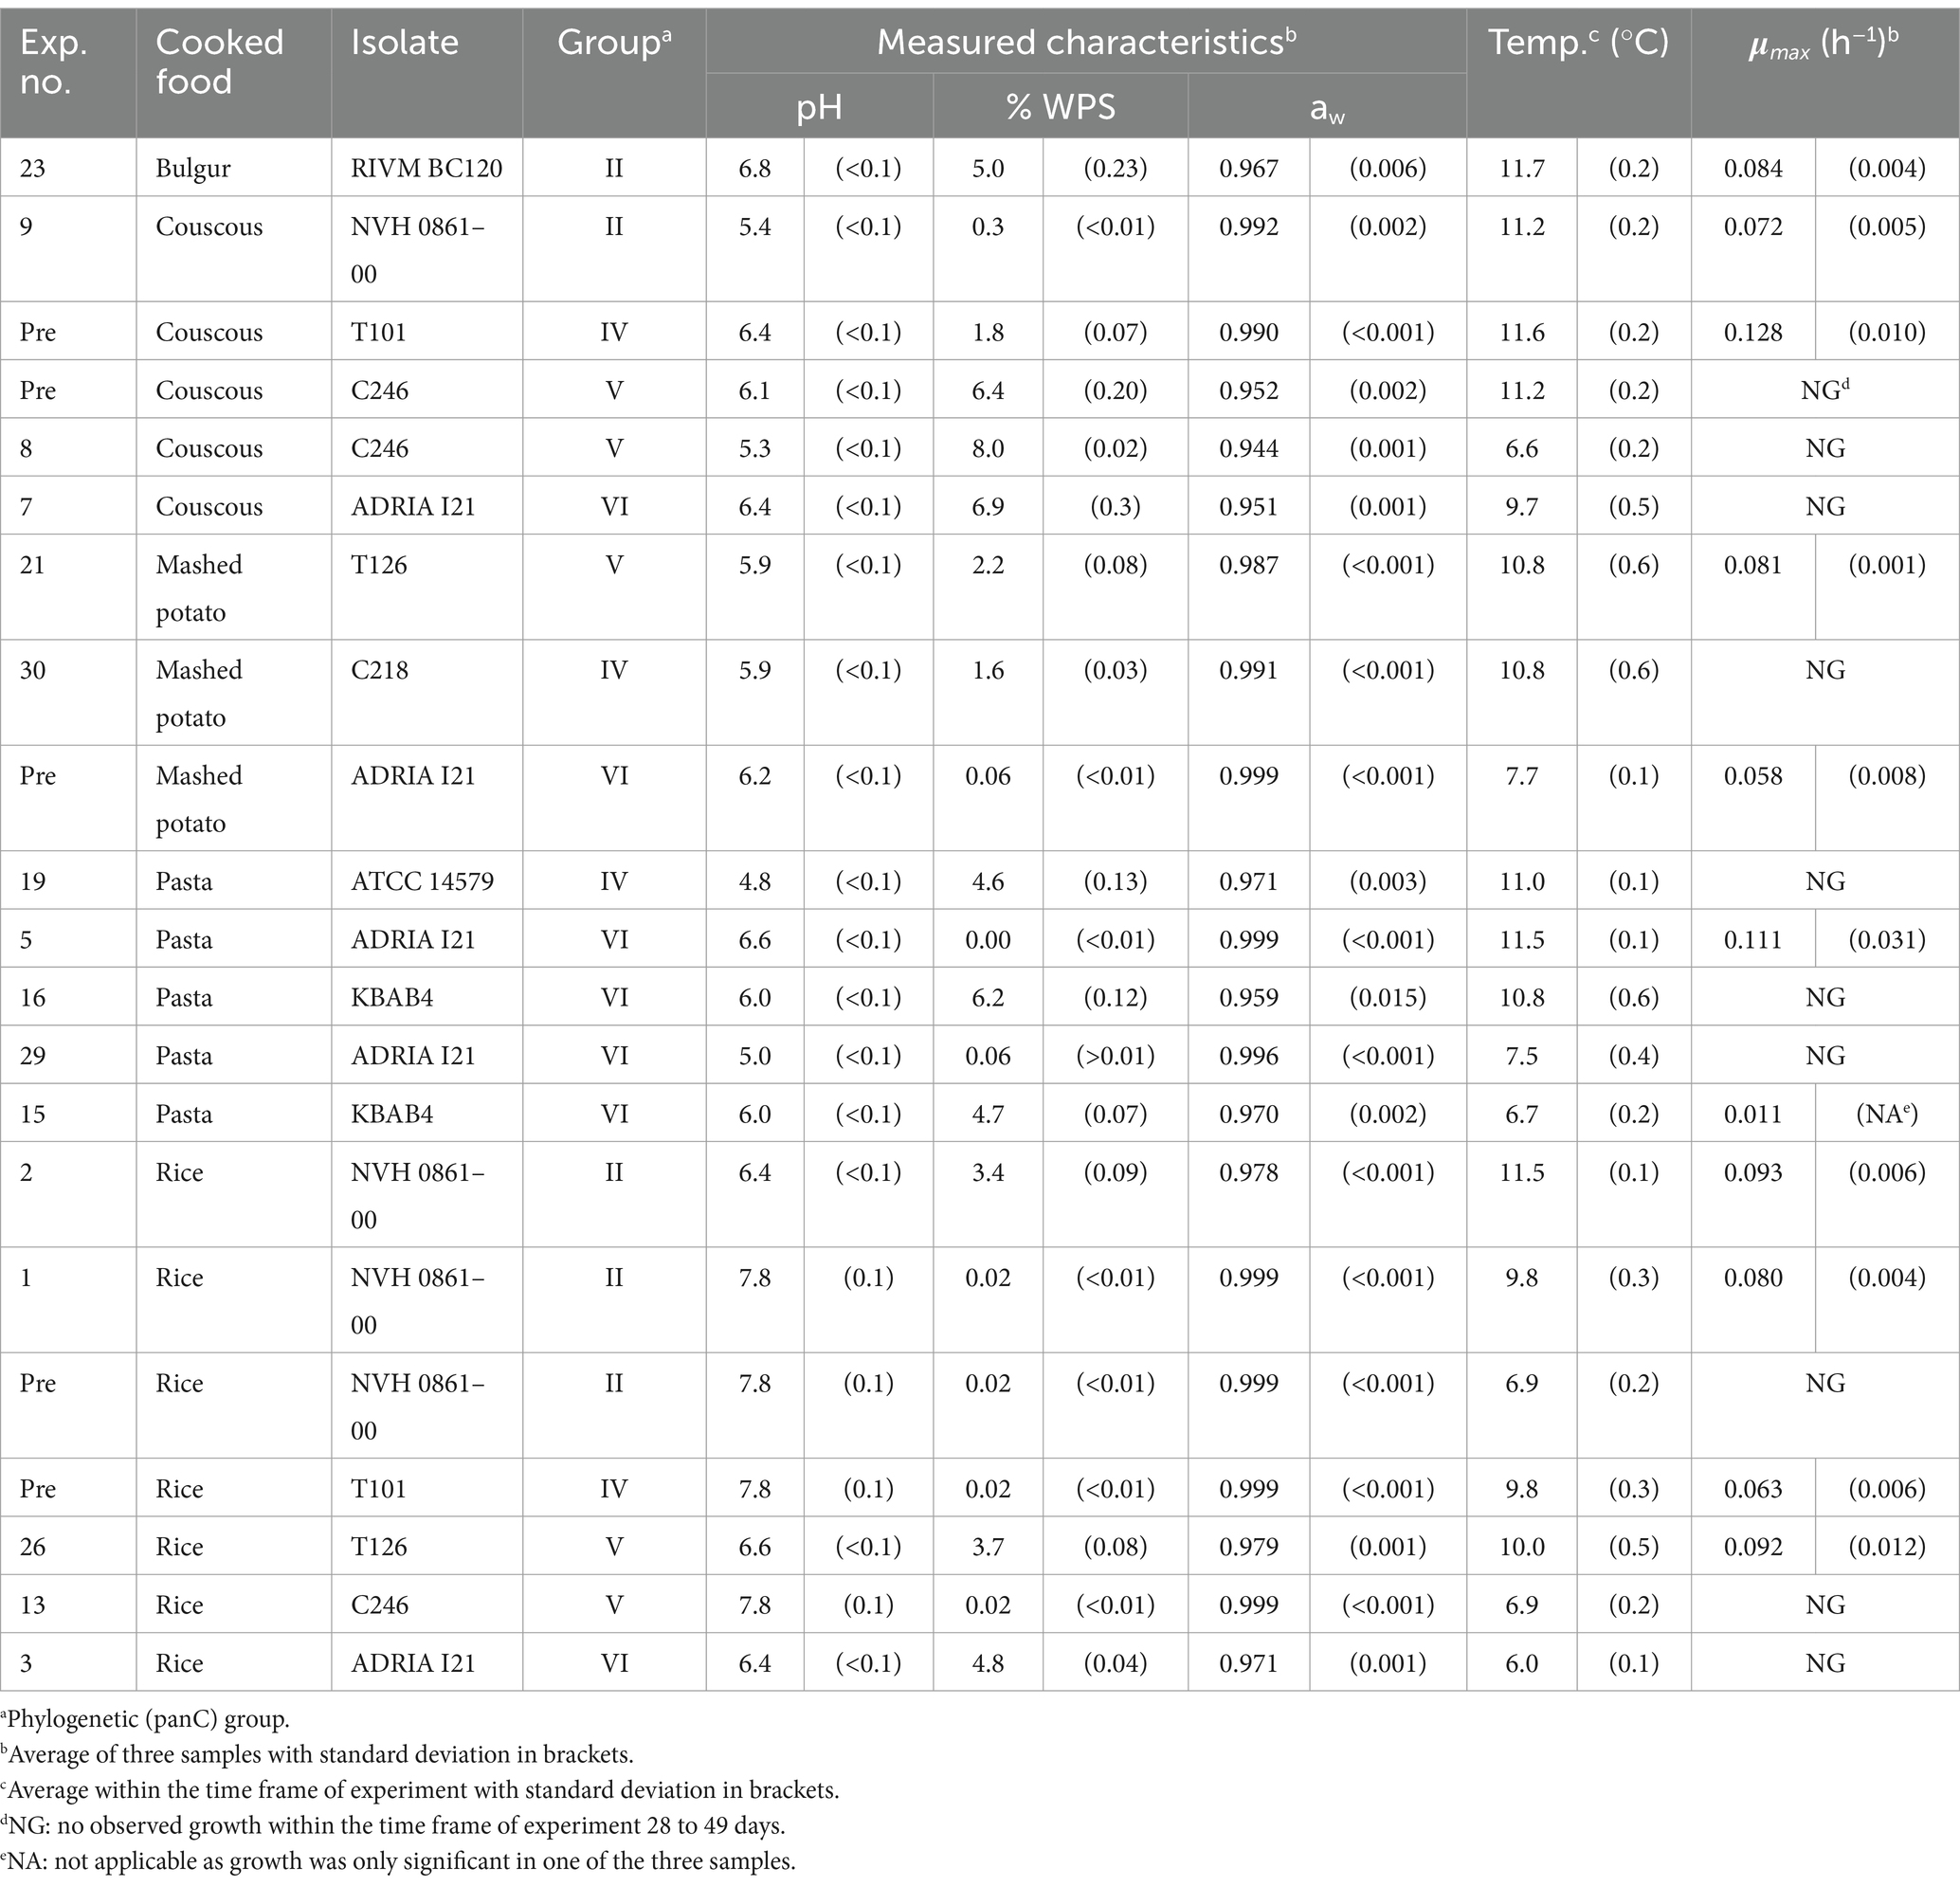
Table 3. Product characteristics, storage conditions and estimates of maximum specific growth rates (μmax) for challenge tests used to evaluate the performance of updated Bacillus cereus sensu lato growth models.
Relevant ranges of temperature, pH and NaCl/aw were determined from the seven preliminary challenge tests conducted with triplicate samples (Supplementary Table S1). Based on growth or no-growth results obtained in these preliminary challenge tests after storage for 2 weeks, three levels of temperature (7, 10, and 12°C) and pH (5, 6, and 7) and four levels of aw (0.96, 0.97, 0.98, and 1.0) and four phylogenetic (panC) groups (II, IV, V, and VI) were selected. A screening design with temperature, pH and aw as discrete numerical factors and phylogenetic (panC) groups as categorical factor was established using the DOE function in SAS JMP Pro (RRID:SCR_022199) (JMP®, Version 15. SAS Institute Inc., Cary, NC, 1989–2023). This constructing of a DOE resulted in 35 combinations (challenge tests) to be studied (Supplementary Table S2). The 35 challenge tests were then carried out using a broad range of cooked single component starchy foods, i.e., bulgur, couscous, mashed potatoes, pasta and rice, as substrate and by adjusting their pH and aw to cover the values selected by the DOE. Bulgur (Polish, Coop, Coop Sweden), couscous (Polish, Coop, Coop Sweden), pasta (Italian soup horn, ØGO, Netto, Denmark) and rice (Basmati, Netto, Denmark) were purchased from local supermarkets and prepared in ion-exchanged water using the cooking instructions on the packages. Mashed potatoes were prepared by cutting peeled potatoes into small cubes and boiling for 20–30 min before mashing. When pH was adjusted, the cooking water was added either 2 M HCl or 2 M NaOH. Appropriate ratios between water and acid or water and base were determined in preliminary experiments for each commodity. When aw was adjusted, NaCl (Supelco) was added to cooked starchy foods followed by thorough stirring. Appropriate NaCl quantities were determined from the expected moisture content of each commodity after cooking and from the desired aw–values. First, % water phase salt (WPS) was determined from the desired aw –value using Equation (1) (Resnik and Chirife, 1988; Ross and Dalgaard, 2004) and then, % NaCl was calculated using Equation 2.
where WPS is water phase salt.
Approximately 900 g of product was prepared for each of the 42 challenge tests. Inoculation was done with individual B. cereus s.l. isolates from Table 1. The inocula were prepared by diluting spore stocks (see section 2.1.1) in saline and then heat-treating the spore suspension for 5 min at 80°C in a water bath primarily to simulate the cooking process used for the preparation of the sampled foods but also to inactivate vegetative cells. Products were added 9 times 1-mL aliquots of appropriately diluted inoculum with thorough mixing after each addition. This resulted in an initial concentration of approximately 102 cfu/g. With this inoculation procedure, it was assumed that measured growth of B. cereus s.l. resulted from the inoculum as their concentration in the studied foods is low (Berthold-Pluta et al., 2019; Rahnama et al., 2022; Yu et al., 2020). This assumption was confirmed by selected uninoculated control samples where below 50 cfu/g of presumptive B. cereus were determined at the final storage time. Samples, each of 30 g, were then placed in sample bags (11,532,783, Fisherbrand, Fisher Scientific, Roskilde, Denmark). Following inoculation and packaging, products were stored aerobically at temperatures below 12°C as indicated in Tables 2, 3.
Applying the same procedure as above, five additional challenge tests were conducted with ready-to-cook foods bought in local supermarkets and consisting of composite foods with at least one starchy ingredient (yellow split pea stew, two potato/leek soups, curry soup, asparagus soup) (Table 4). All soups were stored in 50-mL centrifuge tubes (GR-227270, Greiner Bio-One, Kremsmünster, Austria) during the challenge test.
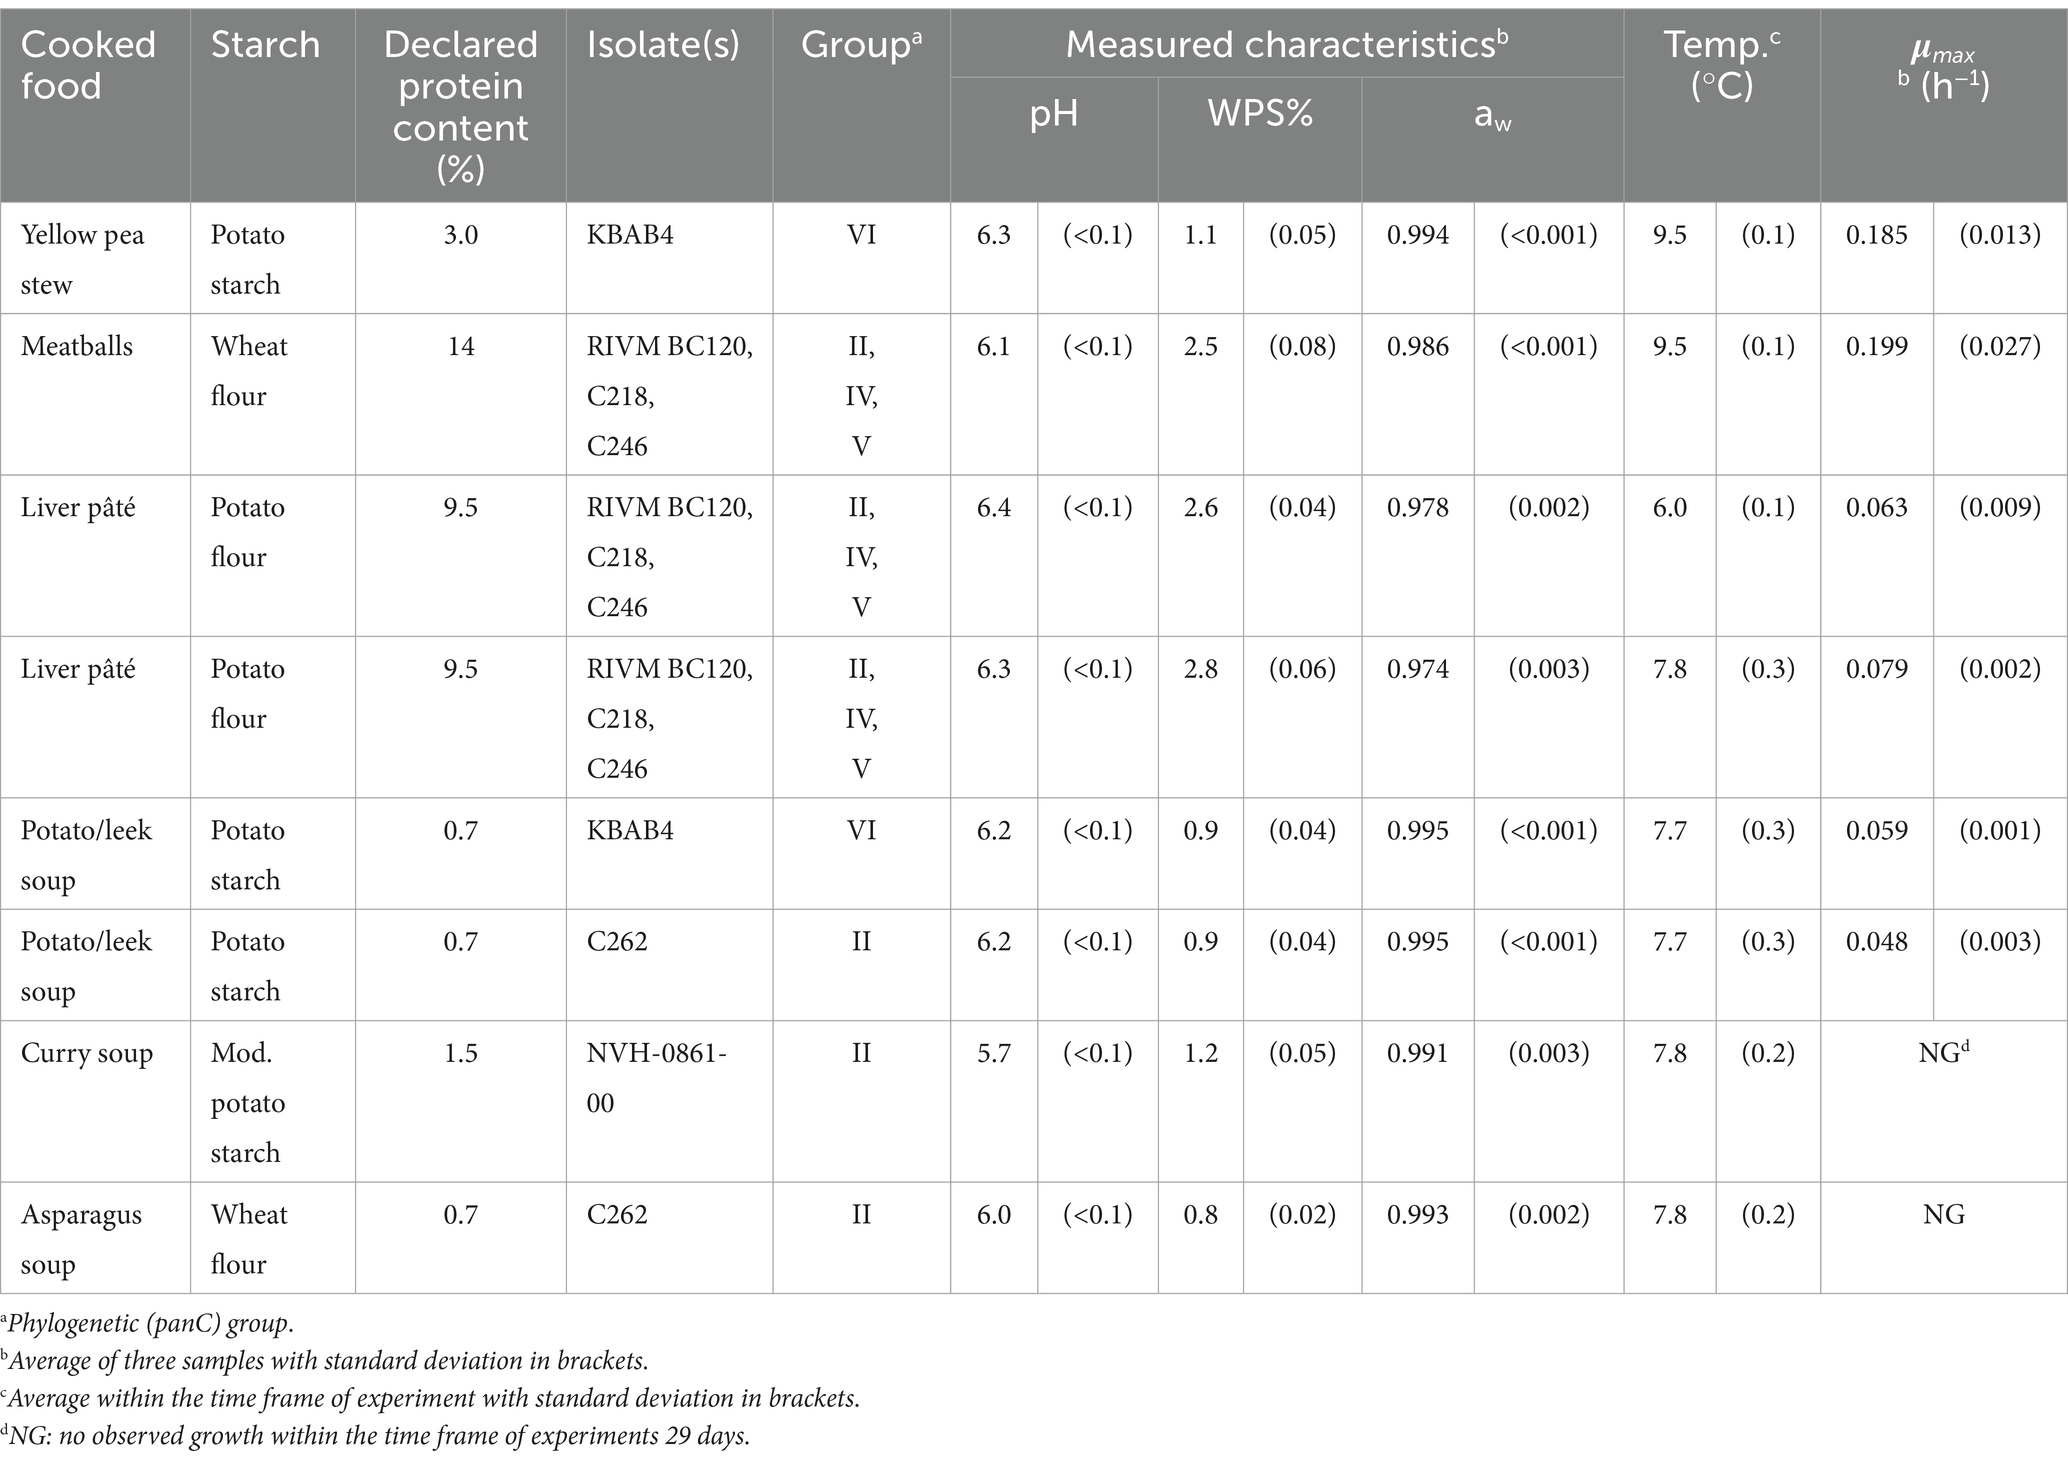
Table 4. Product characteristics, storage conditions and estimates of maximum specific growth rates (μmax) for Bacillus cereus sensu lato in challenge tests performed in the present study with composite foods containing at least one starchy ingredient.
Furthermore, challenge tests with ready-to-eat meat balls (n = 1) and ready-to-eat liver pâté (n = 2) were conducted using a slightly modified procedure because of their firmer texture (Table 4). These experiments were included to evaluate if composite foods rich in animal proteins or vegetable proteins from split peas resulted in faster growth than observed for single component starchy foods. For the challenge tests with meat balls and liver pâté, samples consisted of pieces of 15 ± 1 g placed in petri dishes (51,504, Fisherbrand) and inoculated with five droplets of 20 μL of a 1:1:1 cocktail of three isolates RIVM BC120 (group II), C218 (group IV), and C246 (group V).
For all the 50 challenge tests (Tables 2–4), sampling intervals were adjusted during storage time (2–7 weeks) based on sampling results and storage temperature. During each challenge test, samples were analyzed at six to 12 storage times. At each sampling point, three packages were picked for each tested product and randomly denoted A, B, and C and analyzed separately. With the exception of meat balls and liver pâté, where the entire 15-g samples were used, samples of 10 g of food were analyzed. All samples were diluted 10-fold in sterile physiological saline with peptone (PSP, 0.85% w/v with 0.1% Bacto Peptone, 211,677, Becton, Dickinson and Company, Sparks, United States) in blender bags with filter (02372, BagPage R, Interscience, Saint Nom la Bretêche, France) and homogenized for 30 s by using a Stomacher Lab Blender 400. Additional 10-fold dilutions of the homogenates were made in PSP. Viable counts of B. cereus s.l. were determined by spread plating suitable dilutions on Mannitol egg Yolk Polymyxin agar (MYP) (CM0929 + SR0047 + SR0099, Oxoid) or RAPID’B.cereus medium (12,007,305 + 12,007,306 + 12,007,307, Bio-Rad Laboratories, Copenhagen, Denmark) followed by enumeration of typical colonies after incubation at 30°C for 24 h.
2.1.3 Storage temperatures and product characteristics in challenge tests
Data loggers (TinytagPlus, Gemini Data Loggers Ltd., Chichester, United Kingdom; Verdict 2 K: T, Verdict Systems BV, Aalten, The Netherlands) regularly recorded storage temperatures. The average temperature within the timeframe of each experiment was calculated and reported.
Product characteristics were determined by analysis of three uninoculated packages for each individual challenge test. The pH–value was measured with a HQ411D Laboratory Single Input instrument and a PHC724 probe (Hach Lange, Brønshøj, Denmark) using 5 g of product homogenized with 20 mL distilled water (NMKL 179, 2005). Salt was determined by automated potentiometric titration (785 DMP Titrino, Metrohm, Hesisau, Switzerland). Dry matter content was determined by oven drying at 105°C for 24 ± 2 h. The aw –value was measured at 25°C applying the standard protocol for AQUALAB 4TE (Decagon devices Inc., Pullman, Washington, United States) after calibration of the instrument with distilled water and 40% potassium sulfate (1.05153.1000, Merck, Darmstadt, Germany).
2.1.4 Fitting of growth curves
Growth kinetics of B. cereus s.l. were described by fitting the integrated and log10-transformed logistic model with delay, Equation 3 (Rosso et al., 1996) to log10-transformed cfu/g counts obtained as a function of storage time. Fitting was performed using non-linear regression with the method of least squares and the solver function in Microsoft Excel (RRID:SCR_016137). Fitted parameter values for initial cell concentration (Log N0, log10cfu/g), lag time (tlag, h), maximum specific growth rate (μmax, h−1) and maximum population density (Log Nmax, log10cfu/g) were determined for each growth curve collected from the samples denoted A, B, and C separately, resulting in three μmax–values for each challenge test. The μmax–values were reported as average and standard deviation of samples A, B, and C (Tables 2–4).
where t is the storage time (h) and Nt is the cell concentration (cfu/g) at time t.
2.2 Evaluation of available growth models using growth responses from the present study
Ten predictive growth rate models, that included the effects of temperatures below 12°C, pH and aw on the growth rate of either psychrotolerant or mesophilic-psychrotolerant intermediary thermotypes of B. cereus s.l., were extracted from the scientific literature. One model was from ComBase: A Combined Database For Predictive Microbiology (RRID:SCR_008181), which are partly based on the work by Sutherland et al. (1996), while of the remaining models eight came from Carlin et al. (2013) and one from Zwietering et al. (1996) (Table 5). These models were used to predict responses for different B. cereus s.l. isolates based on product characteristics and storage temperature as described in Table 2.
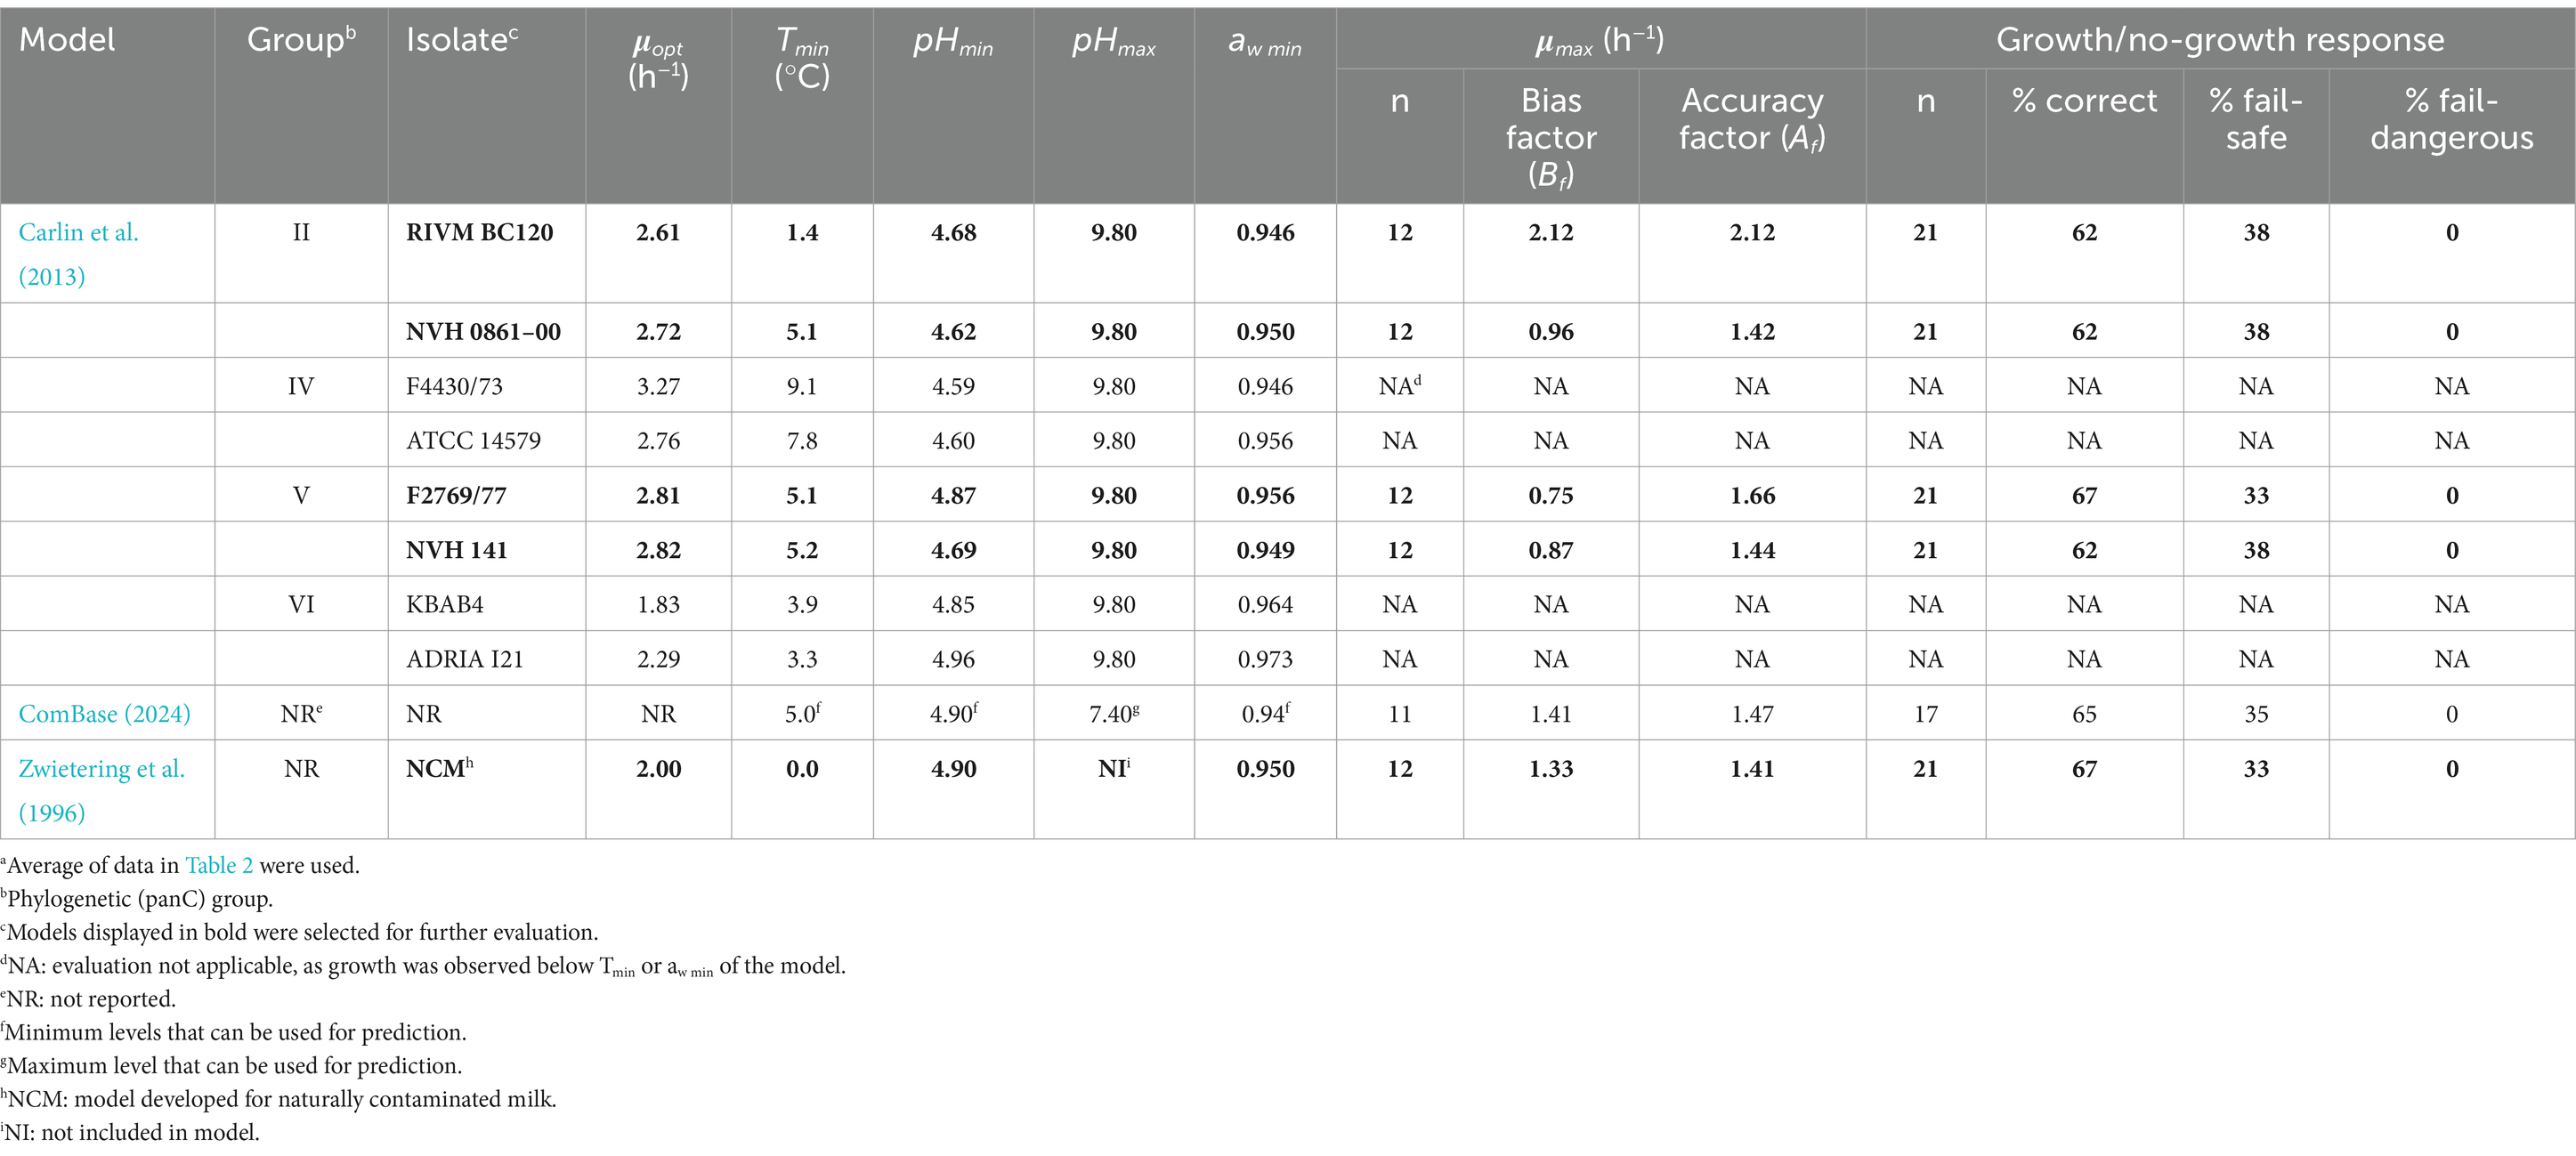
Table 5. Evaluation of 10 existing Bacillus cereus sensu lato growth models using growth responses from the present studya.
Carlin et al. (2013) developed cardinal parameter models including the effect of temperature (T), pH and aw (Equations 4 and 5) on μmax–values of B. cereus s.l. isolates from different phylogenetic panC groups. The eight models included in the present study (Table 5) had Tmin–values from 1.4 to 9.1°C, pHmin–values from 4.59 to 4.96 and aw min–values from 0.946 to 0.973 (Carlin et al., 2013).
For growth of naturally occurring B. cereus s.l. in milk, Zwietering et al. (1996) suggested a cardinal parameter model like Equation 4 and with terms for temperature, pH and aw that were simpler than indicated by Equation 5. This model used Tmin = 0.0°C; pHmin = 4.9 and aw min = 0.95.
These 10 growth rate models were evaluated by using 21 growth/no-growth responses and corresponding product characteristics as determined in the present study (see Section 2.1 and Table 2). This screening of growth rate models was used to exclude the models with poor, or no potential of improved performance by product calibration and/or expansion with terms for interactions between T, pH and aw.
2.3 Indices used to evaluate the performance of growth and growth boundary models
The performance of growth rate models was evaluated by comparison of observed and predicted μmax–values. Bias factor (Bf; Equation 6) and accuracy factor (Af; Equation 7) values were calculated and compared with limits previously used for evaluating growth rate models for various bacteria: 0.95 < Bf < 1.11 indicate a good model performance, with Bf in the intervals of 1.11–1.43 or 0.87–0.95 corresponding to acceptable model performance and Bf < 0.87 or > 1.43 considered as unacceptable model performance (Mejlholm et al., 2010).
In addition, Af > 1.5 indicate poor model precision or a systematic deviation between observed and predicted μmax–values (Mejlholm and Dalgaard, 2013). Predicted and observed growth and no-growth responses were evaluated by calculating the percentage of samples that were correctly predicted. Incorrect predictions were considered as fail-safe (growth predicted when no-growth was observed) or fail-dangerous (no growth predicted when growth was observed). Criteria corresponding to good, acceptable and unacceptable model performance have not been established for the percentage of correct, fail-safe and fail-dangerous predictions. Nevertheless, when evaluating different models and using the same data set these indices allow the performance of models to be ranked. Larger validation studies found the better models to have >75% correct, < 15% fail-safe and < 10% fail-dangerous predictions (Koukou et al., 2022; Martinez-Rios et al., 2020; Mejlholm et al., 2010). Ideally, models should provide 100% correct, 0% fail-safe and 0% fail-dangerous predictions but when product characteristics are close to the growth boundary a small percentage of fail-safe and fail-dangerous predictions can be observed, even for precise models, due to for example variability in product characteristics. Therefore, it is particularly important to indicate if fail-dangerous predictions are close to the growth boundary and this can be done by using the ψ–value (see section 2.4, Equation 12) which has a value of 1.0 at the growth boundary (Mejlholm and Dalgaard, 2009).
2.4 Evaluation of models updated by product calibration and expansion with terms for interaction between environmental factors
Even though Bf –value, Af –value and proportion of correct, fail-safe and fail-dangerous predictions of growth/no-growth responses are normally used as model performance indices, they were calculated here to be able to select the most promising models. Different approaches for model improvement were applied. For each of the selected literature models, 82 new models were developed in the following way. One model was developed by product calibrating the μopt–value using Equation 8 to create μopt-C. By keeping the μopt–value unchanged and expanding the model with the interaction term (Equation 9) using three different values of n in Equation 11, for the effect of interaction between temperature, pH and aw, resulted in 33 = 27 different models. Another 2 × 27 = 54 models were developed, 27 by first product calibrating μopt and then expanding with the interaction term and 27 by first expanding with the interaction term and then product calibrating μopt.
Product calibration of the selected Carlin et al. (2013) and Zwietering et al. (1996) models was performed by dividing the original μopt –values for each model with the Bf –value determined for the specific model (Equation 8).
where μopt-C is the maximum specific growth rate (h−1) after product calibration and at the optimum growth temperature as suggested by Koukou et al. (2021).
ξ in Equation 9 described the effect of interactions between the environmental factors and its effect was modeled as previously reported by using the Le Marc approach (Le Marc et al., 2002). The value of ξ was between 0 and 1 and calculated according to Equations 10–12.
where ξ(ϕ(T, pH, aw) is the term describing the effects of interactions between environmental factors on μmax. For temperature, pH and aw the contribution of each of these terms in Equation 9 to the interaction term (ξ, Equation 10) was calculated by using Equation 11 and Equation 12. Le Marc et al. (2002) applying a value of 2.0 for n in Equation 11, however, in the present study the effect of using values of 1, 2 or 3 was evaluated as described below.
where ei represents the environmental factors and ϕe the contribution of each environmental term to the effect of interactions between the factors.
The ψ–value provides a measure of how far a specific set of environmental factors is from the growth boundary (Mejlholm and Dalgaard, 2009) and a ψ–value higher than 1.0 indicated no growth (Equation 10).
To find the most promising interaction terms for the effect of T, pH and aw in the better performing models, all the 27 combinations, which resulted from using values of 1, 2, or 3 for n in Equation 11 when used for T, pH or aw, respectively, were tested. For each model, the Bf – and Af –values as well as the percentages of correct, fail-safe and fail-dangerous predictions of growth/no-growth responses were calculated using the dataset in Table 2. This approach was performed both before and after product calibration of the models. Models with good or acceptable Bf – and Af –values (see section 2.3), ≥ 75% correct and ≤ 5% fail-dangerous predictions for growth/no-growth responses were selected for further evaluation.
2.5 Evaluation of the most promising of the updated models with independent data
All new models, constructed as described in Section 2.4 and fulfilling the acceptability criteria for performance, were selected as promising models. Performance of these promising models were evaluated using the independent data reported in Table 3. Bf – and Af –values (Equations 6 and 7) and proportion of correct, fail-safe and fail-dangerous predictions of growth/no-growth responses were calculated and used as model performance indices with the purpose of selecting two of the models for further evaluation using growth/no-growth responses reported in the scientific literature.
2.6 Growth responses and product characteristics extracted from available studies
A total of 33 kinetic responses, for more than 12 different isolates of B. cereus s.l., in a range of single component and composite starchy foods were extracted from five available studies and 10 ComBase records. The studies with single component starchy foods included mashed potatoes from powder, cooked rice, cooked noodles, sliced bread and potato purée whereas the composite starchy foods included meat loaf, composite fried rice meal, pizza, meat lasagna, cottage pie and vegetable pie (Table 6). Exclusively, responses reported for storage temperatures of max 12°C were studied and exclusively for psychrotolerant or mesophilic-psychrotolerant intermediary thermotypes, i.e., strains belonging to the phylogenetic (panC) groups II, IV, V, and VI. When phylogenetic groups were not reported, then the thermo-type of strains was considered psychrotolerant when growth was observed below 10°C or mesophilic-psychrotolerant intermediary when growth was observed at 10°C but not below (Table 6). Product characteristics (pH, NaCl/aw) and storage temperature were recorded for kinetic responses extracted from literature (Table 6). When no information regarding NaCl/aw or pH was provided, then an average value was assumed from reported values for a similar type of food. Other environmental factors, including organic acids, were not mentioned for any of the eight studies analyzed and, therefore, assumed not to be present. When aw was not reported, it was estimated using concentrations of NaCl and moisture to determine % WPS (Equation 13) and converting this to aw using Equation 14 (Resnik and Chirife, 1988; Ross and Dalgaard, 2004) shown below.
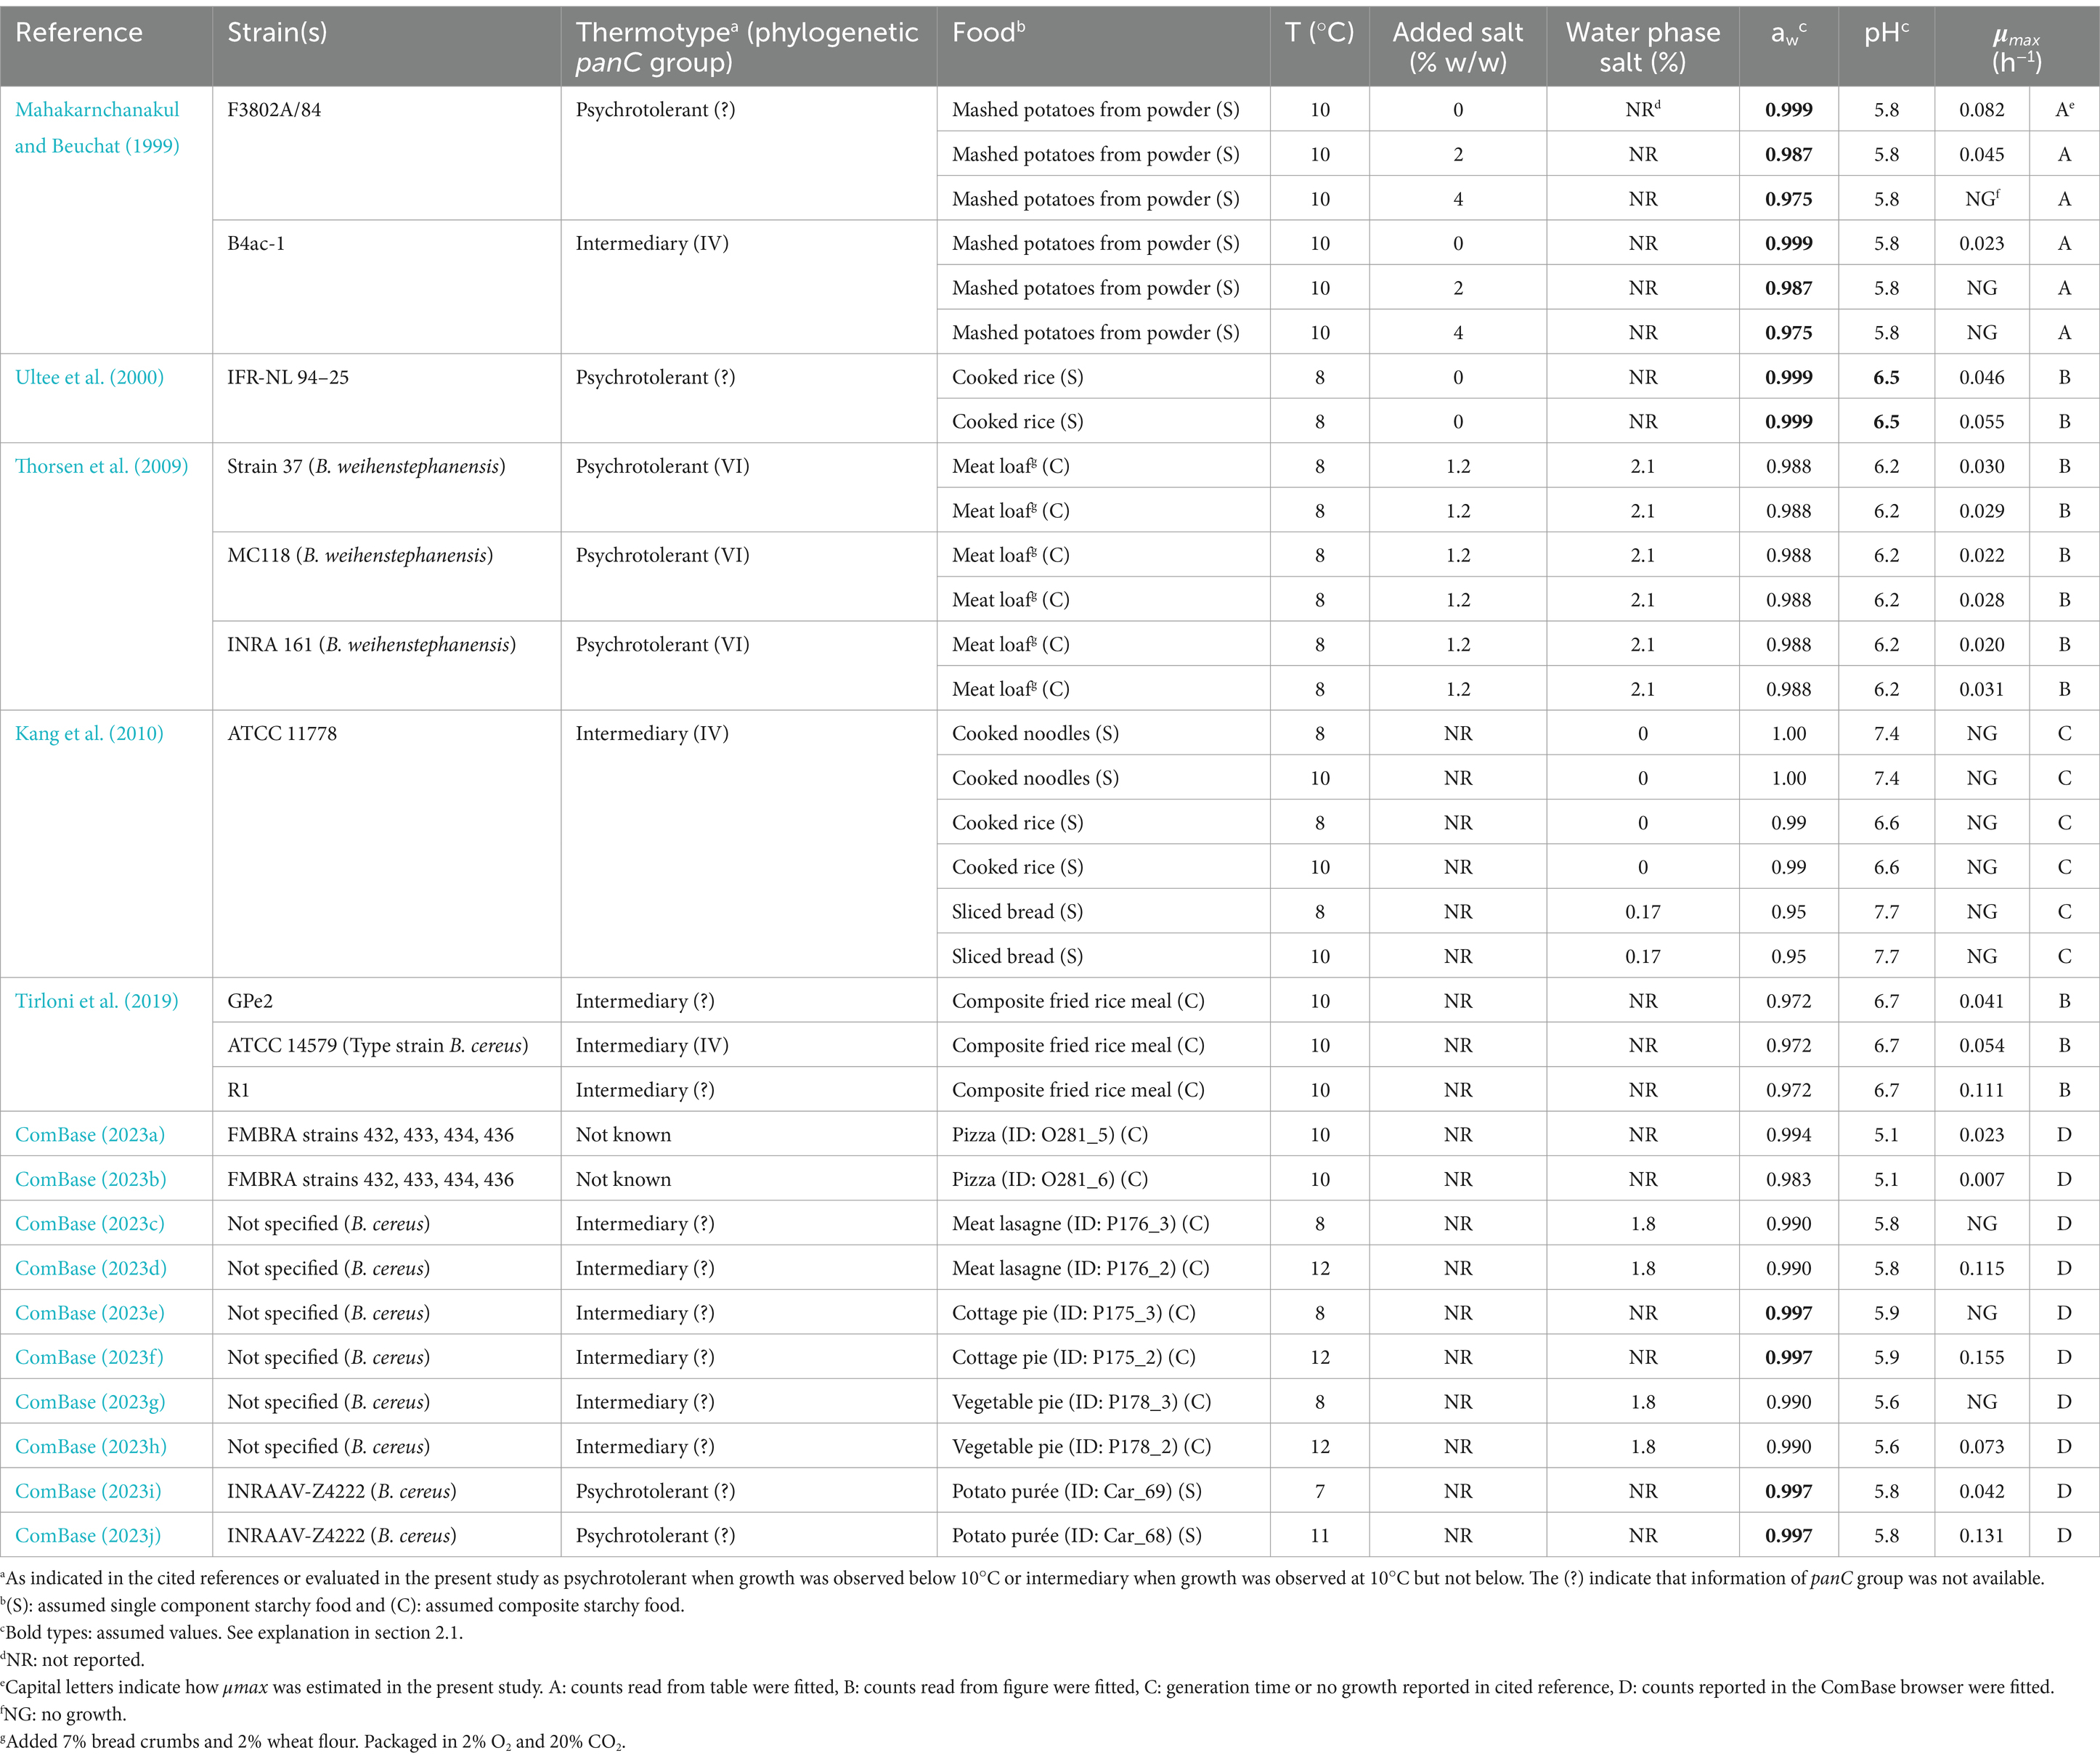
Table 6. Growth responses (μmax, of Bacillus cereussensu lato and product characteristics of starchy foods extracted from available studies.
where WPS is water phase salt.
2.7 Evaluation of the two best performing of the updated models with data from the scientific literature and for composite starchy foods
Evaluation of the two most promising models were performed using the scientific literature data shown in Table 6 and the composite starchy foods from the present study reported in Table 4. For these evaluations, Bf – and Af –values (Equations 6 and 7) and proportion of correct, fail-safe and fail-dangerous predictions of growth/no-growth responses were calculated and used as model performance indices with the purpose of selecting the best model to use for predicting safe shelf-lives.
3 Results and discussion
3.1 Screening of existing growth models using the growth responses in Table 2
The initial 21 challenge tests, which included nine B. cereus s.l. isolates, five starchy food products, storage temperatures from 6.6 to 11.7°C, pH 4.8–7.8 and % WPS of 0.02–9.0 with aw–values of 0.935–0.999, resulted in nine tests with no-growth responses and 12 tests with average μmax –values of 0.016–0.200 h−1 (Table 2). When compared to the experimental data, two models were excluded from further evaluation due to observed growth at temperatures ≤7.7°C (Table 2), which is lower than the Tmin–value of strains F4430/73 (Tmin = 9.1°C) and ATCC 14579 (Tmin = 7.8°C) (Carlin et al., 2013). Another two of the 10 studied models from the literature were excluded from further evaluation due to observed growth in bulgur adjusted to aw of 0.957 and in pasta adjusted to aw of 0.962 (Table 2), which were below the aw min –values of 0.964 and 0.973 for the strains KBAB4 and ADRIA I21, respectively (Carlin et al., 2013). The model from ComBase was also excluded from further study. This model had a proportion of correct growth/no-growth predictions of 65% (Table 5) being lower than 75% which is aimed for in validation studies. Moreover, as this model is not a cardinal parameter-type model, and its model parameter values are not known (ComBase, 2024), it was not possible to expand the model with an interaction term to improve the percentage of correct and fail-safe predictions.
The five remaining models were the models for group II strains RIVM BC120 and NVH 0862–00, group V strains F2769/77 and NVH 141 (Carlin et al., 2013) and the model in Zwietering et al. (1996). They are all cardinal parameter models and had no fail-dangerous predictions of the growth/no-growth responses (Table 5). Two of these models, i.e., the Carlin et al. (2013) model for group II strain RIVM BC120 and the model in Zwietering et al. (1996), both had Bf – and Af –values that were well above 1.0 and close to each other (Table 5). This does not necessarily disqualify these models from further studies as such a situation has previously been solved by product calibration of the model where the μopt–value is calibrated to include the effect of specific foods (Dalgaard and Mejlholm, 2019; Koukou et al., 2021; Rosso et al., 1996). High Bf – and/or Af –values have also been linked to evaluation of predictive growth rate models without an interaction term (Mejlholm and Dalgaard, 2009). When approaching the growth boundary, growth rates are often reduced due to the interaction between environmental factors and if not accounted for in a predictive model, then growth rates can be over-predicted resulting in increased Bf – and Af –values and a high proportion of fail-safe predictions of the growth/no-growth responses (Mejlholm and Dalgaard, 2009). Neither the Carlin et al. (2013) models nor the Zwietering et al. (1996) model included an interaction term, suggesting expansion of these models with this term could be an option to decrease the number of fail-safe and increase the number of correct predictions of the growth/no-growth responses. Importantly, Carlin et al. (2013) and Zwietering et al. (1996) models were developed in markedly different ways. Carlin et al. (2013) developed models for growth rates of individual isolates in BHI broth whereas Zwietering et al. (1996) estimated cardinal parameter values from data for growth of naturally occurring B. cereus in milk.
3.2 Product calibration and expansion of models with interaction term using growth responses
Of the overall 410 models (82 modifications of each of the five original models) that were tested using the growth responses in Table 2, nine models complied with the criteria of having a good or an acceptable Bf –value (0.87 ≤ Bf ≤ 1.43), an acceptable Af –value (Af ≤ 1.5) and at the same time resulting in ≤5% fail-dangerous and ≥ 75% correct predictions of growth/no-growth responses (Table 7). All nine of the best performing models were derived from the two original models with the lowest Tmin–values, i.e., 1.4°C for the group II strain RIVM BC120 model (Carlin et al., 2013) and 0.0°C for the model in Zwietering et al. (1996) (Table 5). As growth responses at low temperatures was predicted this is probably to be expected. Importantly, all these nine models included a term for the growth inhibiting effect of interactions between the environmental factors, temperatures, pH and aw (Table 7). This confirmed the importance of taking the effect of interactions into account when growth responses are predicted as previously observed, e.g., for mesophilic B. cereus (Le Marc et al., 2021), L. monocytogenes (Augustin and Carlier, 2000; Le Marc et al., 2002; Mejlholm and Dalgaard, 2009) and non-proteolytic Clostridium botulinum (Koukou et al., 2021).
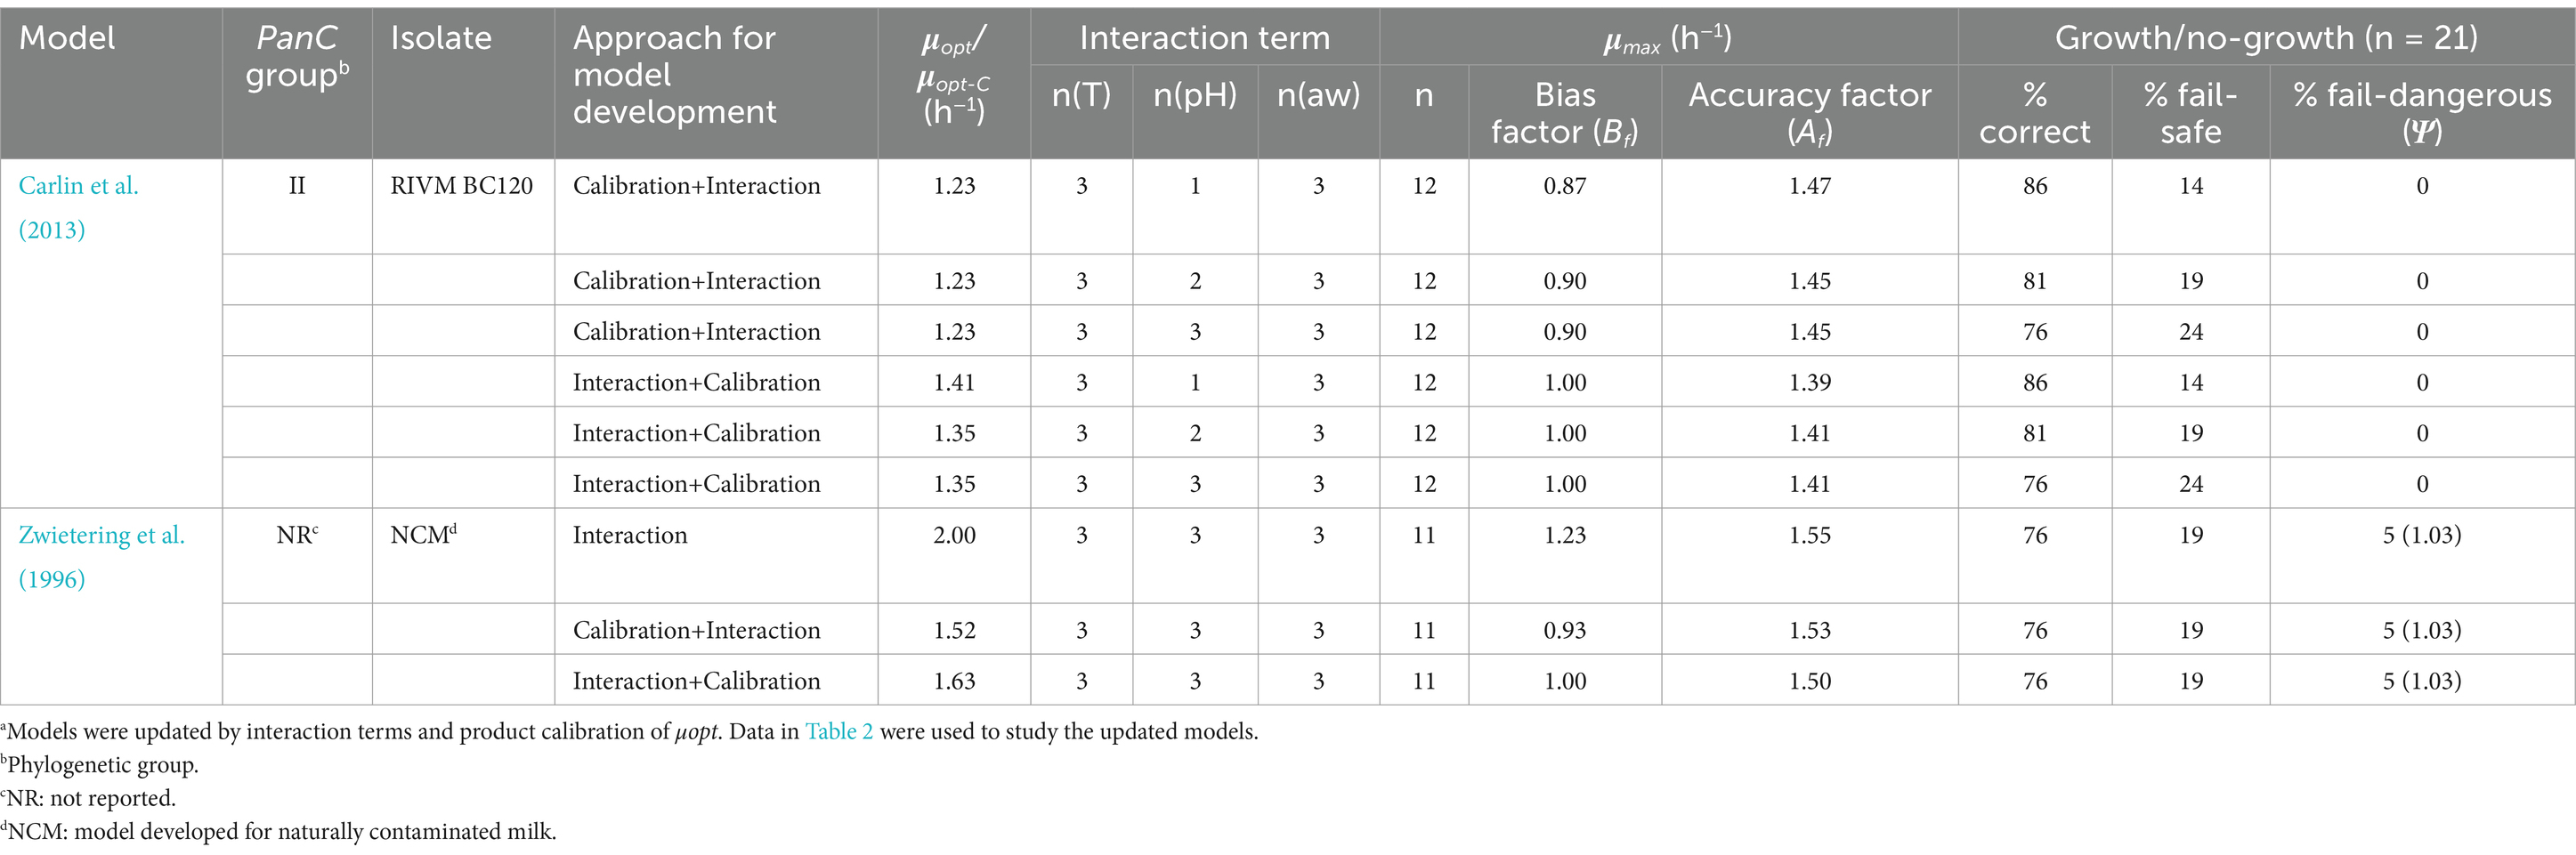
Table 7. Characteristics of the nine best performing and updated Bacillus cereus sensu lato growth modelsa.
The μopt–value was calibrated for eight of the nine best performing models (Table 7) indicating that growth rates of B. cereus s.l. in starchy foods differ from growth rates in the BHI broth or milk used for development of the original models (Carlin et al., 2013; Zwietering et al., 1996). Only, one of nine best performing models included the original μopt–value from milk (Table 7; Zwietering et al., 1996).
As changing the μopt –value does not affect the cardinal parameter values, which define the growth/no-growth conditions, product calibration as the sole approach for updating models (i.e., approach i, see section 2.4) could not improve the predictions of the growth/no-growth responses. However, product calibration in combination with expanding the original models with an interaction term (i.e., approaches iii and iv, see section 2.4) was very effective, as resulting in acceptable performance of eight of nine models in Table 7 which were updated in this way. Half of these eight models were a result of first calibrating the μopt –value of the original models and then expanding the model with an interaction term, while the other four models were expanded with an interaction term before calibration of μopt –values (Table 7). Hence, no clear picture on best practice could be deduced indicating that it could be depending on the specific model.
The six models, originating from Carlin et al. (2013) group II strain RIVM BC120 model, kept 0% fail-dangerous predictions after updating, suggesting the best model for the purpose of predicting the growth/no-growth response of B. cereus s.l. in starchy foods would be found among these six. However, the 5% fail-dangerous predictions of growth/no-growth responses obtained for the updated Zwietering et al. (1996) models, do not necessarily disqualify these models from further studies. The result of 5% fail-dangerous predictions of no-growth, when growth was observed, corresponded to one of the challenge tests, i.e., Exp. no. 20 (Table 2). In this challenge, with cooked bulgur inoculated with group VI strain ADRIA I21, the ψ–value was determined to be 1.03 (Table 7) with the updated models when the average measurements of storage temperature of 11.7°C, pH of 6.8 and aw of 0.958 (Table 2) were applied. As a value of 1.0 indicates the growth boundary (Le Marc et al., 2024; Mejlholm and Dalgaard, 2009), the value 1.03 predicted no-growth. As the aw –value of this challenge is close to the aw min –value of 0.950 for the model even small deviations in the aw measurement can change the ψ–value from predicting no-growth to predicting growth, e.g., using the highest aw –value of 0.959, measured in this case, would have resulted in a ψ–value of 0.96, thereby, predicting a growth response in this sample. Therefore, none of the three models originating from the Zwietering et al. (1996) were disqualified and all nine updated models were studied further as promising candidates being evaluated using the independent experimental data shown in Table 3.
3.3 Evaluation of the most promising of the updated models using growth responses in Table 3
The 21 performed challenge tests, used as the independent growth/no-growth responses (Table 3) in the evaluation, included the same nine B. cereus s.l. isolates and the same five starchy food products as used for the updating of literature models. Regarding storage temperature, pH, % WPS and measured aw, all levels were within the ranges used for updating the models (Tables 2, 3). Challenge tests resulted in ten no-growth responses and 11 growth responses with average μmax–values of 0.011–0.128 h−1 (Table 3).
Four of the nine studied models performed with Bf–values between 0.87 and 1.01 as well as Af–values between 1.15 and 1.32 indicating acceptable to good performance for prediction of μmax–values (h−1) (models in bold, Table 8). Of these four models, two stood out with better results for the prediction of the growth/no-growth responses and resulted in more than 75% correct, less than 25% fail-safe and no fail-dangerous predictions (models with *, Table 8). This was an improvement of the number of correct predictions of 14 percentage points for both the Carlin et al. (2013) model for group II strain RIVM BC120 as well as for the model in Zwietering et al. (1996) (Tables 5, 8). Figure 1 compares observed and predicted μmax–values for these two models and illustrates, that predictions obtained using the updated Zwietering et al. (1996) model, on average were less biased with equal number of data points scattered around the line of perfect match, though with two results positioned further above the line as indicated with square symbols in Figure 1 (□). These two growth responses were both from challenge tests with the panC group VI strain ADRIA I21 in samples with no added NaCl (aw, 0.999) having pH–values (6.2 and 6.6) around the optimal of 6.4 for this strain (Carlin et al., 2013) and stored at 7.7 and 11.5°C, respectively (Table 3). However, as shown in Figure 1 (■), these two growth responses did not deviate markedly from the predicted μmax–value when using the updated Carlin et al. (2013) model for panC group II strain RIVM BC120. The difference appeared to be related to the environmental term for aw, CM1(aw), where the predicted values for the updated Carlin et al. (2013) model for panC group II strain RIVM BC120 were lower compared to values obtained using the updated Zwietering et al. (1996) model (results not shown). The cardinal parameter aw opt has the value of 1.0 in the Zwietering et al. (1996) model meaning that aw max becomes irrelevant. With aw opt and aw max of 0.997 and 1.0, respectively, in the Carlin et al. (2013) model for panC group II strain RIVM BC120, the consequence is that aw–values of more than 0.9985 will result in a shift toward lower CM1(aw) and lower predicted μmax–values for this model compared to the Zwietering et al. (1996) model.
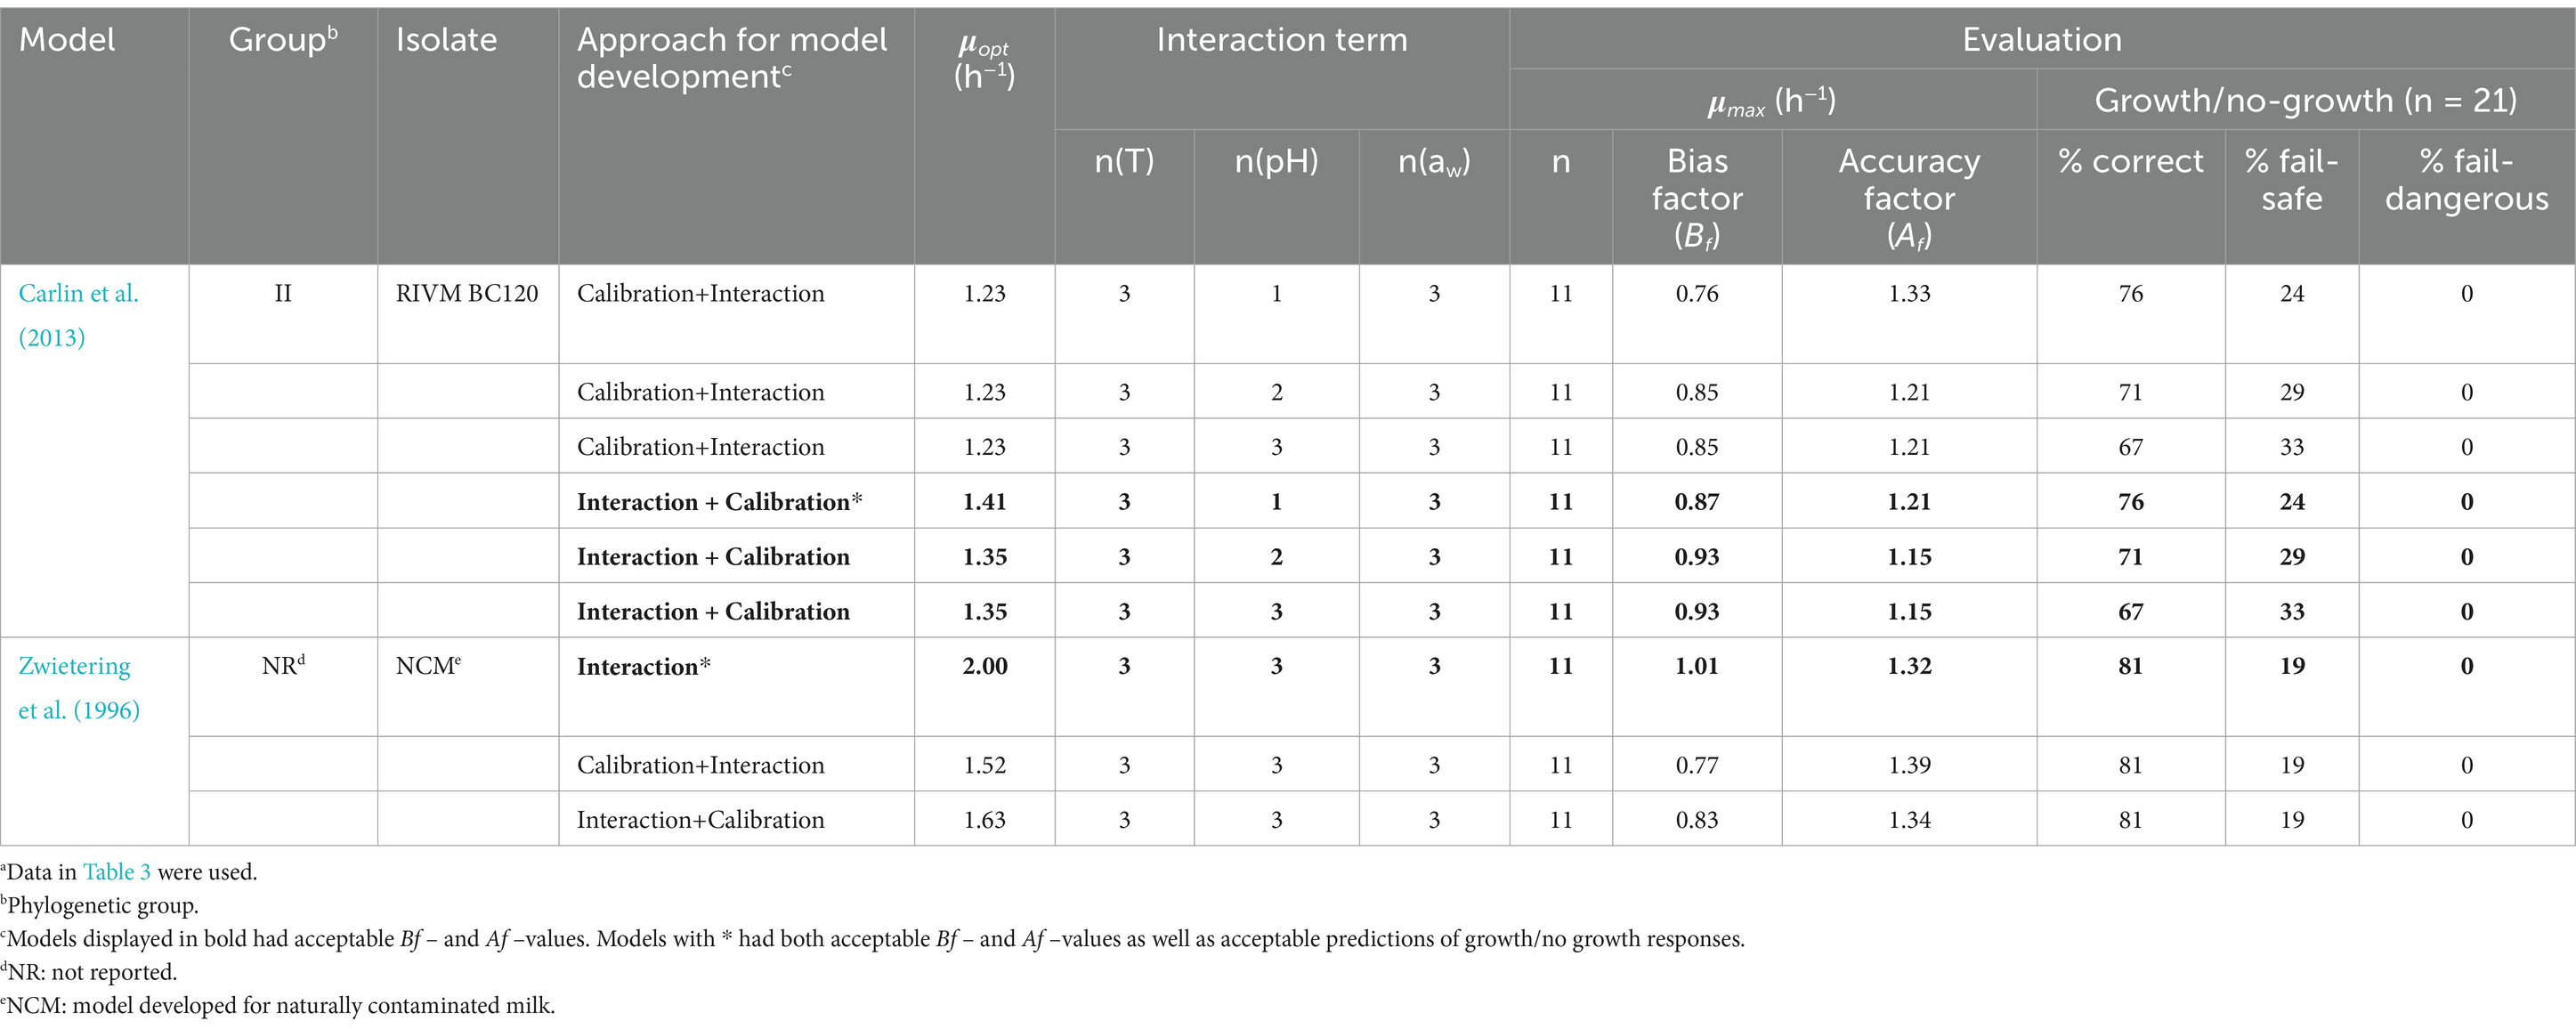
Table 8. Evaluation of the nine most promising of the updated Bacillus cereus sensu lato growth models using growth responses (μmax) generated in this studya.
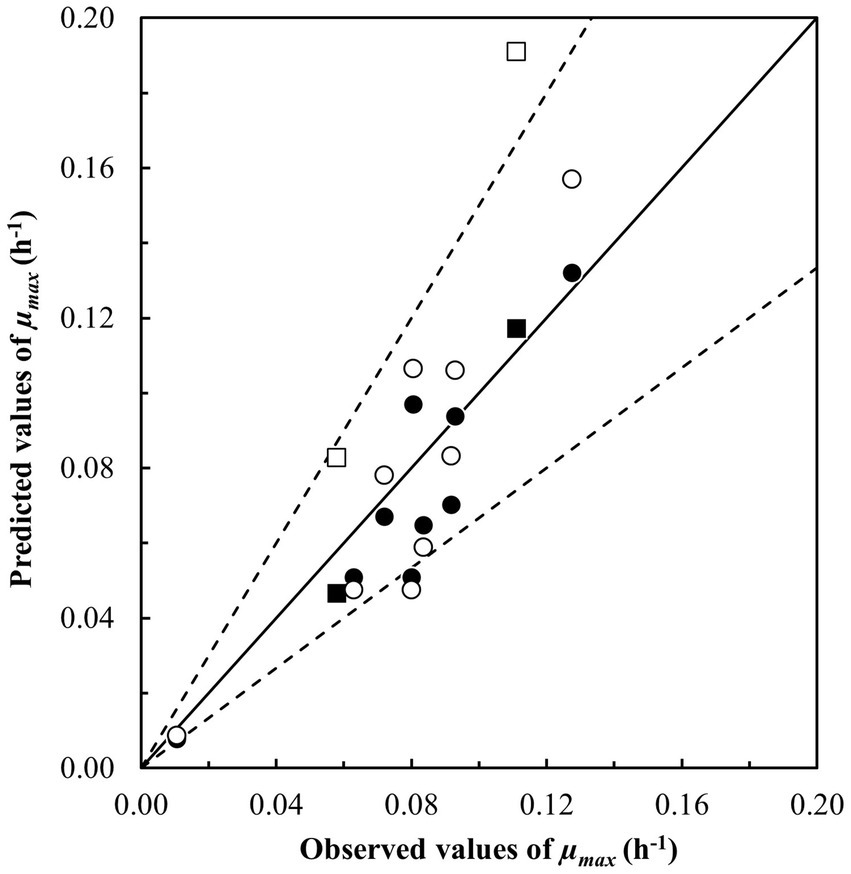
Figure 1. Comparison of observed and predicted maximum specific growth rates (μmax, h−1) for Bacillus cereus sensu lato in starchy foods (Table 3). Growth was predicted using (i) the updated Carlin et al. (2013) model for the panC group II strain RIVM BC120 (●, ■) with Bf– and Af –values of 0.87 and 1.21 and (ii) the updated model from Zwietering et al. (1996) (○, □) with Bf – and Af –values of 1.01 and 1.32. Square symbols represent samples for the panC group VI strain ADRIA I21. The solid line represents the line of perfect match and the dotted lines represent ± Af –value of 1.5.
Nevertheless, both models performed within an acceptable range for starchy foods, and both were additionally evaluated using growth responses partly reported in the scientific literature (Table 6) (n = 33), partly generated in the present study (Table 4) (n = 8).
3.4 Evaluation of the two most promising updated models using growth responses from the literature (Table 6) and challenge tests in composite foods (Table 4)
The dataset extracted from the scientific literature consisted of 33 growth/no-growth responses, leading to the acquisition of 21 μmax –values and 12 no-growth responses to be included in the evaluation (Table 6). Different sub-datasets of growth/no-growth responses were created for the evaluation based on data in Table 6; one for each of the two thermotypes psychrotolerant (n = 13) and intermediary (n = 18), one for single component starchy foods (n = 16), one for composite starchy foods (n = 17), one for meat loaf (n = 6) and a final sub-dataset excluding the data from meat loaf (n = 27) (Table 9). Using the 21 μmax–values, the updated model from Carlin et al. (2013) for panC group II strain RIVM BC120 performed better than the updated Zwietering et al. (1996) model with Bf – and Af –values closer to the acceptance criteria (Table 9). This applied regardless of sub-dataset suggesting a systematic difference resulting in generally higher μmax predictions for the updated Zwietering et al. (1996) model. When looking closer into this difference, it revealed that the predicted ψ–values were lower for 27 out of the 33 challenge tests when applying the updated Zwietering et al. (1996) model (data not shown) indicating a lower dampening effect of the interaction term compared to the updated Carlin et al. (2013) model for panC group II strain RIVM BC120. On the other hand, the higher dampening effect, seen for the updated Carlin et al. (2013) model for panC group II strain RIVM BC120, resulted in two predictions of fail-dangerous growth responses (Table 9). When looking closer into these two fail-dangerous predictions, both cases appeared to concern pizzas, one with pH 5.1 having aw –value of 0.983 (ComBase, 2023b) and another with pH 5.1 and aw–value of 0.994 (ComBase, 2023a), and both had been stored at 10°C (Table 6). These pH, aw and temperature conditions resulted in predicted ψ–values of 1.04 and 1.02 (Table 9). So, both were very close to the growth boundary at 1.0, which means that even small uncertainties in the product characteristics or in the storage temperature could change the prediction from a no-growth response to a growth response. For these two specific observations, e.g., a change in pH–value to 5.13 or a change in storage temperature to 10.4°C, would change the ψ–values to become less than 1.0, moving these fail-dangerous no-growth responses to correct growth responses. These relatively small changes are within the uncertainties that would be expected for pH and temperature measurements when conducting challenge tests (Tables 2, 3). Therefore, care should be taken when disqualifying models exclusively based on data where uncertainties for intrinsic and extrinsic factors are not reported. Taking this into consideration, the results in Table 9 pointed at the updated Carlin et al. (2013) model for panC group II strain RIVM BC120 as the less biased and more accurate of the two models for predicting growth of B. cereus s.l. The model performed with an overall acceptable Bf –value of 1.34, an Af –value of 1.57 close to being acceptable and with 70% correct predictions of growth/no-growth responses, classifying the model as generally fail-safe for foods containing starchy ingredients and stored at max 12°C.
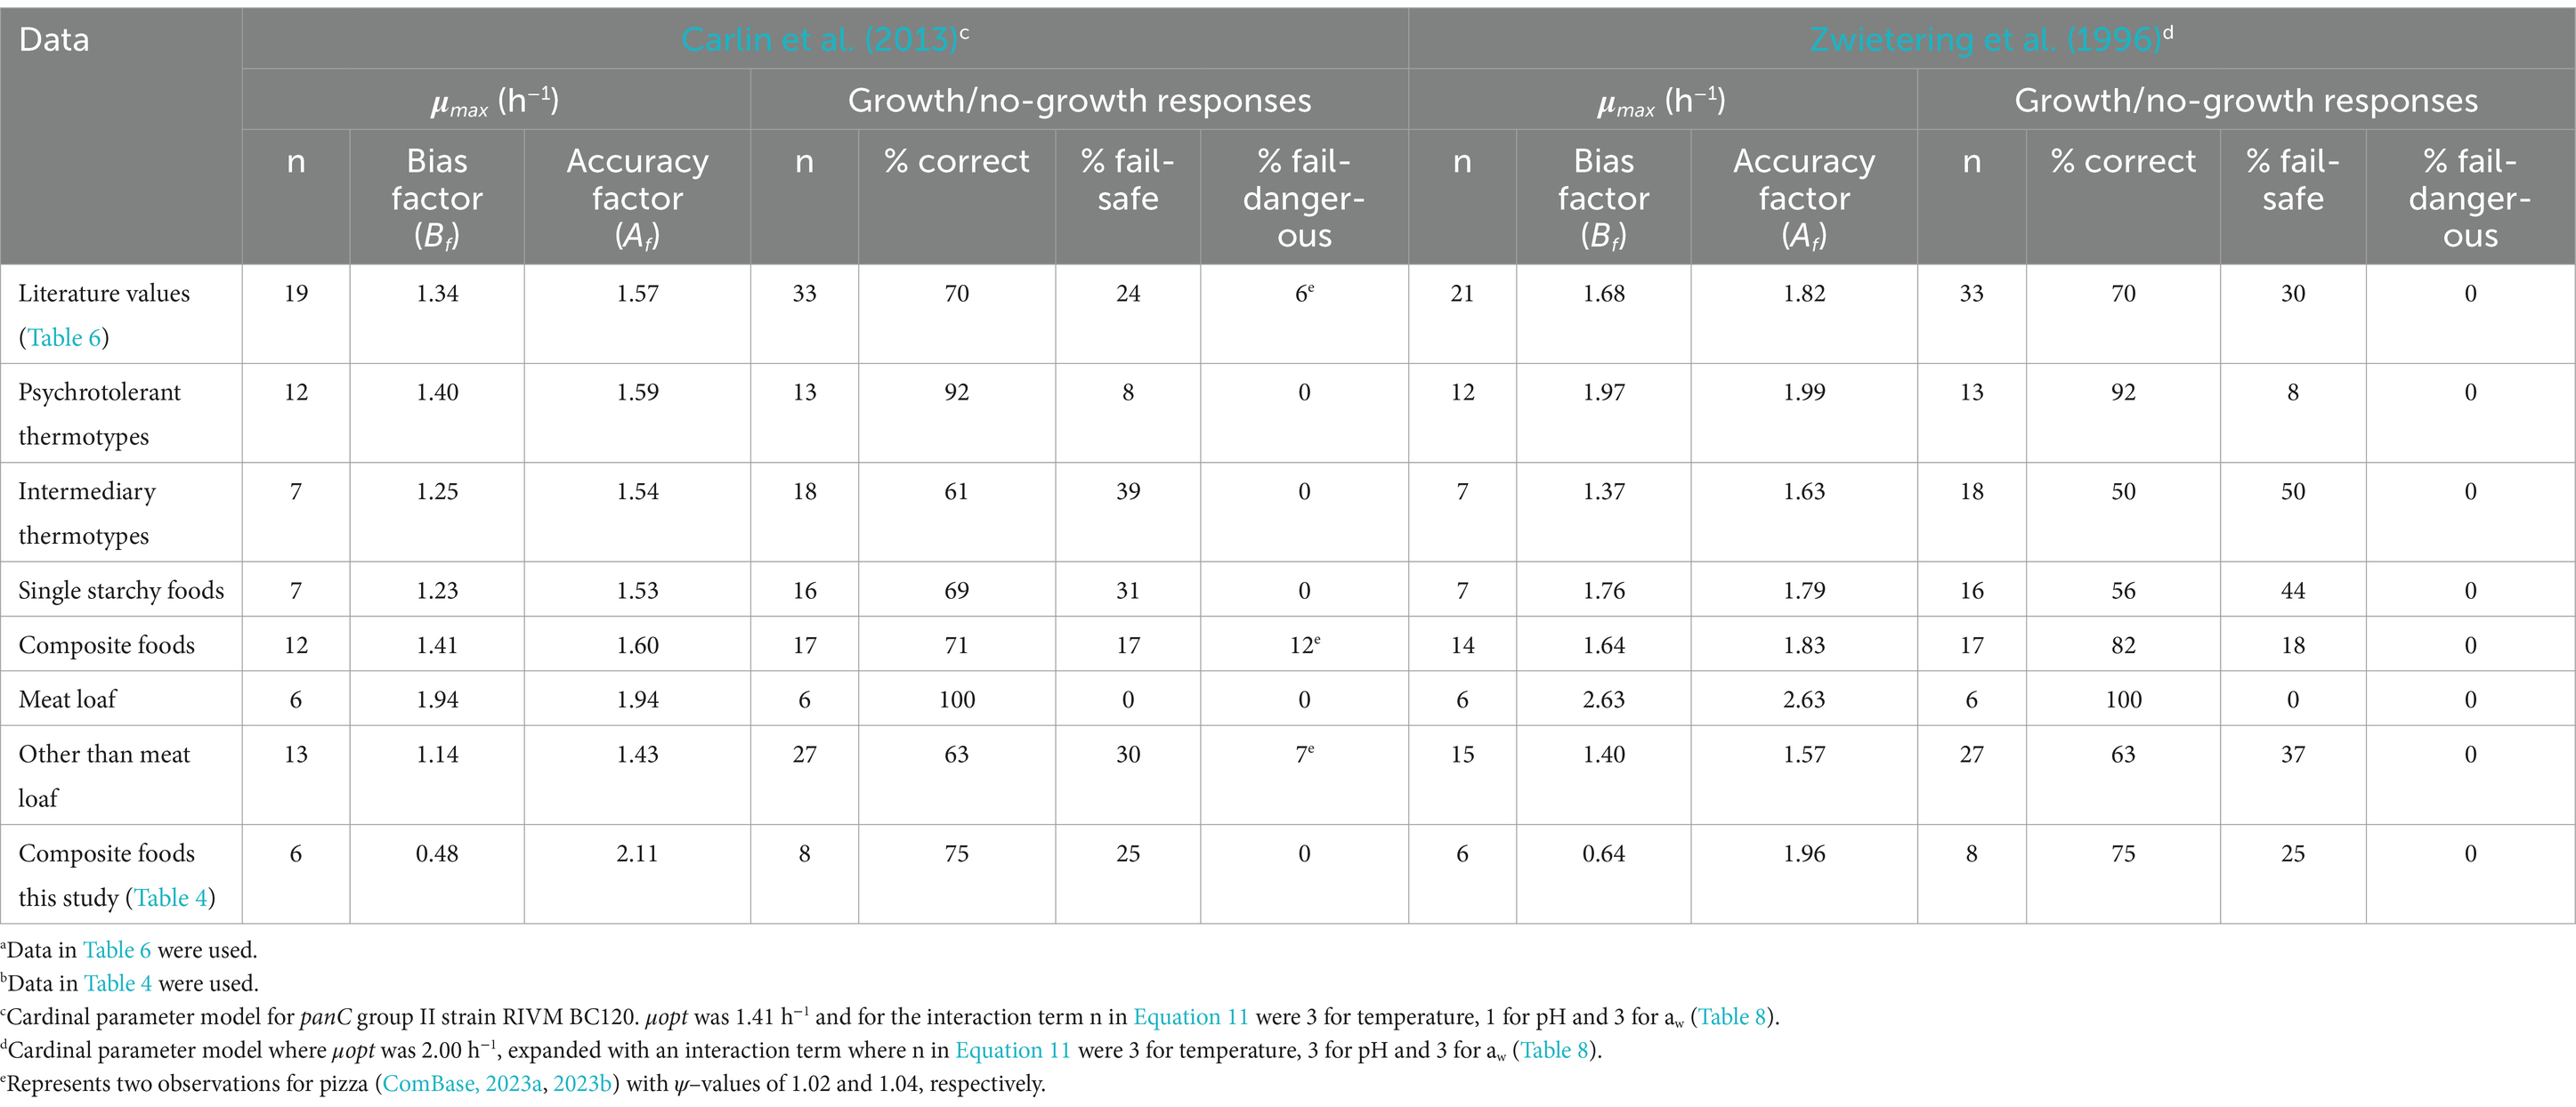
Table 9. Evaluation of the two best performing of the updated Bacillus cereus sensu lato growth models using growth responses from both single and composite starchy foods as reported in the literaturea and growth responses in composite starchy foods generated in this studyb.
As shown in Table 9, the Bf – and Af –values, obtained using the updated Carlin et al. (2013) model for panC group II strain RIVM BC120, were better for the sub-dataset of challenge tests using intermediary thermotypes (panC groups IV and V) and for the sub-dataset of challenge tests involving single component starchy foods. For both sub-datasets, the evaluation was based on n = 7 growth responses (Table 9) but only for one growth response, these two sub-datasets overlapped, i.e., only one μmax observation was found for an intermediary thermotype (B4ac-1) in a single component starchy food (mashed potatoes from powder) (Mahakarnchanakul and Beuchat, 1999; Table 6), whereas six were found for intermediary thermotypes in composite starchy foods and six for psychrotolerant thermotypes in single component starchy foods. This indicated that n = 13 (n = 6 + 6 + 1) of the n = 19 μmax predictions, used in total for this evaluation, actually were less biased (Bf, 1.14) and more accurate (Af, 1.43) than the overall averages (Bf/Af, 1.34/1.57) (Table 9). Consequently, the remaining n = 6 (n = 19–13) μmax predictions represented the combination of psychrotolerant thermotypes in composite starchy foods. Applying this sub-dataset, which turned out to be the six challenges conducted for meat loaf, resulted in Bf – and Af –values of 1.94, which were much higher than the overall averages (Table 9), indicating that growth was strongly over-predicted by the updated Carlin et al. (2013) model for panC group II strain RIVM BC120. This over-prediction was unexpected, as other studies reported faster growth of B. cereus s.l. when animal proteins were available in the substrate as compared to cereal proteins (Ellouze et al., 2021; Kang et al., 2010; Morita and Woodburn, 1977). The additional challenge tests (Table 4) using products with animal or vegetable proteins, and some of the strains as were used for updating the models, were, therefore, included in the present study to investigate this matter. For both of the updated models, μmax –values were strongly under-predicted with unacceptable Bf –values below 0.7 (Table 9). Of the six observed growth responses, four were even below the lower acceptable Af –limit meaning that the observed μmax –values were more than 1.5-fold higher than predictions (results not shown). Interestingly, three of these four low-scoring Af challenges tests were from composite starchy foods rich in animal proteins and the remaining contained vegetable protein from split peas (Table 4). This confirms previous findings of growth rates of B. cereus s.l. in carbohydrate-rich foods being lower than in protein-rich foods, such as meat patties and tofu (Kang et al., 2010). Taken together this means that the updated Carlin et al. (2013) growth rate model for panC group II strain RIVM BC120 should not be used for composite protein-rich foods, as the growth rate might be under-predicted creating unsafe situations.
3.5 Predicting safe shelf lives using the best performing model
Knowing the time to reach a critical concentration of, e.g., 105 cfu/g of B. cereus s.l. is an important input when deciding on the safe shelf-life for ready-to-eat or ready-to-cook chilled foods. The updated Carlin et al. (2013) model for panC group II strain RIVM BC120 (Table 9) can support this decision for foods consisting mainly of starchy ingredients, if the initial concentration (N0) and the lag time are known (Equation 3). With μmax –values predicted by the best performing model, lag times can be determined from the relative lag time (RLT) as Lag time = RLT × ln(2)/μmax. RLT is often a constant (Mellefont and Ross, 2003; Ross, 1999) and lag time has been calculated in this way for different pathogens and foods (Dalgaard and Mejlholm, 2019). In the present study, RLT was estimated using data from all the challenge tests showing growth in single starchy foods after a statistically significant lag time (n = 58) (Supplementary Tables S3, S4). The median RLT-value of 7.2 (95%-CI, 1.6–40) was selected as a representative value for the predicted examples (results not shown). Product examples were chosen based on known N0 of B. cereus s.l., i.e., concentrations measured close to the production time, as well as measured product characteristics (Table 10). The predictions in Table 10 demonstrated that keeping the storage temperature at max. 5°C was by far the most effective way of achieving a long safe shelf-life, i.e., at least 38 days. At this temperature, the time to reach the critical concentration of B. cereus s.l. was less affected by lowering pH or aw than seen at the higher temperatures. Under storage at 8°C, the lowering of pH from 6.5 to 5.8 and aw from 0.996 to 0.990 increased the time to reach the critical concentration of B. cereus s.l. with approx. 1.5–fold. The effect of having a low initial cell concentration can be seen when comparing rice with N0 of 0.1 cfu/g to pasta with N0 of 3 cfu/g. This showed that an approx. 10-fold lower N0 resulted in 1, 2 and > 11 days longer time to reach the critical concentration of B. cereus s.l. at 10, 8 and 5°C, respectively (Table 10).
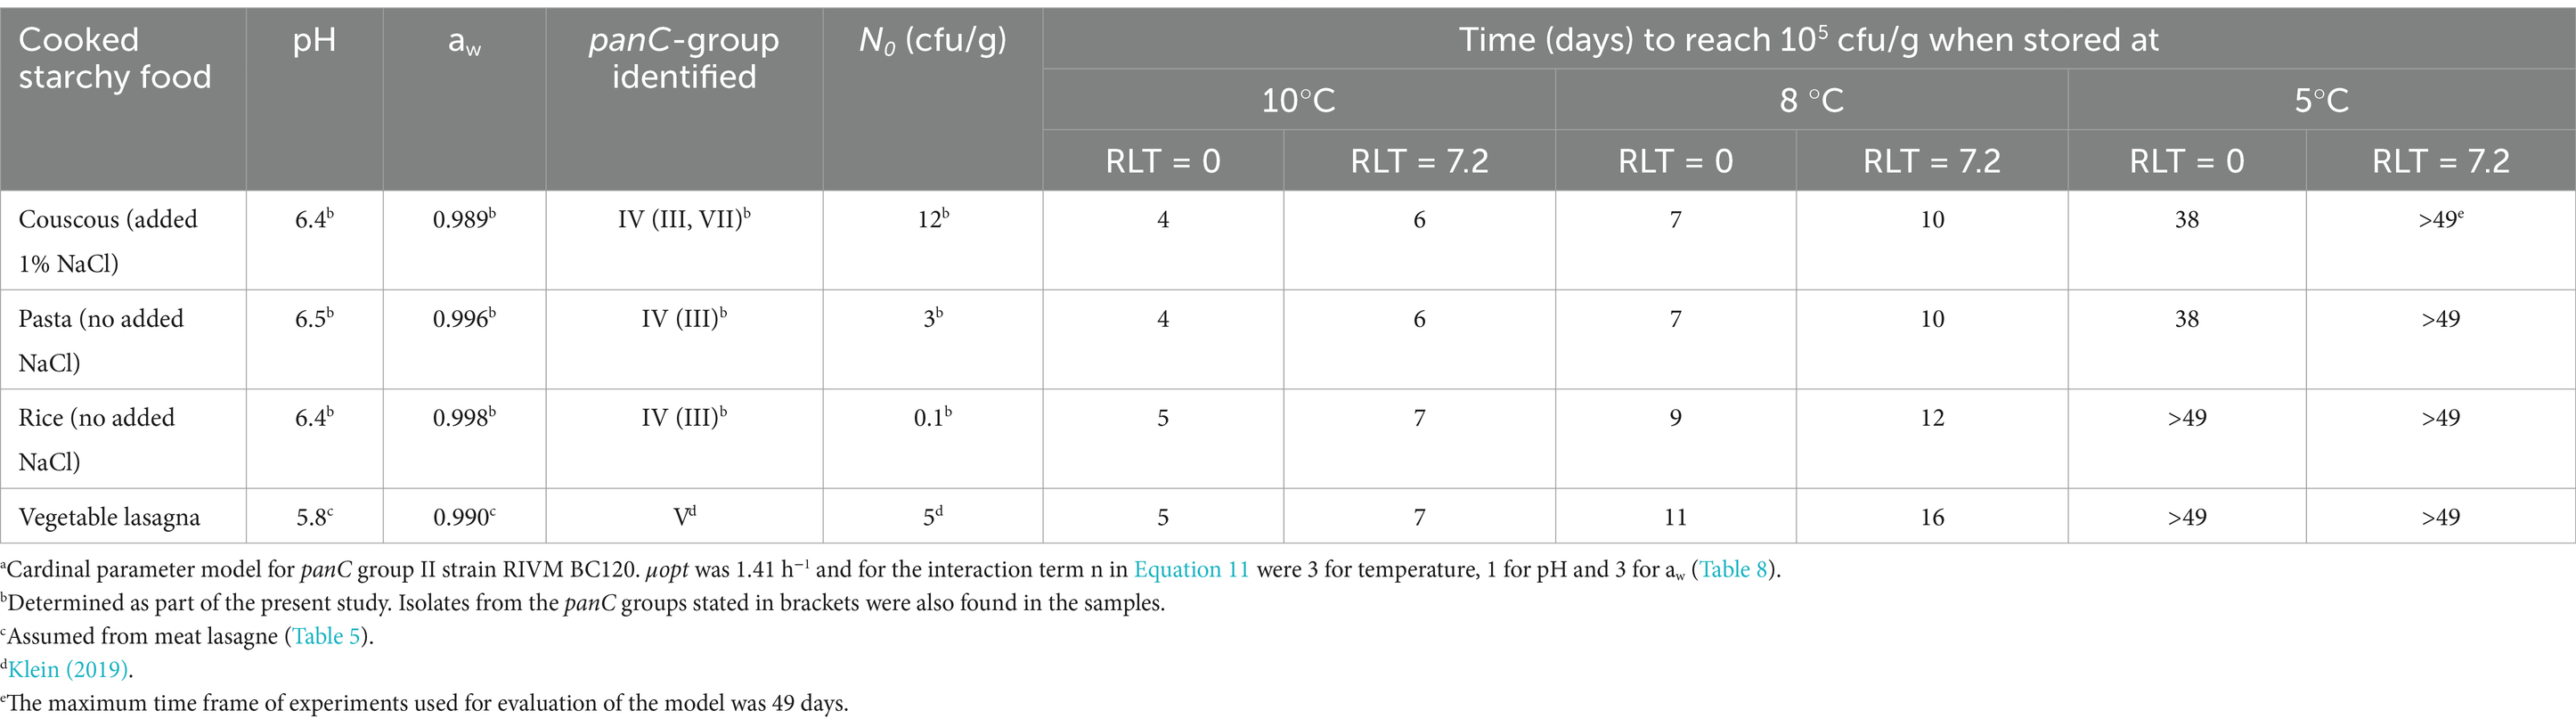
Table 10. Prediction of how many days it takes to reach a critical level of 105 cfu/g of Bacillus cereus s.l. for selected cooked starchy foods when using the updated Carlin et al. (2013) modela with and without a median relative lag time (RLT) of 7.2.
4 Conclusion
The updated Carlin et al. (2013) cardinal parameter model for the panC group II strain RIVM BC120 performed better than available models when predicting both growth rate and growth/no-growth responses of B. cereus s.l. in single starchy foods at temperatures ≤12°C. The model was updated by adding a term for the inhibiting effect of interactions between temperature, pH and aw as well as by product calibration of μopt. The model performance was acceptable and on the safe side with Bf – and Af –values of 1.34 and 1.57, respectively, for growth responses in starchy foods extracted from the scientific literature. The updated model is a useful tool for supporting food safety decisions regarding the growth potential of B. cereus s.l. in chilled ready-to-eat and ready-to-cook starchy foods. However, the updated Carlin et al. (2013) μmax–model performed poorly for composite protein-rich foods with Bf – and Af –values of 0.48 and 2.11, respectively. The model should, therefore, not be used for composite starchy foods rich in animal and/or vegetable proteins, pointing to the need for the development of separate predictive models for such products to avoid under-predicting growth rate and creating unsafe situations.
Data availability statement
The original contributions presented in the study are included in the article/Supplementary material, further inquiries can be directed to the corresponding author.
Author contributions
VM-R: Conceptualization, Formal analysis, Investigation, Methodology, Writing – review & editing. RI: Investigation, Writing – review & editing. PD: Supervision, Validation, Writing – review & editing. LT: Supervision, Writing – review & editing. TH: Conceptualization, Formal analysis, Investigation, Methodology, Project administration, Supervision, Visualization, Writing – original draft, Writing – review & editing.
Funding
The author(s) declare that financial support was received for the research and/or publication of this article. The Danish Veterinary and Agricultural Administration supported the present study through the FF4 program.
Acknowledgments
We thank INRA, Avignon, France for providing the RIVM BC120, NVH 0861-00, ADRIA I21 and KBAB4 Bacillus cereus sensu lato isolates used in the work. We also thank the master students Mads Elbo, Aviaja Marie Enoksen and Emil Tonn Stani Albrechtsen for their laboratory assistance with establishing part of the additional growth kinetic responses.
Conflict of interest
The authors declare that the research was conducted in the absence of any commercial or financial relationships that could be construed as a potential conflict of interest.
Generative AI statement
The author(s) declare that no Gen AI was used in the creation of this manuscript.
Publisher’s note
All claims expressed in this article are solely those of the authors and do not necessarily represent those of their affiliated organizations, or those of the publisher, the editors and the reviewers. Any product that may be evaluated in this article, or claim that may be made by its manufacturer, is not guaranteed or endorsed by the publisher.
Supplementary material
The Supplementary material for this article can be found online at: https://www.frontiersin.org/articles/10.3389/fmicb.2025.1531014/full#supplementary-material
References
Augustin, J. -C., and Carlier, V. (2000). Modelling the growth rate of Listeria monocytogenes with a multiplicative type model including interactions between environmental factors. Int. J. Food Microbiol. 56, 53–70. doi: 10.1016/S0168-1605(00)00224
Berthold-Pluta, A., Pluta, A., Garbowska, M., and Stefańska, I. (2019). Prevalence and toxicity characterization of Bacillus cereus in food products from Poland. Food Secur. 8:269. doi: 10.3390/foods8070269
Beuchat, L. R., Clavero, M. R. S., and Jaquette, C. B. (1997). Effects of nisin and temperature on survival, growth, and enterotoxin production characteristics of psychrotrophic Bacillus cereus in beef gravy. Appl. Environ. Microbiol. 63, 1953–1958. doi: 10.1128/aem.63.5.1953-1958.1997
Buss da Silva, N., Baranyi, J., Carciofi, B. A. M., and Ellouze, M. (2017). From culture-medium-based models to applications to food: predicting the growth of B. cereus in reconstituted infant formulae. Front. Microbiol. 8:1799. doi: 10.3389/fmicb.2017.01799
Carlin, F., Albagnac, C., Rida, A., Guinebretière, M.-H., Couvert, O., and Nguyen-the, C. (2013). Variation of cardinal growth parameters and growth limits according to phylogenetic affiliation in the Bacillus cereus group. Consequences for risk assessment. Food Microbiol. 33, 69–76. doi: 10.1016/j.fm.2012.08.014
Carroll, L. M., Cheng, R. A., Wiedmann, M., and Kovac, J. (2022). Keeping up with the Bacillus cereus group: taxonomy through the genomics era and beyond. Crit. Rev. Food Sci. Nutr. 62, 7677–7702. doi: 10.1080/10408398.2021.1916735
Chen, L., Wang, J., Zhang, R., Zhang, H., Qi, X., He, Y., et al. (2022). An 11-year analysis of bacterial foodborne disease outbreaks in Zhejiang Province, China. Foods 11:2382. doi: 10.3390/foods11162382
ComBase. (2023a). Browser. Pizza, Record ID: O281_5. Available online at: https://combase.errc.ars.usda.gov (Accessed February 22, 2023).
ComBase. (2023b). Browser. Pizza, Record ID: O281_6. Available online at: https://combase.errc.ars.usda.gov (Accessed February 22, 2023).
ComBase. (2023c). Browser. Meat lasagna, Record ID: P176_3.Available online at: https://combase.errc.ars.usda.gov (Accessed February 22, 2023).
ComBase. (2023d). Browser. Meat lasagna, Record ID: P176_2. Available online at: https://combase.errc.ars.usda.gov (Accessed February 22, 2023).
ComBase. (2023e). Browser. Cottage pie, Record ID: P175_3. Available online at: https://combase.errc.ars.usda.gov (Accessed February 22, 2023).
ComBase. (2023f). Browser. Cottage pie, Record ID: P175_2. Available online at: https://combase.errc.ars.usda.gov (Accessed February 22, 2023).
ComBase. (2023g). Browser. Vegetable pie, Record ID: P178_3. Available online at: https://combase.errc.ars.usda.gov (Accessed February 22, 2023).
ComBase. (2023h). Browser. Vegetable pie, Record ID: P178_2. Available online at: https://combase.errc.ars.usda.gov (Accessed February 22, 2023).
ComBase. (2023i). Browser. Potato puree, Record ID: Car_69. Available online at: https://combase.errc.ars.usda.gov (Accessed February 22, 2023).
ComBase. (2023j). Browser. Potato puree, Record ID: Car_68. Available online at: https://combase.errc.ars.usda.gov (Accessed February 22, 2023).
ComBase. (2024). Broth models. Growth. Bacillus cereus. Available online at: https://combase.errc.ars.usda.gov (Accessed August 26, 2024).
Daelman, J., Jacxsens, L., Devlieghere, F., and Uyttendaele, M. (2013a). Microbial safety and quality of various types of cooked chilled foods. Food Control 30, 510–517. doi: 10.1016/j.foodcont.2012.07.049
Daelman, J., Jacxsens, L., Lahou, E., Devlieghere, F., and Uyttendaele, M. (2013b). Assessment of the microbial safety and quality of cooked chilled foods and their production process. Int. J. Food Microbiol. 160, 193–200. doi: 10.1016/j.ijfoodmicro.2012.10.010
Daelman, J., Membré, J.-M., Jacxsens, L., Vermeulen, A., Devlieghere, F., and Uyttendaele, M. (2013c). A quantitative microbiological exposure assessment model for Bacillus cereus in REPFEDS. Int. J. Food Microbiol. 166, 433–449. doi: 10.1016/j.ijfoodmicro.2013.08.004
Dalgaard, P., and Mejlholm, O. (2019). “Modeling growth of Listeria and lactic acid bacteria in food environments” in Foodborne bacterial pathogens: methods and protocols, methods in molecular biology. ed. A. Bridier, 247–254. New York, NY: Springer Science+Business Media, LLC
den Besten, H. M. W., Wells-Bennik, M. H. J., and Zwietering, M. H. (2018). Natural diversity in heat resistance of bacteria and bacterial spores: impact on food safety and quality. Annu. Rev. Food Sci. Technol. 9, 383–410. doi: 10.1146/annurev-food-030117-012808
EFSA (2015). Scientific and technical assistance on the evaluation of the temperature to be applied to pre-packed fishery products at retail level. EFSA J. 13:4162. doi: 10.2903/j.efsa.2015.4162
EFSA and ECDC (2023). The European Union one health 2022 zoonoses report. EFSA J. 21:e8442. doi: 10.2903/j.efsa.2023.8442
EFSA and ECDC (2024). The European Union one health 2023 zoonoses report. EFSA J. 22:e9106. doi: 10.2903/j.efsa.2024.9106
EFSA BIOHAZ Panel (2016). Scientific opinion on the risks for public health related to the presence of Bacillus cereus and other Bacillus spp. including Bacillus thuringiensis in foodstuffs. EFSA J. 14:93. doi: 10.2903/j.efsa.2016.4524
Ellouze, M., Da Silva, N. B., Rouzeau-Szynalski, K., Coisne, L., Cantergiani, F., and Baranyi, J. (2021). Modeling Bacillus cereus growth and cereulide formation in cereal-, dairy-, meat-, vegetable-based food and culture medium. Front. Microbiol. 12:639546. doi: 10.3389/fmicb.2021.639546
Fiedoruk, K., Drewnowska, J. M., Daniluk, T., Leszczynska, K., Iwaniuk, P., and Swiecicka, I. (2017). Ribosomal background of the Bacillus cereus group thermotypes. Sci. Rep. 7:46430. doi: 10.1038/srep46430
Frankland, G. C., and Frankland, P. F. (1887). Studies on some new micro-organisms from air. Philos. Trans. R. Soc. Lond. B Biol. Sci. 173, 257–287.
Guinebretière, M.-H., Thompson, F. L., Sorokin, A., Normand, P., Dawyndt, P., Ehling-Schulz, M., et al. (2008). Ecological diversification in the Bacillus cereus group. Environ. Microbiol. 10, 851–865. doi: 10.1111/j.1462-2920.2007.01495.x
Kang, A. K., Kim, Y. W., and Yoon, K. S. (2010). Development of predictive growth models for Staphylococcus aureus and Bacillus cereus on various food matrices consisting of ready-to-eat (RTE) foods. Korean J. Food Sci. Anim. Resour. 30, 730–738. doi: 10.5851/kosfa.2010.30.5.730
Klein, C.Ø. (2019). Isolering og karakterisering af Bacillus cereus gruppen i ready-to-cook retter. [Bachelor of engineering’s thesis]. [Kgs. Lyngby DK]. DTU Fødevareinstituttet.
Koukou, I., Mejlholm, O., and Dalgaard, P. (2021). Cardinal parameter growth and growth boundary model for non-proteolytic Clostridium botulinum – effect of eight environmental factors. Int. J. Food Microbiol. 346:109162. doi: 10.1016/j.ijfoodmicro.2021.109162
Koukou, I., Stergioti, T., la Cour, R., Gkogka, E., and Dalgaard, P. (2022). Clostridium sporogenes as surrogate for proteolytic C. botulinum - development and validation of extensive growth and growth-boundary model. Food Microbiol. 107:104060. doi: 10.1016/j.fm.2022.104060
Le Marc, Y., Baert, L., Buss da Silva, N., Postollec, F., Huchet, V., Baranyi, J., et al. (2021). The effect of pH on the growth rate of Bacillus cereus sensu lato: quantifying strain variability and modelling the combined effects of temperature and pH. Int. J. Food Microbiol. 360:109420. doi: 10.1016/j.ijfoodmicro.2021.109420
Le Marc, Y., Huchet, V., Bourgeois, C. M., Guyonnet, J. P., Mafart, P., and Thuault, D. (2002). Modelling the growth kinetics of Listeria as a function of temperature, pH and organic acid concentration. Int. J. Food Microbiol. 73, 219–237. doi: 10.1016/S0168-1605(01)00640-7
Le Marc, Y., Petton, E., Lochardet, A., Postollec, F., and Huchet, V. (2024). Growth limits of psychrotrophic Bacillus cereus as a function of temperature, pH, water activity, and lactic or acetic acid. Microb. Risk Anal. 27-28:100310. doi: 10.1016/j.mran.2024.100310
Le Marc, Y., Postollec, F., Huchet, V., and Ellouze, M. (2022). Modelling the thermal inactivation of spores from different phylogenetic groups of Bacillus cereus. Int. J. Food Microbiol. 368:109607. doi: 10.1016/j.ijfoodmicro.2022.109607
Luu-Thi, H., Khadka, D. B., and Michiels, C. W. (2014). Thermal inactivation parameters of spores from different phylogenetic groups of Bacillus cereus. Int. J. Food Microbiol. 189, 183–188. doi: 10.1016/j.ijfoodmicro.2014.07.027
Mahakarnchanakul, W., and Beuchat, L. R. (1999). Influence of temperature shifts on survival, growth, and toxin production of psychrotrophic and mesophilic strains of Bacillus cereus in potatoes and chicken gravy. Int. J. Food Microbiol. 47, 179–187. doi: 10.1016/s0168-1605(99)00011-2
Martinez-Rios, V., Gkogka, E., and Dalgaard, P. (2020). Predicting growth of Listeria monocytogenes at dynamic conditions during manufacturing, ripening and storage of cheeses – evaluation and application of models. Food Microbiol. 92:103578. doi: 10.1016/j.fm.2020.103578
Mejlholm, O., and Dalgaard, P. (2009). Development and validation of an extensive growth and growth boundary model for Listeria monocytogenes in lightly preserved and ready-to-eat shrimp. J. Food Prot. 72, 2132–2143. doi: 10.4315/0362-028X-72.10.2132
Mejlholm, O., and Dalgaard, P. (2013). Development and validation of an extensive growth and growth boundary model for psychrotolerant Lactobacillus spp. in seafood and meat products. Int. J. Food Microbiol. 167, 244–260. doi: 10.1016/j.ijfoodmicro.2013.09.013
Mejlholm, O., Gunvig, A., Borggaard, C., Blom-Hanssen, J., Mellefont, L., Ross, T., et al. (2010). Predicting growth rates and growth boundary of Listeria monocytogenes – an international validation study with focus on processed and ready-to-eat meat and seafood. Int. J. Food Microbiol. 141, 137–150. doi: 10.1016/j.ijfoodmicro.2010.04.026
Mellefont, L. A., and Ross, T. (2003). The effect of abrupt shifts in temperature on the lag phase duration of Escherichia coli and Klebsiella oxytoca. Int. J. Food Microbiol. 83, 295–305. doi: 10.1016/S0168-1605(02)00378-1
Ministeriet for Fødevarer, Landbrug og Fiskeri (2013), VEJ nr 9066 af 21/02/2013 Vejledning om holdbarhedsvurdering af fødevarer for Listeria monocytogenes. Fødevaremin., Fødevarestyrelsen, j.nr.2012-28-2301-01142.
Morita, T. N., and Woodburn, M. J. (1977). Stimulation of Bacillus cereus growth by protein in cooked rice combinations. J. Food Sci. 42, 1232–1235. doi: 10.1111/j.1365-2621.1977.tb14468.x
Osimani, A., Aquilanti, L., and Clementi, F. (2018). Bacillus cereus foodborne outbreaks in mass catering. Int. J. Hosp. Manag. 72, 145–153. doi: 10.1016/j.ijhm.2018.01.013
Rahnama, H., Azari, R., Yousefi, M. H., Berizi, E., Mazloomi, S. M., Hosseinzadeh, S., et al. (2022). A systematic review and meta-analysis of the prevalence of Bacillus cereus in foods. Food Control 143:109250. doi: 10.1016/j.foodcont.2022.109250
Resnik, S. L., and Chirife, J. (1988). Proposed theoretical water activity values at various temperatures for selected solutions to be used as reference sources in the range of microbial growth. J. Food Prot. 51, 419–423. doi: 10.4315/0362-028X-51.5.419
Rosenquist, H., Smidt, L., Andersen, S. R., Jensen, G. B., and Wilcks, A. (2005). Occurrence and significance of Bacillus cereus and Bacillus thuringiensis in ready-to-eat food. FEMS Microbiol. Lett. 250, 129–136. doi: 10.1016/j.femsle.2005.06.054
Ross, T. (1999). Predictive food microbiology models in the meat industry. North Sydney: Meat and Livestock Australia.
Ross, T., and Dalgaard, P. (2004). “Secondary models” in Modeling microbial responses in food. eds. R. C. McKellar and X. Lu (Boca Raton, FL: CRC Press), 63–150.
Rosso, L., Bajard, S., Flandrois, J. P., Lahellec, C., Fournaud, J., and Veit, P. (1996). Differential growth of Listeria monocytogenes at 4 and 8 °C: consequences for the shelf life of chilled products. J. Food Prot. 59, 944–949. doi: 10.4315/0362-028X-59.9.944
Samadi, T. (2020). Isolering og karakterisereing af Bacillus cereus gruppen i ris. [Bachelor of engineering’s thesis]. [Kgs. Lyngby DK]. DTU Fødevareinstituttet.
Samapundo, S., Heyndrickx, M., Xhaferi, R., and Devlieghere, F. (2011). Incidence, diversity and toxin gene characteristics of Bacillus cereus group strains isolated from food products marketed in Belgium. Int. J. Food Microbiol. 150, 34–41. doi: 10.1016/j.ijfoodmicro.2011.07.013
Sutherland, J. P., Aherne, A., and Beaumont, A. L. (1996). Preparation and validation of a growth model for Bacillus cereus: the effects of temperature, pH, sodium chloride and carbon dioxide. Int. J. Food Microbiol. 30, 359–372. doi: 10.1016/0168-1605(96)00962-2
Thorsen, L., Budde, B. B., Koch, A. G., and Klingberg, T. D. (2009). Effect of modified atmosphere and temperature abuse on the growth from spores and cereulide production of Bacillus weihenstephanensis in cooked chilled meat sausage. Int. J. Food Microbiol. 130, 172–178. doi: 10.1016/j.ijfoodmicro.2009.01.009
Tirloni, E., Bernardi, C., Ghelardi, E., Celandroni, F., Cattaneo, P., and Stella, S. (2019). Bacillus cereus in fried rice meal: natural occurrence, strain dependent growth and haemolysin (HBL) production. LWT 114:108393. doi: 10.1016/j.lwt.2019.108393
Turner, N. J., Whyte, R., Hudson, J. A., and Kaltovei, S. L. (2006). Presence and growth of Bacillus cereus in dehydrated potato flakes and hot-held, ready-to-eat potato products purchased in New Zealand. J. Food Prot. 69, 1173–1177. doi: 10.4315/0362-028x-69.5.1173
Ultee, A., Slump, R. A., Steging, G., and Smid, E. J. (2000). Antimicrobial activity of carvacrol toward Bacillus cereus on rice. J. Food Prot. 63, 620–624. doi: 10.4315/0362-028x-63.5.620
Vos, P., Garrity, G., Jones, D., Krieg, N. R., Ludwig, W., Rainey, F. A., et al. (2011). Bergey’s manual of systematic bacteriology, volume 3: the firmicutes. 2nd Edn. New York, NY: Springer.
Webb, M. D., Barker, G. B., Goodburn, K. E., and Peck, M. W. (2019). Risk presented to minimally processed chilled foods by psychrotrophic Bacillus cereus. Trends Food Sci. Technol. 93, 94–105. doi: 10.1016/j.tifs.2019.08.024
Yu, S., Yu, P., Wang, J., Li, C., Guo, H., Liu, C., et al. (2020). A study on prevalence and characterization of Bacillus cereus in ready-to-eat foods in China. Front. Microbiol. 10:3043. doi: 10.3389/fmicb.2019.03043
Keywords: extended shelf life, food safety, panC groups, ready-to-eat, spore-formers, chilled storage, ready-to-cook
Citation: Martinez-Rios V, Idrizi R, Dalgaard P, Truelstrup Hansen L and Hansen TB (2025) Modeling and predicting growth and growth boundary of Bacillus cereus s.l. from phylogroups II, IV, V, and VI in starchy foods at or below 12°C. Front. Microbiol. 16:1531014. doi: 10.3389/fmicb.2025.1531014
Edited by:
Solveig Langsrud, Norwegian Institute of Food, Fisheries and Aquaculture Research (Nofima), NorwayReviewed by:
Zhen Jia, Auburn University, United StatesMasja Nierop Groot, Wageningen University and Research, Netherlands
Copyright © 2025 Martinez-Rios, Idrizi, Dalgaard, Truelstrup Hansen and Hansen. This is an open-access article distributed under the terms of the Creative Commons Attribution License (CC BY). The use, distribution or reproduction in other forums is permitted, provided the original author(s) and the copyright owner(s) are credited and that the original publication in this journal is cited, in accordance with accepted academic practice. No use, distribution or reproduction is permitted which does not comply with these terms.
*Correspondence: Tina Beck Hansen, dGliaGFAZm9vZC5kdHUuZGs=
†Present address: Veronica Martinez-Rios, R&D Health & Wellness, ADM, Paterna, Spain