 Jingru Zhang1,2†
 Shengyuan Wen
 Ziling Liu
- 1The Clinical Laboratory of Baotou Central Hospital, Baotou, China
- 2Baotou Medicine College, Inner Mongolia University of Science and Technology, Baotou, China
Urinary Tract Infections (UTIs) remain a significant global health concern, with the pathogen spectrum and antibiotic resistance patterns critically influencing clinical management. This study aimed to analyze the microbial profile of UTIs from 2022 to 2024, focusing on Escherichia coli (E. coli), the predominant pathogen, by evaluating its antibiotic resistance phenotypes, biofilm formation capability, and mutations in GyrA, ParC and Plasmid-Mediated Quinolone Resistance (PMQR) genes prevalence. Midstream urine samples from UTI patients were collected and analyzed for microbial identification. E. coli isolates were tested for antibiotic susceptibility, particularly to levofloxacin, the most frequently used antibiotic in our hospital. Biofilm formation was assessed, and mutations in GyrA, ParC and PMQR genes were sequenced to determine resistance mechanisms.The pathogen spectrum revealed that Enterobacteriaceae were the most prevalent (44.42%), with E. coli being the dominant species. Over 70% of E. coli isolates exhibited resistance to levofloxacin, and 58.97% (46/78) demonstrated biofilm-forming ability. Among levofloxacin-resistant strains, 75.64% (59/78) showed high-level resistance (MIC ≥ 8μg/mL). The most common mutations in GyrA were Ser83Leu (89.74%) and Asp87Asn (71.79%), while Ser80Ile (74.36%) was predominant in ParC. PMQR genes were detected in 17.95% (14/78) of isolates. The elevated prevalence of quinolone-resistant E. coli in urinary tract infections within this region, combined with intricate resistance gene mutations and generally strong biofilm-forming capabilities, underscores the critical necessity for rational antibiotic stewardship.
1 Introduction
Urinary Tract Infections (UTIs) are among the most prevalent bacterial infections globally, affecting millions of individuals annually and imposing a substantial burden on healthcare systems (Ioana et al., 2022). Despite advancements in medical science, the incidence of UTIs remains alarmingly high, particularly due to the emergence of multidrug-resistant pathogens. Escherichia coli (E. coli) is the predominant causative agent of UTIs, commonly referred to as Uropathogenic Escherichia coli (UPEC), accounting for approximately 70-95% of community-acquired and 50% of hospital-acquired cases. However, the increasing prevalence of antibiotic resistance, particularly to fluoroquinolones, has significantly complicated the clinical management of these infections. The widespread and often indiscriminate use of antibiotics, such as levofloxacin, has led to the development of resistance mechanisms in E. coli. These mechanisms include mutations in the Quinolone Resistance-Determining Region (QRDR) genes like GyrA and ParC, as well as the acquisition of PMQR (Hu et al., 2025). Additionally, the ability of E. coli to form biofilms further exacerbates its resistance to antibiotics, as biofilms provide a protective barrier against antimicrobial agents and host immune responses.
Understanding the microbial profile of UTIs and the resistance patterns of predominant pathogens is crucial for guiding empirical antibiotic therapy and improving patient outcomes. In this study, we aimed to analyze the microbial spectrum of UTIs in our region from 2022 to 2024, with a particular focus on E. coli. We evaluated its antibiotic resistance phenotypes, biofilm-forming capability, and mutations in key quinolone resistance genes. Our findings highlight the urgent need for rational antibiotic use and the implementation of effective infection control measures to combat the growing threat of antibiotic-resistant UTIs.
This study contributes to the existing scope of knowledge by providing detailed insights into the resistance mechanisms in fluoroquinolones of E. coli in UTIs, emphasizing the interplay between biofilm formation, genetic mutations, and antibiotic resistance. The results underscore the importance of antimicrobial stewardship and the development of novel therapeutic strategies to address the challenges posed by resistant pathogens.
2 Methods
The entire experimental process is illustrated in Figure 1, which provides a detailed visual representation of the key steps involved in the study.
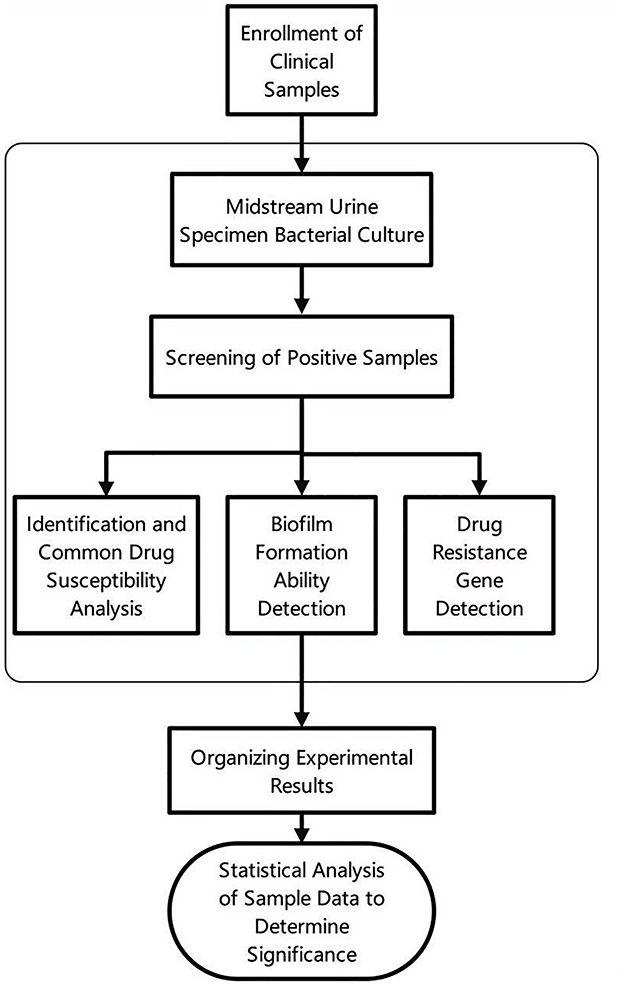
Figure 1. The flowchart of the experimental procedure.
2.1 Bacterial strain collection
This study screened nine thousand three hundred and twelve patients diagnosed with Urinary Tract Infections (UTIs) at Baotou Central Hospital from 2022 to 2024. A urinary tract infection is defined as an inflammatory condition caused by pathogenic microorganisms invading the urinary system, including the kidneys, ureters, bladder, and urethra. Depending on the site of infection, UTIs can be classified as upper urinary tract infections or lower urinary tract infections. The inclusion criteria for patients were as follows: Clinical diagnosis of UTI accompanied by typical symptoms. Positive midstream urine culture results with a bacterial colony count of ≥107 CFU/L (Bilsen et al., 2024; Chan et al., 2025). Exclusion of patients with non-infectious urinary tract diseases or contaminated samples. Midstream urine specimens were collected from eligible patients for pathogen isolation and identification. All samples were processed in accordance with hospital infection control standards and laboratory protocols to ensure data accuracy and reliability.
2.2 Bacterial identification and antimicrobial susceptibility testing
The midstream urine specimens collected from patients were cultured on sheep blood agar plates under standard laboratory conditions. Specimens with a bacterial colony count of ≥107 CFU/L after incubation were selected for further analysis. Pure bacterial colonies were obtained through sub culturing and streaking techniques to ensure isolate purity.
For bacterial identification and antimicrobial susceptibility testing using the Clinical and Laboratory Standards Institute (CLSI, 2021) guidelines, the pure cultures were processed using the automated microbial identification and susceptibility analysis system (BD Phoenix™, Becton Dickinson, U.S.A.). This system employs advanced biochemical and enzymatic assays to accurately identify bacterial species and determine their susceptibility profiles to a panel of antibiotics.
2.3 Drug resistance gene amplification and sequencing
The Polymerase Chain Reaction (PCR) was employed to amplify quinolone resistance-related genes, including the QRDR genes (GyrA, ParC) and PMQR genes (qnrA, qnrB, qnrD, qnrS, qepA, aac(6′)-Ib-cr), using polymerase chain reaction (PCR) (Josefina et al., 2025; Wajeeorn et al., 2025). The primer sequences and their corresponding annealing temperatures are presented in Table 1. After the PCR products were subjected to agarose gel electrophoresis, the gel imaging system was used to observe whether the target bands were successfully amplified. Following the amplification of QRDR genes, sequencing was performed to identify specific resistance mutation sites. MEGA7 software was used to align the corresponding sequences of the sequenced sequences with those of E. coli standard strain (K12), and the mutation sites of nucleotides and amino acids were analyzed.
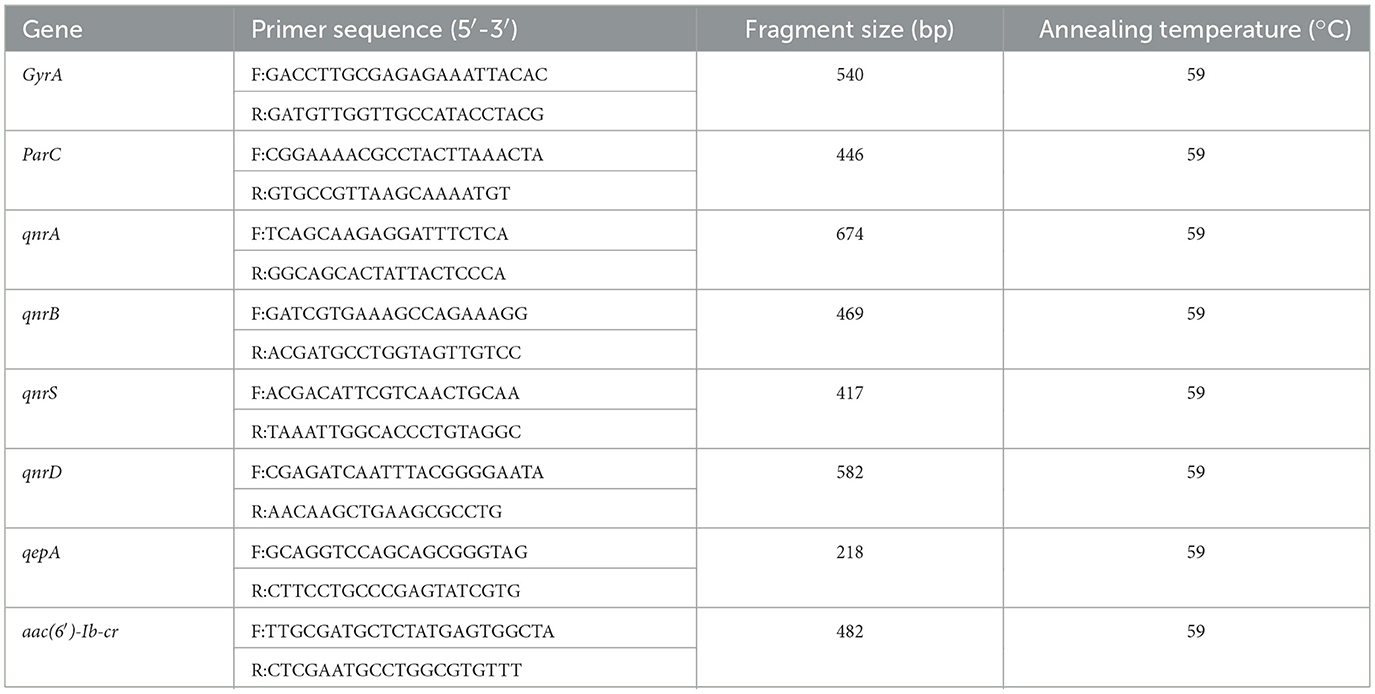
Table 1. Antibiotic resistance genes and its corresponding primer sequence.
2.4 Quantitative assessment of E. coli biofilm formation
The crystal violet staining method was employed to quantitatively assess biofilm formation according to the detection methods previously established. The 96-well plate was incubated at 35 °C for 72 h to observe bacterial growth. Negative control wells contained uninoculated sterile broth only. The absorbance of each well was measured at a wavelength of 570 nm using a microplate reader. The biofilm-forming ability was determined based on the absorbance values (OD) as follows:non-adherent (OD ≤ ODC), weakly adherent (ODC < OD ≤ 2 × ODC), moderately adherent (2 × ODC < OD ≤ 4 × ODC), strongly adherent (OD>4 × ODC) (Ratajczak et al., 2021). Here, ODC is defined as three times the standard deviation of the average absorbance of the three negative control wells, and OD represents the average absorbance of each bacterial strain.
2.5 MIC determination of levofloxacin against UPEC
The MIC (Minimum Inhibitory Concentration) of levofloxacin, a commonly used quinolone antibiotic for UPEC treatment in the region, was determined for 78 randomly selected UPEC strains. The broth microdilution method was employed to prepare a series of drug concentrations: 1024, 512, 256, 128, 64, 32, 16, 8, and 4 μg/mL. The standard MIC detection protocol (CLSI, 2012) was conducted to obtain the MIC value for each strain. The high-level resistance threshold of UPEC to levofloxacin is defined as ≥8 μg/mL.
2.6 Analysis of statistical data
Statistical analysis was performed using SPSS 26.0. The categorical data were presented as frequencies or percentages. Venn diagrams were employed to analyze the correlation between drug-resistant strains and the presence of related drug-resistant genes and gene mutations. The linear correlation between biofilm-forming ability and MIC was assessed using Pearson's correlation coefficient; the association between biofilm-forming ability and mutation count was analyzed via Spearman's rank correlation.
3 Results
3.1 Microbial spectrum of urinary tract infections
The midstream urine specimens from nine thousand three hundred and twelve patients with urinary tract infections were cultured and identified, revealing the following results: the proportion of Enterobacteriaceae infections was 44.42%, followed by fungal infections at 28.22%. The infection rates of non-fermentative bacteria, Staphylococcus spp., and Enterococcus spp. were 15.80%, 6.18%, and 5.38%, respectively. Among Enterobacteriaceae infections, E. coli accounted for the highest proportion at 19.35%, followed by Klebsiella pneumoniae at 17.96%, while Proteus mirabilis and Enterobacter cloacae accounted for 4.88% and 2.23%, respectively (see Figure 2). From the above, it can be concluded that E. coli is the primary pathogen in urinary tract infections.
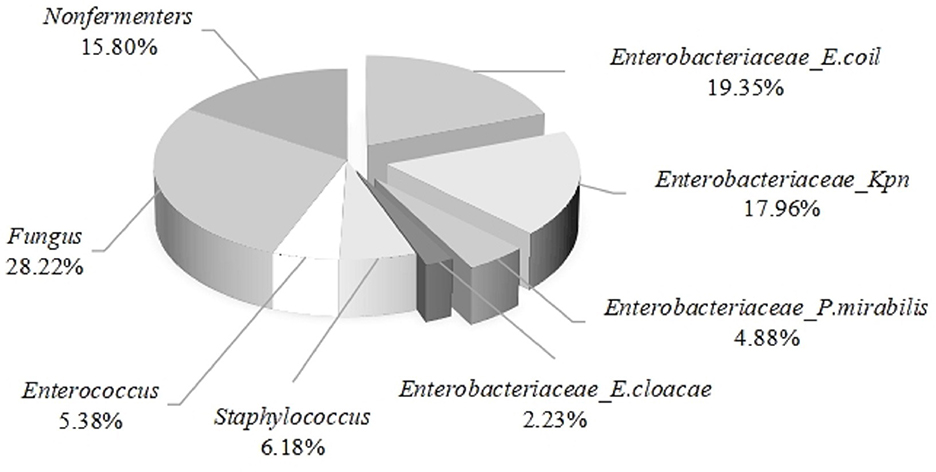
Figure 2. Distribution of 9312 strains of Uropathogens during 2022–2024.
3.2 The antimicrobial susceptibility results of common antibiotics against UPEC
The analysis of the antimicrobial susceptibility results of 1,802 UPEC to commonly used antibiotics revealed that carbapenems (imipenem, meropenem) and aminoglycoside antibiotics (amikacin) exhibited low resistance rates. In contrast, penicillin antibiotics (ampicillin, piperacillin) demonstrated the highest resistance rates, exceeding 80%. As for quinolone antibiotics, which are the most frequently used drugs in this region, their resistance rates have surpassed 70% see Table 2.
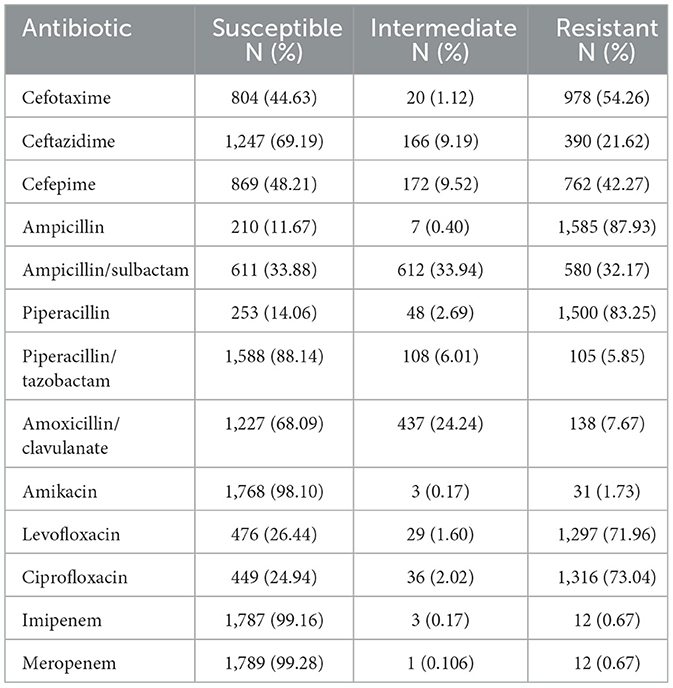
Table 2. Antimicrobial susceptibility of 1,802 UPEC strains to antibiotics.
3.3 Detection and analysis of quinolone-related resistance genes
A total of seventy eight strains were randomly selected from 1,802 UPEC isolates for the detection and analysis of resistance genes. The study focused on two key genetic determinants: the QRDR genes, specifically GyrA and ParC, as well as PMQR genes, including qnrA, qnrB, qnrD, qnrS, qepA, and aac (6′)-Ib-cr.
3.3.1 GyrA and ParC mutation sites
The amino acid sequence analysis of the GyrA and ParC mutation resistance genes in 78 UPEC strains isolated from urine as shown in Table 3. The GyrA gene exhibited a total of ten significant mutations, with the highest frequency observed at Ser83 (72 cases, 92.31%), followed by Asp87 (53 cases, 71.79%). Among the seventy eight UPEC strains, seventy three (93.59%) harbored mutations in the GyrA gene locus, including thirteen single mutations, fifty seven double mutations, two triple mutations, and one quintuple mutation. In the ParC gene, among the seventy eight isolates analyzed, 4 sense mutations were detected in fifty nine strains (75.64%). Of these mutated strains, 50 exhibited single mutations while nine displayed double mutations. Notably, all mutated isolates contained the Ser80Ile mutation.
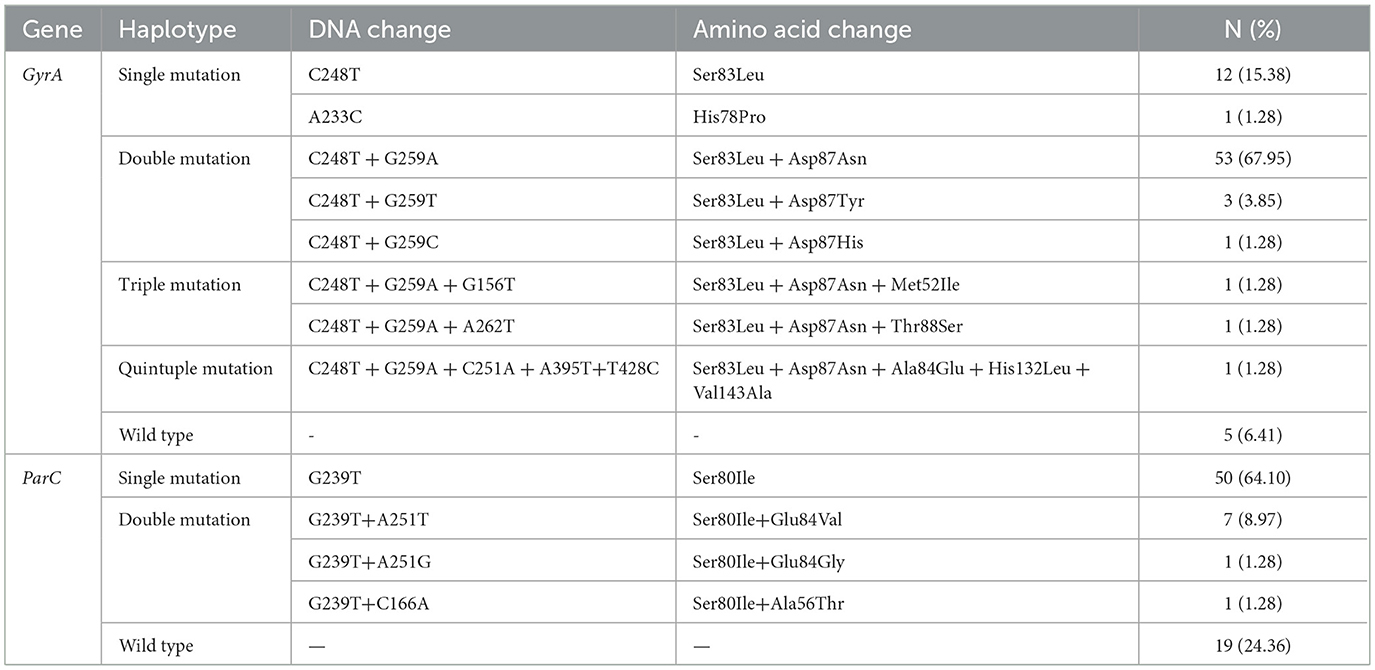
Table 3. DNA and amino acid change of GyrA and ParC mutation.
3.3.2 Analysis of PMQR gene distribution
Among the seventy eight UPEC strains analyzed, fifteen (19.23%) were found to carry PMQR genes. The distribution of these genes was as follows: qnrS was detected in seven strains (8.97%), qnrB was identified in four strains (5.13%), qepA was present in 4 strains (5.13%), and qnrD was observed in four strains (5.13%). Notably, aac(6′)-Ib-cr and qnrA were not detected in any of the tested strains. The detailed distribution of PMQR genes are presented in Table 4.
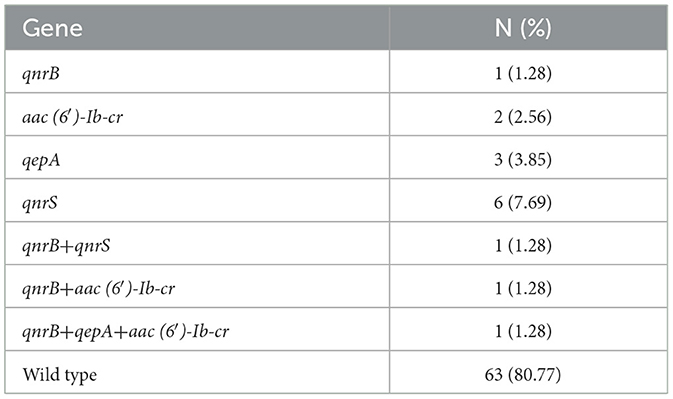
Table 4. Distribution of PMQR genes among E. coli isolates.
3.4 Biofilm formation ability of UPEC
Seventy eight UPEC strains were cultured in ninety six-well plates, and their biofilm formation ability was assessed using the crystal violet staining method. The results revealed that 46 strains (58.97%) were capable of forming biofilms. among these: 35 (44.87%) strains exhibited moderate biofilm formation, 11 (14.10%) strains demonstrated strong biofilm formation.
3.5 MIC of levofloxacin against UPEC
Among the seventy eight UPEC strains, nineteen strains (24.36%) exhibited a MIC value of ≤ 4 μg/mL indicating they were sensitive to levofloxacin. In contrast, fifty nine strains (75.64%) were resistant to levofloxacin. The distribution of MIC values (see Figure 3).
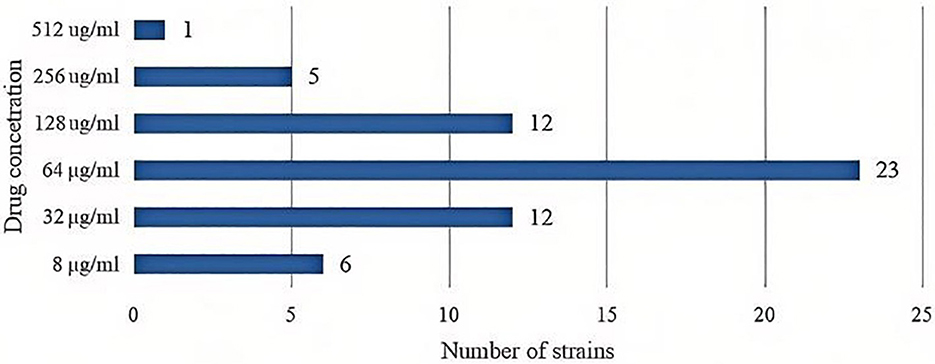
Figure 3. The distribution of MIC values of levofloxacin for UPEC strains.
3.6 Association analysis of GyrA mutants, ParC mutants, PMQR carriers, and phenotypic resistant strains (PRS)
Figure 4 illustrates that out of seventy eight E. coli strains, fifty nine (75.64%) exhibited phenotypic resistance to fluoroquinolones (FQs), seventy three (93.59%) were found to possess GyrA mutations, fifty nine (75.64%) had ParC mutations, and fifteen (19.23%) had the PMQR gene. In the PRS, GyrA mutation was present in all cases, with fifty nine strains exhibiting GyrA mutation, eighteen (30.51%)cases without ParC mutation, and 46 (77.97%) cases not harboring PMQR. Significantly, thirteen strains with mutations in both GyrA and ParC exhibited no fluoroquinolone resistance.
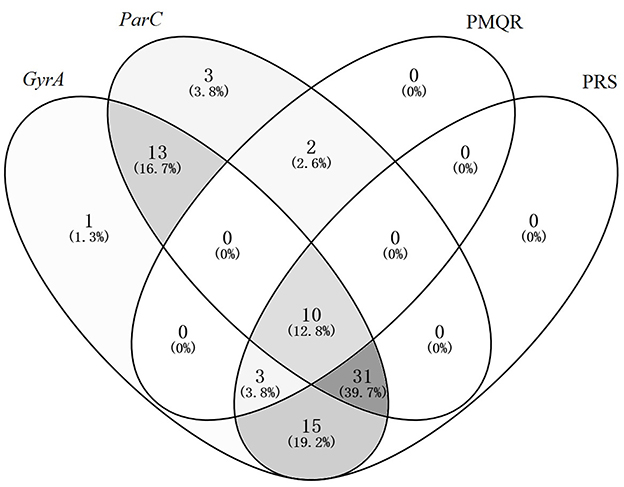
Figure 4. Venn diagram analysis of GyrA Mutants, ParC mutants, PMQR carriers, and phenotypic resistant strains.
3.7 Molecular markers of high-level quinolone-resistance
The definition of high-level levofloxacin-resistance (HLQR) is MIC≥8μg/ml. analysis of the relationship between gene mutation sites and quinolone resistance revealed that ser83leu and asp87asn are common mutation sites in the GyrA gene and are closely related to quinolone resistance. as shown in Table 5: the ser83leu mutation site has high sensitivity (100%) but low specificity (42%) for resistance, while asp87asn has high sensitivity (92%) and high specificity (89%). simultaneous detection of ser83leu and asp87asn can effectively predict the resistance of clinical UPEC strains to quinolone antibiotics, thereby guiding clinical medication.
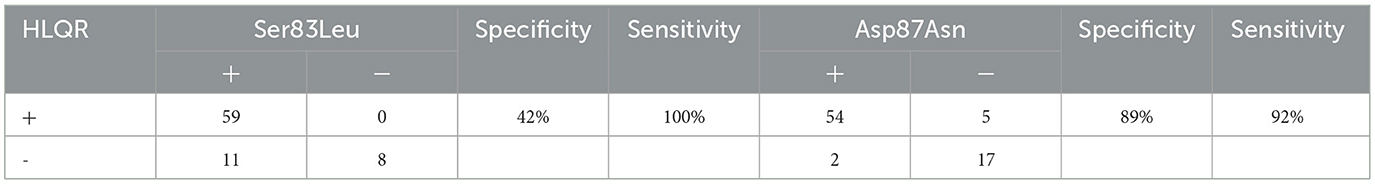
Table 5. The sensitivity and specificity of Ser83Leu and Asp87Asn in predicting HLQR.
4 Discussion
E. coli remains the predominant pathogen associated with urinary tract infections (UTIs), as evidenced by the analysis of urine samples collected from patients at Baotou Central Hospital between 2022 and 2024. In this study, E. coli accounted for 19.35% of the identified uropathogens, highlighting its significant role in UTIs. However, the increasing prevalence of antibiotic resistance, particularly to fluoroquinolones, poses a substantial challenge to the effective management of these infections. The resistance rate to fluoroquinolones observed in this study (75.64%) significantly exceeds the national average(56.70%) (Fu et al., 2024), underscoring the urgency of addressing this issue in Inner Mongolia.
The mechanisms underlying fluoroquinolone resistance in E. coli are multifaceted. Primarily, resistance arises from mutations in the QRDR genes encoding DNA gyrase (GyrA and GyrB) and topoisomerase IV (ParC and ParE). Mutations in these genes, particularly at amino acid residues 67-106 in GyrA (with a notable hotspot at position 83) and residues 63-102 in ParC, disrupt the binding of fluoroquinolones to their target enzymes, thereby conferring resistance. Our findings align with previous studies, demonstrating that GyrA mutations are the primary drivers of resistance, while ParC mutations play a secondary role. Specifically, we identified significant mutations at Ser83 and Asp87 in GyrA and Ser80 and Glu84 in ParC, consistent with established literature (Yonezawa et al., 1995; Zhang et al., 2018; András et al., 2024; Sepideh et al., 2024). It is noteworthy that several rarely reported mutations in GyrA were identified in the present study: Met52Ile, Ala84Glu, His132Leu, Val143Ala, and Thr88Ser. These mutations may have potential implications for protein structure and function, warranting further investigation to elucidate their biological significance.
Moreover, this study revealed a complex mutation profile in GyrA, with ten distinct mutations observed across 1-5 mutation types, surpassing previous reports. The frequent co-occurrence of GyrA and ParC mutations further suggests that the accumulation of multiple mutations contributes to the elevated fluoroquinolone resistance observed in this region. Notably, all fluoroquinolone-resistant strains harbored GyrA mutations, whereas ParC mutations were not universally present, reinforcing the notion that ParC mutations alone cannot independently confer resistance but rather enhance resistance when combined with GyrA mutations.
In addition to chromosomal mutations, PMQR genes also contribute to fluoroquinolone resistance (Rehaiem et al., 2024; Samira et al., 2024). Our study detected PMQR genes, including qepA, qnrS, qnrB, and aac (6′)-Ib-cr, with qnrS exhibiting the highest detection rate. While the presence of these genes does not directly correlate with high-level resistance, they may expand the Mutation Selection Window (MSW), facilitating the emergence of chromosomal mutations under sustained antimicrobial pressure. This finding is consistent with prior research, which has documented the co-occurrence of multiple PMQR genes in resistant strains (Abimbola Olumide et al., 2022; Nabi et al., 2022; Nazek et al., 2024; Yujin et al., 2024).
The ability of E. coli to form biofilms further complicates its resistance profile. In this study, 58.97% of the tested strains demonstrated biofilm-forming capabilities, with 44.87% exhibiting moderate biofilm formation and 14.10% showing strong biofilm formation. Biofilms provide a protective barrier against antimicrobial agents and host immune responses (Sarah et al., 2024), thereby enhancing bacterial survival and resistance. This analytical result indicates that, under the experimental conditions of this study, there is no statistically significant (P > 0.05) correlation between biofilm formation capacity and bacterial resistance levels (as measured by MIC values) or the number of resistance gene mutations. This finding suggests that biofilm formation may be regulated by other independent factors, such as environmental conditions, bacterial metabolic states, or specific gene regulatory networks. This outcome provides new perspectives for a deeper understanding of the complex relationship between biofilm formation and antimicrobial resistance, while also guiding the direction of future research.
5 Conclusion
This study highlights the critical role of GyrA mutations in fluoroquinolone resistance, the synergistic effect of GyrA and ParC mutations, and the contribution of PMQR genes and biofilm formation to the resistance landscape of E. coli. These findings underscore the need for rational antibiotic use, enhanced resistance monitoring, and the development of novel therapeutic strategies to combat the growing threat of antibiotic-resistant UTIs.
6 Limitation
In this study, only seventy eight UPEC strains were randomly selected for quinolone resistance gene detection from 1,802 total isolates; this relatively small sample size may introduce sampling bias and reduce statistical power for validating associations between specific gene mutations and resistance phenotypes.
Data availability statement
The original contributions presented in the study are included in the article/supplementary material, further inquiries can be directed to the corresponding author.
Ethics statement
The studies involving humans were approved by Ethics Committee of Baotou Central Hospital. The studies were conducted in accordance with the local legislation and institutional requirements. Written informed consent for participation in this study was provided by the participants' legal guardians/next of kin.
Author contributions
ZL: Data curation, Funding acquisition, Writing – review & editing, Validation, Project administration, Resources, Writing – original draft, Supervision, Methodology, Formal analysis, Conceptualization, Investigation. SW: Formal analysis, Writing – review & editing, Methodology, Validation. JZ: Data curation, Project administration, Writing – review & editing, Supervision, Methodology, Investigation, Formal analysis. LC: Writing – review & editing, Formal analysis, Resources. JQ: Writing – review & editing, Investigation, Data curation, Methodology.
Funding
The author(s) declare that financial support was received for the research and/or publication of this article. This work was supported by Inner Mongolia Natural Science Foundation (2021BS08018).
Conflict of interest
The authors declare that the research was conducted in the absence of any commercial or financial relationships that could be construed as a potential conflict of interest.
Generative AI statement
The author(s) declare that no Gen AI was used in the creation of this manuscript.
Any alternative text (alt text) provided alongside figures in this article has been generated by Frontiers with the support of artificial intelligence and reasonable efforts have been made to ensure accuracy, including review by the authors wherever possible. If you identify any issues, please contact us.
Publisher's note
All claims expressed in this article are solely those of the authors and do not necessarily represent those of their affiliated organizations, or those of the publisher, the editors and the reviewers. Any product that may be evaluated in this article, or claim that may be made by its manufacturer, is not guaranteed or endorsed by the publisher.
References
Abimbola Olumide, A., Olabisi Comfort, A., and Adedolapo Victoria, O. (2022). High carriage of plasmid-mediated quinolone resistance (PMQR) genes by cefotaxime-resistant Escherichia coli recovered from surface-leaking sanitary sewers. Arch. Microbiol. 204:131. doi: 10.1007/s00203-021-02627-6
András, K., Katalin, K., Dóra, S., and Béla, K. (2024). Analysis of molecular mechanisms of delafloxacin resistance in Escherichia coli. Sci. Rep. 14:26423. doi: 10.1038/s41598-024-78124-9
Bilsen, M. P., Conroy, S. P., Schneeberger, C., Platteel, T. N., van Nieuwkoop, C., Mody, L., et al. (2024). A reference standard for urinary tract infection research: a multidisciplinary Delphi consensus study. Lancet. Infect. Dis. 24, e513–e521. doi: 10.1016/S1473-3099(23)00778-8
Chan, C., Gregson, D., Wildman, S., Bihan, D., Groves, R., Aburashed, R., et al. (2025). Metabolomics strategy for diagnosing urinary tract infections. Nat. Commun. 16:2658. doi: 10.1038/s41467-025-57765-y
CLSI (2012). Methods for Dilution Antimicrobial Susceptibility Tests f or Bacteria That Grow Aerobically; Approved Standard–Ninth Edition. CLSI document M07-A9. Wayne, PA: Clinical and Laboratory Standards Institute.
CLSI (2021). Performance Standards for Antimicrobial Susceptibility Testing, 31st Edn. CLSI supplement M100. Clinical and Laboratory Standards Institute.
Fu, Y., Zhao, F., Lin, J., Li, P., and Yu, Y. (2024). Antibiotic susceptibility patterns and trends of the gram-negative bacteria isolated from the patients in the emergency departments in China: results of SMART 2016-2019. BMC Infect. Dis. 24:501. doi: 10.1186/s12879-024-09294-0
Hu, X., Tao, J., Yan, L., Hong, W., Wang, W., Wang, L., et al. (2025). Molecular epidemiology of Escherichia coli in bloodstream infections from a general hospital in Ningxia, China, 2022-2023. BMC Infect. Dis. 25:293. doi: 10.1186/s12879-025-10658-3
Ioana, D. O., Mutsawashe, C., Shunmay, Y., Prosper, C., Kudzai, P. E., Ferrand, R. A., et al. (2022). Clinical and bacteriological outcomes in patients with urinary tract infections presenting to primary care in Harare, Zimbabwe: a cohort study. Wellcome Open Res 6:135. doi: 10.12688/wellcomeopenres.16789.2
Josefina, D.-B., Juan, T.-S., Ana María, G.-V., and Humberto, B.-C. (2025). Detection of O25b-ST131 clone in extended spectrum beta-lactamase-producing E. coli from urinary tract infections in Mexico. J. Infect. Dev. Ctries 18:18854. doi: 10.3855/jidc.18854
Nabi, J., Morteza, S., Khadijeh, A., and Golshan, Z. (2022). The prevalence of plasmid-mediated quinolone resistance genes among Escherichia coli strains isolated from urinary tract infections in southwest Iran. Mol. Biol. Rep. 49, 3753-3763. doi: 10.1007/s11033-022-07215-5
Nazek, A.-G., Mohamed-Elamen, F., Khadijah, A. A., Yasmin, A., and Ridha Ben, A. (2024). Pathovars, occurrence, and characterization of plasmid-mediated quinolone resistance in diarrheal Escherichia coli isolated from farmers and farmed chickens in Tunisia and Nigeria. Lett. Appl. Microbiol. 77:ovae043. doi: 10.1093/lambio/ovae043
Ratajczak, M., Kamińska, D., Nowak-Malczewska, D., Schneider, A., and Dlugaszewska, J. (2021). Pseudomonas aeruginosaRelationship between antibiotic resistance, biofilm formation, genes coding virulence factors and source of origin of clinical strains. Ann. Agricult. Environ. Med. AAEM 28, 306–313. doi: 10.26444/aaem/122682
Rehaiem, A., Bouzouita, A., Ferjani, S., Saadi, A., Zrelli, M., Kanzari, L., et al. (2024). Molecular mechanisms impact on fluoroquinolone resistance among E.coli from enteric carriage monitoring before prostate biopsy and earliest description of qnrB81. Sci. Rep. 14:29324. doi: 10.1038/s41598-024-77844-2
Samira, A., Mina, O., Mohsen, R., Meysam, O., Hossein, K., and Hamidreza, H. (2024). Prevalence of plasmid-mediated quinolone resistance genes in Escherichia coli isolates from colonic biopsies of iranian patients with inflammatory bowel diseases: a cross-sectional study. Health Sci. Rep. 7:e70204. doi: 10.1002/hsr2.70204
Sarah, A. N., Aude, A. F., Pedro Henrique, I., Nathalie, A., Camille, M., Maina, V., et al. (2024). Development of an in vitro biofilm model for the study of the impact of fluoroquinolones on sewer biofilm microbiota. Front. Microbiol. 15:1377047. doi: 10.3389/fmicb.2024.1377047
Sepideh, R., Saeed, T., Behrouz, N., and Forough, Y. (2024). Investigation of gyrA and parC mutations and the prevalence of plasmid-mediated quinolone resistance genes in Klebsiella pneumoniae clinical isolates. BMC Microbiol. 24:265. doi: 10.1186/s12866-024-03383-5
Wajeeorn, O., Anusak, K., Hien, V. D., Chanagun, C., Kiatichai, F., Aroonlug, L., et al. (2025). Predomination of hypervirulent ST283 and genetic diversity of levofloxacin resistance in multidrug-resistant, hypervirulent Streptococcus agalactiae in Thailand. J. Med. Microbiol. 74:001970. doi: 10.1099/jmm.0.001970
Yonezawa, M., Takahata, M., Matsubara, N., Watanabe, Y., and Narita, H. (1995). DNA gyrase gyrA mutations in quinolone-resistant clinical isolates of Pseudomonas aeruginosa. Antimicrob. Agents Chemother. 39, 1970–1972. doi: 10.1128/AAC.39.9.1970
Yujin, W., Dewei, S., Zhengzhong, X., Xin'an, J., and Xiang, C. (2024). Mobile colistin resistance and plasmid-mediated quinolone resistance genes in Escherichia coli from China, 1993-2019. Foodborne Pathog. Dis. 21:0158. doi: 10.1089/fpd.2023.0158
Keywords: urinary tract infections, Escherichia coli, antibiotic resistance, quinolone resistance genes, levofloxacin
Citation: Zhang J, Wen S, Chen L, Qin J and Liu Z (2025) Analysis of the microbial spectrum of urinary tract infections and antibiotic resistance of UPEC in Central Inner Mongolia, China. Front. Microbiol. 16:1599902. doi: 10.3389/fmicb.2025.1599902
Received: 27 March 2025; Accepted: 02 September 2025;
Published: 24 September 2025.
Edited by:
Takashi Azuma, Osaka Medical College, JapanReviewed by:
Amit Ranjan, Columbia University, United StatesDaniela Talapan, The National Institute of Infectious Diseases prof.dr Matei Bals, Romania
Copyright © 2025 Zhang, Wen, Chen, Qin and Liu. This is an open-access article distributed under the terms of the Creative Commons Attribution License (CC BY). The use, distribution or reproduction in other forums is permitted, provided the original author(s) and the copyright owner(s) are credited and that the original publication in this journal is cited, in accordance with accepted academic practice. No use, distribution or reproduction is permitted which does not comply with these terms.
*Correspondence: Ziling Liu, NDAyOTQ4ODQyQHFxLmNvbQ==
†These authors have contributed equally to this work