 Jinlong Jia1,2,3†
 Chengpeng Li4†Mei Tang2,3,5Hefa Liao2,3,5
 Zhuliang Yang3,5
 Yanan Wang6Ming Li7Wenbo Zeng1*Yuanbing Wang3,5*
- 1Sanqi Medicines College, Wenshan University, Wenshan, China
- 2College of Life Sciences, Yunnan University, Kunming, China
- 3State Key Laboratory of Phytochemistry and Natural Medicines, Kunming Institute of Botany, Chinese Academy of Sciences, Kumming, China
- 4Biotechnology and Germplasm Resources Institute, Yunnan Academy of Agricultural Sciences, Kunming, China
- 5Key Laboratory for Plant Diversity and Biogeography of East Asia and Yunnan Key Laboratory for Fungal Diversity and Green Development, Kunming Institute of Botany, Chinese Academy of Sciences, Kunming, China
- 6State Key Laboratory for Quality Assurance and Sustainable Use of Dao-di Herbs, Beijing, China
- 7Yunnan International Joint Laboratory of Virology and Immunology, School of Life Sciences, Yunnan University, Kunming, China
Introduction: Cordyceps is a diverse genus of insect-pathogenic fungi, some of which have significant medicinal value.
Methods: The complete mitogenomes of six Cordyceps species (C. cicadae, C. cocoonihabita, C. militaris, C. neopruinosa, C. pruinosa, and C. tenuipes) were sequenced, assembled, and annotated in this study. Additionally, the previously published mitogenome of C. blackwelliae was also included for comparative analysis.
Results: The mitogenomes of these seven Cordyceps species are circular DNA molecules ranging length from 29,929 to 51,692bp, containing 15 protein-coding genes (PCGs), two rRNAs, and 25–27 tRNAs, as well as four to 21 open reading frames (ORFs). The rps3 gene appears to be under relaxed selection pressure across Cordyceps species. The non-conserved PCGs, such as homing endonucleases and proteins of unknown functions, show dynamic evolutionary patterns, highlighting the genetic diversity among the species. Introns, recognized as key contributors to mitogenome size variation, frequently undergo gain and loss events, further contributing to genomic diversity. The comparative analysis revealed both conserved and variable elements within the mitogenomes of the seven Cordyceps species. Phylogenetic analysis using 14 PCGs generated a well-supported topology that clarified the evolutionary relationships among Cordyceps species.
Discussion: In conclusion, this study provides valuable insights into the conservatism and variability of mitogenomes within the genus Cordyceps, enhancing our understanding of their origin, evolution, and genetic diversity.
Introduction
Cordyceps, the most abundant taxon of entomopathogenic fungi in the family Cordycipitaceae, comprising approximately 180 known species.1 Species of this genus have a wide host range, infecting insects from diverse orders and spiders, including those isolated from soil and acting as plant endophytes (Fan et al., 2019). The fungi show remarkable geographic diversity, being mainly recorded from China, Japan, Thailand, Russia, Guatemala, Mexico, Norway, Denmark, France, Nepal, India, Mongolia, and Kazakhstan (Sung et al., 2007). Many cordycipitoid fungi have long been valued in traditional Chinese medicine and used as health supplements due to their diverse pharmacological properties, such as antibacterial, antiviral, and antitumor activities. The species Cordyceps militaris and C. cicadae (syn. Isaria cicadae) are well-known for their ability to enhance the human immune system (Yue et al., 2013; Zhang J. et al., 2015; Zhang Y. et al., 2015). In general, Cordyceps and related genera have beeen identified using molecular data derived from nuclear genes, including the small subunit ribosomal RNA (nrSSU), large subunit ribosomal RNA (nrLSU), translation elongation factor 1-alpha (tef1), RNA polymerase II subunit 1 (rpb1), and subunit 2 (rpb2) (Sung et al., 2007; Mongkolsamrit et al., 2020; Kepler et al., 2017). Although these nuclear gene have been extensively used to confirm the phylogenetic relationships among Cordyceps species, many species cannot be accurately identified (Kepler et al., 2020). The development of more comprehensive genetic analysis tools is necessary to facilitate a thorough phylogenetic investigation of Cordyceps.
Mitochondria and plastids, since their endosymbiotic origin, have undergone a complex process of nuclear integration, transitioning from independent bacteria to semi-autonomous organelles (Adams et al., 2002; Timmis et al., 2004; Kleine et al., 2009). These organelles are essential for numerous vital cellular processes, including cellular respiration, photosynthesis, lipid metabolism, as well as the synthesis of nucleotides and amino acids (Millar et al., 2005; van Wijk and Baginsky, 2011; Forsythe et al., 2019). Mitochondria are unique among organelles due to they have their own DNA, referred to as mitochondrial DNA (mtDNA) or the mitochondrial genome (mitogenome) (Burger et al., 2003). The mitogenome of fungi typically consists of 15 protein-coding genes (PCGs), which encode three ATP synthase subunits, seven NADH dehydrogenase subunits, one complex III (cytochrome c reductase), three complex IV (cytochrome c oxidase), and one ribosomal protein S3 (rps3) (Johnston and Williams, 2016). In contrast to nuclear genomes, mtDNA is characterized by the conservation of orthologous genes, uniparental inheritance, and multiple copies per cell (Sandor et al., 2018). These features make mtDNA a valuable molecular marker in eukaryotic ecology, phylogenetics, and population genetics (Corradi and Bonen, 2012; Galtier et al., 2009).
The number of fully sequenced fungal mitogenomes have significantly increased in recent years, thanks to advancements in sequencing technologies and the establishment of the Fungal Mitochondrial Genome Project (FMGP) (Husami et al., 2020; Paquin et al., 1997). To date, 28 complete mitogenomes from Cordyceps have been cataloged in the public database NCBI,2 including C. tenuipes, C. militaris, C. pruinosa, C. cicadae, and C. blackwelliae. These mitogenomes provide comprehensive data on diverse genomic features, including gene arrangement, intron dynamics, repeat sequences, and the expansion or contraction of intergenic regions (Li et al., 2020a). The non-conserved mitochondrial genes provides valuable insights into the origin and evolution of fungi (Wang X. et al., 2020; Zhang et al., 2017). The study of Cordyceps mitogenomes can enhance our understanding of the phylogeny and evolutionary mechanisms underlying entomopathogenic fungi. Despite these advancements, intraspecific and interspecific variations in the mitogenomes of Cordyceps remain insufficiently investigated. This gap limits our comprehensive understanding of the phylogeny and adaptive evolution within the family Cordycipitaceae.
In this study, the complete mitogenomes of C. cicadae, C. cocoonihabita, C. militaris, C. neopruinosa, C. pruinosa, and C. tenupes were sequenced, assembled, and annotated. Additionally, we included a comparison with the previously published complete mitogenome of C. blackwelliae (NC068268). Our objective encompassed three main aspects: firstly, we characterized the mitogenomes of these seven Cordyceps species; secondly, through a comprehensive comparative analysis, we discerned both commonalities and disparities among the mitogenomes; lastly, we conducted a extnesive molecular phylogenetic analysis of the order Hypocreales. The present study provides further knowledge about genomic evolution, phylogeny and genetic diversity of the significant entomopathogenic genus Cordyceps.
Materials and methods
Sample collection and sequencing
Six Cordyceps species were collected from various locations in Yunnan, China. Detailed information regarding their growth environments and collection sites was provided in Supplementary Table S9. Species were identified based on morphological observation and phylogenetic analysis of Internal Transcribed Spacer (ITS) sequences. The following specimens of Cordyceps species were examined: C. cicadae (KUNCC 6001), C. cocoonihabita (KUNCC 8672), C. militaris (KUNCC 7809), C. neopruinosa (KUNCC 8759), C. pruinosa (KUNCC 8674), and C. tenuipes (KUNCC 6172). All specimens are preserved at the Kunming Institute of Botany, Chinese Academy of Sciences (Contact information: YuanBing Wang, d2FuZ3l1YW5iaW5nQG1haWwua2liLmFjLmNu). Genomic DNA was extracted from the six Cordyceps species using the Fungal DNA Extraction Kit (Sangon Biotech, Shanghai, China), following the manufacturer’s instructions.
Mitogenomes assembly and annotation
Whole-genome sequencing (WGS) of the six Cordyceps species was performed using the Illumina XTen platform (Illumina Inc., San Diego, CA, United States). The mitogenomes were assembled using Getorganelle (v1.7.7.0) (Jin et al., 2020) and NOVOPlasty (v4.3.1) (Dierckxsens et al., 2017), resulting in completely assembled mitogenomes. Genome annotation was conducted using the online tools MFannot (Valach et al., 2014) and MITOS2 (Bernt et al., 2013), with mitochondrial genetic code 4. tRNAs and their secondary structures were identified using the tRNAscan-SE (v1.23) (Lowe and Chan, 2016) program. Finally, graphical representations of the mitogenomes were generated using the OGDraw (v1.3.1) (Lohse et al., 2007) online plotting tool.
Sequence feature analysis
The nucleotide composition and codon usage of the seven Cordyceps mitogenomes were analyzed using Phylosuite (v1.2.3) (Zhang et al., 2020), applying genetic code “4.” Nucleotide composition skews were calculated using the following formulas: AT-shew = (A-T)/(A + T) and GC-shew = (G-C)/(G + C) (Perna and Kocher, 1995). Genetic distances between the 14 core PCGs (atp6, atp8, atp9, cob, cox1, cox2, cox3, nad1, nad2, nad3, nad4, nad4L, nad5, and nad6) were calculated based on the Kimura-2 parameter (K2P) substitution model in MEGA7 (Caspermeyer, 2016). Non-synonymous (Ka) and synonymous (Ks) substitution rates for the 14 core PCGs of the seven mitogenomes were calculated using KaKs_calculator (v3.0) (Zhang, 2022). Genomic synteny between the seven mitogenomes was analyzed using BLAST and MCscanX (Wang et al., 2012).
Repeat element analysis
Self-searches of the seven Cordyceps mitogenomes were conducted using BlastN with an E-value threshold of <10–10. Tandem repeat sequences were identified using Tandem Repeats Finder (v4.09) (Benson, 1999) with default parameters. Interspersed repeats were detected using REPuter (v2.1) (Kurtz, 2001), applying a Hamming distance of 3, a maximum repeat size of 5,000, and a minimum repeat size of 30. Simple sequence repeats (SSRs) were identified using MISA (v1.0) (Beier et al., 2017) under the following conditions: mononucleotide repeats 10, dinucleotide repeats 5, trinucleotide repeats 4, as well as tetranucleotide, pentanucleotide, and hexanucleotide repeats 3.
Intron analysis
The majority of eukaryotic mitogenomes are typically intron less, fungi belonging to the order Hypocreales, including Cordyceps, frequently contain varying numbers of introns (Chen et al., 2021; Martin et al., 2007; Zhang J. et al., 2015; Zhang Y. et al., 2015). Following established methods (Cheng et al., 2021), the introns within the PCGs of Cordyceps mitgenomes were classified into Pcls using the reference genome of Tolypocladium inflatum (NC036382) (Zhang and Zhang, 2019). Initially, the PCGs from Cordyceps mitogenomes were aligned with the corresponding PCGs of T. inflatum using MAFFT (Férandon et al., 2010). Each Pcl represents introns inserted at the same position within the coding region of a given PCG (Cheng et al., 2021). Introns within the same Pcls exhibited high sequence similarity were considered orthologous (Férandon et al., 2010). Conversely, different Pcls generally exhibit low sequence similarity and often contain non-orthologous mobile genetic elements (Huang et al., 2021). The Pcls for the PCGs in Cordyceps mitogenomes were designated according to their insertion positions within coding regions of the reference host genes.
Phylogenetic analysis
In this study, the phylogenetic tree for the order Hypocreales was constructed using maximum likelihood (ML) and Bayesian inference (BI) methods based on 14 core PCGs (atp6, atp8, atp9, cytb, cox1, cox2, cox3, nad1, nad2, nad3, nad4, nad4L, nad5, nad6). Neurospora crassa and Podospora anserina were used as outgroup taxa. The 14 PCGs were extracted using Phylosuite and subsequently aligned using MAFFT (v7.520) (Katoh et al., 2019). The resulting aligned sequences were then concatenated using SequenceMatrix (v1.7.8) (Vaidya et al., 2011). The ModelFinder (v1.6.12) (Kalyaanamoorthy et al., 2017) was employed to determine the optimal evolutionary model for the concatenated alignments. The ML analysis was performed using IQ-tree (v1.6.8) (Nguyen et al., 2015), with 1,000 ultrafast bootstrap replications under the edge-linked partition model, based on the Bayesian information criterion (BIC). The BI analysis was conducted using MrBayes (v3.2.7a) (Ronquist et al., 2012), where two independent runs were performed, each with four chains (three heated, one cold), running for 2 × 10⁶ generations. Samples were taken every 100 generations. The convergence was assumed when the estimated sample size (ESS) exceeded 100 and the potential scale reduction factor (PSRF) approached 1.0. The first 25% of samples were discarded as burn-in, and the remaining trees were used to calculate Bayesian posterior probabilities (BPP) in the 50% majority-rule consensus tree (Li et al., 2021). The phylogenetic tree was visualized and edited using Figtree (v1.4.4).
Results
Mitogenome characterization of seven Cordyceps species
The complete mitogenomes of the seven Cordyceps species were found to consist of single circular DNA molecules, with genome sizes ranging from 29,929 to 51,692 bp (Figure 1). Among these, C. cicadae had the largest mitogenome, while C. militaris had the smallest (Supplementary Table S1). The GC contents of the seven mitogenomes ranged from 25.1 to 26.7%, with an average GC content of 26.01%. The AT-skew of the C. militaris is negative, while the remaining species exhibited positive AT-skew values. All seven mitogenomes had positive GC-skew values. The number of ORFs ranged from four to 21, with C. militaris having the lowest count at four ORFs. These ORFs primarily encoded LAGLIDADG and GIY-YIG homing endonucleases, as well as proteins of unknown function. Additionally, a total of 84 introns were detected across the seven mitogenomes, with each species containing five to 21 introns, some of which included zero to two intronic ORFs. These introns were classified into five groups: 42 introns in group IB, 17 to group IA, eight in group ID, 12 in group IC1, and five in group IC2 (Supplementary Table S2). The seven species all shared a consistent set of genes, encompassing two ribosomal RNA genes (rns and rnl), 15 PCGs (atp6, atp8, atp9, cytb, cox1, cox2, cox3, nad1, nad2, nad3, nad4, nad4L, nad5, nad6, and rps3), and 25 to 27 transfer RNA (tRNA) genes. The number of tRNA genes in these species varied, with three species having 25 genes, C. cocoonihabita having 26 genes, and C. militaris and C. pruinosa having 27 genes. The tRNA genes encoded the 20 standard amino acids, with lengths ranging from 71 to 85 bp, each exhibiting the typical cloverleaf structure (Supplementary Figure S1).
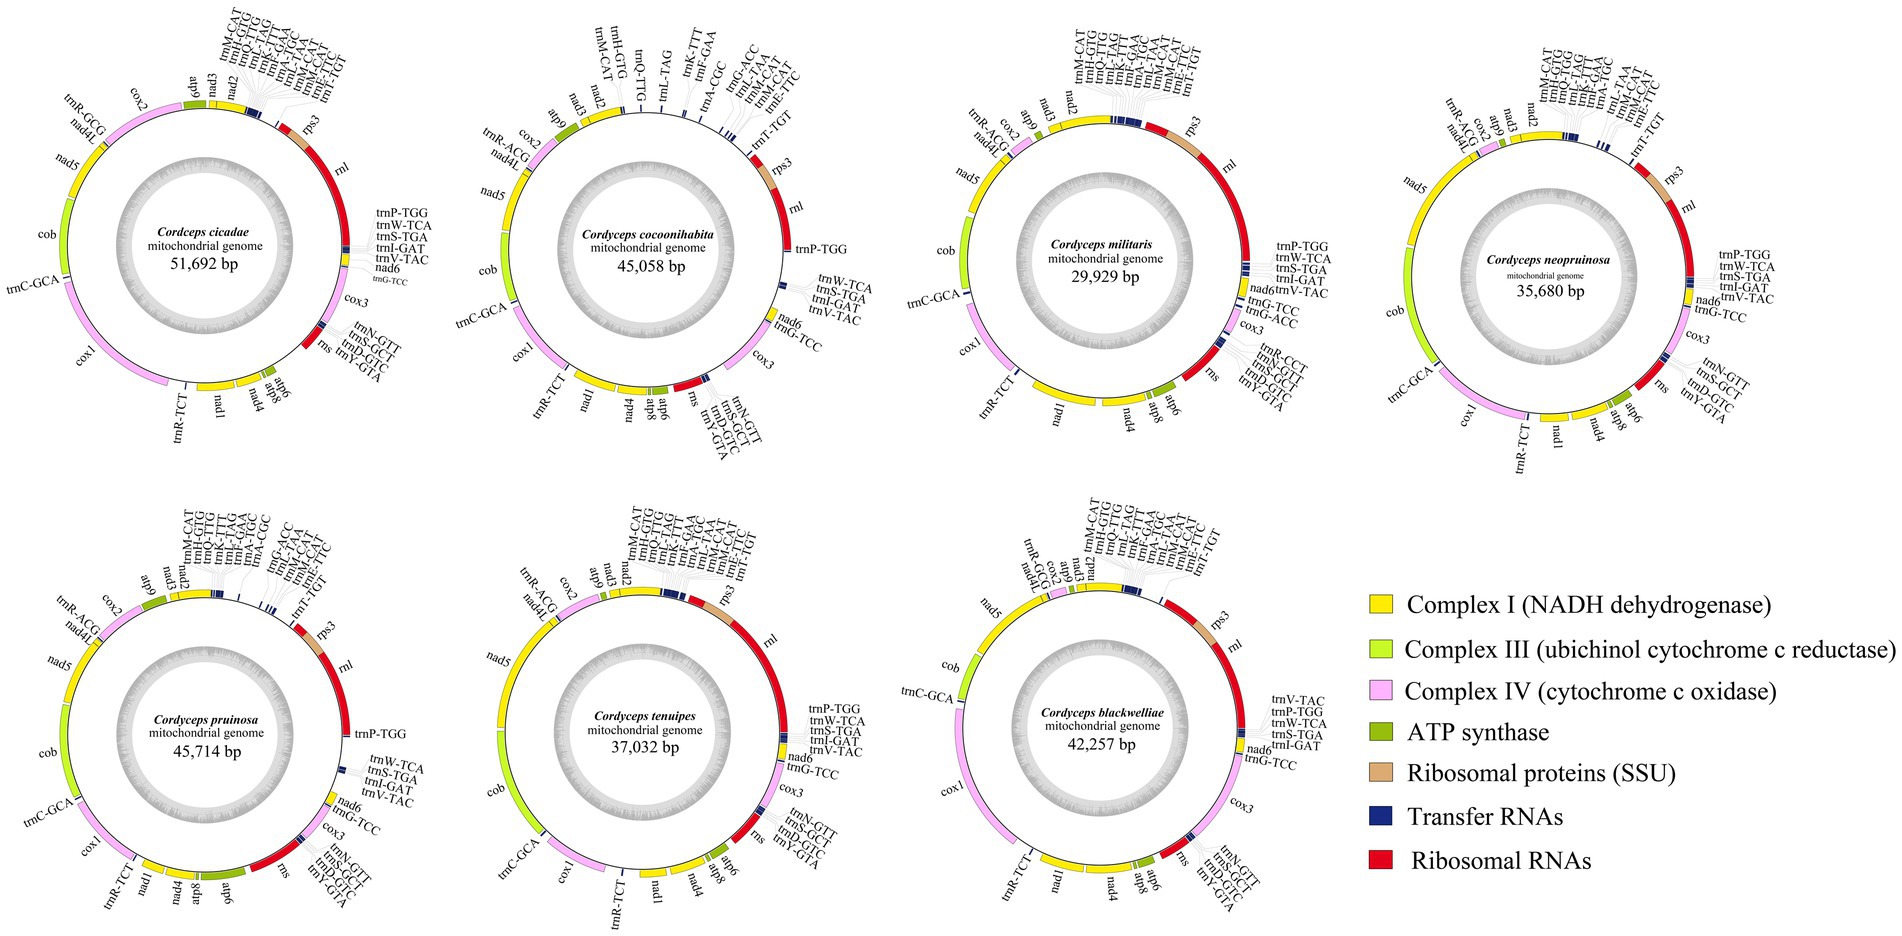
Figure 1. Circular maps of the mitogenomes of seven Cordyceps species. The genes with distinct functions are represented by different colored blocks. Genes located on the negative strand are shown inside the circle, while genes on the positive strand are displayed outside the circle.
Mitogenomes of the seven Cordyceps species showed significant enlargement, prompting a detailed analysis of the composition of each gene region within the mitogenomes. The results indicated that while protein-coding regions were highly conserved across all species, there were substantial differences in introns and intergenic regions. Specifically, C. cicadae had a significantly higher number of nucleotides in its intronic regions compared to other species. In contrast, C. cocoonihabita had a markedly greater number of nucleotides in its intergenic regions compared to the rest of the species (Supplementary Figure S2).
Codon usage analysis
To further investigate the conservation and variability within Cordyceps mitogenomes, we analyzed the codon usage across the seven species for the 15 PCGs. The majority of these PCGs employed AT* as the start codon. Specifically, ATG was used to initiate the genes atp8, atp9, cox2, cox3, cytb, nad2, nad3, nad4L, nad5, and nad6. In contrast, alternative start codons such as ATA, ATT, and TTA were employed by certain mitochondrial genes. Regarding stop codons in core PCGs of Cordyceps mitogenomes, TAA was predominantly used. However, the nad3 and rps3 genes ended with TAG in C. tenuipes (Supplementary Table S3).
Codon usage analysis revealed that the codon preferences were highly similar in the seven Cordyceps mitogenomes. Among the 15 PCGs, UUA was the most frequently used codon, followed by commonly used codons such as UUU (for Phenylalanine; Phe), AUU (for Isoleucine; Ile), AUA (for Isoleucine; Ile), AAA (for Lysine; Lys), and UUA (for Leucine; Leu). The predominance of these codons contributed to the high AT content (74%) observed in the mitogenomes, as they frequently ended with A or T (Figure 2). The tRNA molecules in size ranged from 71 to 85 bp. Notably, the tRNAs for trnL, trnS, and trnY were longer than 80 bp and had additional arms, which significantly contributed to the length. Moreover, a considerable number of G-U mismatches were detected within the secondary structures of the tRNAs (Supplementary Figure S2).
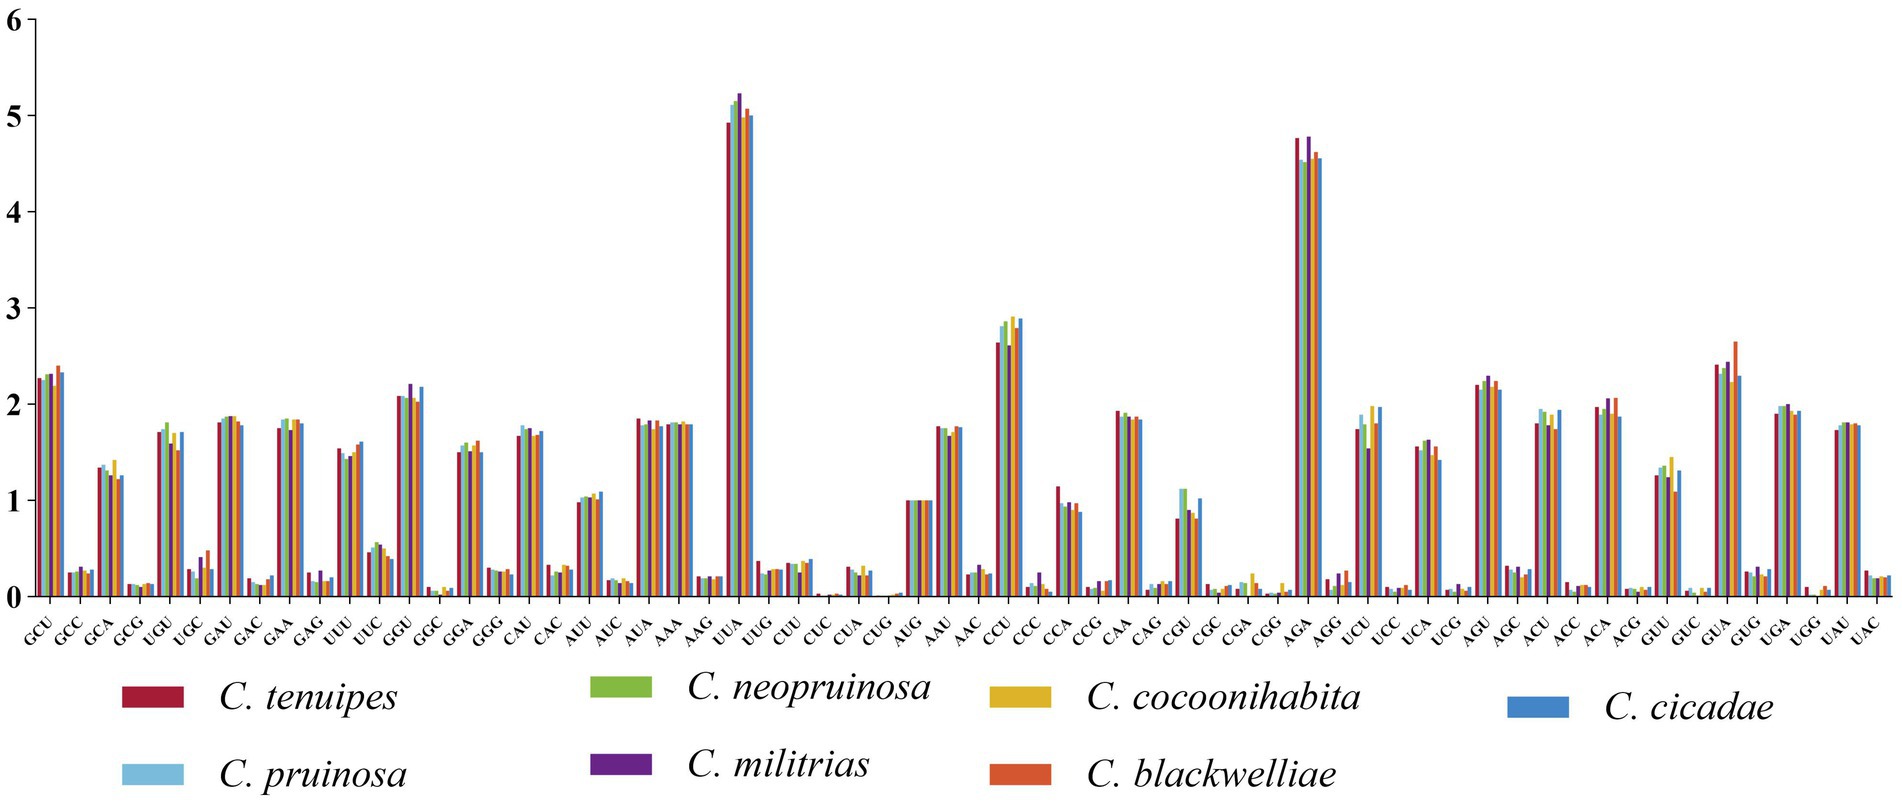
Figure 2. Codon usage analysis of the mitogenomes of seven Cordyceps species. The x-axis represents the codons, and the y-axis denotes the frequency of codon usage.
Repetitive sequence analysis
Repetitive sequences in the mitogenomes of seven Cordyceps species were identified using self-BLAST search. Numbers of repetitive regions detected in each species were as follows: ten in C. blackwelliae, 18 in C. cicadae, 17 in C. cocoonihabita, two in C. militaris, two in C. neopruinosa, 15 in C. pruinosa, and seven in C. tenuipes. These repetitive sequences ranged from 40 to 420 bp in length, with the longest occurring in C. cocoonihabita and the shortest in C. blackwelliae (Supplementary Table S4). Tandem repeat sequences were identified, with five in C. blackwelliae, six in C. cicadae, four in C. cocoonihabita, four in C. militaris, five in C. neopruinosa, four in C. pruinosa, and four in C. tenuipes. These tandem repeats with length ranged from six to 45 bp and had copy numbers ranging from 1.9 to 6 (Supplementary Table S5). The analysis detected various repeat sequences, including mononucleotide, dinucleotide, trinucleotide, tetranucleotide, pentanucleotide, and hexanucleotide repeats. Among these repeats, trinucleotide and tetranucleotide were found to be the most abundant. A total of 26 SSRs were identified in the mitogenome of C. blackwelliae, while C. cicadae, C. cocoonihabita, C. militaris, C. neopruinosa, C. pruinosa, and C. tenuipes had 21, 24, 15, 17, 21, and 15 SSRs, respectively (Supplementary Table S6). Furthermore, both forward (F) and palindromic (P) repeat sequences were found with a higher prevalence of forward repeats in the seven species (Supplementary Table S7). In terms of the distribution of repetitive sequences of the seven mitogenomes, the C. cicadae, with the largest mitogenome, had the highest number of repetitive sequences primarily located in introns and intergenic regions (Figure 3).
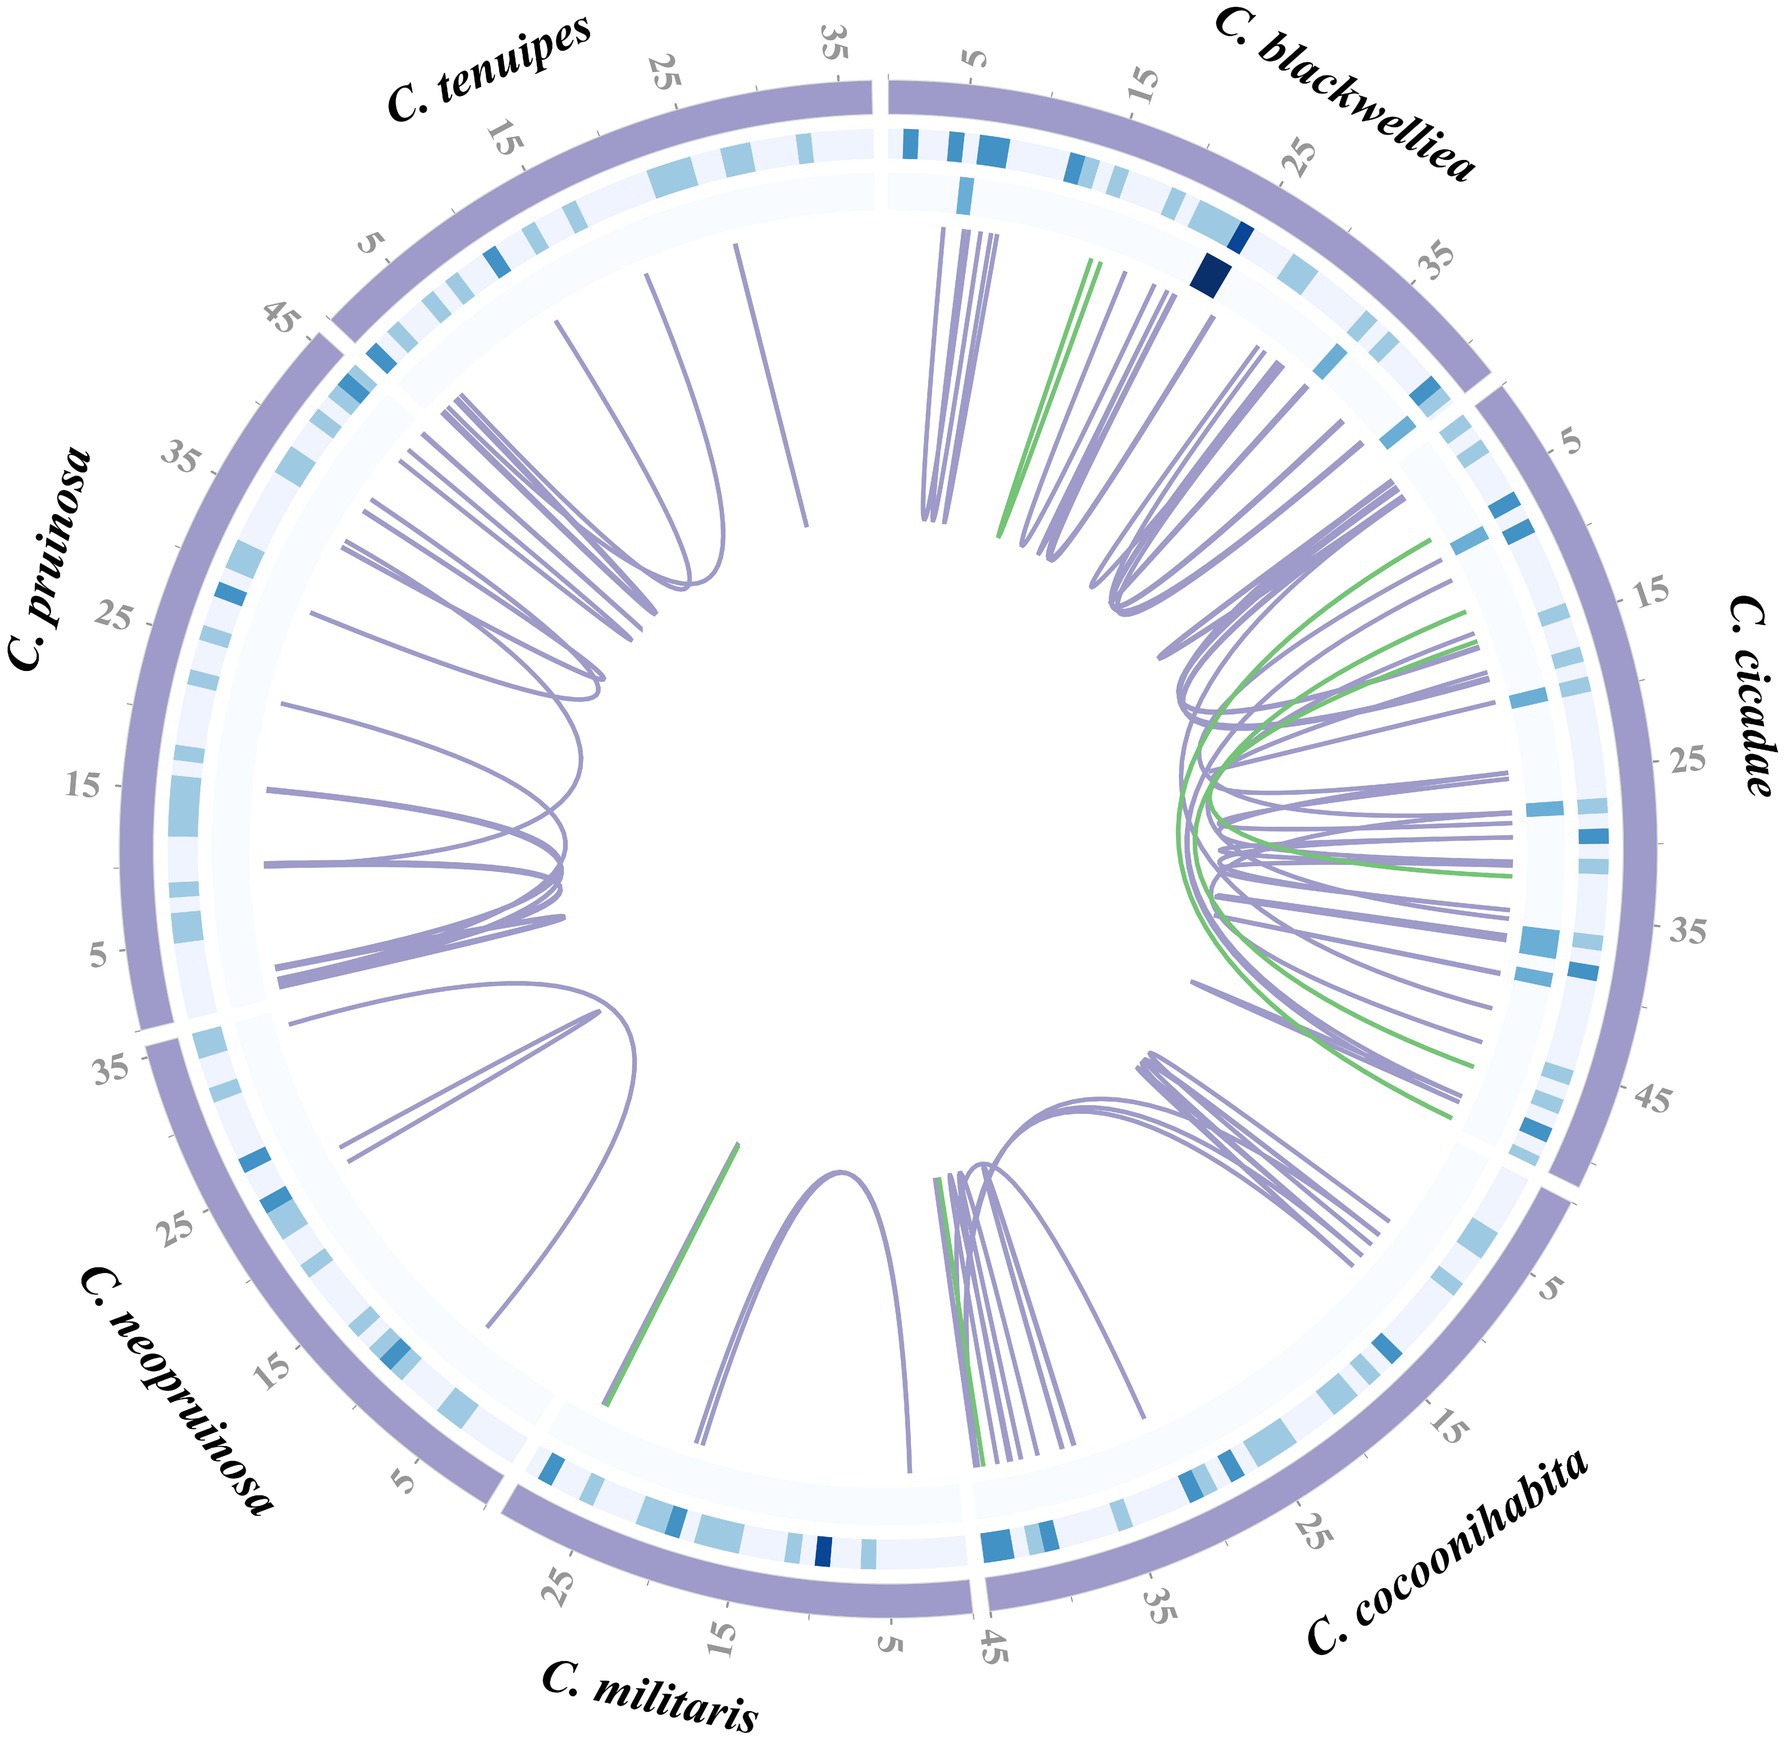
Figure 3. Distribution of repeat sequences in the mitogenomes of seven Cordyceps species. The circles in the diagram present the positions of dispersed repeats, tandem repeats, and simple repeats from innermost to outermost. The blue-gray lines indicate as forward repeats, while green lines represent palindromic repeats.
Intron dynamics analysis
The number of introns showed a significant correlation with the sizes of the seven Cordyceps mitogenomes (p < 0.01). Pearson and Spearman correlation coefficients were 0.93 and 0.89, respectively, indicating a significant contribution of introns to the variation in Cordyceps mitogenomic size (Supplementary Figure S3). A total of 84 introns were detected across the seven mitogenomes, with each species harboring 5–21 introns. These introns also included zero to two intron ORFs, primarily encoding LAGLIDADG homing endonucleases, GIY-YIG homing endonucleases, and proteins with unknown functions. The study indicated that intron loss or gain events occurred throughout the evolutionary history of Cordyceps. Among these introns, 76.19% (64 introns) were located within core PCGs, while 23.81% reside within rRNA genes, making core PCGs the primary repository for intron. Introns were distributed in the atp9, cox2, nad5, cob, cox1, atp6, nad1, nad4, and cox3 genes, however, introns lack in the atp6, nad2, nad3, nad4L, nad6, and rps3 genes (Supplementary Figure S3). This uneven distribution of introns suggested a gene preference, with the majority of introns targeting core PCGs.
Based on the insertion sites of introns within the protein-coding regions in the host genes, the introns were classified into different positional categories (Pcls) corresponding to their reference genes. The cox1 and cob genes contained the highest number of introns, with 17 and 14, respectively, exhibiting the greatest variation in intron count. The introns in the cox1 gene of seven Cordyceps species were categorized into P212, P709, P720, P731, and P1057, with P212, P731, and P1057, being the most widely distributed. Among these species, C. cicadae contained all intron types, whereas C. militaris and C. tenuipes showed significant intron loss in the cox1 gene, retaining only the P731 intron (Figure 4a). The atp6, atp9, cox2, cox3, nad1, nad4, and nad5 genes exhibited the presence of 1, 1, 3, 6, 2, 1, and 5 Pcls, respectively. The cob gene P392 contained the most abundant intron P392 across the Cordyceps species, while P6 from the cox2 gene was widely distributed in C. cicadae, C. cocoonihabita, C. pruinosa, and C. tenuipes. Conversely, some introns, such as P572 from atp6, P25 and P823 from cob, P51 and P218 from cox2, P333, P219, and P631 from cox3, P505 from nad4, as well as P717 and P416 from nad5 were detected within a single species, as rare Pcls in Cordyceps (Figure 4b). Interestingly, these rare Pcls were also found in distantly related species such as Ganoderma lingzhii (Li et al., 2022) and Agaricus bisporus (Férandon et al., 2010). These findings suggest the possibility of intron transfer within the mitochondrial genome of Cordyceps, and highlight the convergent nature of intron insertion across distantly related species.
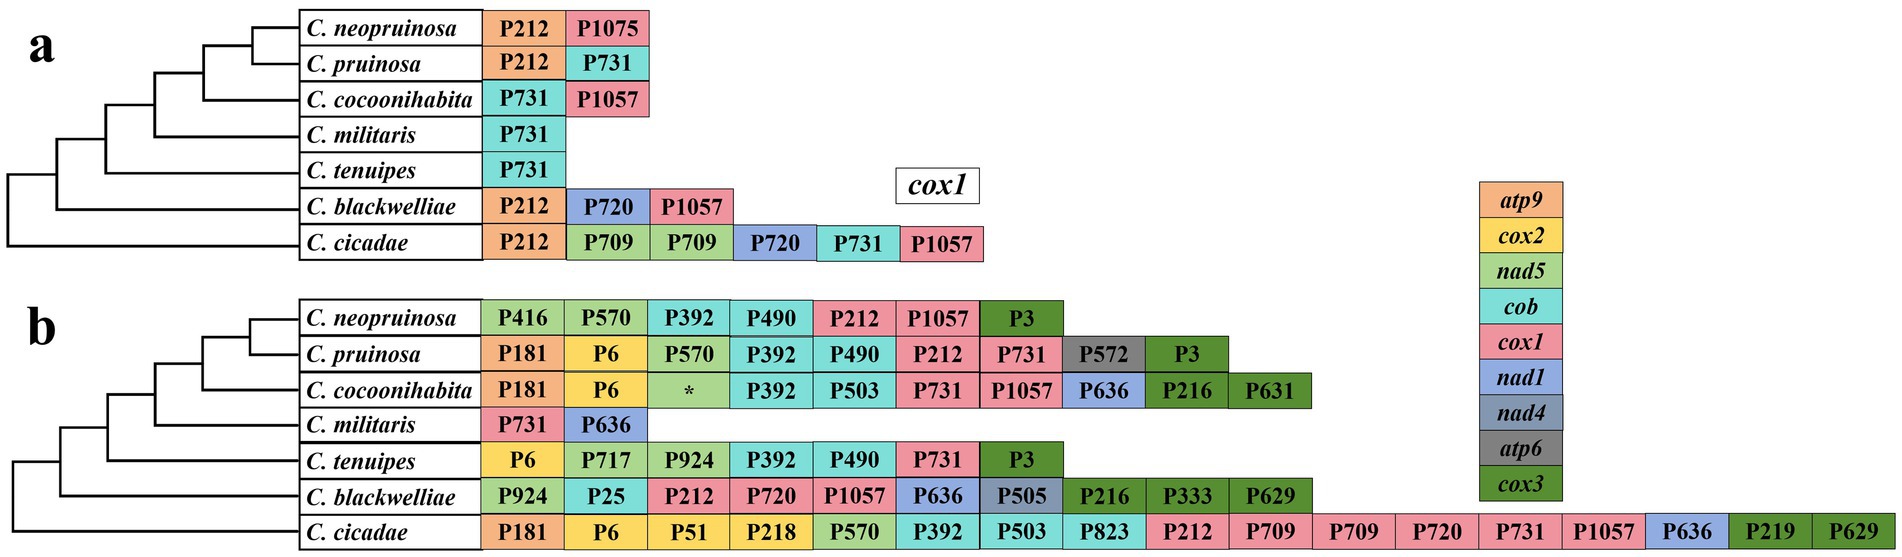
Figure 4. Positional classification (Pcl) of introns within cox1 (a) and other core PCGs (b) of seven Cordyceps species. Pcls, representing directly homologous introns, are labeled based on their insertion site (nucleotide positions) relative to the reference gene (cox1, GenBank accession: NC036382). The phylogenetic relationships among the seven Cordyceps species were inferred using Bayesian Inference (BI) and Maximum Likelihood (ML) methods, derived from a combined set of PCGs.* represented undetermined positional classification.
Analysis of variability, genetic distance, and evolutionary rate of PCGs
The lengths of the atp8, atp9, cox2, cox3, and nad4L genes were identical in the mitogenomes of the seven Cordyceps species. Notably, the cox1 gene exhibited the most prominent variation among these species. Among the 15 PCGs, the atp9 gene exhibited the highest GC content, ranging from 32.5 to 34.2%, with an average of 33.46%. In contrast, the rps3 gene had the lowest GC content, ranging from 17.7 to 20.4%, with an average of 18.99%. The atp6 and rps3 genes exhibited positive AT-skew values, while the remaining 13 genes exhibited negative values. The atp8 gene had a negative GC-skew value whereas all other 14 genes had positive values (Figure 5).
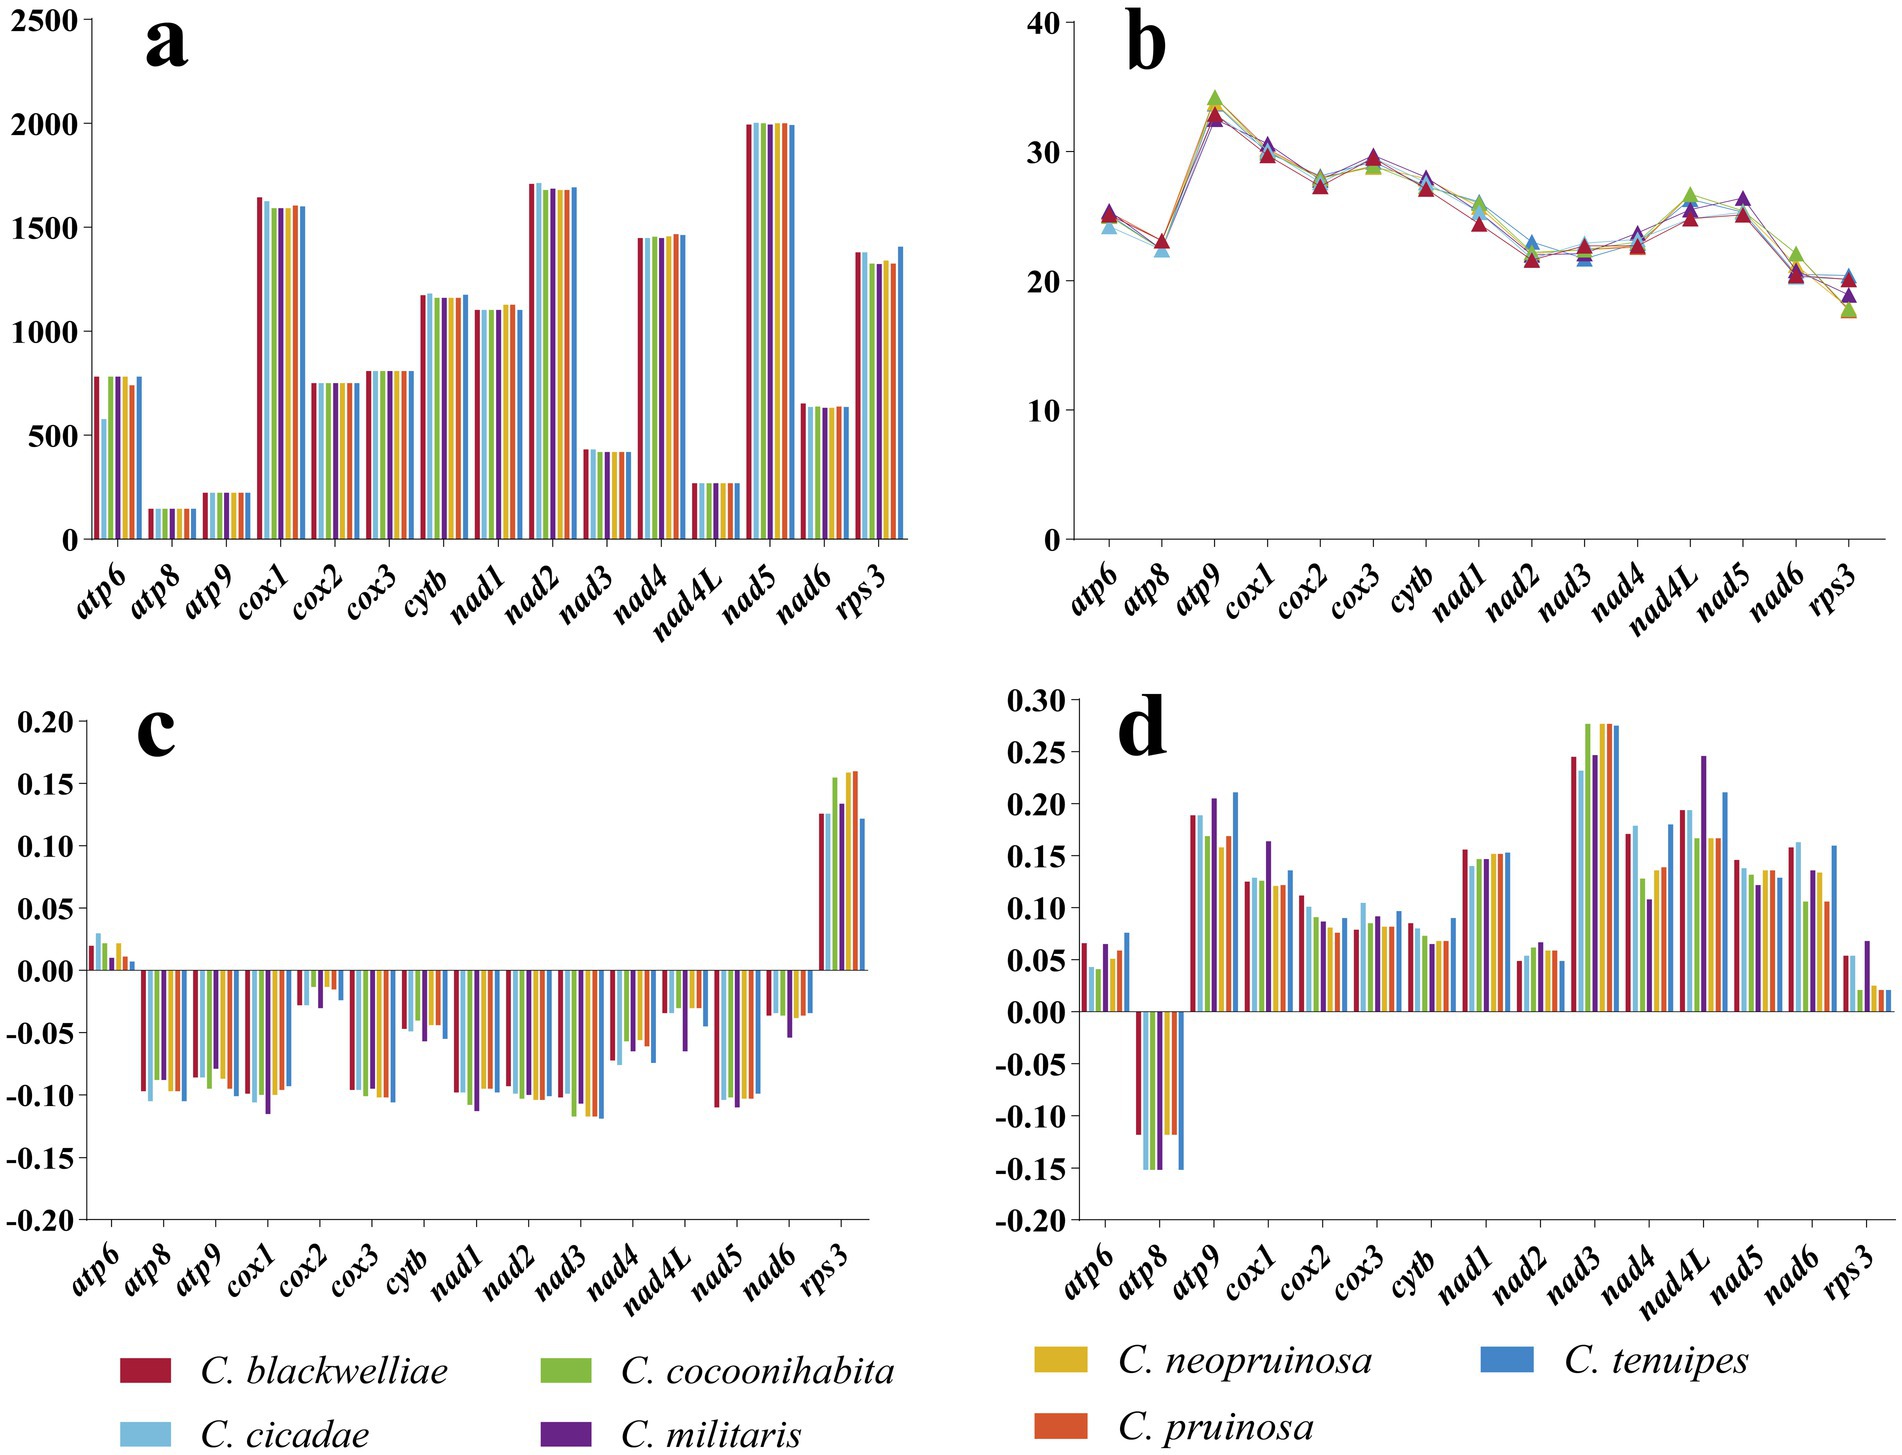
Figure 5. Variation in length and base composition of the 15 PCGs in the mitogenomes of seven Cordyceps species. (a) Variation in the length of 15 PCGs; (b) Variation in GC content; (c) Variation in AT-skew; (d) Variation in GC-skew.
Additionally, we examined the nonsynonymous substitution rate (Ka), synonymous substitution rate (Ks), and Kimura-2-parameter distance for the seven Cordyceps mitogenomes (Figure 6). Among the 15 PCGs, the rps3 gene exhibited the highest genetic distance, indicating a higher mutation rate. Conversely, the atp8 gene exhibited the lowest genetic distance, highlighting its high conservation. Furthermore, the rps3 gene had the highest Ka/Ks ratio among the 15 PCGs, while the atp8 and atp9 genes had the lowest Ka/Ks values. All Ka/Ks values for the 15 PCGs were less than one, indicating that these genes were under purifying selection.
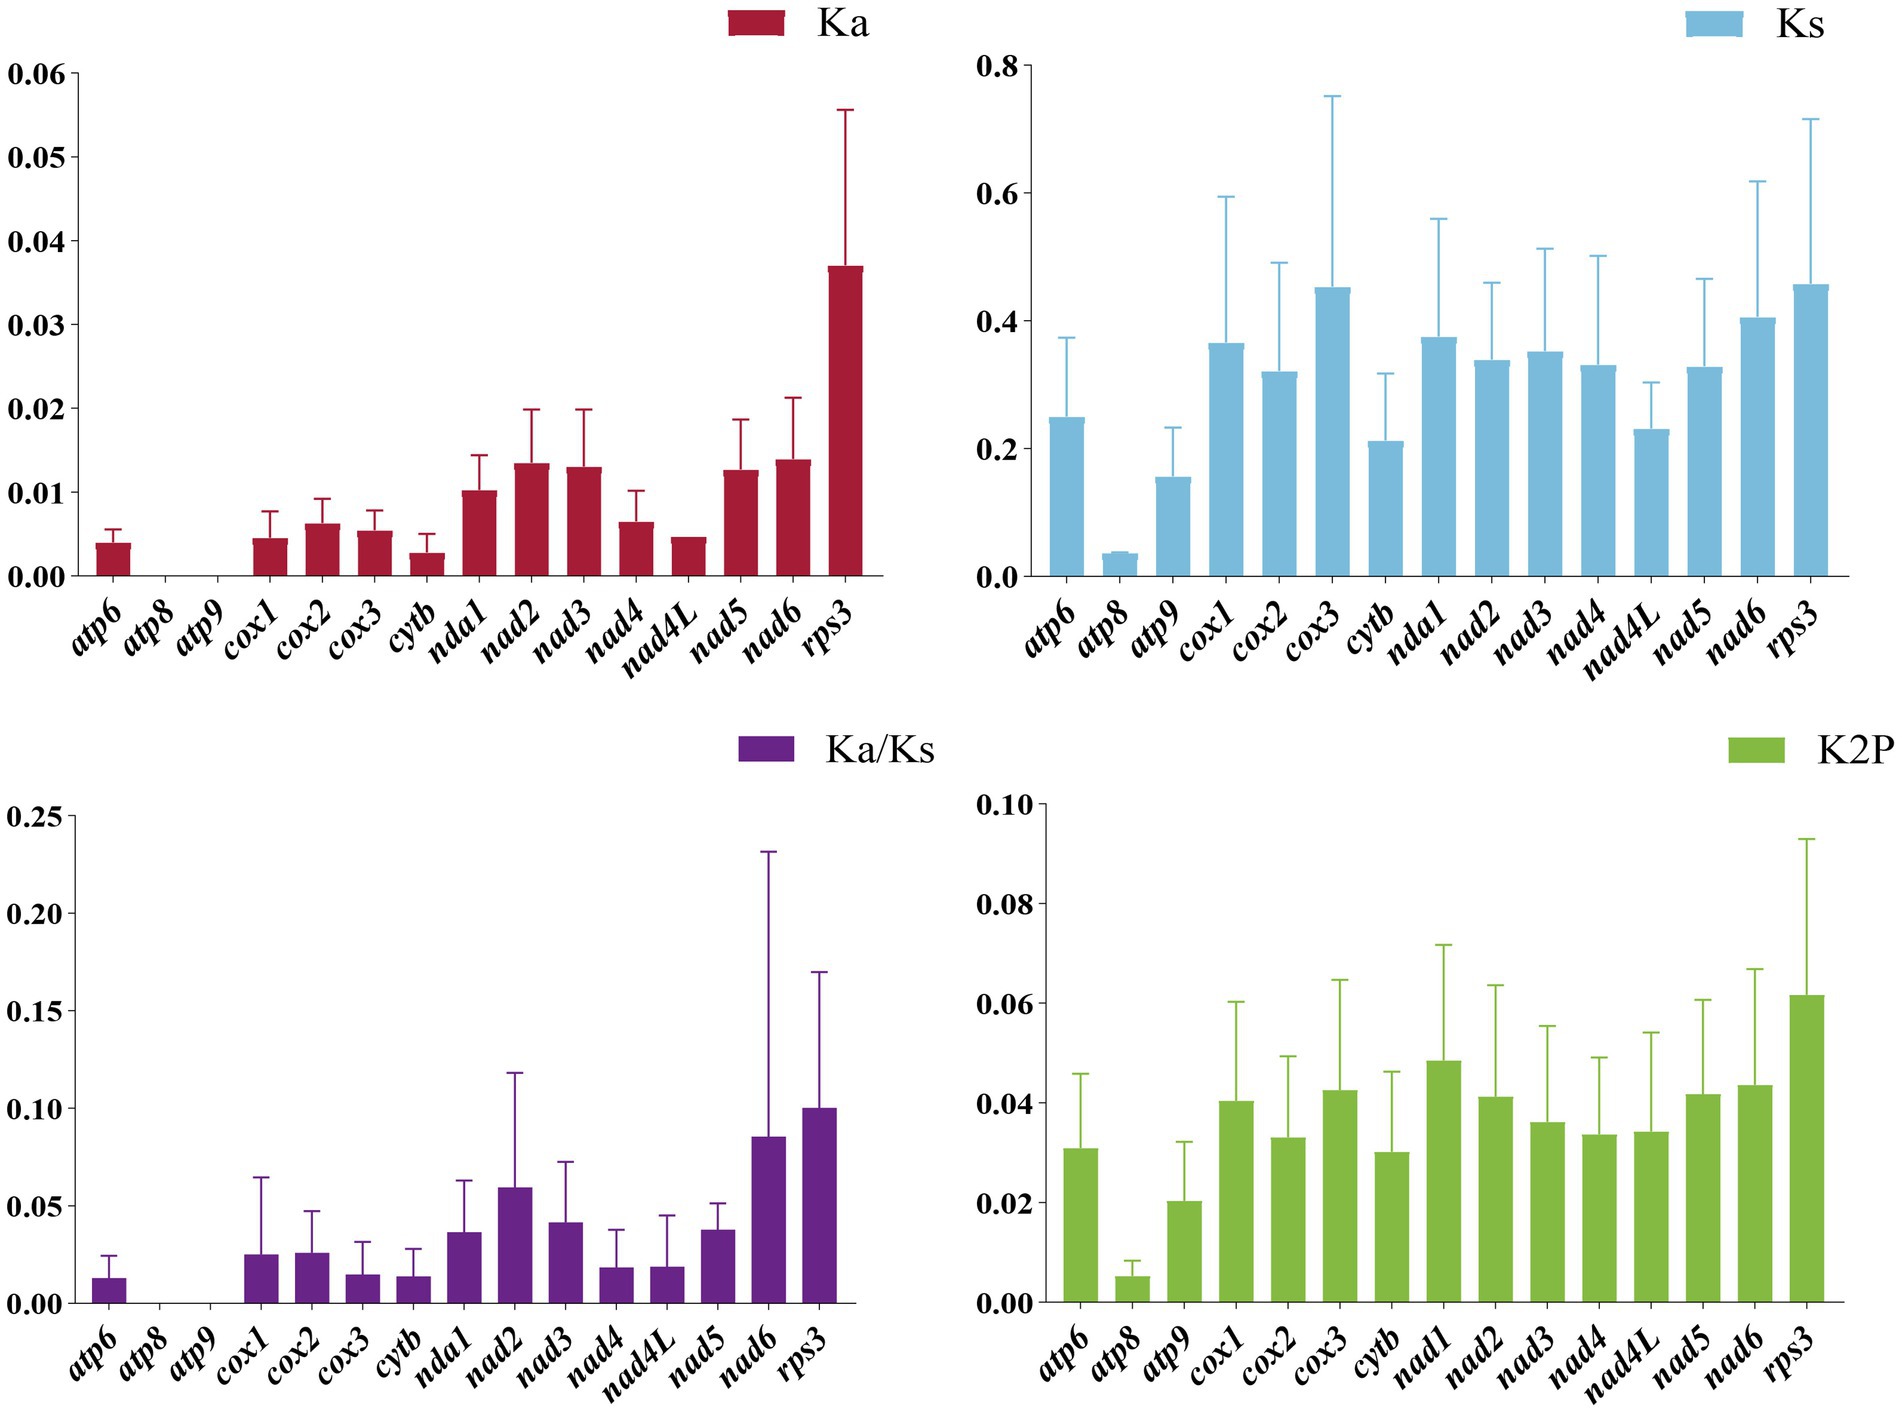
Figure 6. Genetic analysis of the 15 PCGs in the mitochondrial genomes of seven Cordyceps species. K2P: Overall mean of Kimura-2-Parameter distances; Ka: Mean number of nonsynonymous substitutions per nonsynonymous locus; Ks: Mean number of synonymous substitutions per synonymous locus.
Synteny analysis
The evolutionary relationships among the Cordyceps species were investigated through sequence comparison and covariance analysis (Figure 7). It was revealed that a considerable number of covariance regions existed in the seven species, with the majority exhibiting over 90% homology. The highest homology was found between C. cicadae and C. pruinosa, while the lowest was found between C. pruinosa and C. cocoonihabita. The longest segment, measuring approximately 4,884 bp, was found between C. cicadae and C. pruinosa among the homologous sequences, with a single mismatch of 24 bp.
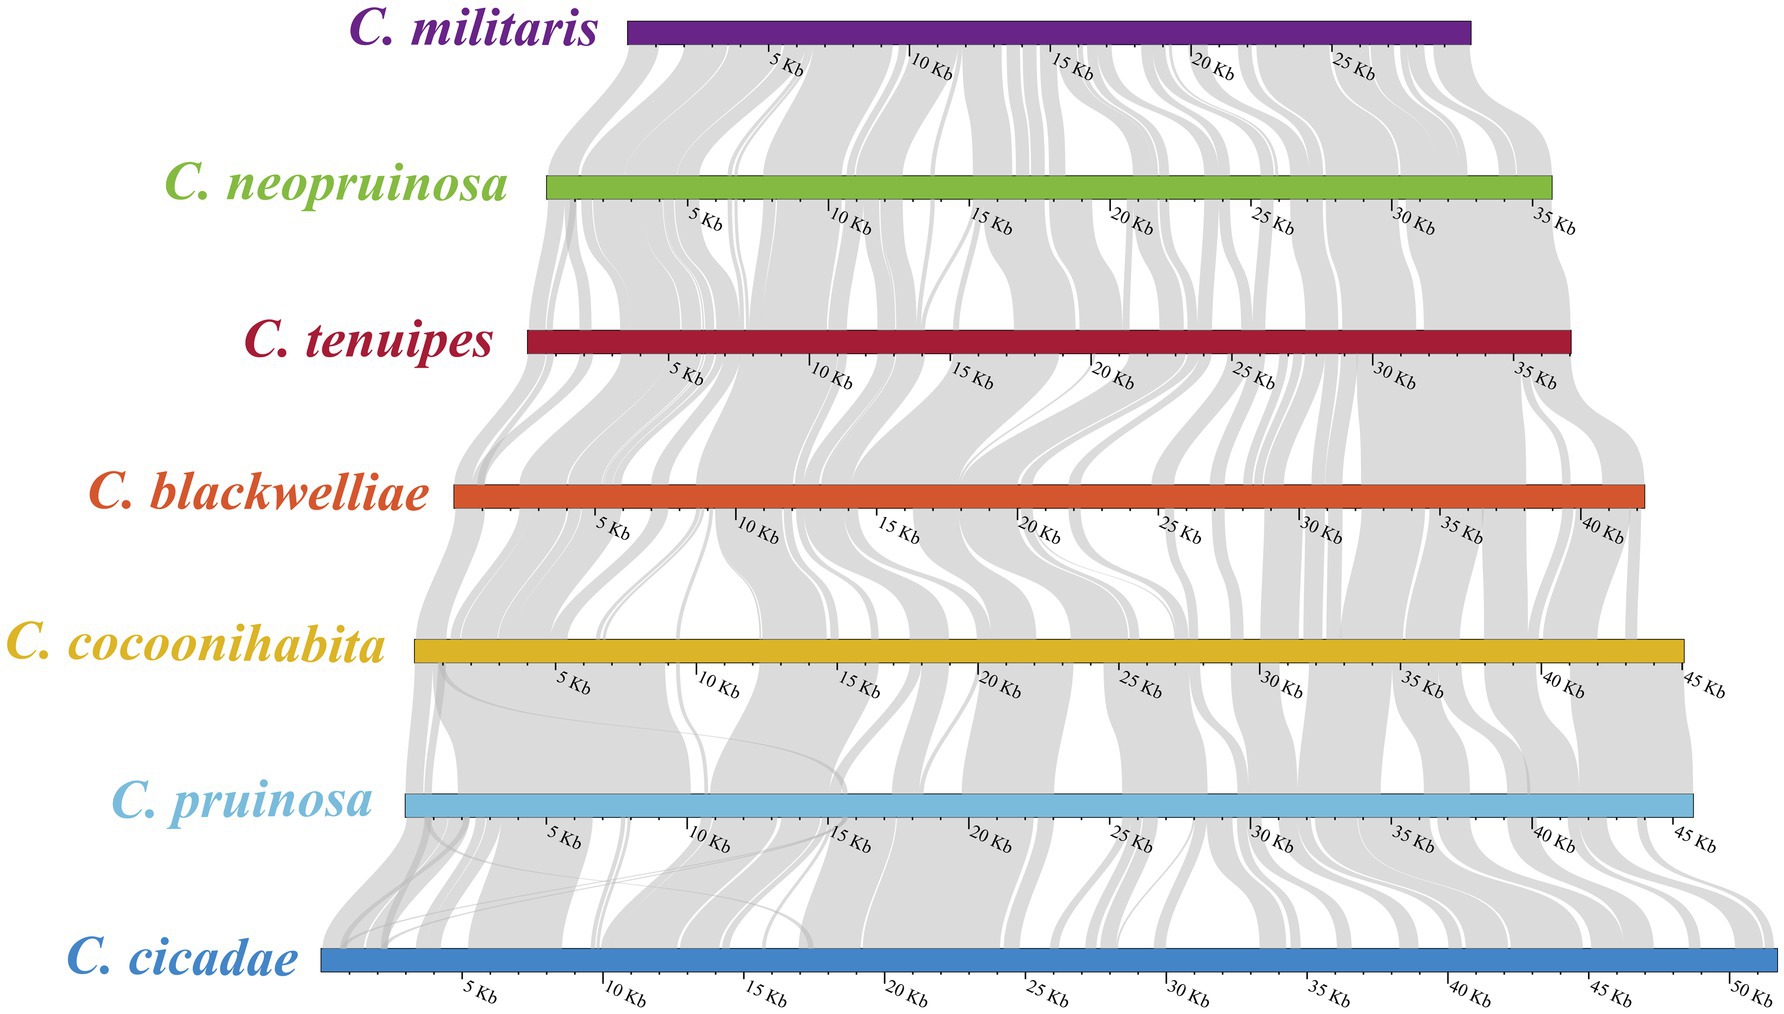
Figure 7. Covariance analysis of the complete mitogenomes of seven Cordyceps species. The gray-colored areas between species indicate varying degrees of homology.
Phylogenetic analysis
A phylogenetic tree of the order Hypocreales was constructed using Bayesian Inference (BI) and Maximum Likelihood (ML) methods, based on 14 core PCGs (atp6, atp8, atp9, cytb, cox1, cox2, cox3, nad1, nad2, nad3, nad4, nad4L, nad5, and nad6). The resulting phylogenetic tree recognized strong support for all the distinct trunk cladaes (Figure 8). The 35 species of Hypocreales were placed in seven families: Cordycipitaceae, Hypocreaceae, Pseudodiploosporeaceae, Ophiocordycipitaceae, Clavicipitaceae, Polycephalomycetaceae, and Netriaceae. The seven Cordyceps species within the family Cordycipitaceae formed a monoplyletic clade, indicating a sister-relationship between Cordyceps and Beauveria. In particular, C. cocoonihabita, C. neopruinosa, C. pruinosa, and C. militaris closely clustered together in a subclade, while C. blackwelliae, C. cicadae, and C. tenuipes formed another distinct subclade.
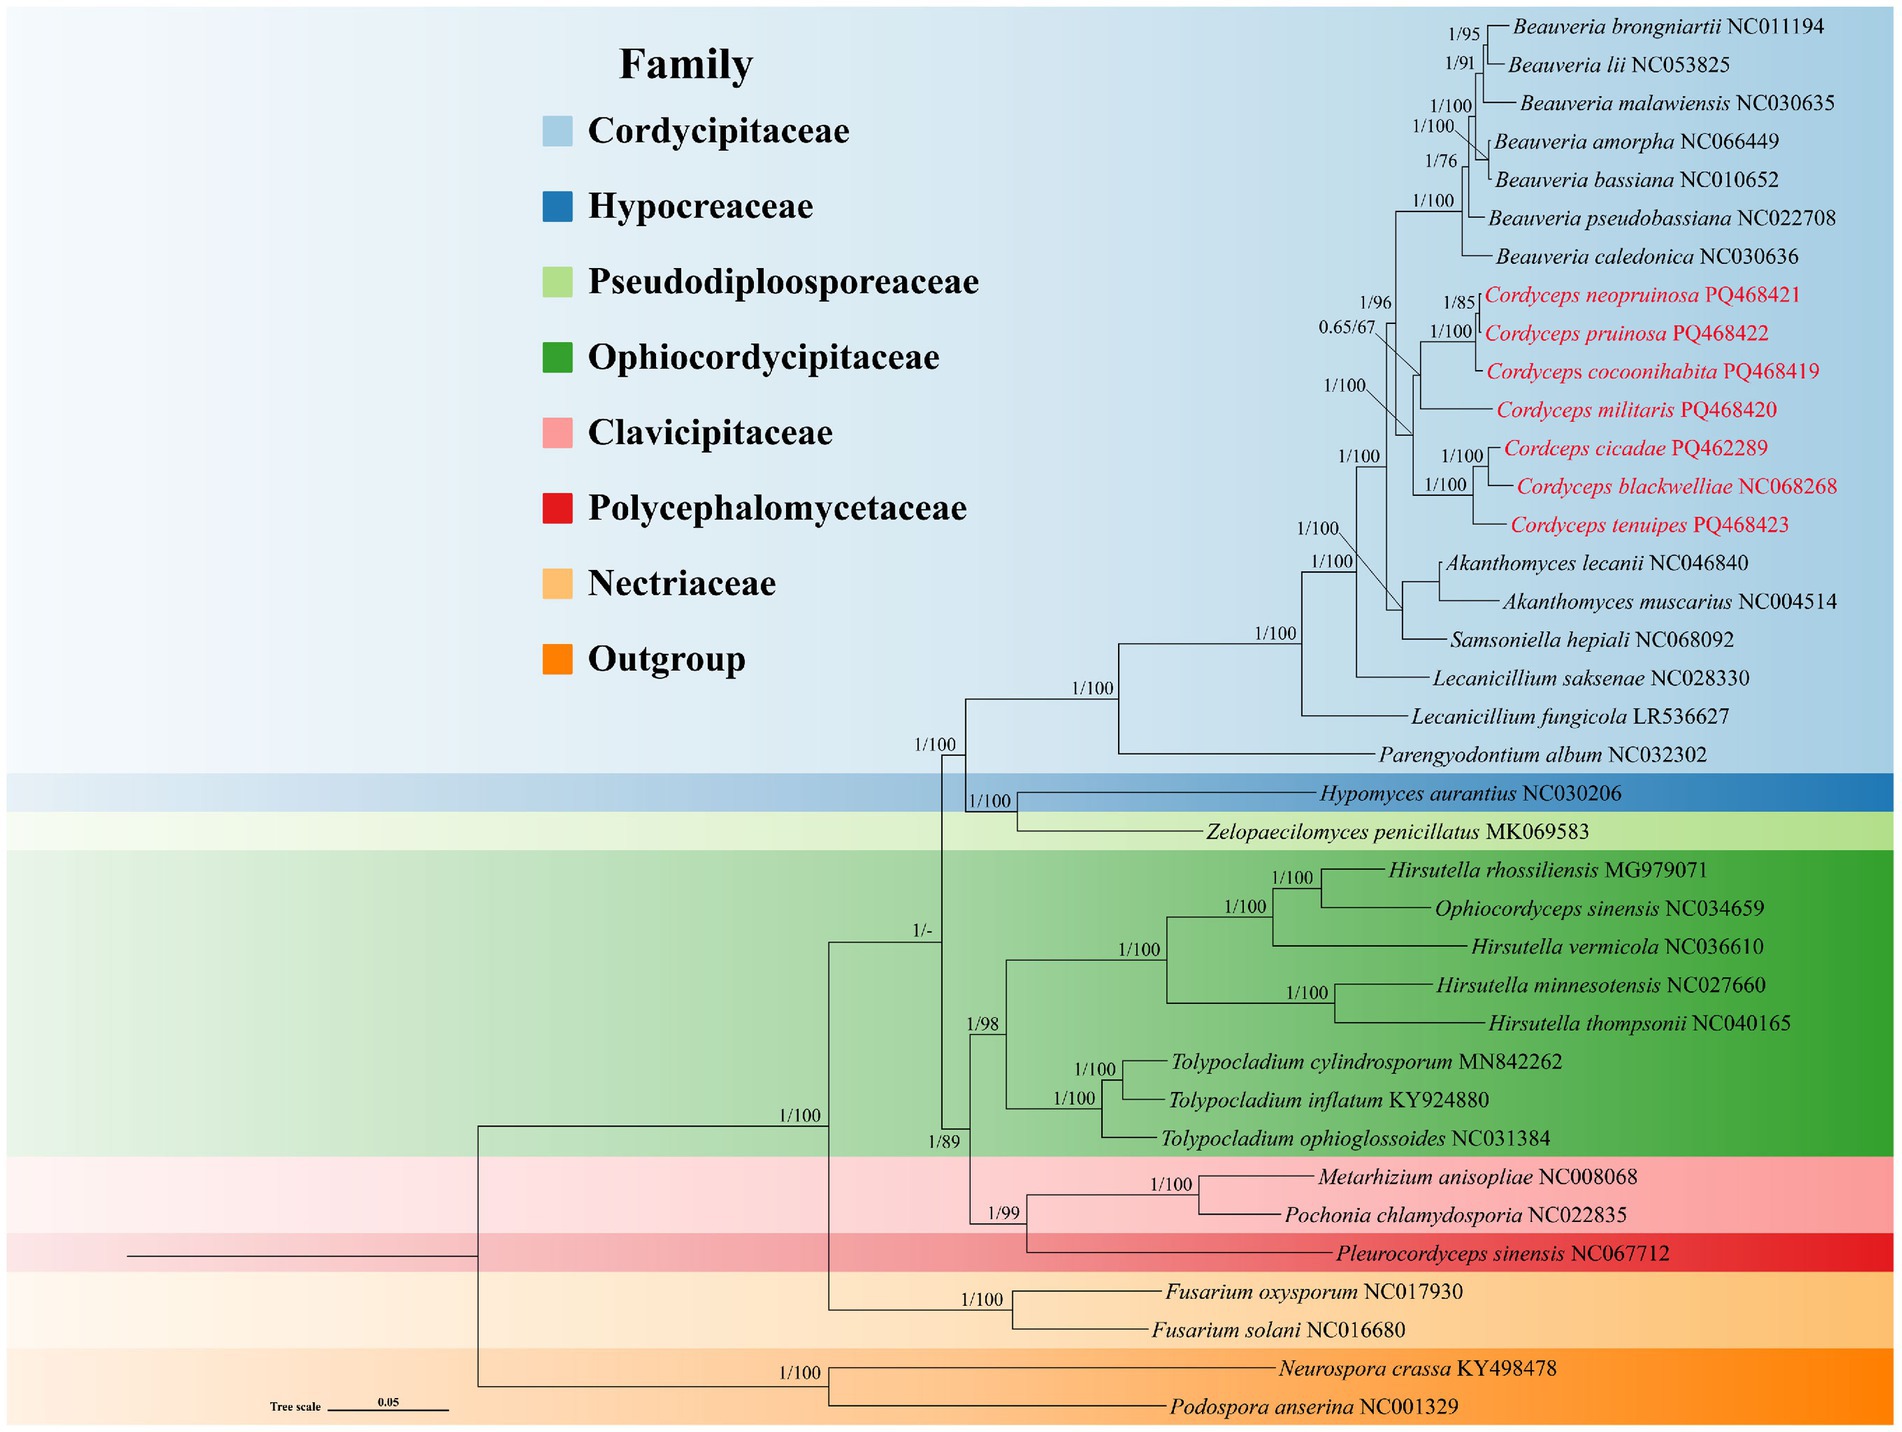
Figure 8. Phylogenetic relationships among 35 species of the order Hypocreales. The phylogenetic tree was constructed using 14 core PCGs through Bayesian inference (BI) and maximum likelihood (ML) methods, with Neurospora crassa and Podospora anserina designated as outgroups. The numbers at the nodes indicate Bayesian posterior probabilities (left) and bootstrap values (right). Detailed species names and accession numbers for the mitogenomes used in this phylogenetic analysis can be found in Supplementary Table S8.
Discussion
Variation in Cordyceps mitogenome size
In this study, we sequenced the mitogenomes of six Cordyceps species and performed comparative analysis with the previously published mitogenome of C. blackwelliae. Our analysis revealed significant size variation among the seven mitogenomes, with C. cicadae having the largest mitogenome (51,692 bp), while C. militaris exhibited the smallest (29,929 bp). This variability is consistent with patterns found in fungal mitogenomes, which are highly size-variable in eukaryotes due to dynamic intron changes, repetitive sequence accumulation, and non-conserved PCG variability (Al-Reedy et al., 2012; Mendoza et al., 2020; Deng et al., 2018; Wu et al., 2020). The largest mitogenome in C. cicadae contains 21 introns, which contribute a combined length of 23,347 bp, accounting for 45.16% of the entire genome. In contrast, the smallest mitogenome found in C. militaris contains only five introns, with a total length of 5,306 bp, accounting for 17.73% of the genome. The intron content plays a critical role in driving differences in mitogenome size among Cordyceps species. The evolutionary gain or loss of introns significantly contributes to the size variation in the genus Cordyceps. Interestingly, the mitogenome of C. cocoonihabita (45,058 bp) exhibits a 2,801 bp increase in size compared to that of C. blackwelliae (42,257 bp), despite containing 5,149 bp fewer intron nucleotides. This variation in size is likely attributed to the expansion or contraction of intergenic regions within the mitogenomes. Additionally, the expansion of non-conserved PCGs may further contribute to the overall increase in mitogenome size. The variation in mitogenome size among Cordyceps species is influenced by multiple factors, including but not limited to intron dynamics, changes in intergenic region length, and the accumulation of non-conserved PCGs.
Evolution of the Cordyceps mitogenome content
Our results revealed a complete set of conserved core PCGs across all Cordyceps species. Minimal variations were found in the length, base composition, codon usage frequency, and start/stop codons of these PCGs, indicating that the core PCGs of Cordyceps have remained relatively conserved throughout evolution. However, the rps3 gene displayed the highest Ka/Ks and K2P values among the 15 PCGs, indicating that it has undergone the most significant evolutionary changes. This phenomenon has also been reported in the mitochondria of other fungal species, though the selective pressures acting on rps3 remain unclear (Wang Y. B. et al., 2020; Wang X. et al., 2020). Notably, the mitogenomes of Cordyceps species have varying numbers of non-conserved PCGs, many of which encode homing endonucleases and proteins of unknown function. The diversity of these non-conserved PCGs is remarkable. For example, the closely related species C. blackwelliae, C. cicadae, and C. tenuipes all contain orf319, while C. cocoonihabita, C. neopruinosa, and C. pruinosa harbor orf293, orf299, and orf305, respectively. These ORFs encode LAGLIDADG homing endonucleases. The recurrent gain and loss of these homing endonucleases and other non-conserved genes in Cordyceps species indicate/suggest an ongoing evolutionary fluctuation in the content of mitogenomes. The sizes of tRNA genes in the seven Cordyceps mitogenomes range from 71 bp to 85 bp. The variation in size is primarily influenced by the presence and size of extra arms in trnL, trnS, and trnY. It is well established that mutations in tRNA genes can impact protein synthesis and are linked to various diseases (Blakely et al., 2013; Yarham et al., 2010).
We identified three types of repetitive sequences in the Cordyceps mitogenomes: simple repeats, interspersed repeats, and tandem repeats. The analysis revealed significant variation in the distribution of these repetitive elements among Cordyceps species, predominantly located in the intergenic regions and introns. Repetitive sequences in fungal mitogenomes have been previously shown to be associated with genomic rearrangements (Ma et al., 2022). Our synteny analysis demonstrated high conservation in the PCGs regions of Cordyceps mitogenomes, while substantial differences were found in the non-coding regions. These findings suggest that repetitive sequences likely play a crucial role in driving the divergence found in the non-coding regions among Cordyceps species.
Dynamics of introns in Cordyceps mitogenomes
Mitogenome size in fungi has been demonstrated to strongly correlate with the number of introns present among different lineages (Li et al., 2019). In this study, we detected a total of 84 introns within the mitogenomes of the seven Cordyceps species. The number of introns positively correlates with mitogenome size, indicating that introns are the primary contributors to mitogenome size variation. However, no significant correlation was found between the number of introns and the length of the corresponding host gene, indicating that specific sequence preferences rather than gene length determine the insertion sites for introns. Introns are unevenly distributed in PCGs and rRNA, with PCGs serving as the primary hosts. It is worth noting that the cox1 gene harbors the highest number of introns among Cordyceps species. Introns can be classified into distinct Pcls based on their insertion sites, with homologous introns being assigned to identical Pcl designations (Li et al., 2020b). Among the seven Cordyceps species, the Pcls (P212, P721, and P1057) of the cox1 gene were found to be the most prevalent. Throughout the evolutionary history of these species, intron loss has been noted, particularly in C. tenuipes and C. militaris, which only retain the P731 intron. In contrast, rare Pcls, such as P572 in the atp6 gene, P25 and P823 in the cob gene, P51 and P218 in the cox2 gene, P333, P219, and P631 in the cox3 gene, P505 in the nad4 gene, and P717 in the nad5 gene, were detected in a single Cordyceps species. Interestingly, these rare Pcls have also been identified in distantly related species, suggesting the possibility of horizontal gene transfer events. Previous studies have similarly documented horizontal intron transfer between different organelles (Turmel et al., 1995). Both intron loss and gain events were found within Cordyceps mitogenomes, highlighting the dynamic nature of intron evolution in the genus Cordyceps. These findings indicate significant variation in the distribution of introns among Cordyceps species. However, further investigation is required to understand the functional implications and evolutionary dynamics of these introns.
Molecular phylogeny
Mitogenomes have been extensively used in the phylogenetic analyses of animals, plants, and fungi (Jakovlić et al., 2023; Tang et al., 2023; Zhang et al., 2023; Zhong et al., 2022). The genus Cordyceps, widely distributed and species-rich within the family Cordycipitaceae (Panda and Swain, 2011), has been traditionally used as a medicinal tonic in Chinese medicine for thousands of years (Zhu et al., 1998). However, understanding the evolutionary relationships within Cordyceps has been challenging due to limited and overlapping morphological characteristics, as well as the inadequacies of multi-gene locus phylogenetics. Consequently, more robust tools that provide richer genetic information are needed for accurate phylogenetic analysis of Cordyceps. Mitogenomes have been widely used in population genetics and evolutionary research (Li et al., 2018). Because the independent evolution of mitogenomes and their large number of available molecular markers make mitogenomes the most attractive tool for analysing phylogenetic relationships between species (Jiang et al., 2017). Through comprehensive comparative analyses of mitochondrial genomes, our phylogenetic study strongly supports the close evolutionary relationships among the seven Cordyceps species. Phylogenetic tree for 35 species within the order Hypocreales was constructed using ML and BI methods, revealing high support rates for the major evolutionary branches. These results elucidate the phylogenetic relationships among Cordyceps species and clarify their phylogenetic positions within Hypocreales. This study provides valuable reference data for the classification and identification of Cordyceps species, contributing to a deeper understanding of interspecific variation within the genus. Additionally, the findings suggest phylogenetic relationships among Cordyceps species, offering genetic insights that could aid in the large-scale development and utilization of medicinally important Cordyceps species.
Conclusion
In this study, the complete mitogenomes of six Cordyceps species were sequenced, assembled, and annotated. Through a comprehensive comparative analysis of seven Cordyceps mitogenomes, we revealed both conserved and variable features. The results demonstrate significant variation in mitogenome size among Cordyceps species, primarily driven by differences in intron numbers, with intron loss events occurring during evolution processes. Based on intronic Pcls, PCGs are the primary hosts, with Pcls of the cox1 gene (P212, P721, and P1057) being the most prevalent. Additionally, various types of repeat sequences, including tandem repeats, dispersed repeats, and simple sequence repeats (SSRs), were predominantly detected within intergenic regions and introns. Among the core PCGs, rps3 exhibited positive signs or relaxed selection, while the non-conserved PCGs showed dynamic variations among Cordyceps species. Phylogenetic analysis confirmed that Cordyceps species form a distinct and well-supported lineage within the family Cordycipitaceae, thus highlighting the reliability of mitochondrial PCGs in resolving the phylogenetic relationships within the geus Cordyceps. This study contributes to the existing mitogenome data for Cordyceps species and provides new insights into inter-specific variations, thereby enhancing our understanding of the evolutionary dynamics and genetic diversity within Cordyceps.
Data availability statement
The datasets presented in this study can be found in online repositories. The names of the repository/repositories and accession number(s) can be found at: https://www.ncbi.nlm.nih.gov/genbank/, PQ462289, PQ468419, PQ468420, PQ468421, PQ468422, and PQ468423.
Author contributions
JJ: Visualization, Validation, Formal analysis, Writing – review & editing, Conceptualization, Supervision, Methodology, Writing – original draft, Software, Investigation. CL: Writing – review & editing, Software, Writing – original draft, Visualization. MT: Writing – review & editing, Data curation. HL: Writing – review & editing, Resources. ZY: Writing – review & editing, Resources. YaW: Writing – review & editing, Resources. ML: Data curation, Methodology, Conceptualization, Writing – review & editing. WZ: Methodology, Conceptualization, Project administration, Writing – review & editing, Funding acquisition. YuW: Project administration, Funding acquisition, Writing – review & editing, Conceptualization, Methodology.
Funding
The author(s) declare that financial support was received for the research and/or publication of this article. This research was funded by the Key project at central government level: The ability establishment of sustainable use for valuable Chinese medicine resources (2060302), the National Natural Science Foundation of China (32470015), and the Yunnan Revitalization Talent Support Program “Young Talent” Project (XDYC-QNRC-2022-0101).
Conflict of interest
The authors declare that the research was conducted in the absence of any commercial or financial relationships that could be construed as a potential conflict of interest.
Generative AI statement
The authors declare that no Gen AI was used in the creation of this manuscript.
Publisher’s note
All claims expressed in this article are solely those of the authors and do not necessarily represent those of their affiliated organizations, or those of the publisher, the editors and the reviewers. Any product that may be evaluated in this article, or claim that may be made by its manufacturer, is not guaranteed or endorsed by the publisher.
Supplementary material
The Supplementary material for this article can be found online at: https://www.frontiersin.org/articles/10.3389/fmicb.2025.1605218/full#supplementary-material
Footnotes
References
Adams, K. L., Qiu, Y. L., Stoutemyer, M., and Palmer, J. D. (2002). Punctuated evolution of mitochondrial gene content: high and variable rates of mitochondrial gene loss and transfer to the nucleus during angiosperm evolution. Proc. Natl. Acad. Sci. USA 99, 9905–9912. doi: 10.1073/pnas.042694899
Al-Reedy, R. M., Malireddy, R., Dillman, C. B., and Kennell, J. C. (2012). Comparative analysis of fusarium mitochondrial genomes reveals a highly variable region that encodes an exceptionally large open reading frame. Fungal Genet. Biol. 49, 2–14. doi: 10.1016/j.fgb.2011.11.008
Beier, S., Thiel, T., Münch, T., Scholz, U., and Mascher, M. (2017). MISA-web: a web server for microsatellite prediction. Bioinformatics 33, 2583–2585. doi: 10.1093/bioinformatics/btx198
Benson, G. (1999). Tandem repeats finder: a program to analyze DNA sequences. Nucleic Acids Res. 27, 573–580. doi: 10.1093/nar/27.2.573
Bernt, M., Donath, A., Jühling, F., Externbrink, F., Florentz, C., Fritzsch, G., et al. (2013). MITOS: improved de novo metazoan mitochondrial genome annotation. Mol. Phylogenet. Evol. 69, 313–319. doi: 10.1016/j.ympev.2012.08.023
Blakely, E. L., Yarham, J. W., Alston, C. L., Craig, K., Poulton, J., Brierley, C., et al. (2013). Pathogenic mitochondrial tRNA point mutations: nine novel mutations affirm their importance as a cause of mitochondrial disease. Hum. Mutat. 34, 1260–1268. doi: 10.1002/humu.22358
Burger, G., Gray, M. W., and Lang, B. F. (2003). Mitochondrial genomes: anything goes. Trends Genet. 19, 709–716. doi: 10.1016/j.tig.2003.10.012
Caspermeyer, J. (2016). MEGA evolutionary software re-engineered to handle today’s big data demands. Mol. Biol. Evol. 33:1887.1-1887. doi: 10.1093/molbev/msw074
Chen, C., Li, Q., Fu, R., Wang, J., Deng, G., Chen, X., et al. (2021). Comparative mitochondrial genome analysis reveals intron dynamics and gene rearrangements in two Trametes species. Sci. Rep. 11:2569. doi: 10.1038/s41598-021-82040-7
Cheng, J., Luo, Q., Ren, Y., Luo, Z., Liao, W., Wang, X., et al. (2021). Panorama of intron dynamics and gene rearrangements in the phylum Basidiomycota as revealed by the complete mitochondrial genome of Turbinellus floccosus. Appl. Microbiol. Biotechnol. 105, 2017–2032. doi: 10.1007/s00253-021-11153-w
Corradi, N., and Bonen, L. (2012). Mitochondrial genome invaders: an unselfish role as molecular markers. New Phytol. 196, 963–965. doi: 10.1111/j.1469-8137.2012.04354.x
Deng, Y., Hsiang, T., Li, S., Lin, L., Wang, Q., Chen, Q., et al. (2018). Comparison of the mitochondrial genome sequences of six Annulohypoxylon stygium isolates suggests short fragment insertions as a potential factor leading to larger genomic size. Front. Microbiol. 9:2079. doi: 10.3389/fmicb.2018.02079
Dierckxsens, N., Mardulyn, P., and Smits, G. (2017). NOVOPlasty: de novo assembly of organelle genomes from whole genome data. Nucleic Acids Res. 45:e18. doi: 10.1093/nar/gkw955
Fan, W., Zhang, S., and Zhang, Y. (2019). The complete mitochondrial genome of the Chan-hua fungus Isaria cicadae: a tale of intron evolution in Cordycipitaceae. Environ. Microbiol. 21, 864–879. doi: 10.1111/1462-2920.14522
Férandon, C., Moukha, S., Callac, P., Benedetto, J. P., Castroviejo, M., and Barroso, G. (2010). The Agaricus bisporus cox1 gene: the longest mitochondrial gene and the largest reservoir of mitochondrial group i introns. PLoS One 5:e14048. doi: 10.1371/journal.pone.0014048
Forsythe, E. S., Sharbrough, J., Havird, J. C., Warren, J. M., and Sloan, D. B. (2019). CyMIRA: the Cytonuclear molecular interactions reference for Arabidopsis. Genome Biol. Evol. 11, 2194–2202. doi: 10.1093/gbe/evz144
Galtier, N., Nabholz, B., Glémin, S., and Hurst, G. D. (2009). Mitochondrial DNA as a marker of molecular diversity: a reappraisal. Mol. Ecol. 18, 4541–4550. doi: 10.1111/j.1365-294X.2009.04380.x
Huang, W., Feng, H., Tu, W., Xiong, C., Jin, X., Li, P., et al. (2021). Comparative Mitogenomic analysis reveals dynamics of intron within and between Tricholoma species and phylogeny of Basidiomycota. Front. Genet. 12:534871. doi: 10.3389/fgene.2021.534871
Husami, A., Slone, J., Brown, J., Bromwell, M., Valencia, C. A., and Huang, T. (2020). Clinical utility of whole genome sequencing for the detection of mitochondrial genome mutations. J. Genet. Genomics 47, 167–169. doi: 10.1016/j.jgg.2020.03.001
Jakovlić, I., Zou, H., Ye, T., Zhang, H., Liu, X., Xiang, C.-Y., et al. (2023). Mitogenomic evolutionary rates in bilateria are influenced by parasitic lifestyle and locomotory capacity. Nat. Commun. 14:6307. doi: 10.1038/s41467-023-42095-8
Jiang, L., Zhao, L., Cheng, D., Zhu, L., Zhang, M., Ruan, Q., et al. (2017). The complete mitochondrial genome sequence of the Sichuan digging frog, Kaloula rugifera (Anura: Microhylidae) and its phylogenetic implications. Gene 626, 367–375. doi: 10.1016/j.gene.2017.05.039
Jin, J. J., Yu, W. B., Yang, J. B., Song, Y., dePamphilis, C. W., Yi, T.-S., et al. (2020). GetOrganelle: a fast and versatile toolkit for accurate de novo assembly of organelle genomes. Genome Biol. 21:241. doi: 10.1186/s13059-020-02154-5
Johnston, I. G., and Williams, B. P. (2016). Evolutionary inference across eukaryotes identifies specific pressures favoring mitochondrial gene retention. Cell Syst. 2, 101–111. doi: 10.1016/j.cels.2016.01.013
Kalyaanamoorthy, S., Minh, B. Q., Wong, T. K. F., von Haeseler, A., and Jermiin, L. S. (2017). ModelFinder: fast model selection for accurate phylogenetic estimates. Nat. Methods 14, 587–589. doi: 10.1038/nmeth.4285
Katoh, K., Rozewicki, J., and Yamada, K. D. (2019). MAFFT online service: multiple sequence alignment, interactive sequence choice and visualization. Brief. Bioinform. 20, 1160–1166. doi: 10.1093/bib/bbx108
Kepler, R. M., Luangsa-Ard, J. J., Hywel-Jones, N. L., Quandt, C. A., Sung, G. H., Rehner, S. A., et al. (2017). A phylogenetically-based nomenclature for Cordycipitaceae (Hypocreales). IMA Fungus 8, 335–353. doi: 10.5598/imafungus.2017.08.02.08
Kepler, R. M., Luangsa-Ard, J. J., Hywel-Jones, N. L., Quandt, C. A., Sung, G. H., Rehner, S. A., et al. (2020). Multigene phylogeny of the family Cordycipitaceae (Hypocreales): new taxa and the new systematic position of the Chinese cordycipitoid fungus Paecilomyces hepiali. Fungal. Divers. 103, 1–46.
Kleine, T., Maier, U. G., and Leister, D. (2009). DNA transfer from organelles to the nucleus: the idiosyncratic genetics of endosymbiosis. Annu. Rev. Plant Biol. 60, 115–138. doi: 10.1146/annurev.arplant.043008.092119
Kurtz, S. (2001). REputer: the manifold applications of repeat analysis on a genomic scale. Nucleic Acids Res. 29, 4633–4642. doi: 10.1093/nar/29.22.4633
Li, Q., He, X., Ren, Y., Xiong, C., Jin, X., Peng, L., et al. (2020a). Comparative Mitogenome analysis reveals mitochondrial genome differentiation in ectomycorrhizal and Asymbiotic amanita species. Front. Microbiol. 11:1382. doi: 10.3389/fmicb.2020.01382
Li, Q., Liao, M., Yang, M., Xiong, C., Jin, X., Chen, Z., et al. (2018). Characterization of the mitochondrial genomes of three species in the ectomycorrhizal genus Cantharellus and phylogeny of Agaricomycetes. Int. J. Biol. Macromol. 118, 756–769. doi: 10.1016/j.ijbiomac.2018.06.129
Li, Q., Ren, Y., Xiang, D., Shi, X., Zhao, J., Peng, L., et al. (2020b). Comparative mitogenome analysis of two ectomycorrhizal fungi (Paxillus) reveals gene rearrangement, intron dynamics, and phylogeny of basidiomycetes. IMA Fungus 11:12. doi: 10.1186/s43008-020-00038-8
Li, Q., Wu, P., Li, L., Feng, H., Tu, W., Bao, Z., et al. (2021). The first eleven mitochondrial genomes from the ectomycorrhizal fungal genus (boletus) reveal intron loss and gene rearrangement. Int. J. Biol. Macromol. 172, 560–572. doi: 10.1016/j.ijbiomac.2021.01.087
Li, Q., Xiang, D., Wan, Y., Wu, Q., Wu, X., Ma, C., et al. (2019). The complete mitochondrial genomes of five important medicinal Ganoderma species: features, evolution, and phylogeny. Int. J. Biol. Macromol. 139, 397–408. doi: 10.1016/j.ijbiomac.2019.08.003
Li, Q., Zhang, T., Li, L., Bao, Z., Tu, W., Xiang, P., et al. (2022). Comparative mitogenomic analysis reveals intraspecific, interspecific variations and genetic diversity of medical fungus Ganoderma. J. Fungi (Basel) 8:781. doi: 10.3390/jof8080781
Lohse, M., Drechsel, O., and Bock, R. (2007). OrganellarGenomeDRAW (OGDRAW): a tool for the easy generation of high-quality custom graphical maps of plastid and mitochondrial genomes. Curr. Genet. 52, 267–274. doi: 10.1007/s00294-007-0161-y
Lowe, T. M., and Chan, P. P. (2016). tRNAscan-SE on-line: integrating search and context for analysis of transfer RNA genes. Nucleic Acids Res. 44, W54–W57. doi: 10.1093/nar/gkw413
Ma, Q., Geng, Y., Li, Q., Cheng, C., Zang, R., Guo, Y., et al. (2022). Comparative mitochondrial genome analyses reveal conserved gene arrangement but massive expansion/contraction in two closely related Exserohilum pathogens. Comput. Struct. Biotechnol. J. 20, 1456–1469. doi: 10.1016/j.csbj.2022.03.016
Martin, F. N., Bensasson, D., Tyler, B. M., and Boore, J. L. (2007). Mitochondrial genome sequences and comparative genomics of Phytophthora ramorum and P. Sojae. Curr. Genet. 51, 285–296. doi: 10.1007/s00294-007-0121-6
Mendoza, H., Perlin, M. H., and Schirawski, J. (2020). Mitochondrial inheritance in Phytopathogenic Fungi-everything is known, or is it? Int. J. Mol. Sci. 21:3883. doi: 10.3390/ijms21113883
Millar, A. H., Heazlewood, J. L., Kristensen, B. K., Braun, H. P., and Møller, I. M. (2005). The plant mitochondrial proteome. Trends Plant Sci. 10, 36–43. doi: 10.1016/j.tplants.2004.12.002
Mongkolsamrit, S., Noisripoom, W., Tasanathai, K., Tasanathai, K., Khonsanit, A., Thanakitpipattana, D., et al. (2020). Molecular phylogeny and morphology reveal cryptic species in Blackwellomyces and Cordyceps (Cordycipitaceae) from Thailand. Mycol. Prog. 19, 957–983. doi: 10.1007/s11557-020-01615-2
Nguyen, L. T., Schmidt, H. A., von Haeseler, A., and Minh, B. Q. (2015). IQ-TREE: a fast and effective stochastic algorithm for estimating maximum-likelihood phylogenies. Mol. Biol. Evol. 32, 268–274. doi: 10.1093/molbev/msu300
Panda, A. K., and Swain, K. C. (2011). Traditional uses and medicinal potential of Cordyceps sinensis of Sikkim. J. Ayurveda Integr. Med. 2, 9–13. doi: 10.4103/0975-9476.78183
Paquin, B., Laforest, M. J., Forget, L., Roewer, I., Wang, Z., Longcore, J., et al. (1997). The fungal mitochondrial genome project: evolution of fungal mitochondrial genomes and their gene expression. Curr. Genet. 31, 380–395. doi: 10.1007/s002940050220
Perna, N. T., and Kocher, T. D. (1995). Patterns of nucleotide composition at fourfold degenerate sites of animal mitochondrial genomes. J. Mol. Evol. 41, 353–358. doi: 10.1007/BF00186547
Ronquist, F., Teslenko, M., van der Mark, P., Ayres, D. L., Darling, A., Höhna, S., et al. (2012). MrBayes 3.2: efficient Bayesian phylogenetic inference and model choice across a large model space. Syst. Biol. 61, 539–542. doi: 10.1093/sysbio/sys029
Sandor, S., Zhang, Y., and Xu, J. (2018). Fungal mitochondrial genomes and genetic polymorphisms. Appl. Microbiol. Biotechnol. 102, 9433–9448. doi: 10.1007/s00253-018-9350-5
Sung, G. H., Hywel-Jones, N. L., Sung, J. M., Luangsa-Ard, J. J., Shrestha, B., and Spatafora, J. W. (2007). Phylogenetic classification of Cordyceps and the Clavicipitaceous fungi. Stud. Mycol. 57, 5–59. doi: 10.3114/sim.2007.57.01
Tang, J. Y., Wei, R., Zhang, X. C., and Xiang, Q. P. (2023). Mitogenome-based phylogenomics provides insights into the positions of the enigmatic sinensis group and the sanguinolenta group in Selaginellaceae (lycophyte). Mol. Phylogenet. Evol. 179:107673. doi: 10.1016/j.ympev.2022.107673
Timmis, J. N., Ayliffe, M. A., Huang, C. Y., and Martin, W. (2004). Endosymbiotic gene transfer: organelle genomes forge eukaryotic chromosomes. Nat. Rev. Genet. 5, 123–135. doi: 10.1038/nrg1271
Turmel, M., Côté, V., Otis, C., Mercier, J. P., Gray, M. W., Lonergan, K. M., et al. (1995). Evolutionary transfer of ORF-containing group I introns between different subcellular compartments (chloroplast and mitochondrion). Mol. Biol. Evol. 12, 533–545. doi: 10.1093/oxfordjournals.molbev.a040234
Vaidya, G., Lohman, D. J., and Meier, R. (2011). SequenceMatrix: concatenation software for the fast assembly of multi-gene datasets with character set and codon information. Cladistics 27, 171–180. doi: 10.1111/j.1096-0031.2010.00329.x
Valach, M., Burger, G., Gray, M. W., and Lang, B. F. (2014). Widespread occurrence of organelle genome-encoded 5S rRNAs including permuted molecules. Nucleic Acids Res. 42, 13764–13777. doi: 10.1093/nar/gku1266
van Wijk, K. J., and Baginsky, S. (2011). Plastid proteomics in higher plants: current state and future goals. Plant Physiol. 155, 1578–1588. doi: 10.1104/pp.111.172932
Wang, X., Jia, L., Wang, M., Yang, H., Chen, M., Li, X., et al. (2020). The complete mitochondrial genome of medicinal fungus Taiwanofungus camphoratus reveals gene rearrangements and intron dynamics of Polyporales. Sci. Rep. 10:16500. doi: 10.1038/s41598-020-73461-x
Wang, Y., Tang, H., Debarry, J. D., Tan, X., Li, J., Wang, X., et al. (2012). MCScanX: a toolkit for detection and evolutionary analysis of gene synteny and collinearity. Nucleic Acids Res. 40:e49. doi: 10.1093/nar/gkr1293
Wang, Y. B., Wang, Y., Fan, Q., Duan, D. E., Zhang, G. D., Dai, R. Q., et al. (2020). Multigene phylogeny of the family Cordycipitaceae (Hypocreales): new taxa and the new systematic position of the Chinese cordycipitoid fungus Paecilomyces hepiali. Fungal Divers. 103, 1–46. doi: 10.1007/s13225-020-00457-3
Wang, Y., and Xu, J. (2020). Mitochondrial genome polymorphisms in the human pathogenic fungus Cryptococcus neoformans. Front. Microbiol. 11:706. doi: 10.3389/fmicb.2020.00706
Wu, P., Bao, Z., Tu, W., Li, L., Xiong, C., Jin, X., et al. (2020). The mitogenomes of two saprophytic Boletales species (Coniophora) reveals intron dynamics and accumulation of plasmid-derived and non-conserved genes. Comput. Struct. Biotechnol. J. 19, 401–414. doi: 10.1016/j.csbj.2020.12.041
Yarham, J. W., Elson, J. L., Blakely, E. L., McFarland, R., and Taylor, R. W. (2010). Mitochondrial tRNA mutations and disease. Wiley Interdiscip. Rev. RNA 1, 304–324. doi: 10.1002/wrna.27
Yue, K., Ye, M., Lin, X., and Zhou, Z. (2013). The artificial cultivation of medicinal Caterpillar fungus, Ophiocordyceps sinensis (Ascomycetes): a review. Int. J. Med. Mushrooms 15, 425–434. doi: 10.1615/IntJMedMushr.v15.i5.10
Zhang, Z. (2022). KaKs_Calculator 3.0: calculating selective pressure on coding and non-coding sequences. Genomics Proteomics Bioinformatics 20, 536–540. doi: 10.1016/j.gpb.2021.12.002
Zhang, D., Gao, F., Jakovlić, I., Zou, H., Zhang, J., Li, W. X., et al. (2020). PhyloSuite: an integrated and scalable desktop platform for streamlined molecular sequence data management and evolutionary phylogenetics studies. Mol. Ecol. Resour. 20, 348–355. doi: 10.1111/1755-0998.13096
Zhang, J., Wang, P., Wei, X., Li, L., Cheng, H., Wu, Y., et al. (2015). A metabolomics approach for authentication of Ophiocordyceps sinensis by liquid chromatography coupled with quadrupole time-of-flight mass spectrometry. Food Res. Int. 76, 489–497. doi: 10.1016/j.foodres.2015.07.025
Zhang, S., Wang, X. N., Zhang, X. L., Liu, X. Z., and Zhang, Y. J. (2017). Complete mitochondrial genome of the endophytic fungus Pestalotiopsis fici: features and evolution. Appl. Microbiol. Biotechnol. 101, 1593–1604. doi: 10.1007/s00253-017-8112-0
Zhang, M. Z., Xu, J. P., Callac, P., Chen, M. Y., Wu, Q., Wach, M., et al. (2023). Insight into the evolutionary and domesticated history of the most widely cultivated mushroom Agaricus bisporus via mitogenome sequences of 361 global strains. BMC Genomics 24:182. doi: 10.1186/s12864-023-09257-w
Zhang, S., and Zhang, Y. J. (2019). Proposal of a new nomenclature for introns in protein-coding genes in fungal mitogenomes. IMA Fungus 10:15. doi: 10.1186/s43008-019-0015-5
Zhang, Y., Zhang, S., Zhang, G., Liu, X., Wang, C., and Xu, J. (2015). Comparison of mitochondrial genomes provides insights into intron dynamics and evolution in the caterpillar fungus Cordyceps militaris. Fungal Genet. Biol. 77, 95–107. doi: 10.1016/j.fgb.2015.04.009
Zhong, C., Jin, J., Zhou, R., Liu, H., Xie, J., Wan, D., et al. (2022). Comparative analysis of the complete mitochondrial genomes of four cordyceps fungi. Ecol. Evol. 12:e8818. doi: 10.1002/ece3.8818
Keywords: Cordyceps, mitochondrial genome, intron, phylogenetic analysis, comparative genomics
Citation: Jia J, Li C, Tang M, Liao H, Yang Z, Wang Y, Li M, Zeng W and Wang Y (2025) Mitochondrial genome characterization, evolution and intron dynamics of the entomopathogenic genus Cordyceps. Front. Microbiol. 16:1605218. doi: 10.3389/fmicb.2025.1605218
Edited by:
Zhangnv Yang, Zhejiang Center for Disease Control and Prevention (Zhejiang CDC), ChinaReviewed by:
Alexander N. Ignatov, Peoples’ Friendship University of Russia, RussiaLuca Degradi, University of Milan, Italy
Copyright © 2025 Jia, Li, Tang, Liao, Yang, Wang, Li, Zeng and Wang. This is an open-access article distributed under the terms of the Creative Commons Attribution License (CC BY). The use, distribution or reproduction in other forums is permitted, provided the original author(s) and the copyright owner(s) are credited and that the original publication in this journal is cited, in accordance with accepted academic practice. No use, distribution or reproduction is permitted which does not comply with these terms.
*Correspondence: Wenbo Zeng, emVuZ3dlbmJvaGVyYkAxNjMuY29t; Yuanbing Wang, d2FuZ3l1YW5iaW5nQG1haWwua2liLmFjLmNu
†These authors have contributed equally to this work