 Yan M. Crane
 Charles F. Crane1,3†
 Brandon J. Schemerhorn
- 1Crop Production and Pest Control Research Unit, USDA-ARS, West Lafayette, IN, United States
- 2Department of Entomology, Purdue University, West Lafayette, IN, United States
- 3Department of Botany and Plant Pathology, Purdue University, West Lafayette, IN, United States
Introduction: The microbiome of greenbug aphid (Schizaphis graminum (Rondani)) was investigated in regard to greenbug biotype, collection date, host species, and host cultivar.
Methods: DNA samples were collected from biotypes E and K feeding on 17 cultivars belonging to five host plant species, namely wheat, barley, rye, sorghum, and the goatgrass Aegilops triuncialis. Samples were taken immediately before infestation and two, four, and eight days thereafter. The V5-V7 hypervariable region of 16S rDNA was PCR amplified, Illumina sequenced, and aligned to a curated database of bacterial 16S rDNA sequences.
Results and discussion: The almost universal intracellular endosymbiont of aphids, Buchnera aphidicola, comprised 78.24 to 99.99% of the read counts among samples, largely because of its high copy number of genomes per bacteroid. Abundant non-Buchnera genera included Pseudomonas, Rhodanobacter, Massilia, and Enterobacter. Read counts of eight of 78 examined genera were more than 90% restricted to a single replicate of a single treatment. Shannon entropy was highest in biotype K and on the barley host, but it did not vary significantly among dates post infestation. Unweighted UniFrac distances most significantly varied with biotype, host plant species, infestation time, and almost all of their interactions. Weighted UniFrac and Jaccard distances varied less significantly. By counts of differentially populated genera, the factors biotype, host plant species, infestation time, and host plant resistance genes to greenbug, were consecutively less important. Functional analysis with PICRUSt2 illustrated a diminution of respiratory electron transport and long-chain fatty acids in the Buchnera endosymbiont, reflecting adaptation to an intracellular environment.
Introduction
Greenbug aphid [Schizaphis graminum (Rondani)] is a serious insect pest of small grain crops (Royer et al., 2015). It reduces yields by direct feeding and by transmitting plant-pathogenic viruses such as Cereal Yellow Dwarf Virus (CYDV). At the turn of the century, economic losses to greenbug exceeded $100 million per year to wheat and sorghum in the southern Great Plains of the United States (Eddleman et al., 1999). There exist several sources of resistance to greenbug, including the Gb gene in Aegilops (Zhu et al., 2005) and Rsg1 and Rsg2 in barley (Armstrong et al., 2016; Xu et al., 2023). Greenbug variants, traditionally termed biotypes, have been defined by their ability to infest different wheat and sorghum cultivars (Porter et al., 1997; Bowling et al., 1998). Currently 12 biotypes have been designated A through K and TX1 (Armstrong et al., 2016), but a thorough worldwide study of greenbug populations had not been conducted, and possibly many more biotypes remain to be discovered. Greenbug gene expression has been examined by RNA-seq in relation to biotype, time, and CYDV carrier status (Crane et al., 2023).
Aphid microbiomes exist in several sites: the gut, the specialized bacteriocyte cells, the hemolymph, the exterior cuticle, and the immediately local phylloplane. Each has its own conditions and potentially supports a distinct microflora. Almost all aphid taxa harbor Buchnera aphidicola, an intracellular mutualist bacterium that is restricted to bacteriocytes and is vertically transmitted from mother to offspring (Braendle et al., 2003). Other bacteria, such as Hamiltonella defensa (Gupta and Nair, 2020), Rickettsia sp. (Deng et al., 2019), and Candidatus Fukatsuia symbiotica (Michalik et al., 2014; Manzano-Marín et al., 2023) have also been found to inhabit bacteriocytes, sometimes with Buchnera and sometimes separately. The roles of these endosymbionts in aphid nutrition, reproduction, and defense against fungi and parasitoids have been extensively investigated (Csorba et al., 2024). However, the gut is where the most generalist and diverse microflora is to be expected and where a diverse community of apparent commensals exists (Guyomar et al., 2018). Here the microflora is in direct contact with the aphid’s nutritionally deficient diet of plant sap, and here the properties of the host plant can directly affect the competition among microbial taxa (Wilson and Duncan, 2015). These properties include carbohydrate and protein concentration, amounts of antimicrobial peptides and phenolics, pH, and levels of minerals and vitamins (Casteel and Hansen, 2014; Gupta and Nair, 2020; Yun et al., 2014).
Amplification of hypervariable regions within 16S rRNA genes is a popular and effective way to census bacterial populations (Johnson et al., 2019), since the 16S locus is universally present in bacteria (Geng et al., 2022; Haro et al., 2021), highly conserved primer sequences exist (Haro et al., 2021; Thijs et al., 2017), large databases of 16S amplicon sequences are available, the method does not depend upon gene expression, and there are software packages (e.g., QIIME2) specifically designed to process such sequences. However, the method is not perfect, since repeated amplification cycles can magnify the effect of slight variation in primer binding and elongation efficiency, and since some bacterial genomes are present in high copy numbers per cell (notably including Buchnera aphidicola; Komaki and Ishikawa, 1999). Amplicon sequencing will miss any taxa whose 16S hypervariable regions cannot be amplified for any reason.
Previous studies of aphid microbiomes vary in the amount of variation reported within species and among localities. Only a subset deals with host plant as an experimental variable. In general, reports that include rare taxa find more variation among localities or host plants than reports that exclude rare taxa. This reflects the generally high fraction of Buchnera among read counts. When Buchnera comprises 70% or more of reads, there is less opportunity for rare taxa to reach a 1% threshold of abundance that is often used to filter out possible contaminants.
On the basis of Bray–Curtis dissimilarities among 70 samples obtained from 44 host aphid species, McLean et al. (2019) concluded that aphid microbiomes were more correlated with aphid species than with host plant, and this correlation was highly significant for both secondary symbionts and non-symbionts. They found a lesser correlation between aphid microbiomes and host plant habit (tree versus herb) that could reflect the taxonomic relationships of the aphids that infest each. McLean et al. (2019) also noted that the abundance and diversity of non-symbiotic microbes were less in aphids than in insects with richer diets. Microbiome correlation to aphid taxon is necessarily higher in aphid taxa that seasonally alternate between hosts. For example, Wu et al. (2018) reported that 171 microbial operational taxonomic units (OTUs) were shared between summer and winter generations of Schlechtendalia chinensis, while 12 OTUs were restricted to winter and 11 were restricted to summer. The winter and summer host plants differ radically: a moss (Plagiomnium maximoviczii) versus sumac (Rhus chinensis).
Using field-collected specimens, Gallo-Franco et al. (2019) found that weighted and unweighted UniFrac distances of microbiomes of Aphis gossypii and Myzus persicae were more clustered together within aphid species than within host Capsicum species. Also with field-collected specimens, Fakhour et al. (2018) found greater similarity of non-Buchnera microflora within each of five aphid species than within collection localities. Zepeda-Paulo et al. (2018) found variation among field collections in secondary symbiont frequency in Sitobion avenae but essentially no variation among field collections of Rhopalosiphum padi, where Buchnera accounted for at least 98.5% of read counts. Xu et al. (2021) found little effect of collection locale or host plant on alpha diversity or Bray–Curtis dissimilarity in 92 samples of Myzus persicae field collected from 16 host plant families and 30 sites across China. However, Buchnera aphidicola dominated all of the samples, and seven secondary symbionts accounted for most of the remaining counts of taxa that exceeded 1% of the total in any one sample. Each of these seven genera monopolized the non-Buchnera counts in at least one sample. Therefore, the taxonomic composition of the Myzus microbiome could reflect host plant variation or aphid genetics or location history.
Ma et al. (2021) compared Aphis gossypii field-collected on hibiscus and pomegranate with samples of 50 individuals transferred from hibiscus to cotton, muskmelon, and cucumber and then propagated for 10 generations. Because all of these samples were taken from naturally established populations in the field, they were potentially genetically heterogenous. They found that the microbiomes’ taxonomic composition diverged after transfer to the second host plant species and that the Shannon index (within-sample diversity) increased after transfer to muskmelon and cucumber. Thus, in this case a change in diet did affect the microbiome. It is noteworthy that Ma et al. (2021) did not restrict analysis to taxa with at least 1% abundance in at least one sample, whereas Xu et al. (2021) did. If bacterial ploidy increases during the evolution of obligate endosymbiosis as it did in Buchnera (Komaki and Ishikawa, 1999), it is possible that the combined counts of Buchnera and the newly evolved co-obligate endosymbiont would push the maximum count of any other taxon below 1%.
He et al. (2021) conducted a similar experiment with Myzus persicae, which was transferred from Chinese cabbage (the control species) to eggplant, pepper, or tobacco and allowed to feed and reproduce for 14 days. The mean Shannon index increased approximately three-fold on pepper relative to eggplant, tobacco, or Chinese cabbage. Bray–Curtis dissimilarities clustered together for aphids on Chinese cabbage. The taxonomic composition shifted from abundant Buchnera on Chinese cabbage to abundant Pseudomonas on eggplant and tobacco. Pepper had about half as much Pseudomonas as Buchnera. Quantitative PCR showed that the absolute abundance of Buchnera decreased on eggplant and tobacco and remained about the same on pepper as in Chinese cabbage. The ratio of total bacterial to aphid DNA was approximately constant over the four diets.
Two studies considered the effect of diet on the same aphid population. Ikuze et al. (2024) reported family-level frequencies of bacteria from samples of the same Melanaphis sacchari population placed on Melanaphis resistant and susceptible sorghum inbreds. The microbiome was sampled seven and 14 days later. While the report is sparse with details and has inconsistencies with respect to the families reported versus collection time and host plant resistance, it appears that the resistant and susceptible diets did not significantly affect alpha diversity according to the Chao1 index, which increased from day 7 to day 14 on both diets. The pattern of bacterial family frequencies was similar between diets, but the susceptible diet favored Sphingomonadaceae and Pseudomonadaceae at the expense of Burkholderiaceae and Rhizobiaceae. Cassone et al. (2015) looked specifically at Buchnera transcription and titer in Aphis glycines feeding on healthy soybean plants and soybean plants infected with bean pod mottle virus, which aphids do not transmit. They found reduced transcription and titer on the infected plants, which were associated with reduced aphid fecundity. Buchnera transcription recovered when aphids were moved from infected to healthy soybean plants. They noted that the reduced aphid fitness also occurred on soybean infected with two other viruses and attributed the reduction to the dietary quality of infected soybean phloem.
Because of greenbug’s economic importance, multiple resistance genes have been sought and found in landraces and wild relatives of wheat, barley, and sorghum. Among others, these genes include Gb1 through Gb6 in wheat (Porter et al., 1994), Gbx1 and Gbz in wheat wild relative Aegilops triuncialis (Zhu et al., 2005), Rsg1 and Rsg2 in barley (Xu et al., 2023), and SgR1 in sorghum (Zhang et al., 2024). The mechanisms of action of these resistance genes are generally unknown, although SgR1 encodes a leucine-rich repeat receptor-like protein that is expressed in transgenic Arabidopsis thaliana exposed to aphid feeding (Zhang et al., 2024). Their net effect is to inhibit greenbug growth and reproduction, and in doing so they potentially affect the composition and activity of the greenbug microbiome.
Although the type strain of Buchnera aphidicola was chosen from Schizaphis graminum (Munson et al., 1991) and early genomic studies on B. aphidicola were conducted on the S. graminum strain (Lai and Baumann, 1992; Munson et al., 1993; Rauhbakhsh and Baumann, 1995), the greenbug microbiome seems not to have been reported to date. Here we have investigated how host plant species and cultivar affect the bacterial flora of two greenbug biotypes, E and K, over time. The hosts were 17 cultivars from five species, sorghum, wheat, rye, barley and Aegilops triuncialis. Read counts from the PCR-amplified V5-V7 region of 16S rDNA served as a proxy for bacterial populations.
The experiment addressed several hypotheses: (1) that the microbiome responds to host greenbug genetics, here biotype; (2) that the microbiome similarity is related to phylogenetic relationship of the host plants; (3) that the microbiome responds to host-plant resistance genes; and (4) that the microbiome responds to elapsed time. The null hypothesis in each case is that the microbiome does not respond to that factor. The experiment was not designed to elucidate the mechanism by which each factor influenced the microbiome, in that the host plant was not analyzed for any of the plausible mechanisms (nutrition, physical impediments, antibiosis) that could influence the greenbug microbiome, and the greenbugs themselves were not weighed or measured.
Materials and methods
Sample sources and collection
Greenbug biotypes E and K were obtained from Dr. Gary Puterka of the USDA-ARS Wheat, Peanut and Other Field Crops Research Unit in Stillwater, Oklahoma. A single apterous female of biotype E founded the population of biotype E, and a single apterous female of biotype K founded the population of biotype K. Both parthenogenetic populations were increased in isolation to hundreds of individuals on wheat cv. “Newton” prior to the experiment. There were four cycles of increase where adult aphids were placed on “Newton” and allowed to give birth for two days before the adults were removed. Eight days elapsed from the start of the fourth cycle to the beginning of the experiment. Therefore, the populations were somewhat synchronized by age. The experiment was conducted in two growth chambers, one at 25°C on a 12-h day and 12-h night cycle with 60% humidity for sorghum and the other at 20°C on a 14-h day and 8-h night cycle with 50% humidity for the other four host plant species. There were 17 cultivars among five host plant species as listed in Table 1. Each combination of biotype and host cultivar was isolated in a separate cage containing four potted plants. Without vernalization, host plants did not flower or undergo visible phase change during the experiment and remained free of visible disease.
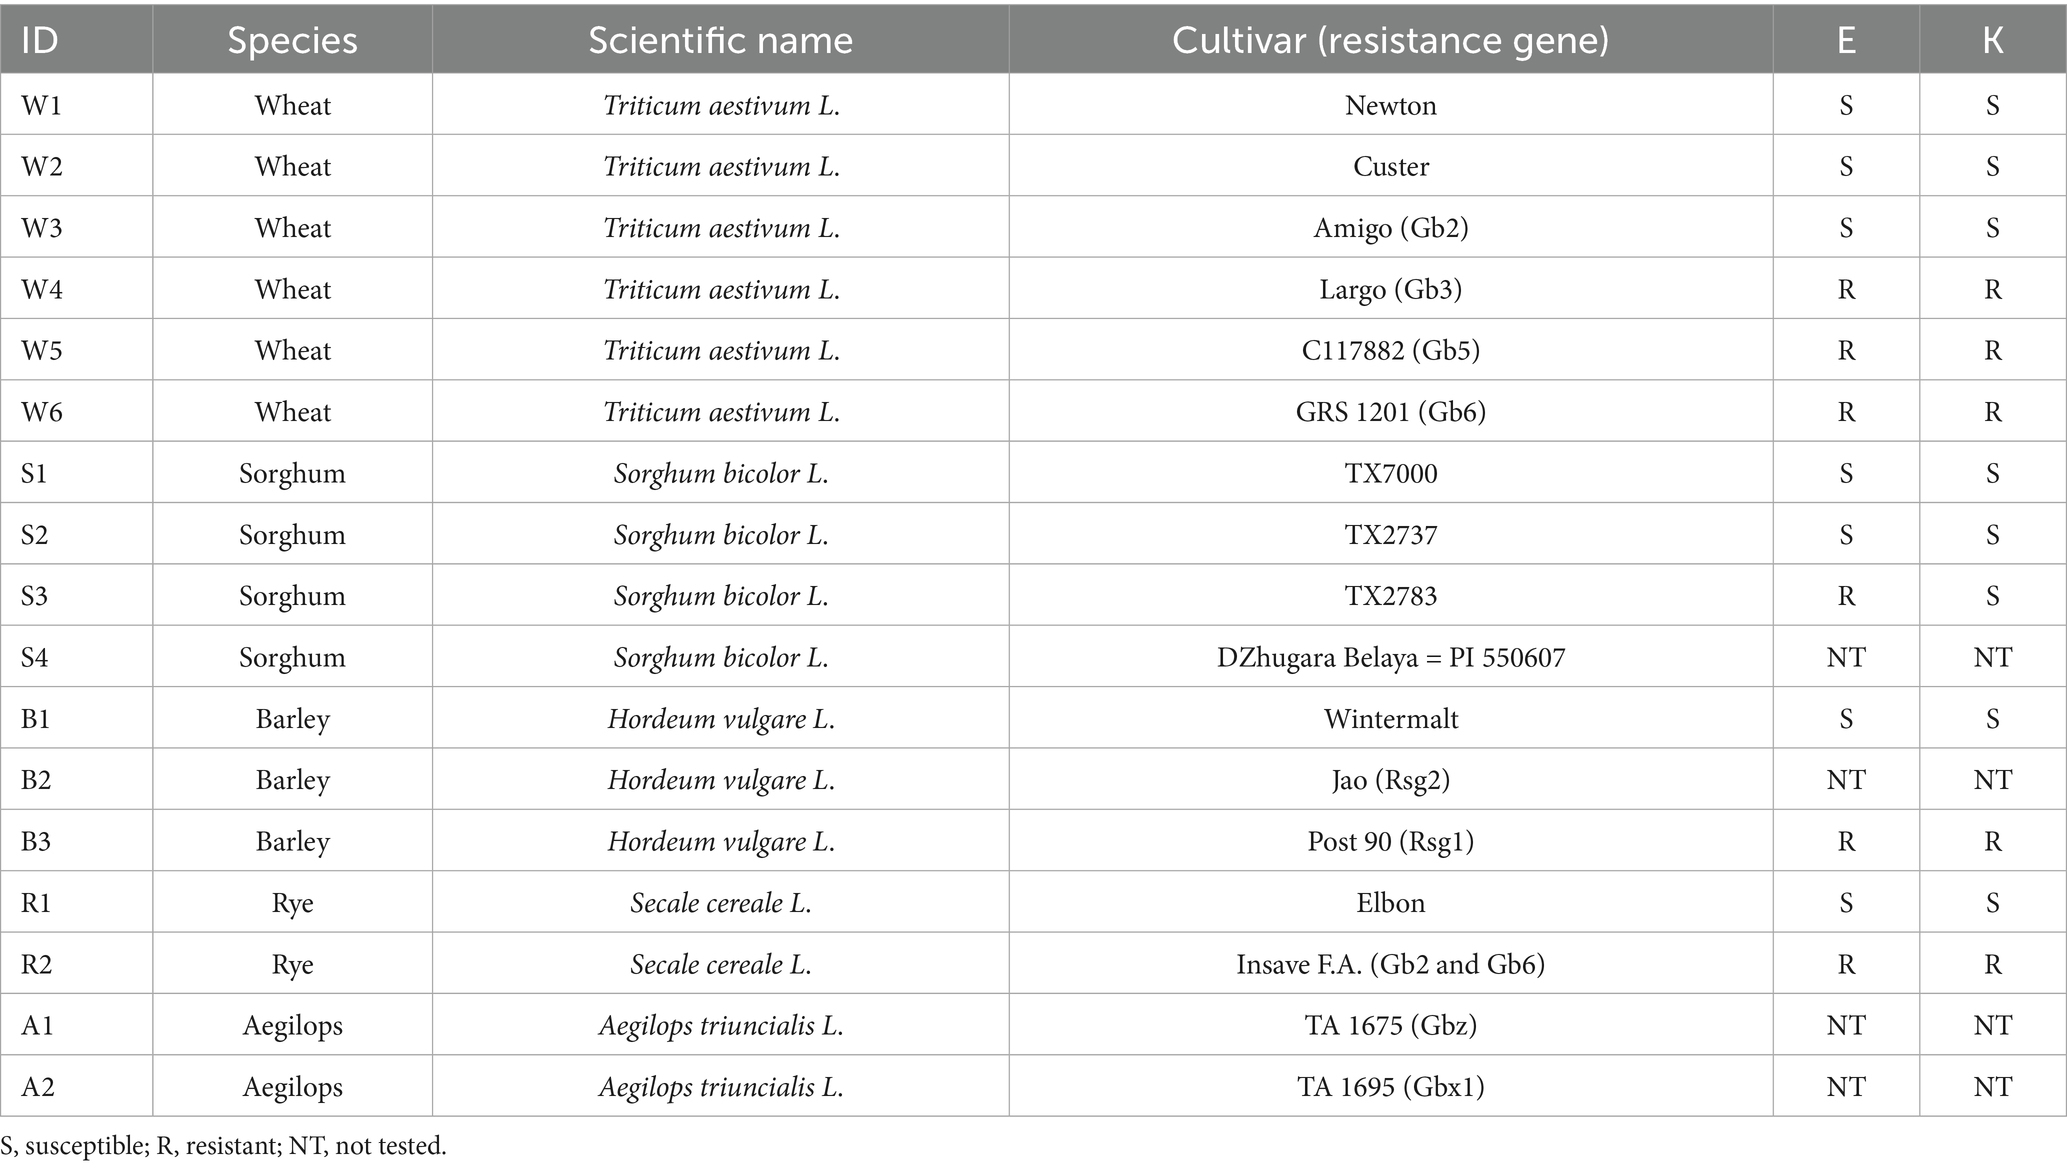
Table 1. Host list with susceptibility to biotypes E and K as listed by Armstrong et al. (2016).
The initial, day zero sampling was taken from aphids on “Newton” wheat. On day zero, approximately 15 (10 to 20) individual greenbugs were placed on each of four plants of each cultivar. Greenbugs were sampled from three of the four plants 2, 4, and 8 days after placement. Each plant constituted a biological replicate. Most samples consisted of 10 to 15 greenbugs, but samples ranged from two to 20 individuals. We attempted to equalize the mass of greenbugs used for library construction by sampling more individuals of small greenbugs and fewer individuals of large greenbugs. For each plant, the collected aphids were wrapped together in labeled aluminum foil, dropped into liquid nitrogen, and then stored at −80°C. There were 312 samples in all.
Preparation for sequencing
Total greenbug DNA was extracted by using the DNeasy Blood and Tissue Kit for DNA Isolation (Qiagen, Germantown, MD) following its instructions. The hypervariable V5–V7 region of 16S rDNA was amplified using the 799F (AACMGGATTAGATACCCKG) and 1193R (ACGTCATCCCCACCTTCC) primers (Haro et al., 2021). The MyFi™ DNA polymerase kit (Bioline, Taunton, MA) was used for PCR with a protocol modified from Haro et al. (2021). Initial denaturation at 95° for 5 min preceded 30 cycles of 95°C for 60s, 55°C for 45 s and extension at 72°C for 60 s. Final elongation was at 72°C for 8 min followed by holding at 4°C. The expectedly 394 bp PCR product was confirmed by electrophoresis in 1.5% agarose gels with SYBR safe DNA stain (Thermo Fisher Scientific, Waltham, MA).
Sequencing and data analysis
16S rDNA was sequenced using the Illumina MiSeq platform. After quality filtering, reads were processed through the software pipeline of RTL Genomics (Lubbock, TX), which is detailed at http://www.rtlgenomics.com/docs/Data_Analysis_Methodology.pdf. This pipeline invoked programs for clustering at 97% identity, denoising, eliminating chimeric reads, alignment to a company-curated subset of NCBI rRNA accessions, and referring operational taxonomic units to taxa. Beyond that, OTU read counts were aggregated by genus, host plant species and cultivar, aphid biotype, and sampling date, for barplot display with ggplot2 in R. The pipeline normalized all samples to the lowest read count of 301,562 by using scaling with ranked subsampling (Gomes et al., 2024). A rarefaction survey was performed at intervals of 25,000 counts. It removed OTUs that mapped to Ralstonia, which has been recognized as a common contaminant in DNA extraction kits (Salter et al., 2014). It also removed unidentifiable OTUs and rare OTUs that comprised less than 0.01% of the total reads in that particular sample. The resulting filtered OTUs were subjected to standard tests of taxonomic diversity in R packages vegan (Oksanen et al., 2025) and phyloseq (McMurdie and Holmes, 2013): Shannon entropy (Shannon, 1948), Hill1 diversity (Hill, 1973), weighted (Lozupone et al., 2006) and unweighted UniFrac (Lozupone and Knight, 2005) with principal coordinates analysis. An analysis of variance (ANOVA) was performed with read counts grouped by greenbug biotype, host plant species, host cultivar, and time from infestation. Pairwise comparisons of read counts for host plant species, infestation durations, and combinations of biotype and host plant species, were tested with Tukey’s Honest Significant Difference test (Tukey, 1949). ANOVA and Tukey’s HSD were also performed for the same groups with Shannon entropy and Hill1 diversity. PERMANOVA (R program Adonis by McMurdie and Holmes, 2013) was performed with weighted UniFrac, unweighted UniFrac, and Jaccard dissimilarities (Jaccard, 1901) among the same groups used in ANOVA. Differential “expression” (population) was tested with ancombc (Lin and Peddada, 2020) with zero cut = 0.80, struc zero = false, and neg lb = false.
The effect of greenbug-resistance genes was analyzed separately from the effects of biotype, cultivar, and collection date. The resistance genotype was known for 13 cultivars as listed in Table 1, and it was the same for biotypes E and K in 12 of them. For these 12 cultivars, the reads obtained from RTL Genomics were imported into QIIME2 (Bolyen et al., 2019) and denoised with dada2 (Callahan et al., 2016). By using custom perl scripts, the resulting representative reads (amplified sequence variants, ASV) were extracted to 20 fasta files and simultaneously aligned to SILVA 138.2 (Quast et al., 2013; Yilmaz et al., 2014) with blastn (Camacho et al., 2009). A taxon was assigned to each ASV on the basis of closest blast hit. The frequency table of ASVs and the taxonomic assignment were imported back into QIIME 2, where the ASVs were collapsed to genera. The table of frequencies grouped by taxa was then subjected to ancombc. A second run of ancombc was performed on the frequency table after removing the Buchnera counts. A perl script collated the ensuing log2 fold-changes and p-values into a table.
Physiological functions of the microbiome were inferred from taxon abundance with PICRUSt2 (Douglas et al., 2020). PICRUSt2 was run on the representative sequences (amplified sequence variants, ASV) output by DADA2 (Callahan et al., 2016) in QIIME2 (Bolyen et al., 2019). There were separate runs for Buchnera ASV, non-Buchnera ASV, and all ASV together. Perl scripts were written to fill out the pathway names and rank them by reported pathway activity so that Buchnera could be compared to the rest of the microbiome.
Results
Read counts per sample varied from 301,562 to 853,907, with a mean of 603,858 and median of 608,703. Figure 1 is a rarefaction plot generated by repeated subsampling of quality-filtered read counts and identification by alignment to the in-house database of 16S rRNA sequences. The counts were used before normalization to 301,562 counts across samples, so each curve is limited to its total read count. The least diverse samples saturated more than the more diverse samples, but no sample exhausted its own taxonomic variation. At least 1,150 operational taxonomic units (OTUs) were observed in the most diverse samples. Overall there were 1,511 OTUs representing 78 genera.
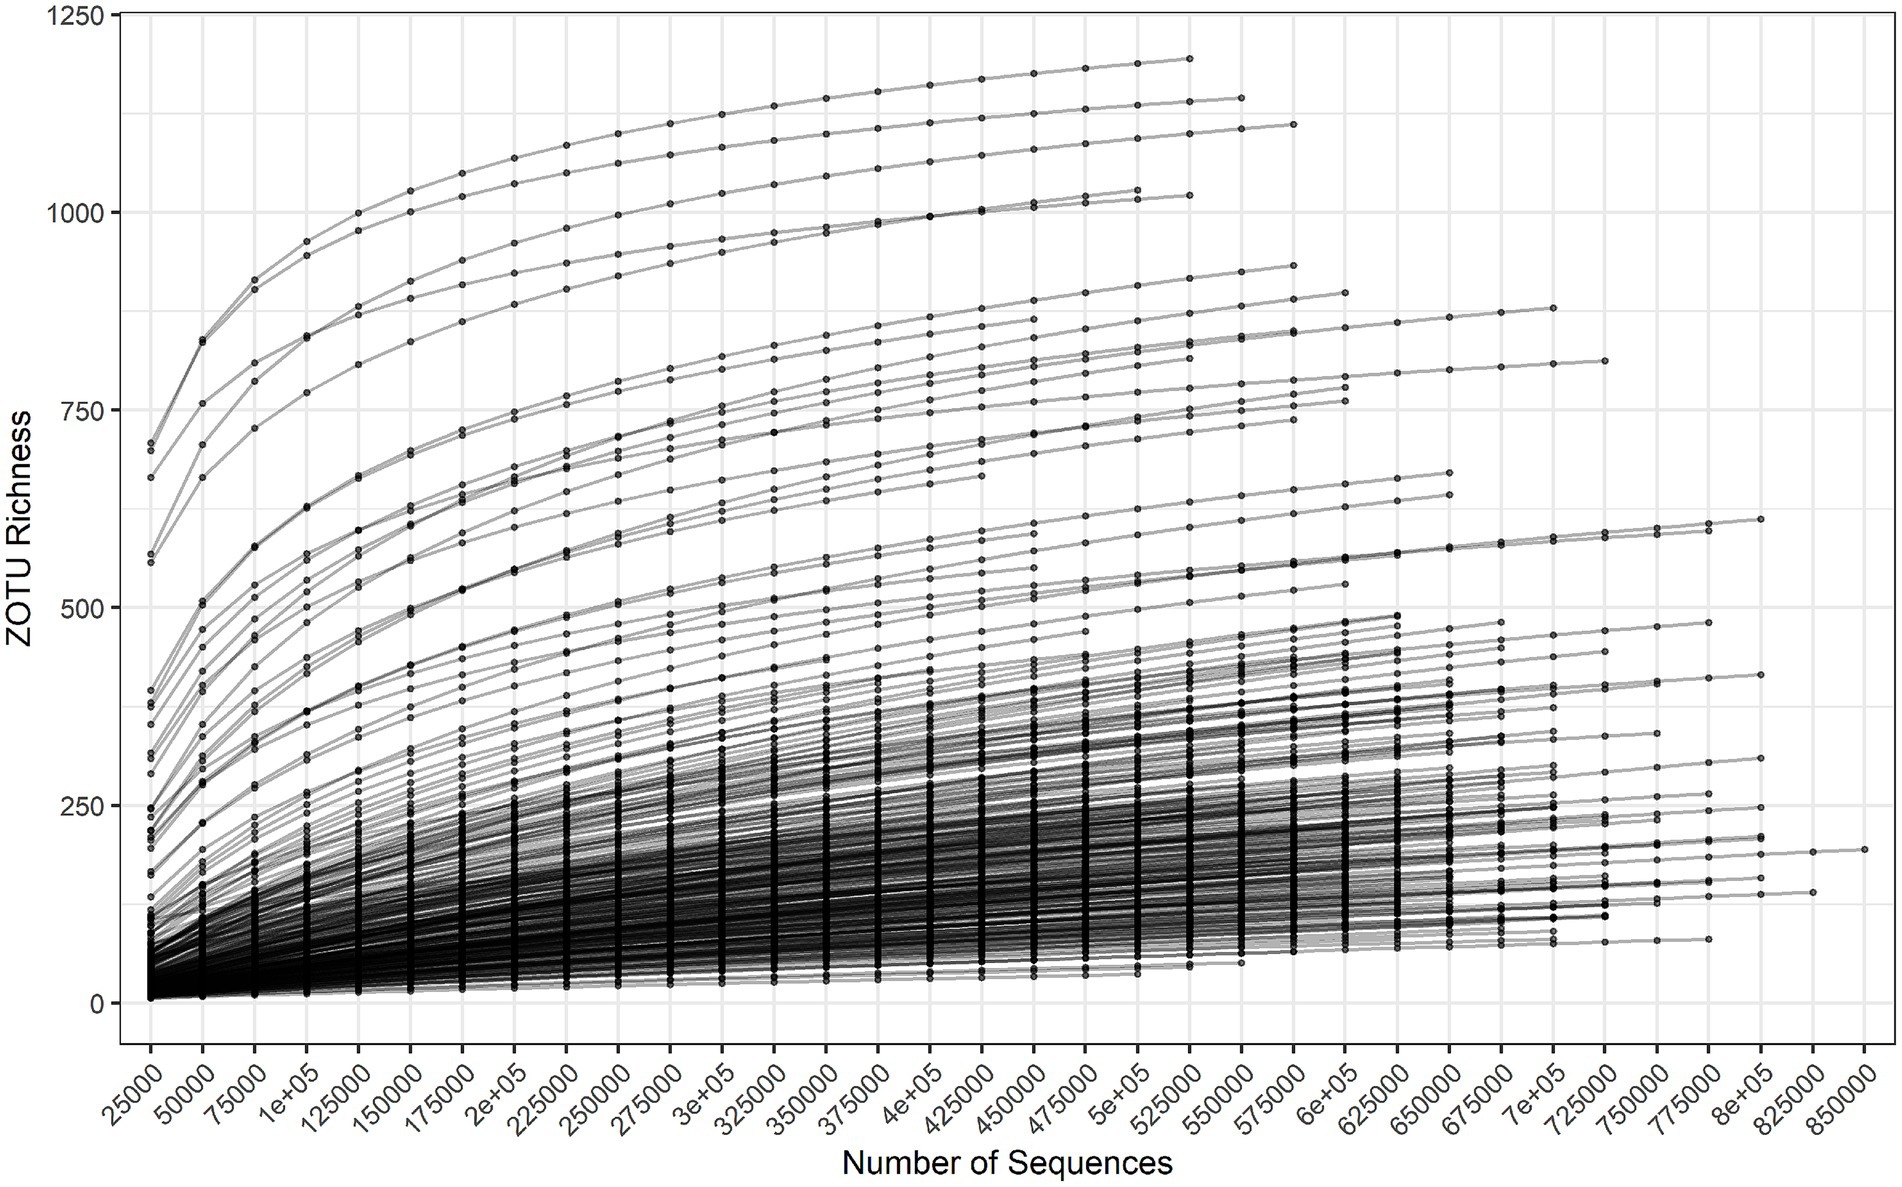
Figure 1. Rarefaction survey of OTU richness, subsampling from 25,000 to 850,000 reads in increments of 25,000 reads.
Only 15 out of 78 identified genera had over 10,000 total counts (Table 2). Buchnera aphidicola dominated the counts, outnumbering second-place Pseudomonas by a factor of 196 and third-place Rhodanobacter by a factor of 840. Buchnera was also by far the most evenly distributed genus among the conditions and replicates, being the only genus with less than 10% of its total counts in any single condition or replicate. At the other extreme, several genera, such as Deinococcus, Sphingobium, and Luteibacter, were almost entirely restricted to a single replicate despite having thousands of counts (Table 2). With the exception of one unidentified species of Serratia, no OTUs mapped to genera of secondary endosymbionts in aphids (Hamiltonella, Regiella, Arsenophonus, Candidatus Fukatsuia, Rickettsia, Rickettsiella, and Wolbachia). To display the relative abundance of other genera, stacked barplots were prepared with Buchnera counts excluded. Figure 2 gives the fractions of the 30 most abundant genera other than Buchnera in relation to time and aphid biotype over all hosts. Pseudomonas peaked in both biotypes on days 2 and 8, while Rhodanobacter was prominent on day 0 in biotype E and day 4 in biotype K. Enterobacter was most common in biotype E on day 4, and the related genus Escherichia was at its maximum in both biotypes on day 4. In biotype K, Chryseobacterium, Luteibacter, and Pantoea peaked on day 4, Massilia peaked on days 4 and 8, while Bacillus peaked on day 2 and Pedobacter peaked on day 8. Chryseobacterium was also high in biotype E on day 4. Unclassified genera, which were identified only to a higher taxonomic level, were most abundant in both biotypes on day 0.
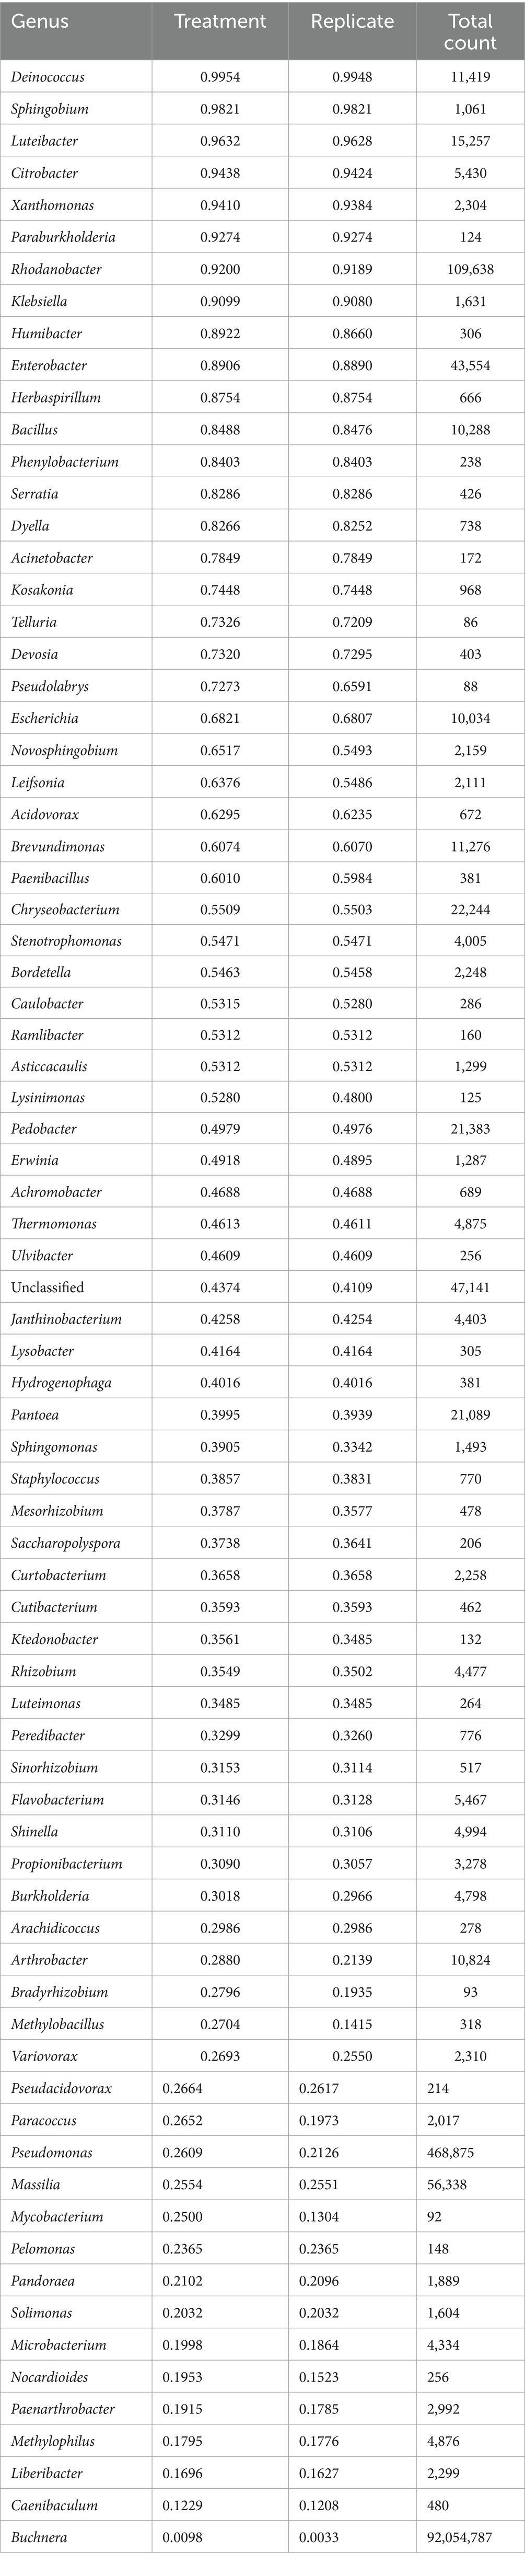
Table 2. Fraction of a taxon’s total counts restricted to a single treatment (combination of a single biotype, cultivar, and timepoint) or replicate within a treatment.
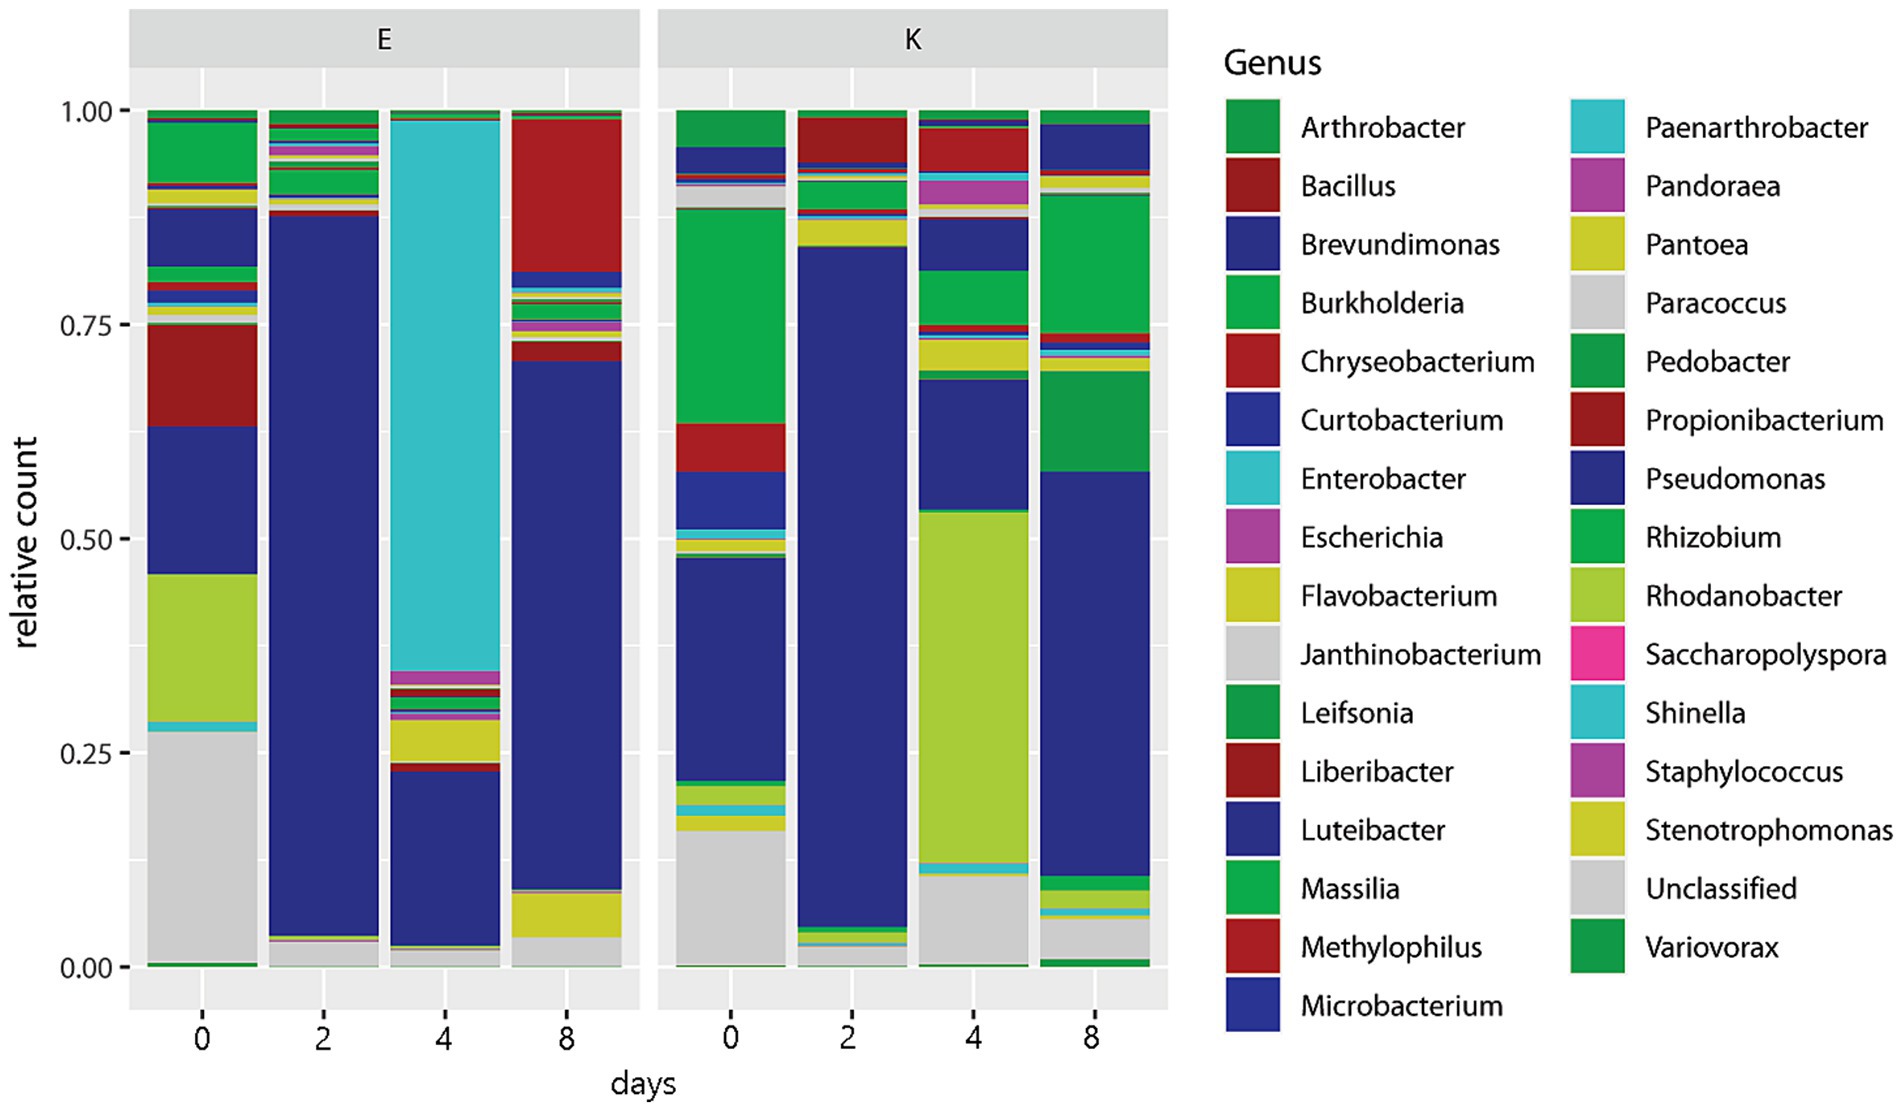
Figure 2. Barplot of 30 most abundant genera sorted by greenbug biotype and days post infestation.
Figure 3 displays the relative abundances by host plant species, summing over timepoints, cultivars, and aphid biotypes. Sorghum differed from the other four species in having less Pseudomonas and more Rhodanobacter. Luteibacter, Chryseobacterium, Pantoea, Massilia, Escherichia, and “unclassified” were also prominent in sorghum. The other four host plant species are all related and belong to the tribe Triticeae, and their non-Buchnera microbiomes were dominated by Pseudomonas. In barley, Enterobacter, Massilia, Pedobacter, Pantoea, Brevundimonas, and Bacillus were consecutively less prominent. In rye, Chryseobacterium, Stenotrophomonas, Massilia, Curtobacterium, and Pantoea were consecutively less abundant. In Aegilops, Propionibacterium, Arthrobacter, Methylophilus, Staphylococcus, and Paenarthrobacter were consecutively less abundant. In wheat, Massilia, Arthrobacter, Burkholderia, Rhodanobacter, and Janthinobacterium were consecutively less abundant.
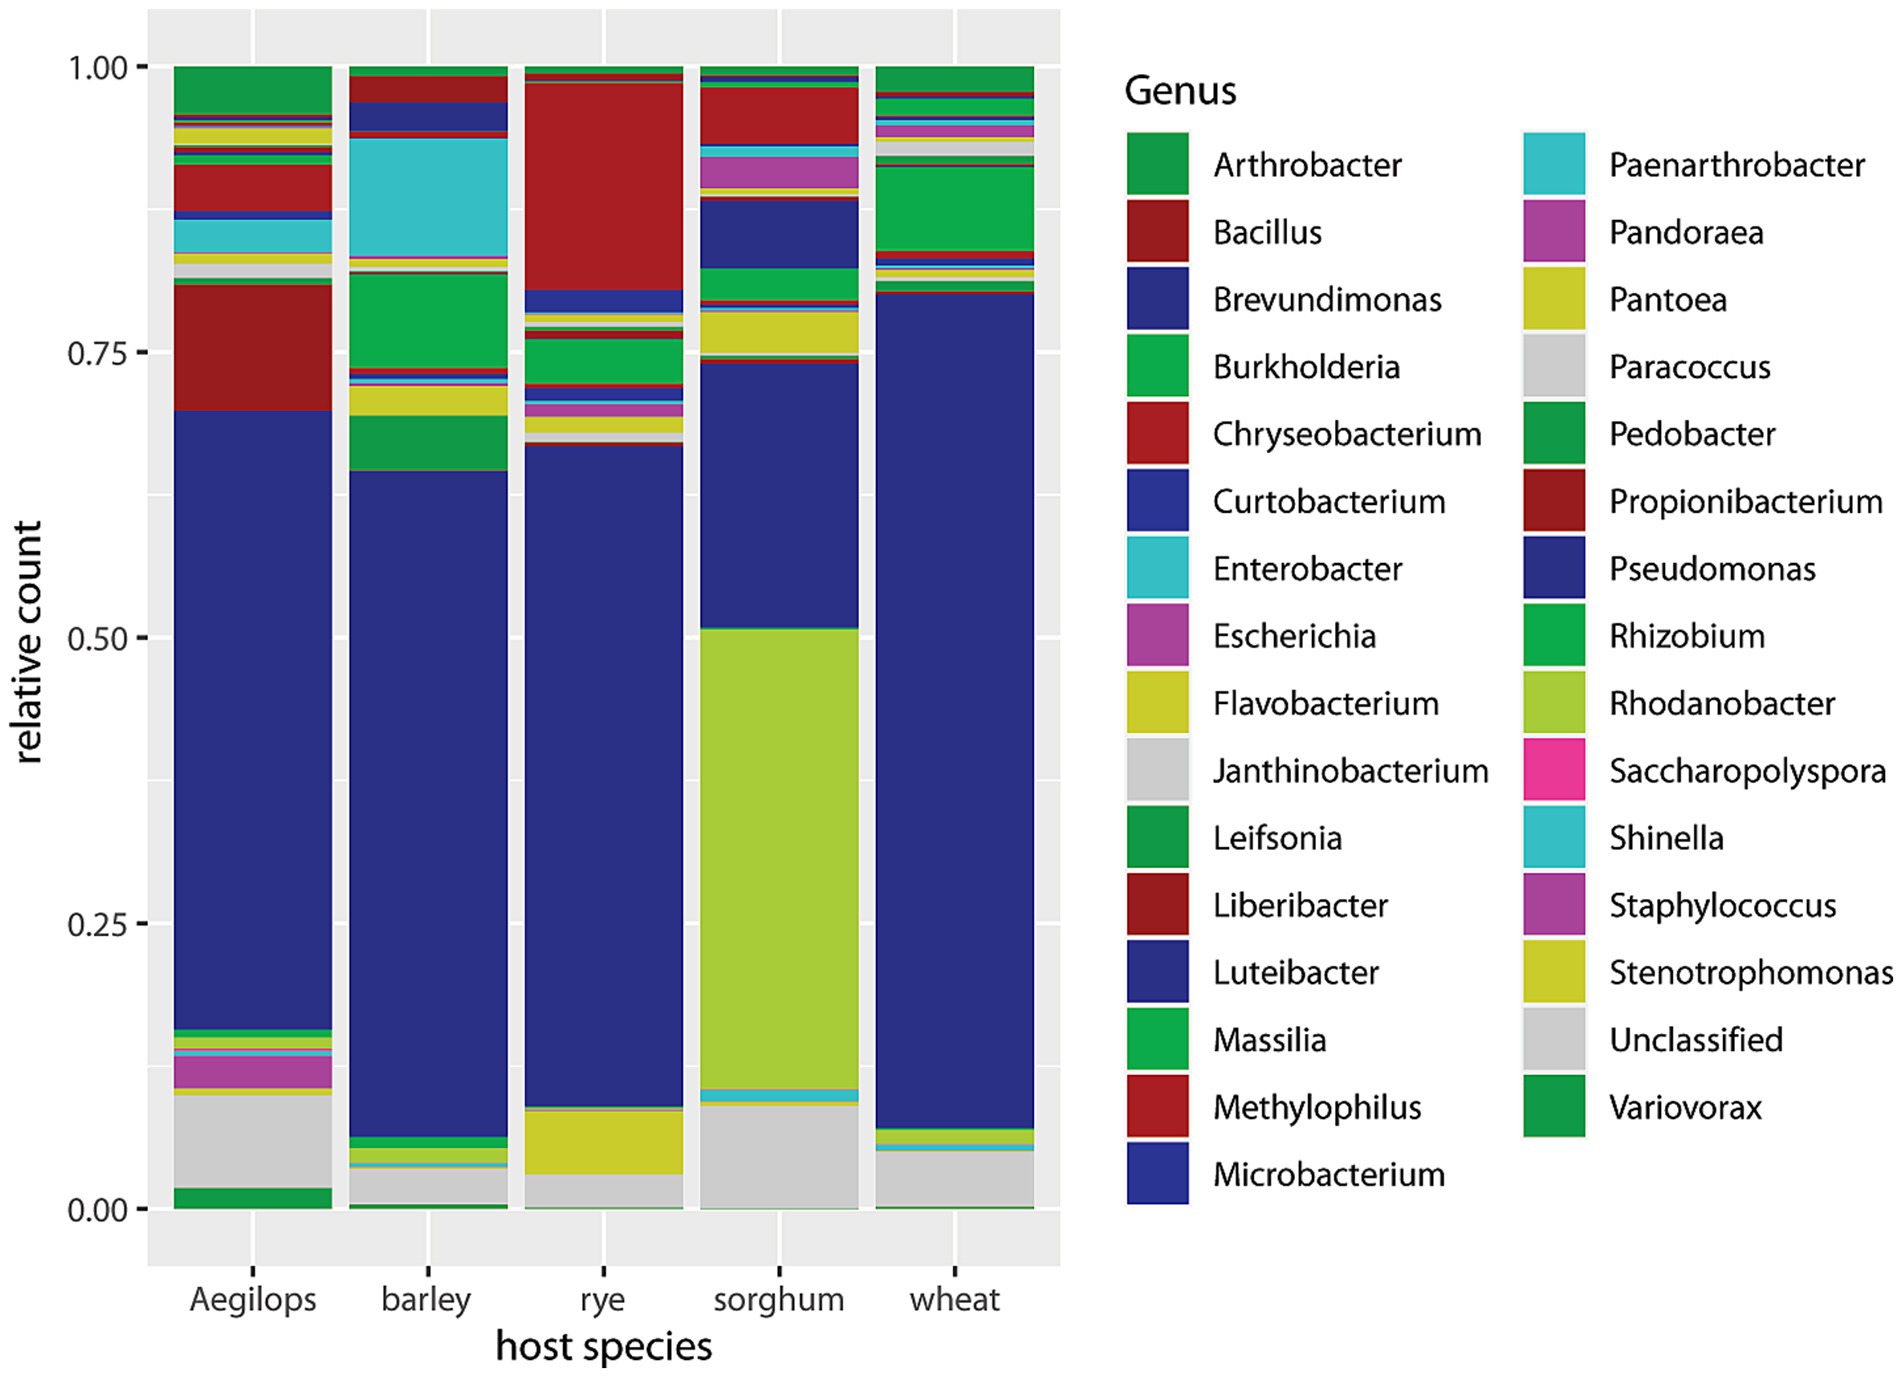
Figure 3. Barplot of 30 most abundant genera sorted by host plant species.
Relative abundances of non-Buchnera genera are barplotted by cultivar in Figure 4. Pseudomonas dominated in 13 of 17 cultivars. Four cultivars (Wintermalt barley, TX2737 and TX2783 sorghum, and Largo wheat) stood out because of their relative deficiency of Pseudomonas and varying abundance of other genera. In Wintermalt, Enterobacter, Massilia, Pedobacter, and Pantoea were prominent. In TX2737, Rhodanobacter, Luteibacter, and Chryseobacterium were prominent. In TX2783, prominent genera included Massilia, Paracoccus, Burkholderia, and Flavobacterium. In Largo, Paracoccus, Flavobacterium, and Propionibacterium were relatively prominent. There was no correlation of low abundance of Pseudomonas to greenbug biotype resistance among these four cultivars as noted by Armstrong et al. (2016).
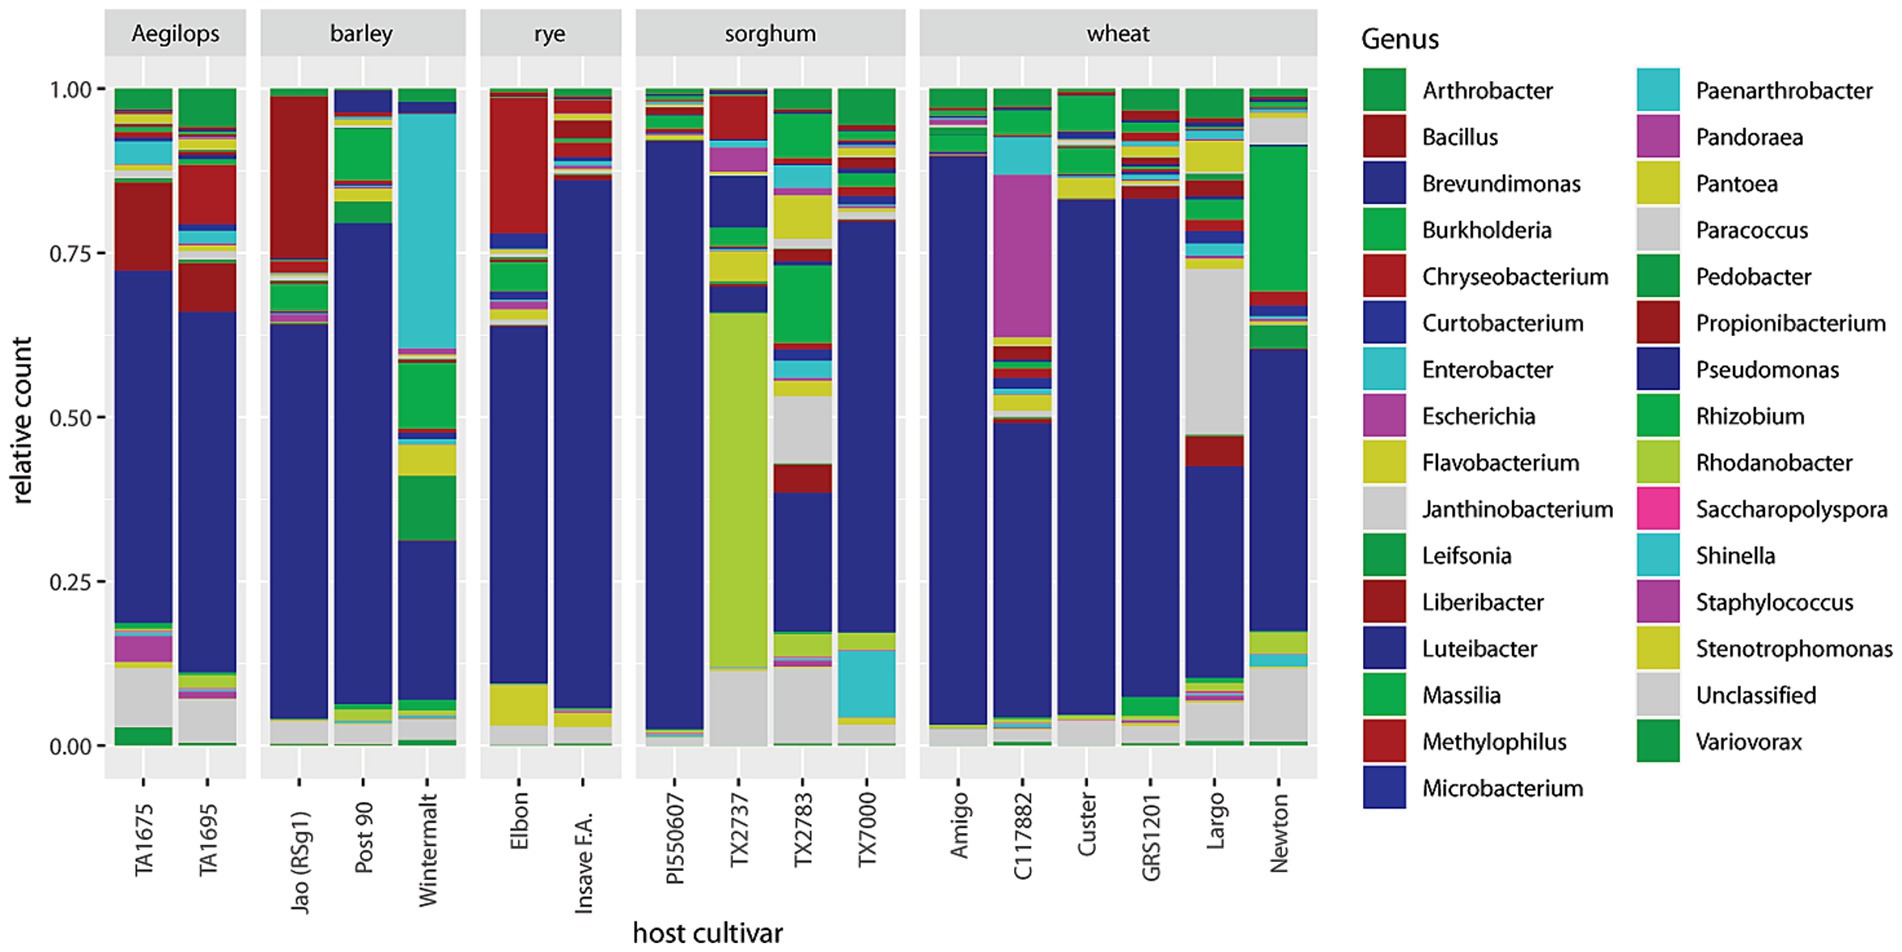
Figure 4. Barplot of 30 most abundant genera sorted by host plant species and cultivar.
Statistical significance of variation in genus counts was appraised with ancombc (Lin and Peddada, 2020). Comparisons of the two biotypes, the four timepoints, and the five host plant species are reported in Table 3, which lists beta coefficients (the slope of the plot of log of taxon abundance divided by days after infestation), their standard error, Holm-adjusted p-values, and a statistic W that is the quotient of the beta value divided by its standard error. A positive beta slope for biotypes indicates up-population in biotype K over biotype E. A positive beta slope for timepoint indicates up-population at a later collection date versus day zero. A positive beta slope for host plant species indicates minimum population in Aegilops. Only three of the genera listed in the biotype section of Table 3 (Rhodanobacter, Luteibacter, and Pedobacter) are prominent in any bar of Figure 2. In the time section of Table 3, only Bacillus is prominent in a bar (biotype K on day 2) in Figure 2. In the species section of Table 3, four of the five identified genera were also prominent in Figure 3.
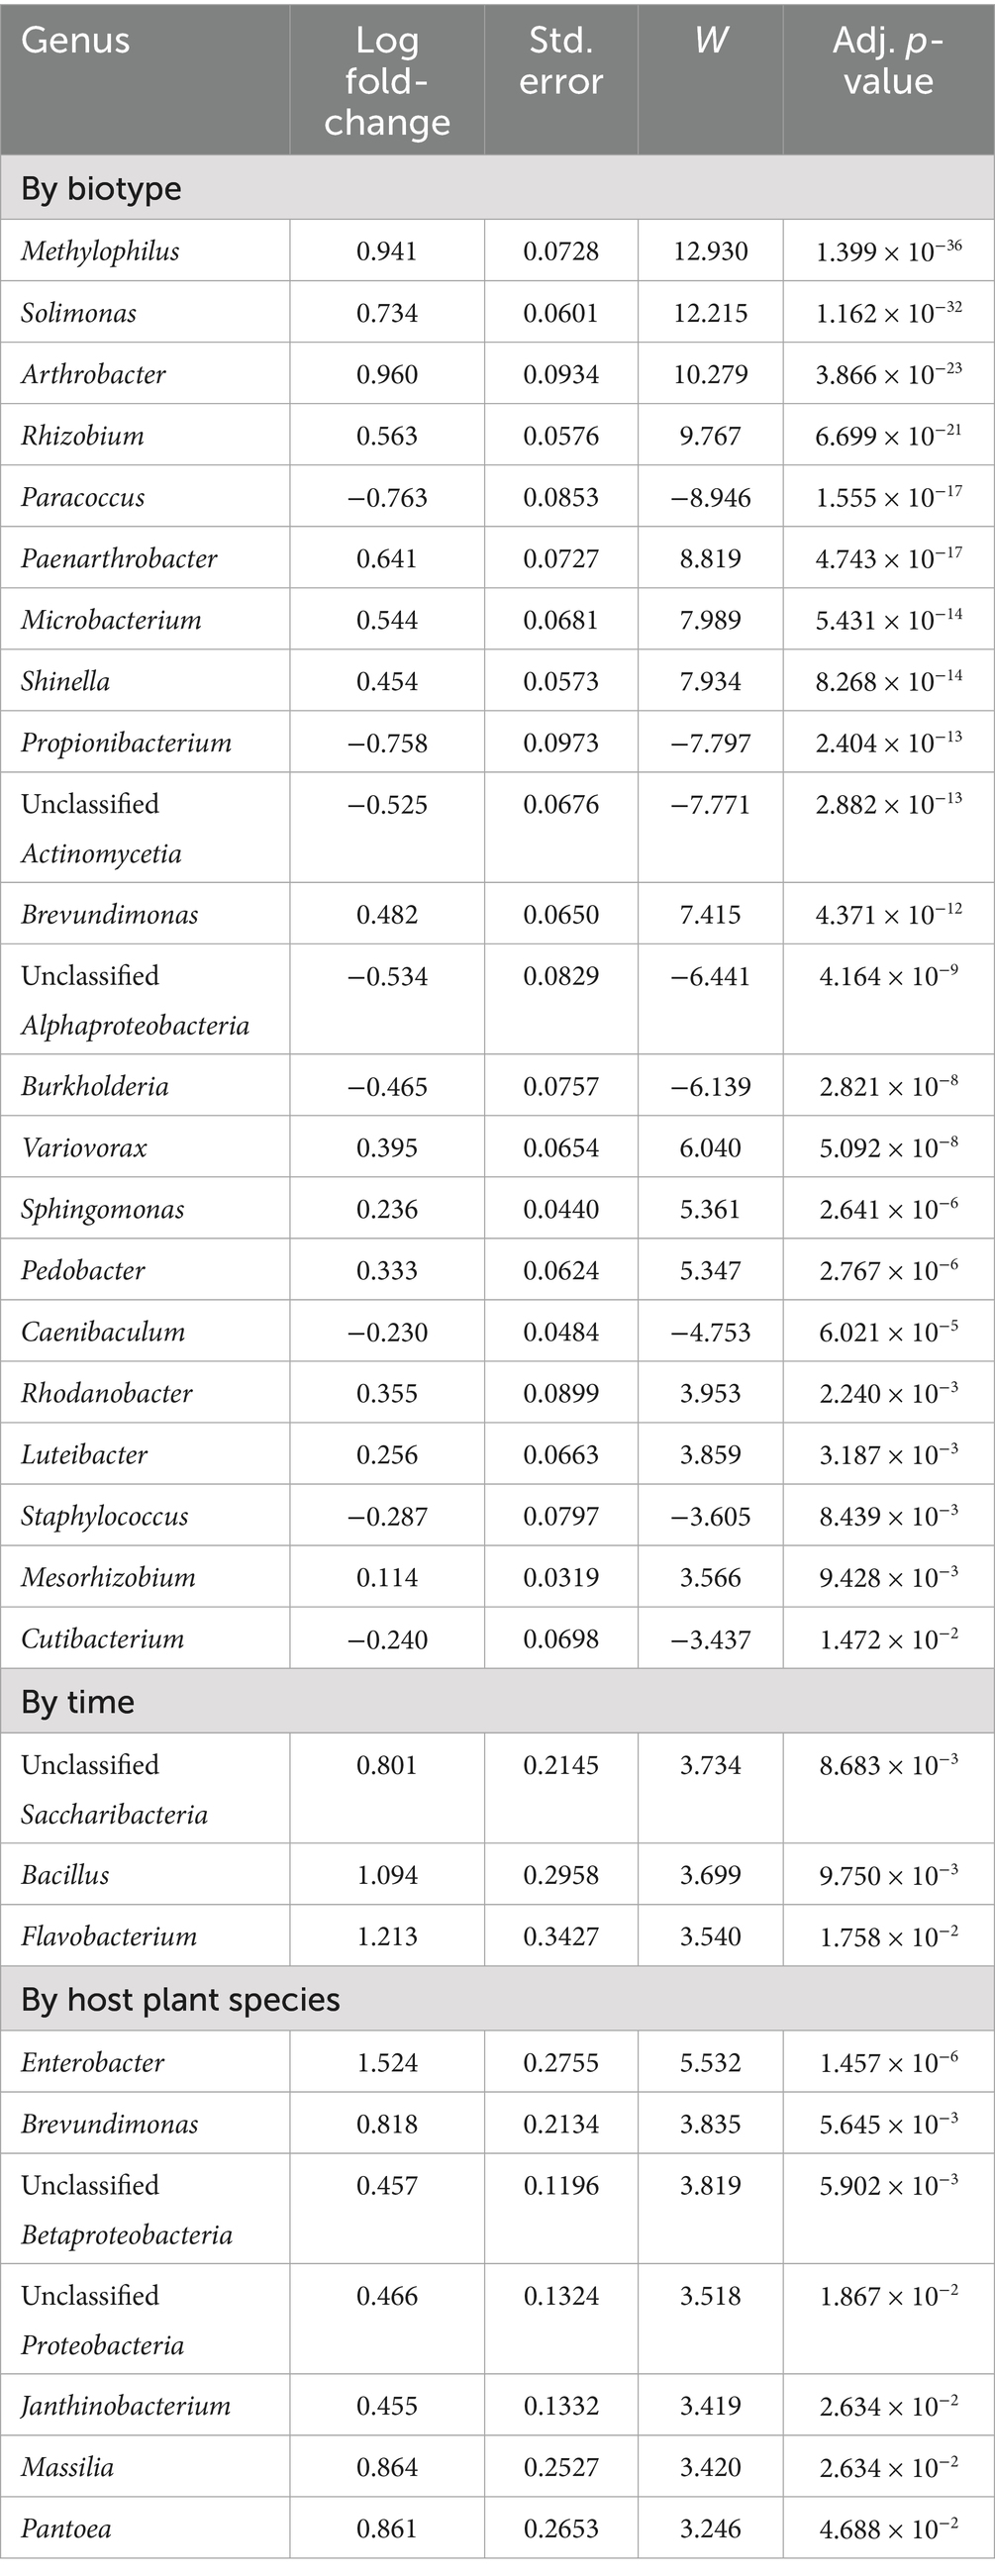
Table 3. Differentially populated genera by biotype, time, and host plant species.
With respect to greenbug resistance genes, when ancombc (Lin and Peddada, 2020) was run with a frequency feature table of 479 genera that included Buchnera, there were seven genera with unadjusted p-values less than 0.01 as listed in Table 4. None of these was significant even at p < 0.10 after Benjamini–Hochberg correction for multiple testing. Log2 fold-changes from susceptible to resistant were modest, ranging from −0.32 for Chryseobacterium to 0.52 for Massilia. Positive and negative log2 fold-changes were split 274 to 205, so there was an excess of genera that became somewhat more abundant in resistant plants at the expense of Buchnera. Excluding Buchnera changed the result almost imperceptibly in Table 4.
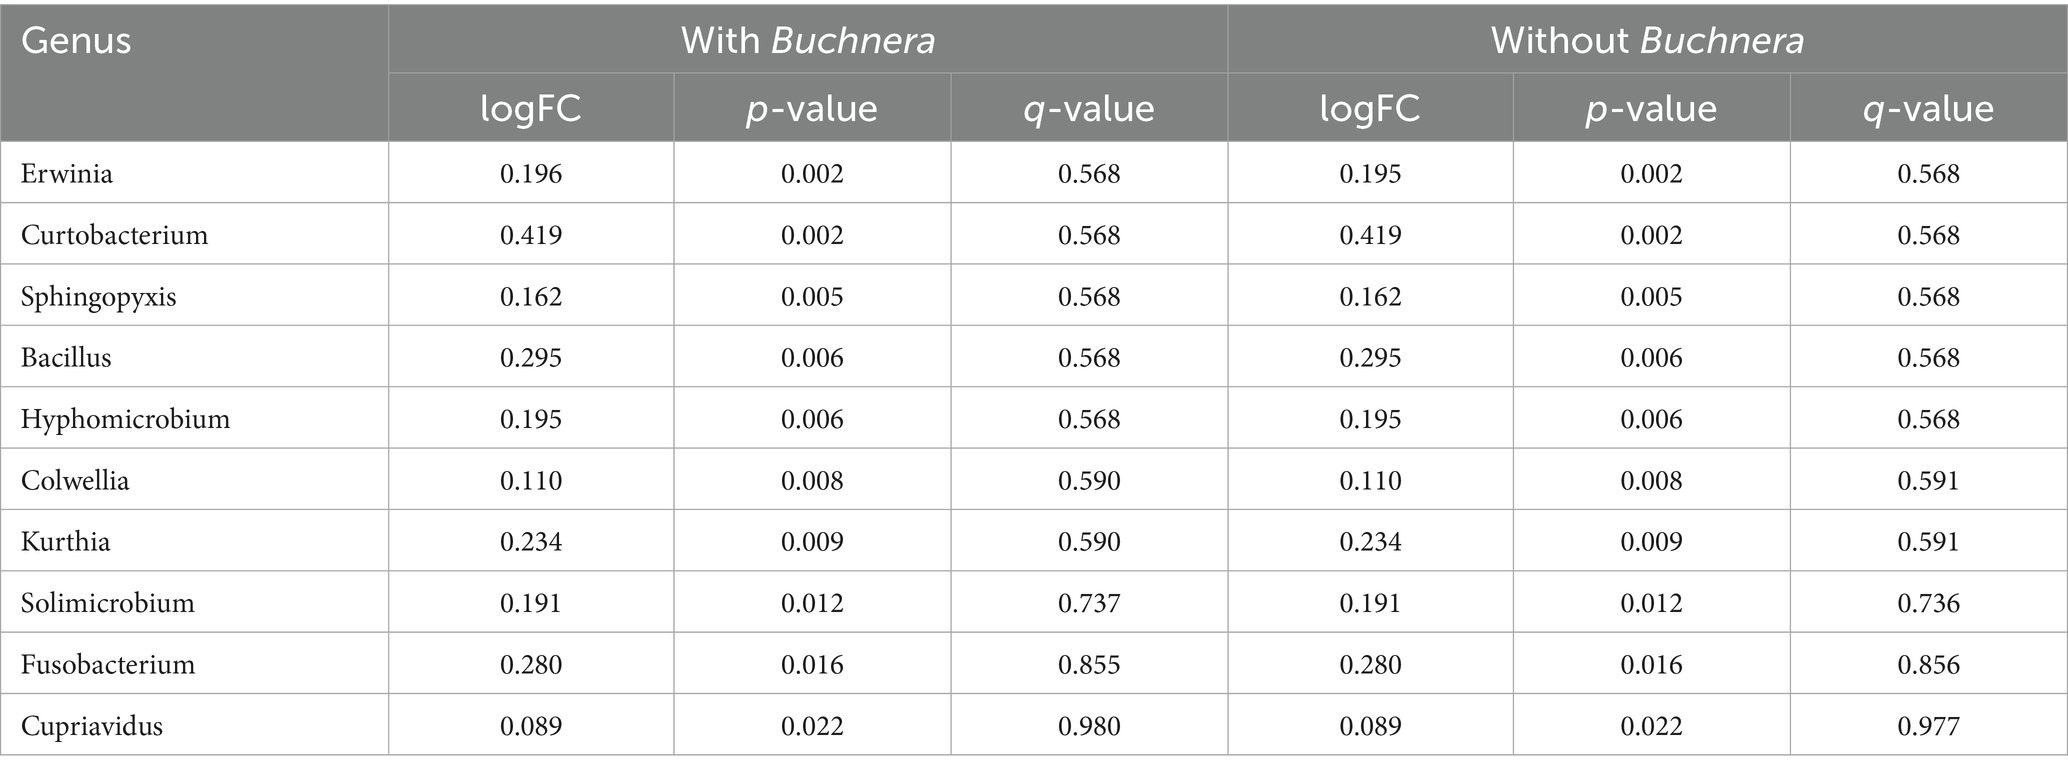
Table 4. The 10 most nearly significantly differentially populated genera for resistant versus susceptible host cultivars.
Correlations among frequencies of bacterial species appear in Figure 5. Buchnera was negatively correlated with all other taxa except Pantoea dispersa, Propionibacterium sp., Deinococcus sp., and Chryseobacterium takakiae. The negative correlations were mostly significant at p < 0.001 and were strongest for Pseudomonas (the most abundant genus other than Buchnera) and an unspecified genus of Enterobacteriaceae. Mutually positive correlations were conspicuously clustered in a group of 16 taxa in the lower right quadrant of Figure 5 and a second group of five taxa at the upper left corner of Figure 5. There was an isolated strongly positive correlation between species of Enterobacter and Pantoea. While correlations outside of the two groups were weaker, many were still significant at p < 0.001. Only Deinococcus sp. and Chryseobacterium takakiae were not strongly correlated with other taxa overall.
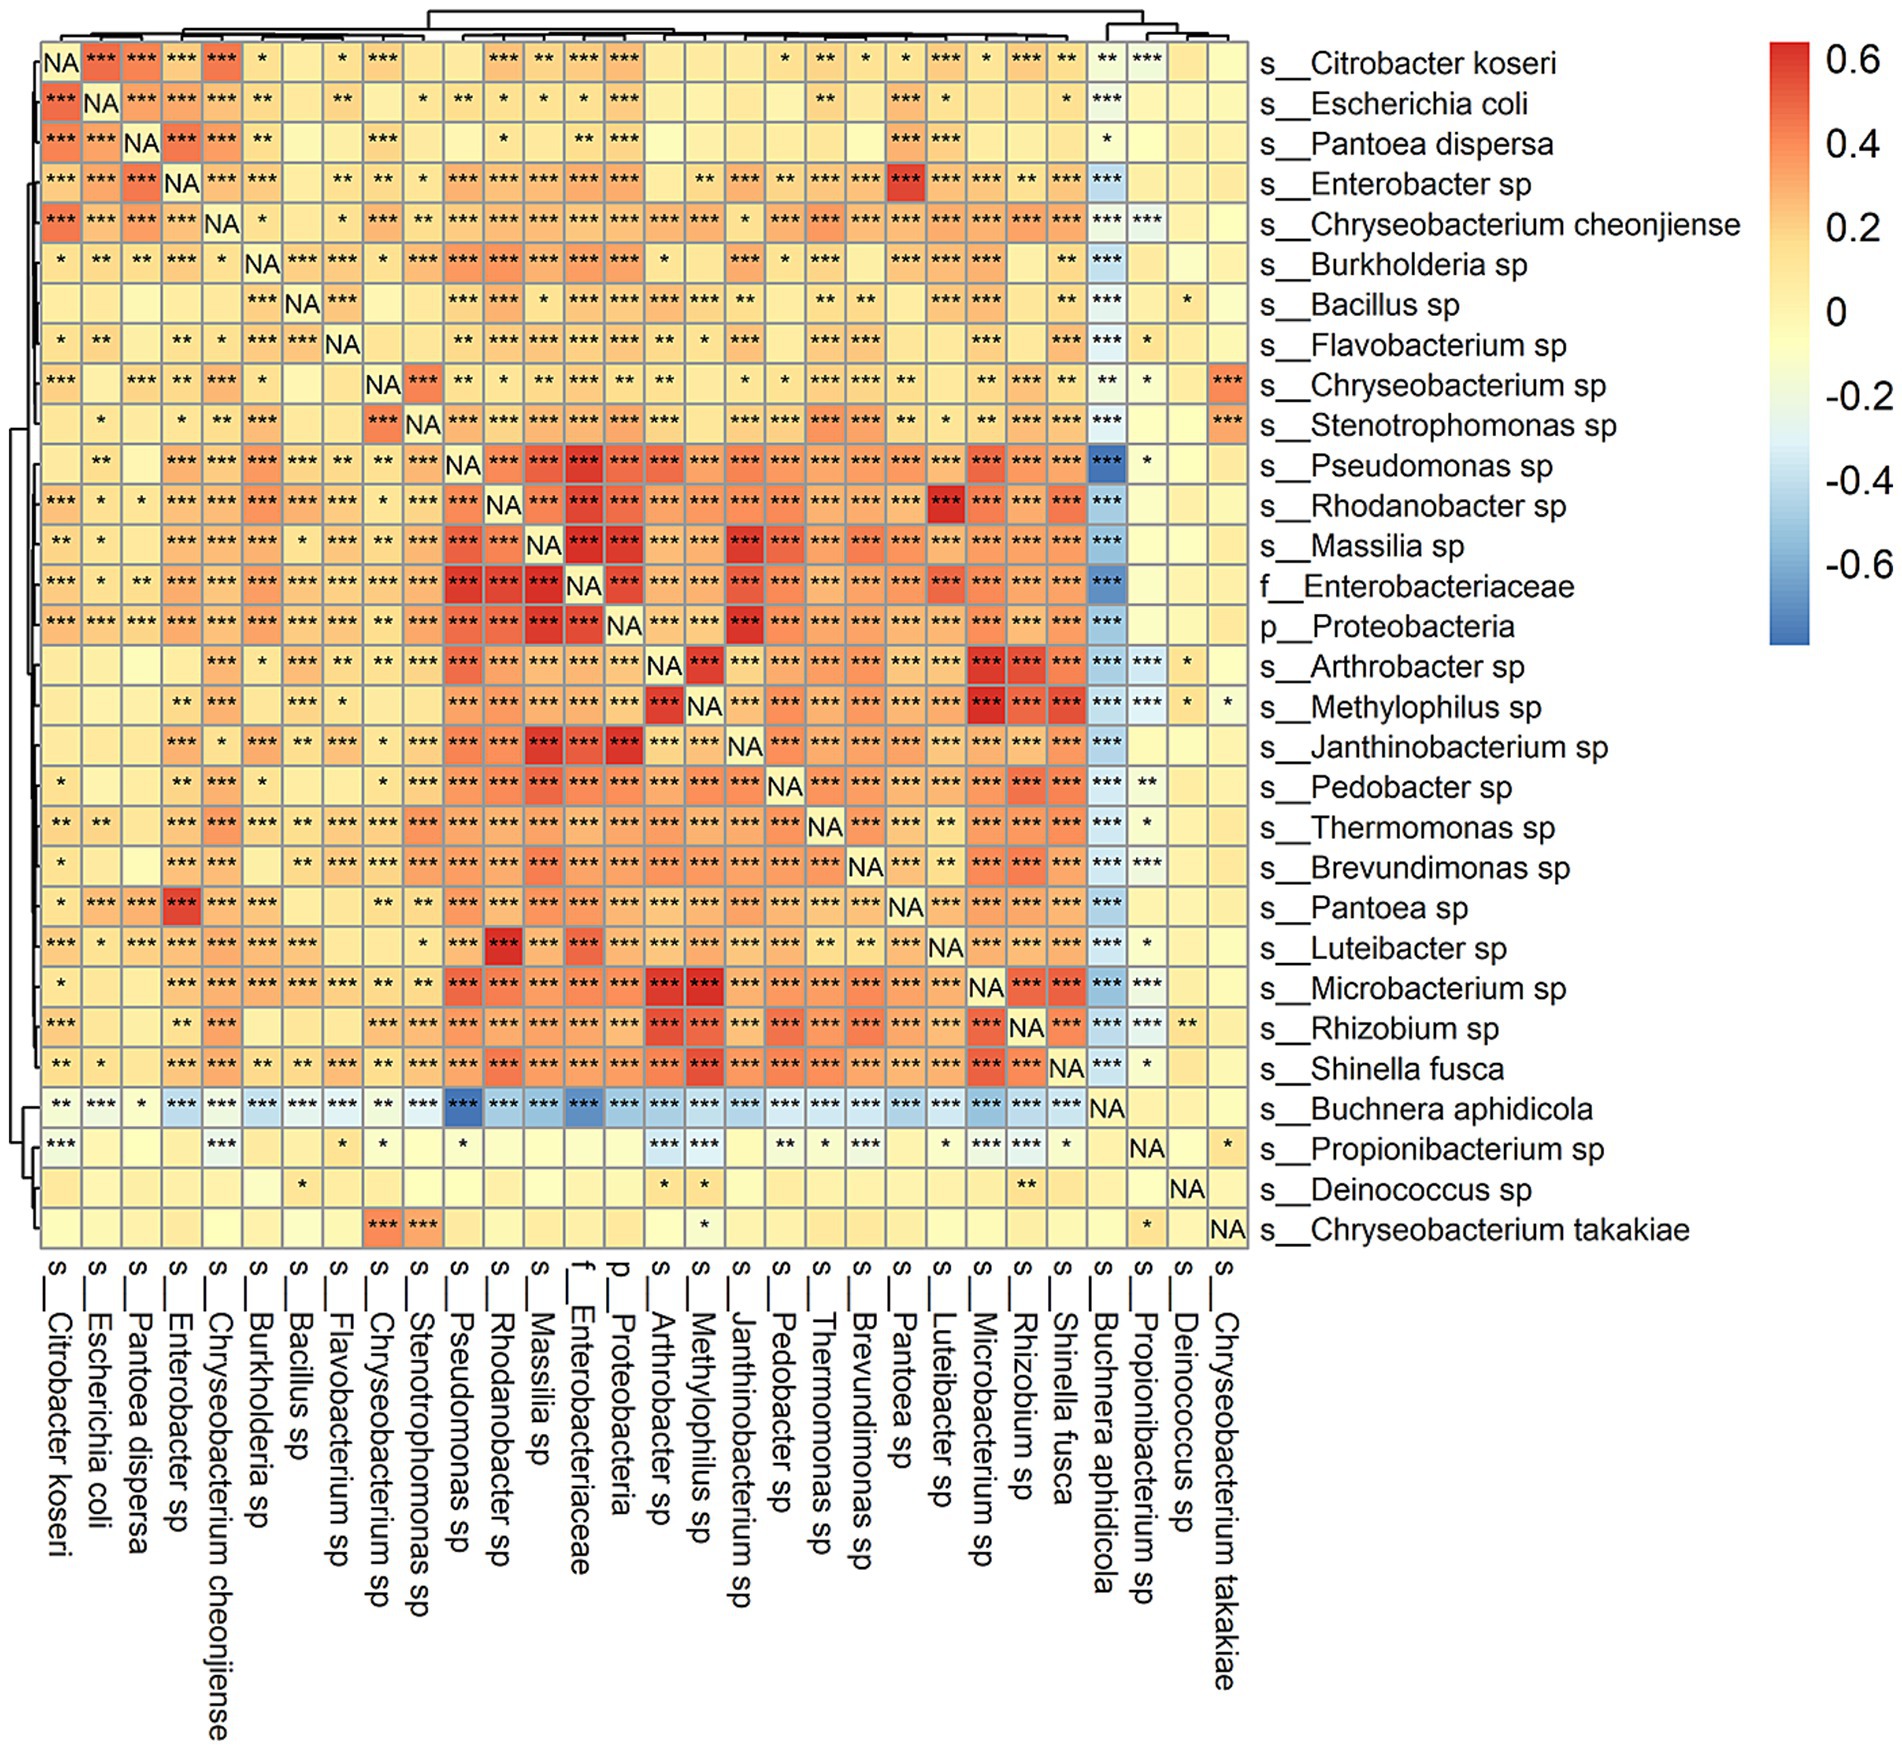
Figure 5. Spearman’s correlation of observed relative abundance among species. More positive values indicate greater strength of association. Significance testing was also performed for each pair of taxa, and asterisks indicate: *p < 0.05, **p < 0.01, and ***p < 0.001.
An analysis of variance was performed on the normalized counts (Table 5). All four variables (biotype, infestation timepoint, host plant species, and host cultivar) significantly affected read counts, as did interactions of biotype with the other three variables. Tukey’s Honest Significant Difference test (Miller, 1981) showed that barley differed in observed OTUs from the other four species at adjusted p-value ≤0.01 (Table 6). Figure 6 demonstrates that barley supported a more diverse microflora. Moreover, all three barley cultivars yielded more OTUs than any other sampled cultivar. Specifically, read counts differed at p < 0.05 for nine pairwise comparisons involving biotype K on barley versus biotype K on the other four species and biotype E on any of the five species (Supplementary Table 1). The differences between day 8 and either of day 0 or day 2 were significant at p < 0.05, and day 8 had fewer OTUs (Supplementary Figure 1).
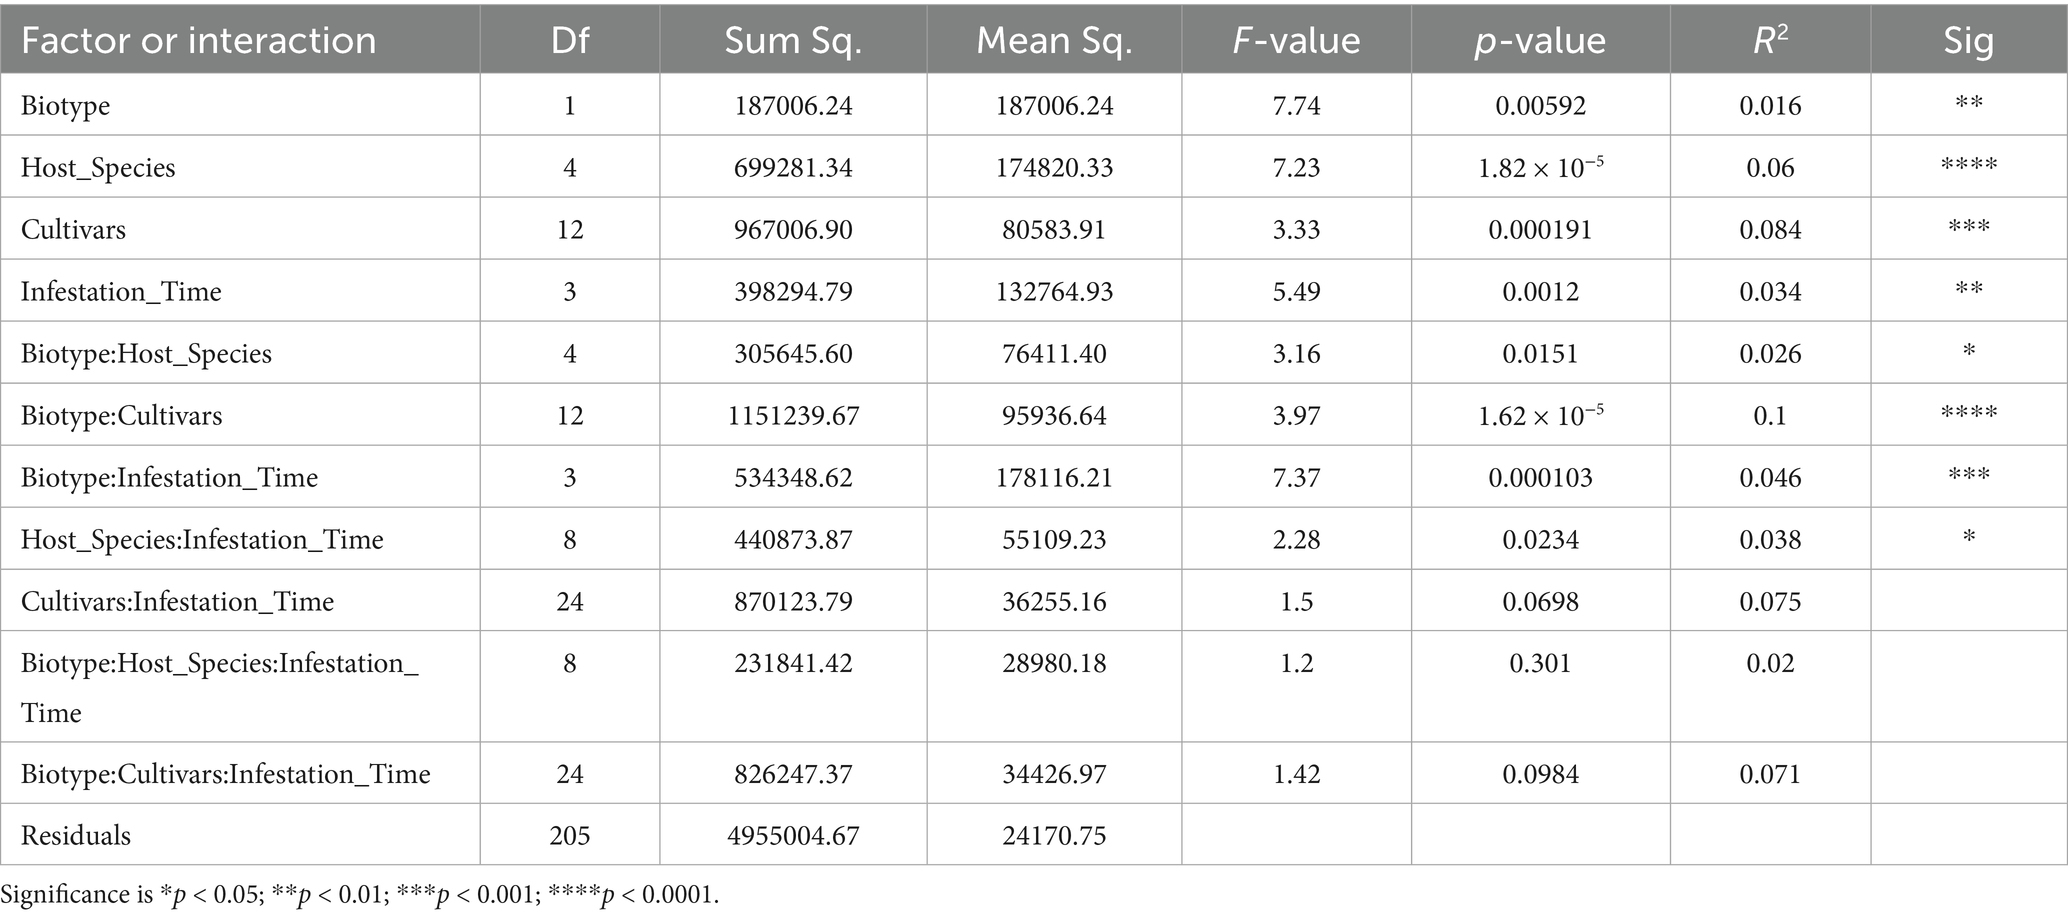
Table 5. ANOVA results based on observed read counts (P6T2).
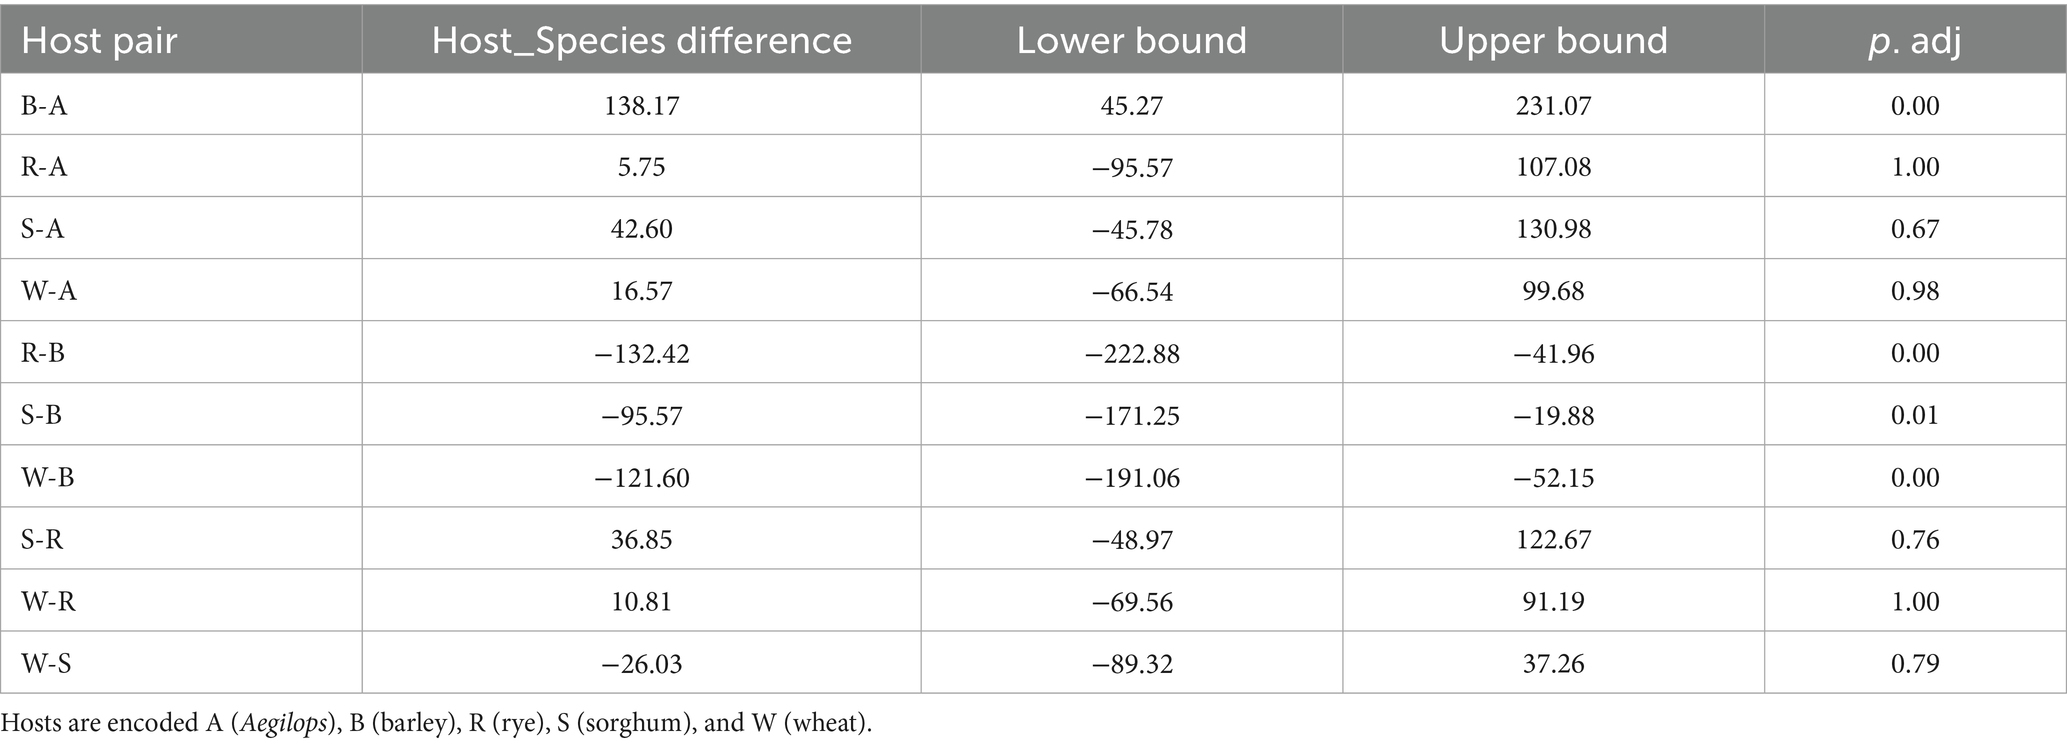
Table 6. Results of Tukey’s Honest Significant Difference test, testing for differences in the observed OTUs.
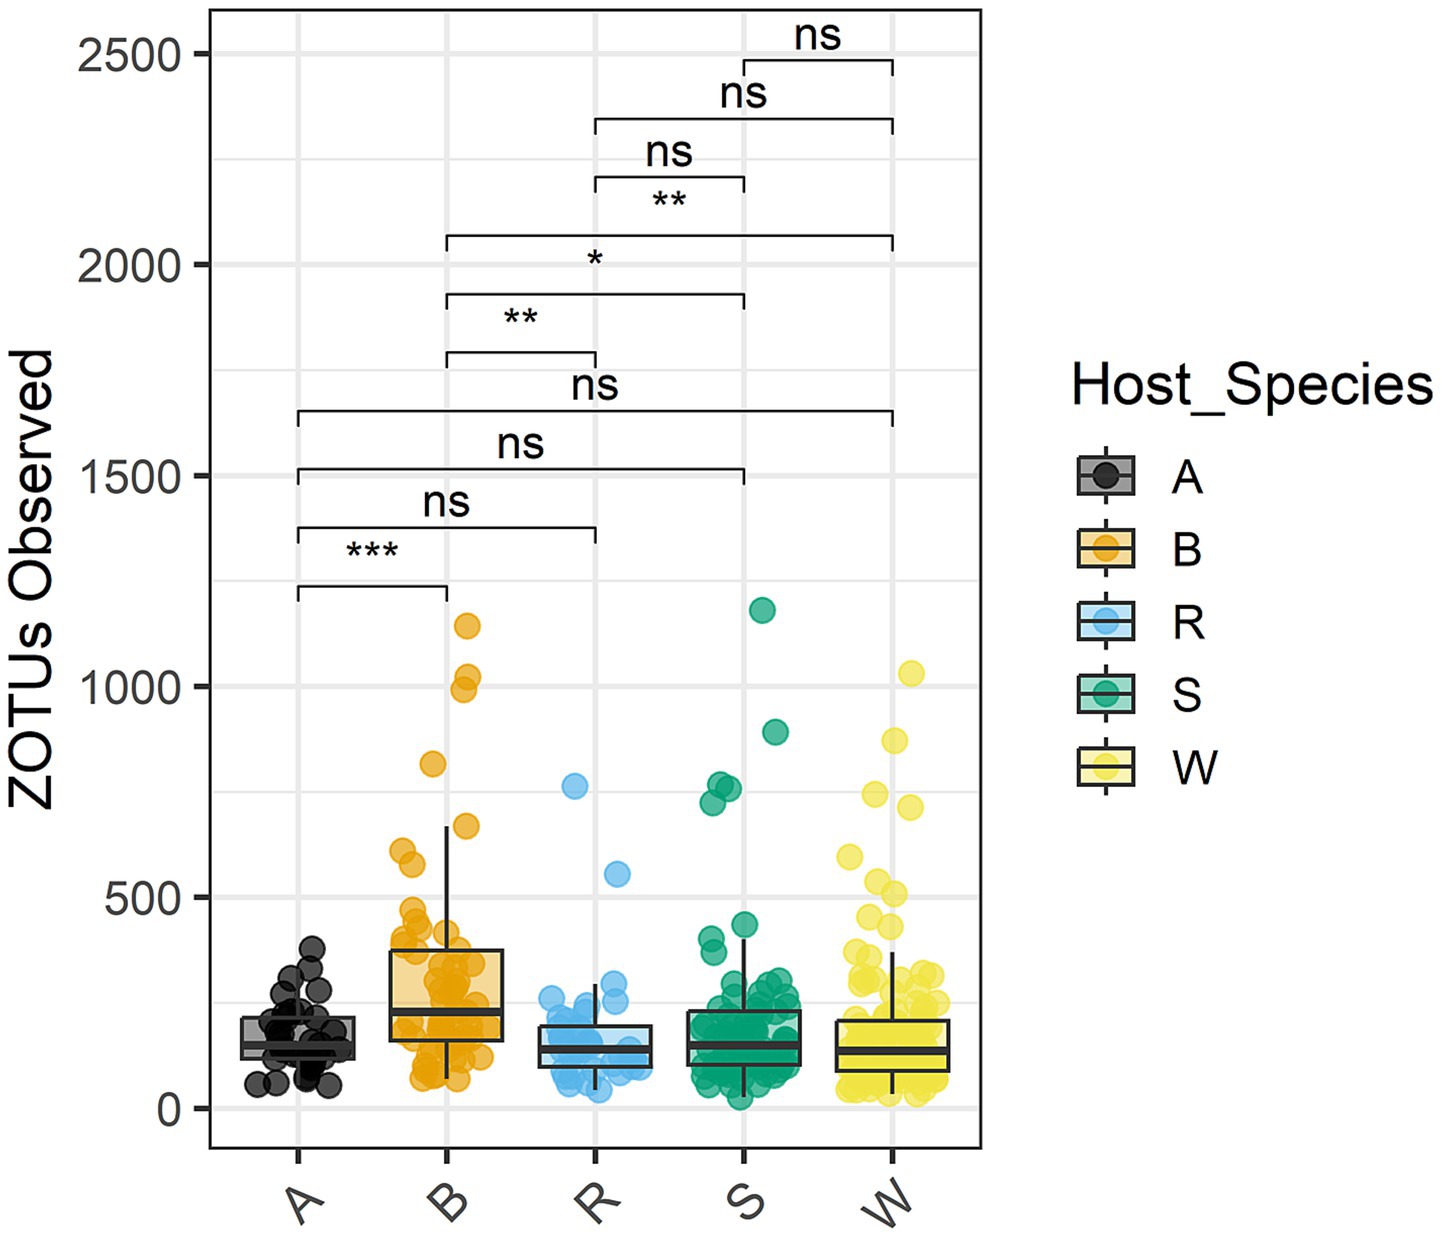
Figure 6. Zero-radius OTUs observed within the total microbiome data, grouped and colored by host plant species. The median value and first and third quartiles in each group are also illustrated. Asterisks indicate statistical significance: *p < 0.05; **p < 0.01; ***p < 0.001; ns, p > 0.05.
The mean Shannon diversity was 1.13 in biotype E and 1.19 in biotype K (Supplementary Figure 2). Mean Shannon diversity was 1.09 in Aegilops, 1.12 in rye, 1.14 in wheat, 1.16 in sorghum, and 1.30 in barley (Supplementary Figure 3). Three cultivars (Wintermalt barley, Post 90 barley, and TX2737 sorghum) accounted for the greater diversity in barley and sorghum (Supplementary Figure 4). Shannon diversity was also subjected to ANOVA (Supplementary Table 2), and the only significant differences involved the host plant species, the interaction of host plant species with aphid biotype and host cultivar, and the interaction of host plant species with aphid biotype and time. Tukey’s HSD test yielded six significant comparisons of Shannon diversity, again all involving biotype K on barley with biotype K on rye, wheat, or Aegilops, and biotype E on sorghum, wheat, or Aegilops (Supplementary Table 3 and Supplementary Figure 5). Barley, and only barley, differed significantly at p < 0.05 from the other host plant species in supported Shannon diversity (Supplementary Table 4). Shannon diversity did not vary significantly across days (Supplementary Table 5).
In ANOVA of Hill diversity (effective number of species, Supplementary Table 6), only host plant species and the interaction of host plant species with biotype and cultivar had significant effect. Once again, all significant pairwise comparisons with Tukey’s HSD involved biotype K on barley with biotype K on rye, wheat, or Aegilops, or biotype E on any host. Hill diversity was higher for biotype K than biotype E. For comparisons among species, the respective differences in mean significant Hill diversity versus barley were 1.84 for Aegilops, 1.74 for rye, 1.56 for wheat, and 1.36 for sorghum (Supplementary Table 7), and barley supported the highest diversity (4.9 versus 3.5 in sorghum, 3.3 in wheat, 3.1 in rye, and 3.0 in Aegilops). Cultivars Wintermalt, Post 90, and TX2737, yielded the highest Hill diversity (Supplementary Figure 6), and these were the cultivars with the highest fraction of non-Buchnera counts. There were no significant differences among infestation dates.
Beta diversity (diversity among samples rather than within samples) was assessed with Adonis (Anderson, 2001) using weighted or unweighted UniFrac and Jaccard dissimilarities. In addition, pairwise Adonis tests were run for biotype, infestation date, and species. Results of the global Adonis tests appear in Table 7. Nine of eleven variables and interactions were significant with unweighted UniFrac, the only exceptions involving infestation date and host plant species (Table 7). With weighted UniFrac, only the interactions of biotype with host plant species or with host plant species and cultivars were significant. With Jaccard dissimilarity, the only significant variable or interaction was the interaction among biotype, host plant species, and host cultivar, although the interaction of biotype and host plant species was almost significant (p = 0.052) (Table 7). Pairwise Adonis with unweighted UniFrac gave significant differences between biotypes E and K, between barley and any of the other host plant species, and day 2 versus day 4 or 8. The difference between biotypes is illustrated in Figure 7, where the distributions overlap but mostly differ. Pairwise Adonis with weighted UniFrac also gave significant differences between biotypes E and K, along with significant difference between day 4 and the other days, but there were no significant differences among the host plant species. With Jaccard dissimilarity, pairwise Adonis detected only a significant interaction among biotype, host plant species, and cultivar.
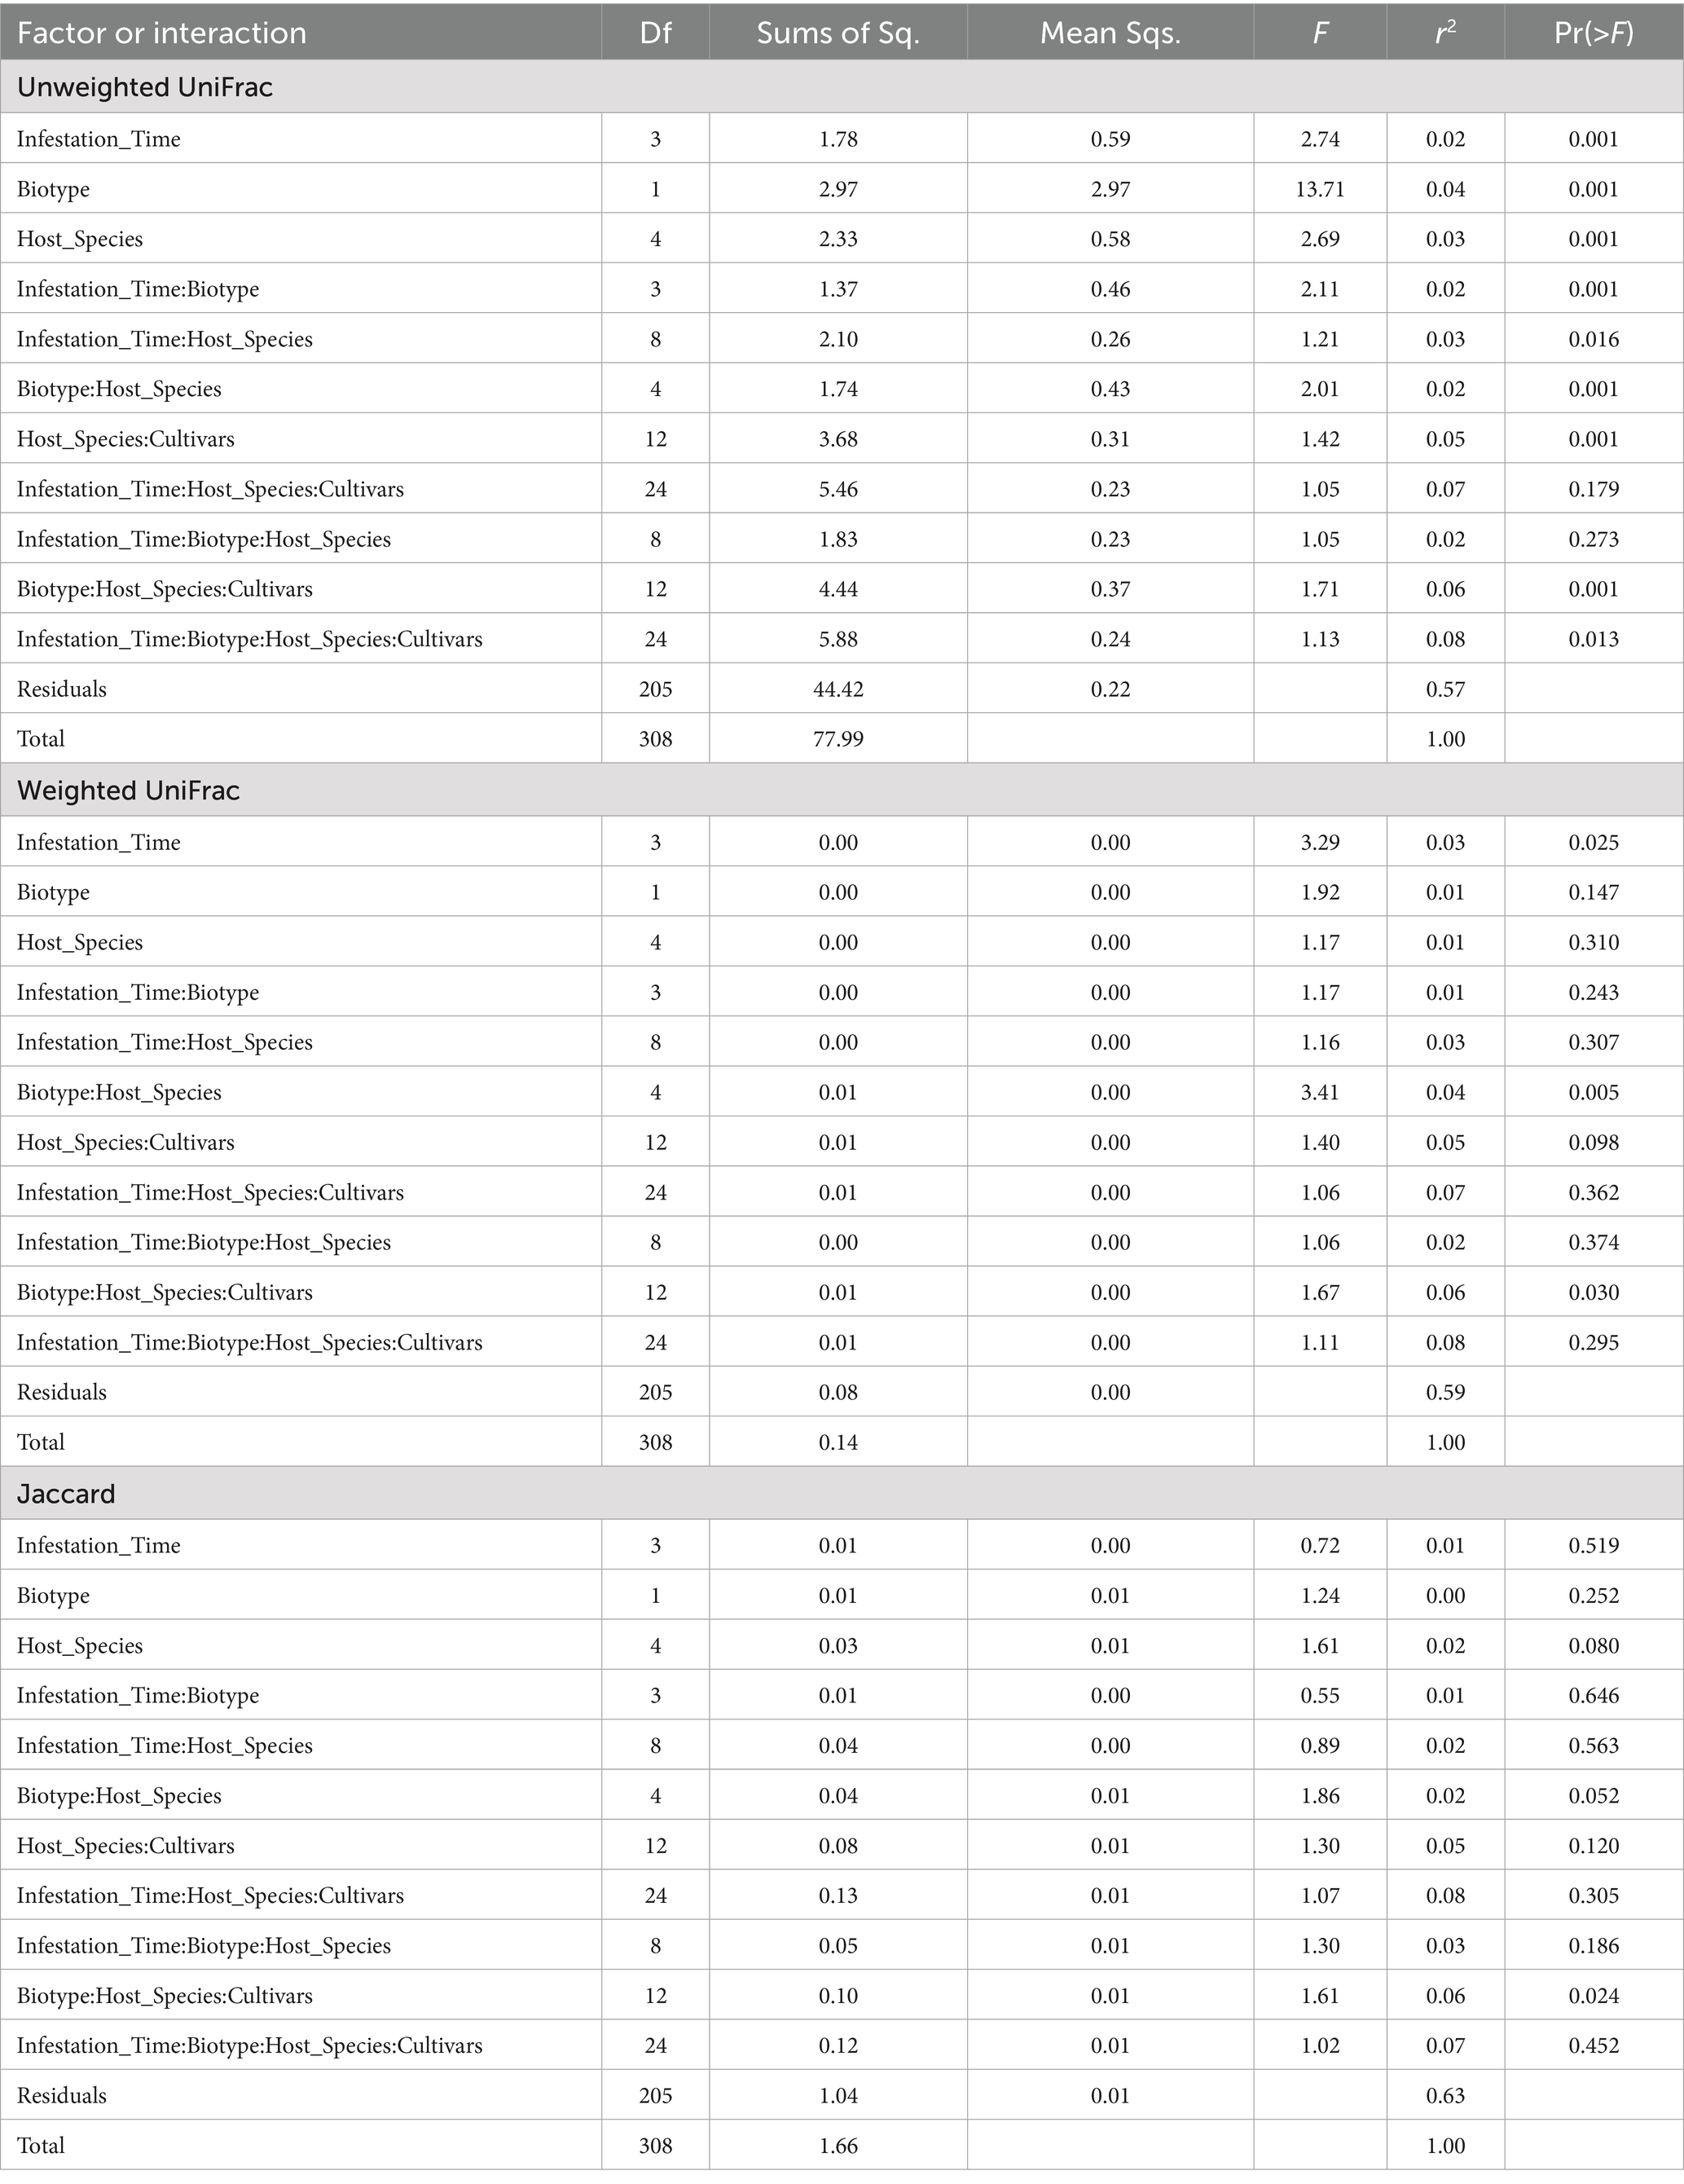
Table 7. Results of global Adonis.
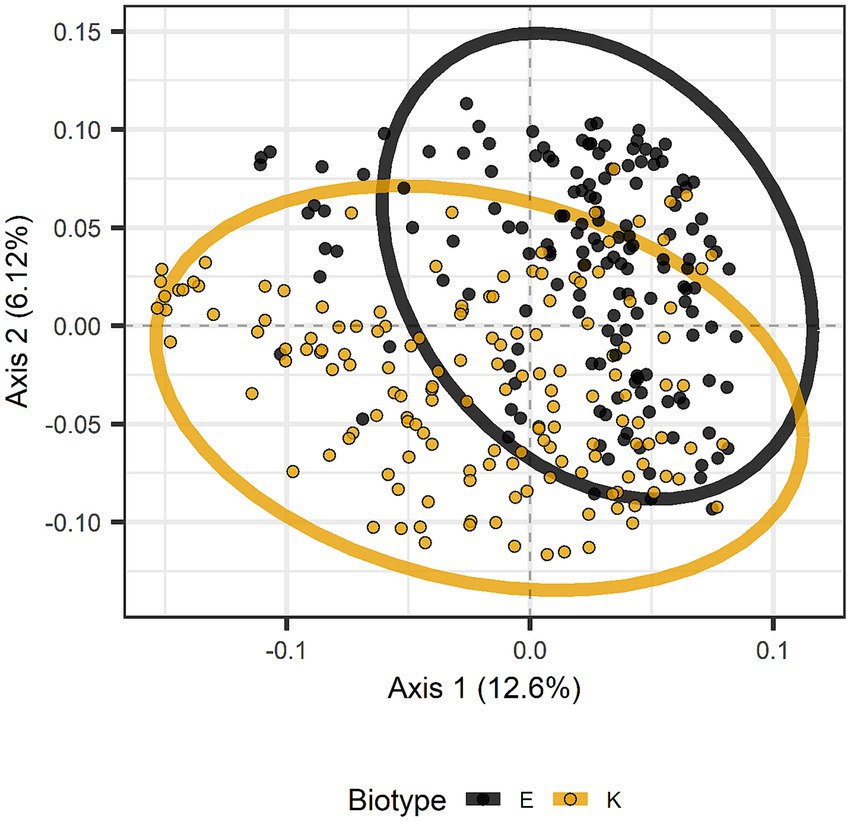
Figure 7. Principal coordinates analysis based on unweighted UniFrac distances distinguished by greenbug biotype. The distributions for biotypes E and K are mostly encircled.
The physiological activity of Buchnera versus the rest of the greenbug microbiome was inferred computationally with PICRUSt2 (Douglas et al., 2020), which output pairs of pathway and count related to the population and activity of each identified bacterial or archaeal taxon. Because of the high fraction of Buchnera reads, Buchnera counts exceeded other counts more than 10-fold. Rankings of pathways by count appear in Table 8 and Supplementary Table 8. Table 8 and Supplementary Table 8 have columns for all genera, Buchnera only, and all genera except Buchnera. Because of the abundance of Buchnera, the ranking of the most expressed pathways overall followed the ranking in Buchnera. The rankings indicated that Buchnera had lost 115 out of 421 pathways noted in other genera, including 112 of the 200 lowest-ranking by count and 85 of the 100 lowest-ranking by count. Thus Buchnera had selectively retained the more important pathways. Table 9 and Supplementary Table 9 contain comparative rankings of pathways ordered by activity over all genera except Buchnera. The most important pathway in the lumen bacteria was aerobic respiration utilizing cytochrome C, which releases hydrogen ions into the bacterial environment. This pathway ranked 175th in Buchnera, where acidifying the bacteriocyte cytoplasm is maladaptive. Earlier steps in respiration were not diminished; the tricarboxylic acid cycle ranked third in Buchnera and 14th elsewhere, while the non-oxidative part of the pentose phosphate pathway ranked fifth in Buchnera and 20th elsewhere. At least nine pathways in the synthesis and salvage of long-chain fatty acids were also diminished in Buchnera, including gondoate biosynthesis (60th in Buchnera, third elsewhere), mycolate biosynthesis (162nd in Buchnera, fourth elsewhere), cis-vaccenate biosynthesis (77th in Buchnera, 11th elsewhere), and fatty acid salvage (196th in Buchnera, 22nd elswhere). However, beta oxidation of fatty acids was increased (first in Buchnera, tenth elsewhere). Synthesis of most amino acids ranked similarly in Buchnera and elsewhere. An example was L-valine biosynthesis, ranked 12th in Buchnera and eighth elsewhere.
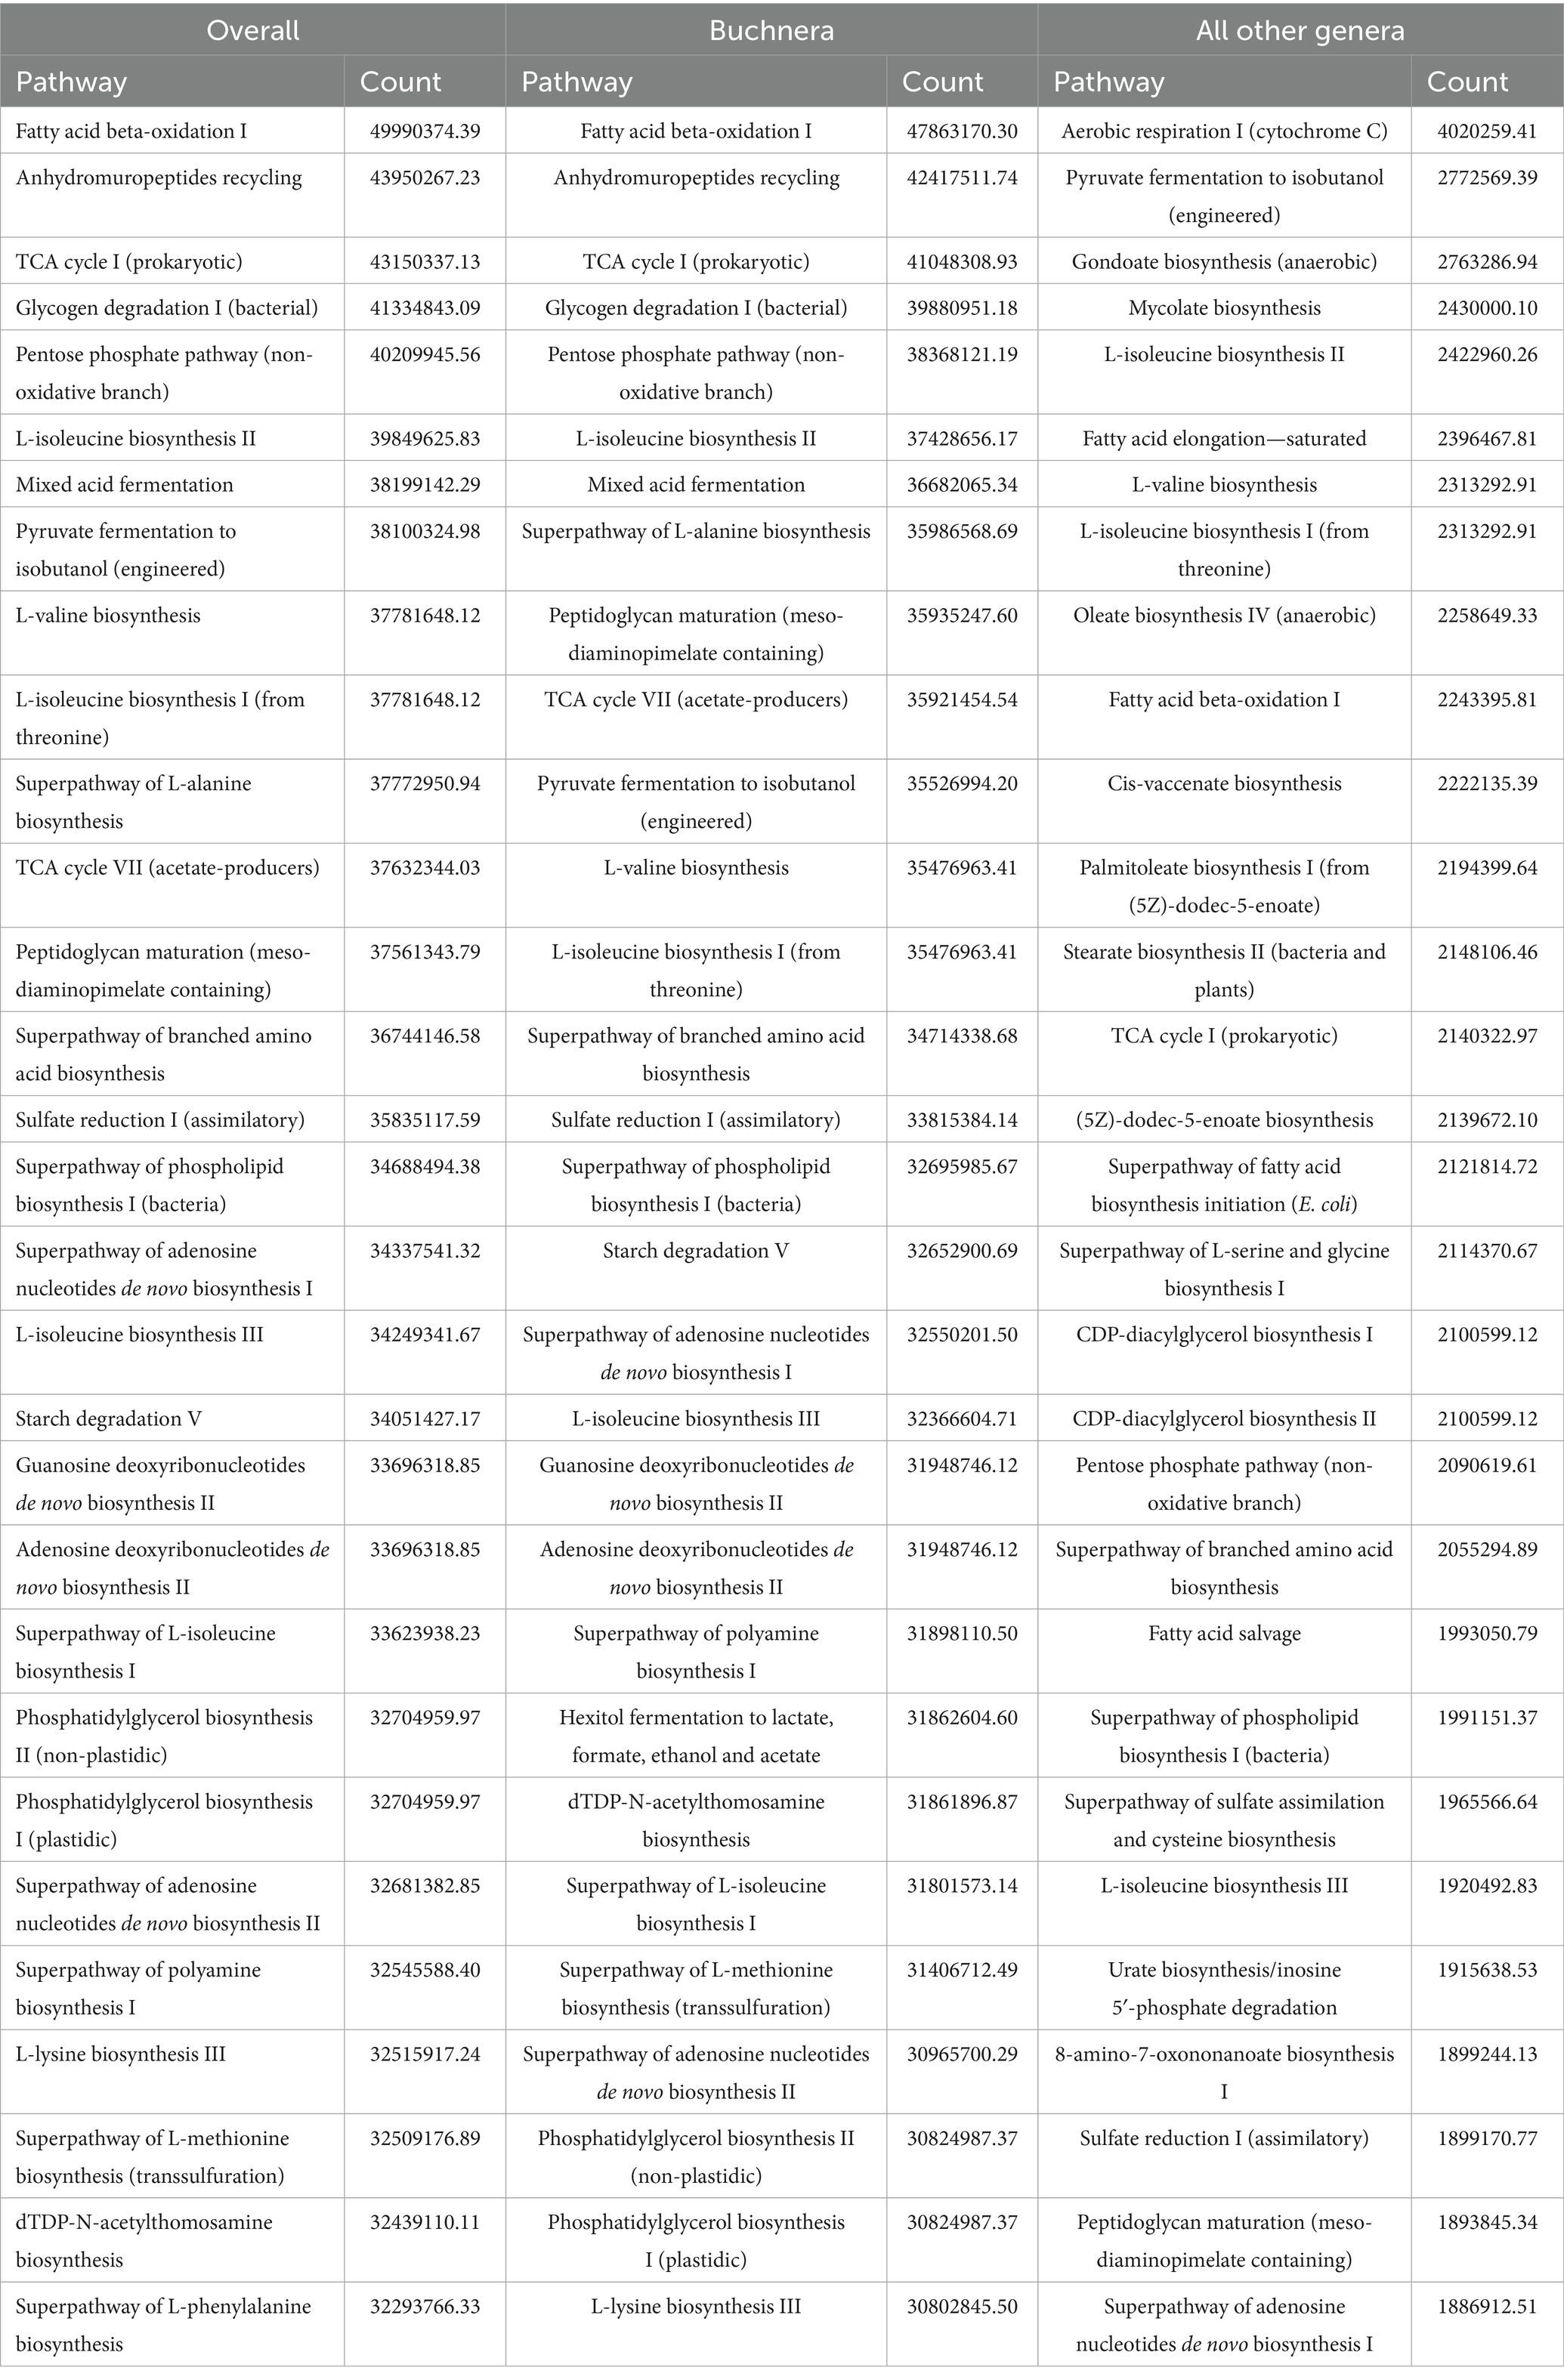
Table 8. Top 30 pathways identified by PICRUSt2.
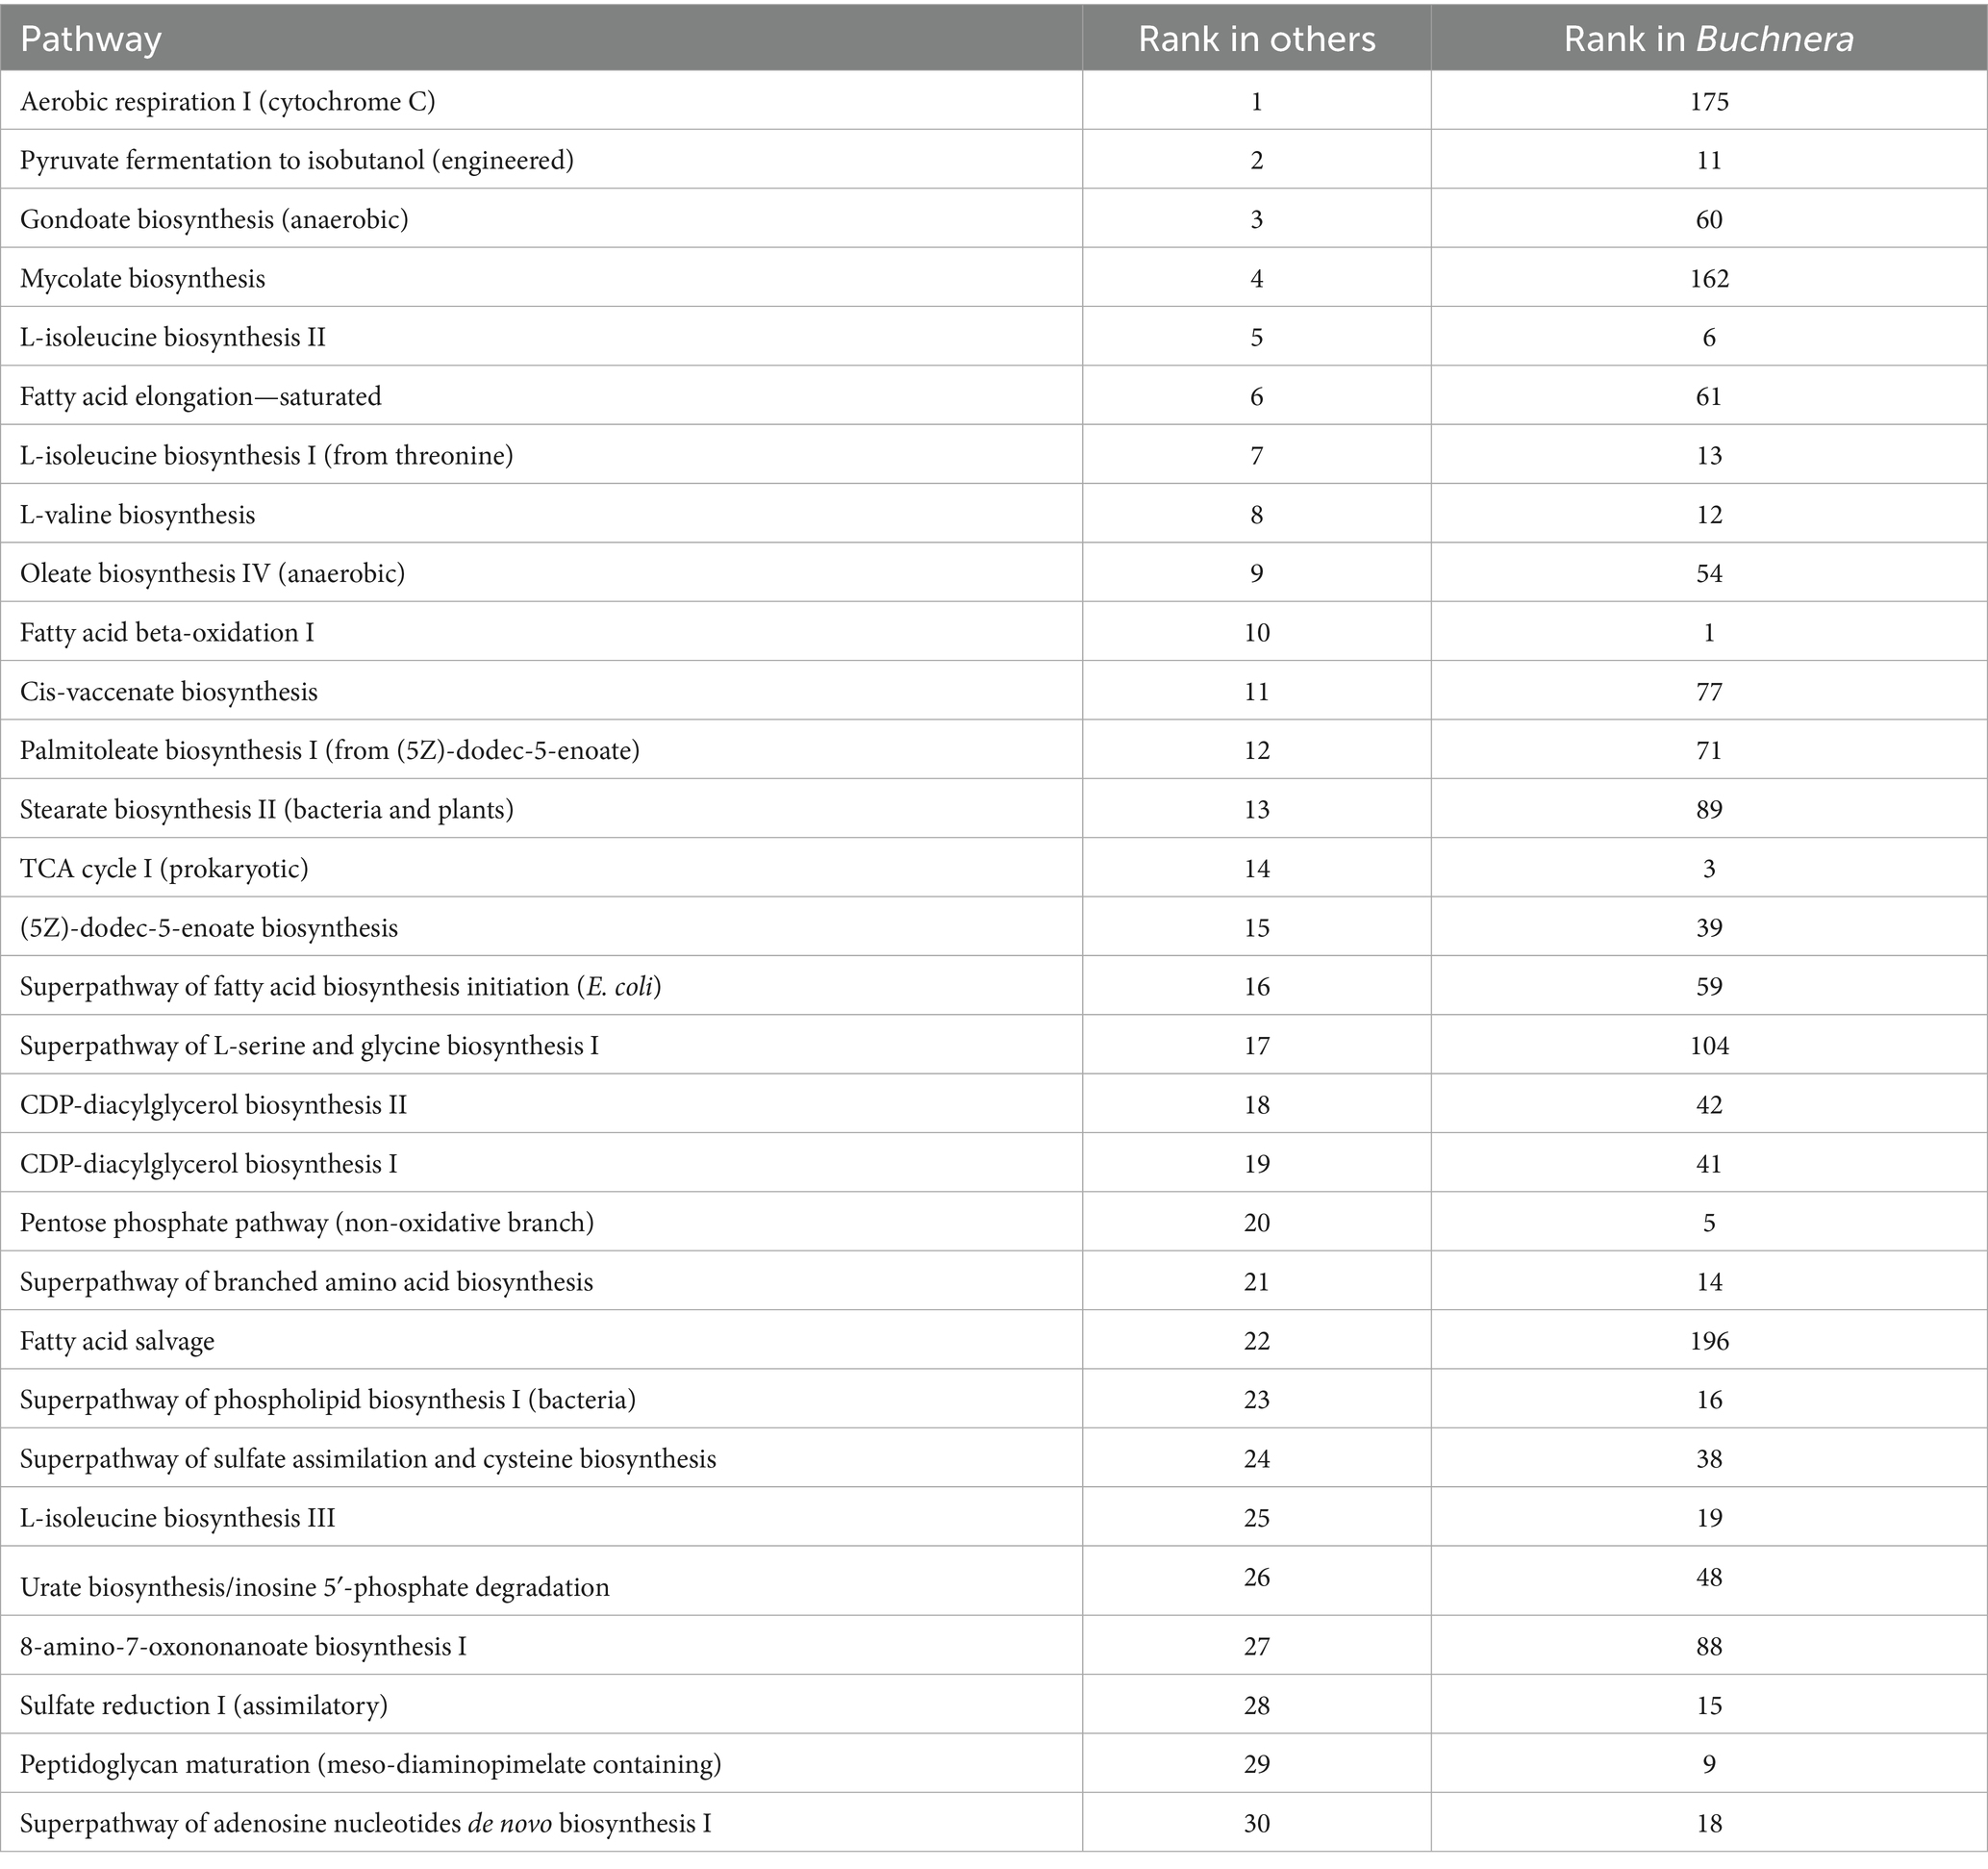
Table 9. Comparative ranking of pathways between Buchnera and other bacteria.
Discussion
A conventional study was conducted with the V5–V7 hypervariable region of the 16S rRNA gene in DNA isolated from intact greenbug aphids on 17 cultivars in five host plant species. There were four timepoints post infestation and two aphid biotypes defined by relative virulence on a set of wheat varieties. As in several other studies of 16S rRNA amplicons from aphid microbiomes, Buchnera aphidicola overwhelmingly dominated the read counts, ranging from 78.24 to 99.99% of the total. In Rhopalosiphum padi, B. aphidicola comprised 98.4% of the counts (Zepeda-Paulo et al., 2018) or 96.4% (Fakhour et al., 2018). In Aphis glycines, B. aphidicola comprised 70.3 to 93.5% of counts among geographic locations (Gallo-Franco et al., 2019). In Aphis gossypii, B. aphidicola was 2.9 to 74 times as counted as the second-place taxon (Ma et al., 2021). In Melanaphis sacchari, B. aphidicola comprised 90 to 99% of counts (Holt et al., 2020).
In all of these cases, including the current study, counts of B. aphidicola were inflated by its high copy number of 50 to 200 genomes per cell (Komaki and Ishikawa, 1999, 2000), versus one per cell in typical stationary-phase bacteria. Thus the populations of B. aphidicola and the more abundant gut bacteria like Pseudomonas might have been relatively similar. The count of Buchnera bacteroids per bacteriocyte also responds to environment (at least temperature; Neiers et al., 2021) and increases as the aphid ages. Another possible influence is unequally efficient amplification of various 16S rRNA loci by the degenerate forward primer used here, or unequal amplification based on the specific amplified sequences themselves. A few percent difference in amplification at each PCR cycle can mount up to several fold or more variation in read counts after 30 cycles. To demonstrate this, a simulation was conducted with 1,000 equally abundant taxa, 30 cycles, and amplification rates defined as 1 + (m – 0.5), where m is the mean of N = 20 to 50 random numbers in (0, 1). This resulted in the top 1% of taxa accounting for 11.5% of total amplicon counts with N = 50, 13.9% of total counts with N = 40, 17.8% with N = 30, and 24.8% with N = 20. The mean difference of amplification rates from 1.000 was 3.26% with N = 50, 3.65% with N = 40, 4.21% with N = 30, and 5.16% with N = 20.
The high fraction of Buchnera read counts generally detected in aphid microbiomes implies that the aphid gut lumen hosts relatively few bacteria. The plant sap from phloem is unlikely to harbor many bacteria in healthy plants, so the gut microflora must proliferate during transit through the digestive tract. How much it proliferates depends upon transit duration as well as antimicrobial substances, if any, ingested or secreted by the aphid. The interval between the start of feeding and the start of honeydew excretion is related to transit time, and this interval is measured in minutes for some aphid species. Its duration in greenbug seems not to have been measured in relation to environmental influences such as temperature and relative humidity.
The cause of the uneven distribution of non-Buchnera counts among treatments and replicates in Table 2 is not known, but the relative constancy of Buchnera counts favors a biological cause rather than differential PCR amplification. Possibly interactions among the microbes led to outbreaks of individual taxa in small groups of aphids, much like epidemics of disease. Also, the non-Buchnera sample size was very small in two biotype-timepoints with the highest fraction of Buchnera counts, and this increased the influence of sampling error. Thus it was stated in the Results that Rhodanobacter was abundant in biotype E on day 0 and biotype K on day 4, but it was stated earlier that Rhodanobacter was almost entirely restricted to a single biotype-timepoint (biotype K on day 4). This apparent contradiction resulted from the sum of non-Buchnera reads being 423 for biotype E on day 0 and 251,205 for biotype K on day 4. Non-Buchnera reads summed to 6,215 in biotype K on day 0 and exceeded 46,000 for the remaining combinations of biotype and timepoint.
Other beneficial symbionts (Serratia symbiotica, Hamiltonella defensa, Regiella insecticola, Wolbachia, Arsenophonus sp., Candidatus Ishikawella capsulata; Bansal et al., 2013; Gauthier et al., 2015; Jousselin et al., 2016; Fakhour et al., 2018; Enders et al., 2022) that have been proposed in other aphid species appeared to be absent in greenbug, since no OTUs mapped to them. We detected eight of the 15 other genera noted by Holt et al. (2020) in Melanaphis sacchari, and two (Pseudomonas and Bacillus) were abundant in our non-Buchnera counts. Among other genera that we found, Ma et al. (2021) reported Acinetobacter, Flavobacterium, and Pantoea in Aphis gossypii, and Enders et al. (2022) reported Cutibacterium and Pantoea from two Aphis species. Several other genera (Rhodanobacter, Chryseobacterium, Luteibacter, and Pedobacter) that were relatively common in the current study appear not to have been reported previously in aphid microfloras.
Microbial contamination of labware and PCR reagents can lead to spurious detection of bacterial taxa that are common in the environment. Genera such as Escherichia, Pelomonas, and Methylobacterium, have appeared in reads of PCR product from blank samples (Stinson et al., 2018). Thus, it is not apparent which low-frequency reads came from the reagents and which if any came from low frequencies of the same genera in DNA samples.
It is obvious from the diversity in reported microbes in aphids that aphid genotype and diet affect the microbiome in aphids. He et al. (2021) provide a detailed account of the effect of diet (Yun et al., 2014). They moved a clone of peach aphids (Myzus persicae) from Chinese cabbage to eggplant, tobacco, or pepper. On cabbage, the top-ranking genera were Buchnera (67.7% of counts), Acinetobacter (7.8%), and Allobaculum (5.8%); Pseudomonas was only 0.6%. On eggplant, the top four were Pseudomonas (69.4%), Buchnera (12.5%), Ralstonia (2.1%), and Burkholderia (1.7%). On tobacco, the top genera were Pseudomonas (62.2%), Buchnera (14.6%), Ralstonia (3.0%), and Burkholderia (2.1%). On pepper the top genera shifted to Buchnera (25.5%), Pseudomonas (11.7%), Ralstonia (8.4%), Burkholderia (5.0%), unassigned Enterobacteriaceae (3.2%), Acinetobacter (2.3%), and Stenotrophomonas (1.7%). Thus, eggplant and tobacco greatly favored Pseudomonas and somewhat suppressed Acinetobacter, and there was a rebalancing of total counts between the gut and the bacteriocytes. The authors did not consider the high ploidy of Buchnera in regard to its counts.
With 22 significantly affected genera (Table 3), greenbug biotype was more important than host species, which affected seven genera, or collection time, which affected only two genera. Accordingly, biotype K on barley had the most diverse bacterial communities that were least overwhelmed by the abundance of Buchnera. The eight-day study interval was insufficient time for the aphids to kill the host plant or produce alate morphs, as would be expected at saturation. Resistance genes, which reduced the size of individual greenbugs and reduced their population, had no consistent effect on the microbiome. Either none of the resistance genes affected the microbiome, or they varied in mode of action and thus did not produce a consistent change in microbial abundance. In concept, biotype could affect interactions of microbes with greenbug immunity, the efficiency with which the greenbugs absorbed nutrients from the gut, or the flow of amino acids into and out of the Buchnera bacteroids. However, another plausible mechanism is historical. Greenbug nymphs receive Buchnera from their mother during embryogenesis and acquire lumen bacteria from the environment after birth. However, in an established aphid population, the environment contains honeydew from older aphids, enabling an indirect sort of vertical transmission of gut bacteria from the founders of the population. The role of population history could be tested by moving populations of each biotype back and forth to areas where the other biotype has fed and defecated, and seeing if the microbiomes converge. Molecular genetic markers could be used to control for biotype replacement within the populations.
Microbiome studies in aphids frequently cite the role of Buchnera in providing essential amino acids and remedying the amino acid imbalance in plant sap. However, Buchnera merely redistributes nitrogen among amino acids; it does not increase the total nitrogen supply. Our study encountered low levels of five genera of typically nitrogen-fixing bacteria (Rhizobium, Bradyrhizobium, Azospirillum, Azospira, and Azohydromonas) in the greenbug microbiome without revealing whether they were in the gut or on the phylloplane, which was inadvertently sampled when the greenbugs were collected. This raises the question of whether appreciable nitrogen fixation occurs in the gut. The PICRUSt2 analysis did not reveal nif genes, indicating that the aphid microbiome does not fix nitrogen. Direct measurement of nitrogen fixation or acetylene reduction might be warranted to answer this question. Bacterial nitrogen fixation has been documented in wood-feeding termites of the family Kalotermitidae (Mullins and Su, 2023).
Despite the established role of Buchnera in supplying essential amino acids that are deficient in phloem sap, the PICRUSt2 results did not indicate increased expression of pathways to produce these amino acids relative to the rest of the microbiome. Nevertheless, there is experimental evidence that synthesis of various amino acids is not feedback inhibited or repressed in Buchnera (Wilcox et al., 2003). The most obvious difference that set Buchnera apart was the suppression of electron transport, which releases hydrogen ions to the exterior of the bacterial cell. This suppression is likely an adaptation to life within bacteriocyte cytoplasm, where acidification would be harmful. The diminution of gondoic, mycolic, and cis-vaccenic acids affects the fluidity and thus permeability of Buchnera cell membranes in seemingly contradictory ways. Diminishing mycolic acid expectedly increases fluidity and permeability, but decreasing gondoic and cis-vaccenic acids expectedly decreases fluidity (Marrakchi et al., 2014). Increased permeability would aid export of amino acids from the bacteroids to the bacteriocytes. Conclusions about the role of Buchnera are affected by the great variation among strains in genome size (from 412 to 646 kb) and gene content (354 to 587) (Chong et al., 2019); the strain in Schizaphis graminum is near the upper end of these ranges and expectedly retains more of the functionality of free-living bacteria.
Author’s note
Mention of a commercial or proprietary product does not constitute an endorsement by the US Federal Government.
Data availability statement
The datasets presented in this study can be found in online repositories. The names of the repository/repositories and accession number(s) can be found at: https://www.ncbi.nlm.nih.gov/, PRJNA1170337. Scripts can be found at https://github.com/cfcrane/greenbug-16S-microbiome.
Ethics statement
The manuscript presents research on animals that do not require ethical approval for their study.
Author contributions
YC: Conceptualization, Methodology, Writing – review & editing, Investigation, Writing – original draft, Formal analysis, Visualization. CC: Visualization, Formal analysis, Data curation, Methodology, Software, Writing – review & editing, Writing – original draft. CW: Methodology, Writing – review & editing, Investigation. BS: Resources, Conceptualization, Writing – review & editing, Funding acquisition, Project administration, Supervision.
Funding
The author(s) declare that financial support was received for the research and/or publication of this article. This research was supported by the USDA-ARS Research Project 5020-21000-000-D.
Acknowledgments
The authors are grateful thanks to Dr. Craig Tipton and his team from RTL Genomics assistance with sequence data processing and analysis.
Conflict of interest
The authors declare that the research was conducted in the absence of any commercial or financial relationships that could be construed as a potential conflict of interest.
Generative AI statement
The authors declare that no Gen AI was used in the creation of this manuscript.
Publisher’s note
All claims expressed in this article are solely those of the authors and do not necessarily represent those of their affiliated organizations, or those of the publisher, the editors and the reviewers. Any product that may be evaluated in this article, or claim that may be made by its manufacturer, is not guaranteed or endorsed by the publisher.
Supplementary material
The Supplementary material for this article can be found online at: https://www.frontiersin.org/articles/10.3389/fmicb.2025.1614492/full#supplementary-material
SUPPLEMENTARY FIGURE 1 | Mean zero-radius OTUs observed across infestation times. Vertical line segments at each point denote a 95% confidence interval for the infestation time. Horizontal dashed line shows the mean value across the full dataset.
SUPPLEMENTARY FIGURE 2 | Mean Shannon diversity across biotypes. Vertical line segments at each point denote a 95% confidence interval for the biotype. Horizontal dashed line shows the mean value across the full dataset.
SUPPLEMENTARY FIGURE 3 | Mean Shannon diversity across host plant species. Vertical line segments at each point denote a 95% confidence interval for the host plant species. Horizontal dashed line shows the mean value across the full dataset.
SUPPLEMENTARY FIGURE 4 | Mean Shannon diversity across cultivars. Vertical line bars at each point denote a 95% confidence interval for the cultivars. Horizontal dashed line shows the mean value across the full dataset.
SUPPLEMENTARY FIGURE 5 | Shannon diversity within the total microbiome data, grouped and colored by cultivars, facetted by biotype and host plant species. The median value and first and third quartiles in each group are also illustrated.
SUPPLEMENTARY FIGURE 6 | Mean Hill1 diversity across cultivars. Vertical line segments at each point denote a 95% confidence interval for the cultivars. Horizontal dashed line shows the mean value across the full dataset.
References
Anderson, M. J. (2001). A new method for non-parametric multivariate analysis of variance. Austral Ecol. 26, 32–46. doi: 10.1111/j.1442-9993.2001.01070.pp.x
Armstrong, J. S., Mornhinweg, D. W., Payton, M. E., and Puterka, G. J. (2016). The discovery of resistant sources of spring barley, Hordeum vulgare ssp. spontaneum, and unique greenbug biotypes. J. Econ. Entomol. 109, 434–438. doi: 10.1093/jee/tov320
Bansal, R., Rouf Mian, M. A., and Michel, A. P. (2013). Microbiome diversity of Aphis glycines with extensive superinfection in native and invasive populations. Environ. Microbiol. Rep. 6, 57–69. doi: 10.1111/1758-2229.12108
Bolyen, E., Rideout, J. R., Dillon, M. R., Bokulich, N. A., Abnet, C. C., Al-Ghalith, G. A., et al. (2019). Reproducible, interactive, scalable and extensible microbiome data science using QIIME 2. Nat. Biotechnol. 37, 852–857. doi: 10.1038/s41587-019-0209-9
Bowling, R., Wilde, G., and Margolies, D. (1998). Relative fitness of greenbug (Homoptera: Aphididae) biotypes E and I on sorghum, wheat, rye and barley. J. Econ. Entomol. 91, 1219–1223. doi: 10.1093/jee/91.5.1219
Braendle, C., Miura, T., Bickel, R., Singleton, A. W., Kambhampati, S., and Stern, D. L. (2003). Developmental origin and evolution of bacteriocytes in the aphid-Buchnera symbiosis. PLoS Biol. 1, 70–76. doi: 10.1371/journal.pbio.0000021
Callahan, B. J., McMurdie, P. J., Rosen, M. J., Han, A. W., Johnson, A. J. A., and Holmes, S. P. (2016). DADA2: high-resolution sample inference from Illumina amplicon data. Nat. Methods 13, 581–583. doi: 10.1038/nmeth.3869
Camacho, C., Coulouris, G., Avagyan, V., Ma, N., Papadopoulos, J., Bealer, K., et al. (2009). BLAST+: architecture and applications. BMC Bioinformatics 10:421. doi: 10.1186/1471-2105-10-421
Cassone, B. J., Redinbaugh, M. G., Dorrance, A. E., and Michel, A. P. (2015). Shifts in Buchnera aphidicola density in soybean aphids (Aphis glycines) feeding on virus-infected soybean. Insect Mol. Biol. 24, 422–431. doi: 10.1111/imb.12170
Casteel, C. L., and Hansen, A. K. (2014). Evaluating insect-microbiomes at the plant-insect interface. J. Chem. Ecol. 40, 836–847. doi: 10.1007/s10886-014-0475-4
Chong, R. A., Park, H., and Moran, N. A. (2019). Genome evolution of the obligate endosymbiont Buchnera aphidicola. Mol. Biol. Evol. 36, 1481–1489. doi: 10.1093/molbev/msz082
Crane, Y. M., Crane, C. F., and Schemerhorn, B. J. (2023). Differential gene expression between viruliferous and non-viruliferous Schizaphis graminum (Rondani). PLoS One 18:e0294013. doi: 10.1371/journal.pone.0294013
Csorba, A. B., Dinescu, S., Pircalabioru, G. G., Fora, C. G., Balint, J., Loxdale, H. D., et al. (2024). Aphid adaptation in a changing environment through their bacterial endosymbionts: an overview, including a new major cereal pest Rhopalosiphum maidis (Fitch) scenario. Symbiosis 93, 139–152. doi: 10.1007/s13199-024-00999-z
Deng, J., Liu, Q., Yu, Y. H., Li, J. J., and Huang, X. L. (2019). The detection and midgut intracellular location of Rickettsia symbiont in the camellia aphid (Aphis aurantii). Appl. Ecol. Environ. Res. 17, 12230–12212. Available online at: https://api.semanticscholar.org/CorpusID:249393168
Douglas, G. M., Maffei, V. J., Zaneveld, J. R., Yurgel, S. N., Brown, J. R., Taylor, C. M., et al. (2020). PICRUSt2 for prediction of metagenome functions. Nat. Biotechnol. 38, 685–688. doi: 10.1038/s41587-020-0548-6
Eddleman, B. R., Chang, C. C., and McCarl, B. A. (1999). “Economic benefits from grain sorghum variety improvement in the United States” in Economic, environmental, and social benefits of resistance in field crops. eds. B. R. Wiseman and J. A. Webster (Annapolis, MD: Entomological Society of America), 17–44.
Enders, L., Hansen, T., Brichler, K., Couture, J., and French, E. (2022). Aphis species specializing on milkweed harbor taxonomically similar bacterial communities that differ in richness and relative abundance of core symbionts. Sci. Rep. 12:21127. doi: 10.1038/s41598-022-25554-y
Fakhour, S., Ambroise, J., Renoz, F., Foray, V., Gala, J.-L., and Hance, T. (2018). A large-scale field study of bacterial communities in cereal aphid populations across Morocco. FEMS Microbiol. Ecol. 94:fiy003. doi: 10.1093/femsec/fiy003
Gallo-Franco, J. J., Duque-Gamboa, D. N., and Toro-Perea, N. (2019). Bacterial communities of Aphis gossypii and Myzus persicae (Hemiptera: Aphididae) from pepper crops (Capsicum sp.). Sci. Rep. 9:5766. doi: 10.1038/s41598-019-42232-8
Gauthier, J., Outreman, Y., Mieuzet, L., and Simon, J. (2015). Bacterial communities associated with host-adapted populations of pea aphids revealed by deep sequencing of 16S ribosomal DNA. PLoS One 10:e0120664. doi: 10.1371/journal.pone.0120664
Geng, J., Sui, Z., Dou, W., Miao, Y., Wang, T., Wei, X., et al. (2022). 16s rRNA gene sequencing reveals specific gut microbes common to medicinal insects. Front. Microbiol. 13:892767. doi: 10.3389/fmicb.2022.892767
Gomes, P. W. P., Mannochio-Russo, H., Mao, J., Zhao, H., Ancira, J., Tipton, C., et al. (2024). Co-occurrence network analysis reveals the alterations of the skin microbiome and metabolome in adults with mild to moderate atopic dermatitis. mSystems 9:e0111923. doi: 10.1128/msystems.01119-23
Gupta, A., and Nair, S. (2020). Dynamics of insect-microbiome interaction influence host and microbial symbiont. Front. Microbiol. 11:1357. doi: 10.3389/fmicb.2020.01357
Guyomar, C., Legeai, F., Jousselin, E., Mougel, C., Lemaitre, C., and Simon, J.-C. (2018). Multi-scale characterization of symbiont diversity in the pea aphid complex through metagenomic approaches. Microbiome 6:181. doi: 10.1186/s40168-018-0562-9
Haro, C., Angulta-Maeso, M., Metsis, M., Navas-Cortes, J. A., and Landa, B. B. (2021). Evaluation of established methods for DNA extraction and primer pairs targeting 16s rRNA gene for bacterial microbiota profiling of olive xylem sap. Front. Plant Sci. 12:640829. doi: 10.3389/fpls.2021.640829
He, B., Chen, X., Yang, H., and Cernava, T. (2021). Microbiome structure of the aphid Myzus persicae (Sulzer) is shaped by different Solanaceae plant diets. Front. Microbiol. 12:667257. doi: 10.3389/fmicb.2021.667257
Hill, M. O. (1973). Diversity and evenness: a unifying notation and its consequences. Ecology 54, 427–432. doi: 10.2307/1934352
Holt, J. R., Styer, A., White, J., Armstrong, J. S., Nibouche, S., Costet, L., et al. (2020). Differences in microbiota between two multilocus lineages of the sugarcane aphid (Melanaphis sacchari) in the continental United States. Ann. Entomol. Soc. Am. 113, 257–265. doi: 10.1093/aesa/saaa003
Ikuze, E., Cromwell, S., Ayayee, P., and Louis, J. (2024). Influence of microbes in mediating sorghum resistance to sugarcane aphids. Diversity 16:85. doi: 10.3390/d16020085
Jaccard, P. (1901). Étude comparative de la distribution florale dans une portion des Alpes et des Jura. Bull. Soc. Vaud. Sci. Nat. 37, 547–579. doi: 10.5169/seals-266450
Johnson, J. S., Spakowicz, D. J., Hong, B.-Y., Petersen, L. M., Demkowicz, P., Chen, L., et al. (2019). Evaluation of 16S rRNA gene sequencing for species and strain-level microbiome analysis. Nat. Commun. 10:5029. doi: 10.1038/s41467-019-13036-1
Jousselin, E., Clamens, A.-L., Galan, M., Bernard, M., Maman, S., Gschloessl, B., et al. (2016). Assessment of 16S rRNA amplicon illumina sequencing procedure for studying the microbiome of a symbiont-rich aphid genus. Mol. Ecol. Resour. 16, 628–640. doi: 10.1111/1755-0998.12478
Komaki, K., and Ishikawa, H. (1999). Intracellular bacterial symbionts of aphids possess many genomic copies per bacterium. J. Mol. Evol. 48, 717–722. doi: 10.1007/pl00006516
Komaki, K., and Ishikawa, H. (2000). Genomic copy number of intracellular bacterial symbionts of aphids varies in response to developmental stage and morph of their host. Insect Biochem. Mol. Bio. 30, 253–258. doi: 10.1016/s0965-1748(99)00125-3
Lai, C.-Y., and Baumann, P. (1992). Sequence-analysis of a DNA fragment from Buchnera-aphidicola (an endosymbiont of aphids) containing genes homologous to dnaG, rpoD, cysE, and secB. Gene 119, 113–118. doi: 10.1007/s002849900365
Lin, H., and Peddada, S. D. (2020). Analysis of compositions of microbiomes with bias correction. Nat. Commun. 11, 3514–3512. doi: 10.1038/s41467-020-17041-7
Lozupone, C., Hamady, M., and Knight, R. (2006). UniFrac—an online tool for comparing microbial community diversity in a phylogenetic context. BMC Bioinformatics 7:371. doi: 10.1186/1471-2105-7-371
Lozupone, C., and Knight, R. (2005). UniFrac: a new phylogenetic method for comparing microbial communities. Appl. Environ. Microbiol. 71, 8228–8235. doi: 10.1128/aem.71.12.8228-8235.2005
Ma, Y., He, H., Zhao, H., Xian, Y., Guo, H., Liu, B., et al. (2021). Microbiome diversity of cotton aphids (Aphis gossypii) is associated with host alternation. Sci. Rep. 11:5260. doi: 10.1038/s41598-021-83675-2
Manzano-Marín, A., Coeur d’acier, A., Clamens, A.-L., Cruaud, C., Barbe, V., and Jousselin, E. (2023). Co-obligate symbioses have repeatedly evolved across aphids, but partner identity and nutritional contributions vary across lineages. Peer Comm. J. 3:e46. doi: 10.24072/pcjournal.278
Marrakchi, H., Lanéelle, M. A., and Daffé, M. (2014). Mycolic acids: structures, biosynthesis, and beyond. Chem. Biol. 21, 67–85. doi: 10.1016/j.chembiol.2013.11.011
McLean, A. H. C., Godfray, H. C. J., Ellers, J., and Henry, L. M. (2019). Host relatedness influences the composition of aphid microbiomes. Environ. Microbiol. Rep. 11, 808–816. doi: 10.1111/1758-2229.12795
McMurdie, P. J., and Holmes, S. (2013). phyloseq: an R package for reproducible interactive analysis and graphics of microbiome census data. PLoS One 8:e61217. doi: 10.1371/journal.pone.0061217
Michalik, A., Szklarzewicz, T., Jankowska, W., and Wieczorek, K. (2014). Endosymbiotic microorganisms of aphids (Hemiptera: Sternorrhyncha: Aphidoidea): ultrastructure, distribution and transovarial transmission. Eur. J. Entomol. 111, 91–104. doi: 10.14411/eje.2014.011
Mullins, A., and Su, N. (2023). Nitrogen fixation in different termite lineages and diets. Ann. Entomol. Soc. 116, 372–375. doi: 10.1093/aesa/saad027
Munson, M. A., Baumann, L., and Baumann, P. (1993). Buchnera aphidicola (a prokaryotic endosymbiont of aphids) contains a putative 16S rRNA operon unlinked to the 23S rRNA-endcoding gene: sequence determination, and promoter and terminator analysis. Gene 137, 171–178. doi: 10.1016/0378-1119(93)90003-L
Munson, M. A., Baumann, P., and Kinsey, M. G. (1991). Buchnera gen. Nov. and Buchnera aphidicola sp. nov., a taxon consisting of the mycetocyte-associated, primary endosymbionts of aphids. Int. J. Syst. Bacteriol. 41, 566–568. doi: 10.1099/00207713-41-4-566
Neiers, F., Saliou, J.-M., Briand, L., and Robichon, A. (2021). Adaptive variation of Buchnera endosymbiont density in aphid host Acyrthosiphon pisum controlled by environmental conditions. ACS Omega 6, 17902–17914. doi: 10.1021/acsomega.1c01465
Oksanen, J., Simpson, G., Blanchet, F., Kindt, R., Legendre, P., and Minchin, P. (2025). vegan: Community Ecology Package. R package version 2.7-0. Available online at: https://github.com/vegandevs/vegan
Porter, D. R., Burd, J. D., Surfran, K. A., Webster, J. A., and Teetes, G. L. (1997). Greenbug (Homoptera: Aphididae) biotypes: selected by resistant varieties or preadapted opportunists? J. Econ. Entomol. 90, 1055–1065. doi: 10.1093/jee/90.5.1055
Porter, D. R., Webster, J. A., and Friebe, B. (1994). Inheritance of greenbug biotype G resistance in wheat. Crop Sci. 34, 625–628. doi: 10.2135/cropsci1994.0011183X003400030004x
Quast, C., Pruesse, E., Yilmaz, P., Gerken, J., Schweer, T., Yarza, P., et al. (2013). The SILVA ribosomal RNA gene database project: improved data processing and web-based tools. Nucleic Acids Res. 41, D590–D596. doi: 10.1093/nar/gks1219
Rauhbakhsh, D., and Baumann, P. (1995). Characterization of a putative 23S-5S rRNA operon of Buchnera-aphidicola (endosymbiont of aphids) unlinked to the 16S r-RNA-encoding gene. Gene 155, 107–112. doi: 10.1016/0378-1119(94)00910-k
Royer, T. A., Pendleton, B. B., Elliott, N. C., and Giles, K. L. (2015). Greenbug (Hemiptera: Aphididae) biology, ecology, and management in wheat and sorghum. J. Integr. Pest Manag. 6:19. doi: 10.1093/jipm/pmv018
Salter, S. J., Cox, M. J., Turek, E. M., Calus, S. T., Cookson, W. O., Moffatt, M. F., et al. (2014). Reagent and laboratory contamination can critically impact sequence-based microbiome analyses. BMC Biol. 12:87. doi: 10.1186/s12915-014-0087-z
Shannon, C. E. (1948). A mathematical theory of communication. Bell Syst. Tech. J. 27, 379–423. doi: 10.1002/j.1538-7305.1948.tb01338.x
Stinson, L. F., Keelan, J. A., and Payne, M. S. (2018). Identification and removal of contaminating microbial DNA from PCR reagents: impact on low-biomass microbiome analyses. Lett. Appl. Microbiol. 68, 2–8. doi: 10.1111/lam.13091
Thijs, S., de Beeck, M. O., Beckers, B., Truyens, S., Stevens, V., van Hamme, J. D., et al. (2017). Comparative evaluation of four bacteria-specific primer pairs for 16S rRNA gene surveys. Front. Microbiol. 8:494. doi: 10.3389/fmicb.2017.00494
Tukey, J. W. (1949). Comparing individual means in the analysis of variance. Biometrics 5, 99–114. doi: 10.2307/3001913
Wilcox, J. L., Dunbar, H. E., Wolfinger, R. D., and Moran, N. A. (2003). Consequences of reductive evolution for gene expression in an obligate endosymbiont. Mol. Microbiol. 48, 1491–1500. doi: 10.1046/j.1365-2958.2003.03522.x
Wilson, A. C. C., and Duncan, R. P. (2015). Signatures of host/symbiont genome coevolution in insect nutritional endosymbiosis. Proc. Natl. Acad. Sci. U.S.A. 112, 10255–10261. doi: 10.1073/pnas.1423305112
Wu, H.-X., Chen, X., Chen, H., Lu, Q., Yang, Z., Ren, W., et al. (2018). Variation and diversification of the microbiome of Schlechtendalia chinensis on two alternate host plants. PLoS One 13:e0200049. doi: 10.1371/journal.pone.0200049
Xu, S., Jiang, L., Qiao, G., and Chen, J. (2021). Diversity of bacterial symbionts associated with Myzus persicae (Sulzer) (Hemiptera: Aphididae: Aphidinae) revealed by 16S rRNA Illumina sequencing. Microbiol Ecol. 81, 784–794. doi: 10.1007/s00248-020-01622-6
Xu, X., Mornhinweg, D., Bai, G., Li, G., Bian, R., Bernardo, A., et al. (2023). Identification of a new Rsg1 allele conferring resistance to multiple greenbug biotypes from barley accessions PI 499276 and PI 566459. Plant Genome 17:e20418. doi: 10.1002/tpg2.20418
Yilmaz, P., Parfrey, L. W., Yarzam, P., Gerken, J., Pruesse, E., Quast, C., et al. (2014). The SILVA and “All-species Living Tree Project (LTP)” taxonomic frameworks. Nucleic Acids Res. 42, D643–D648. doi: 10.1093/nar/gkt1209
Yun, J.-H., Roh, S. W., Whon, T. W., Jung, M.-J., Kim, M.-S., Park, D.-S., et al. (2014). Insect gut bacterial diversity determined by environmental habitat, diet, developmental stage, and phylogeny of host. Appl. Environ. Microbiol. 80, 5254–5264. doi: 10.1128/aem.01226-14
Zepeda-Paulo, F., Ortiz-Martinez, S., Silva, A. X., and Lavandero, B. (2018). Low bacterial community diversity in two introduced aphid pests revealed with 16S rRNA amplicon sequencing. Peer J. 6:e4725. doi: 10.7717/peerj.4725
Zhang, H., Yan, L., and Huang, Y. (2024). SgR1, encoding a leucine-rich repeat containing receptor-like protein, is a major aphid (Schizaphis graminum) resistance gene in sorghum. Int. J. Mol. Sci. 26:19. doi: 10.3390/ijms26010019
Keywords: Schizaphis graminum, RNA-seq, microbiome, 16S rRNA, gut microflora, symbiont
Citation: Crane YM, Crane CF, Webb C and Schemerhorn BJ (2025) Biotype and host relatedness influence the composition of bacterial microbiomes in Schizaphis graminum aphids. Front. Microbiol. 16:1614492. doi: 10.3389/fmicb.2025.1614492
Edited by:
Anna-Maria Botha-Oberholster, Stellenbosch University, South AfricaReviewed by:
Emily Luna, Colorado State University, United StatesFrancois Burger, Stellenbosch University, South Africa
Copyright This work is authored by Yan M. Crane, Charles F. Crane, Christian Webb and Brandon J. Schemerhorn on behalf of the U.S. Government and as regards Dr. Crane, Dr. Crane, Mr. Webb, Dr. Schemerhorn and the U.S. Government, is not subject to copyright protection in the United States. Foreign and other copyrights may apply. This is an open-access article distributed under the terms of the Creative Commons Attribution License (CC BY). The use, distribution or reproduction in other forums is permitted, provided the original author(s) and the copyright owner(s) are credited and that the original publication in this journal is cited, in accordance with accepted academic practice. No use, distribution or reproduction is permitted which does not comply with these terms.
*Correspondence: Brandon J. Schemerhorn, YnJhbmRpLnNjaGVtZXJob3JuQHVzZGEuZ292
†ORCID: Yan M. Crane, http://orcid.org/0000-0002-5808-4898
Charles F. Crane, http://orcid.org/0000-0002-7606-185X
Brandon J. Schemerhorn, http://orcid.org/0000-0003-0247-478X