 Boqian Wang1†
 Renjie Meng1,2†
 Zhong Li3†
 Mingda Hu1
 Xin Wang1
 Yunxiang Zhao1
 Zili Chai1
 Yuan Jin1
 Junjie Yue1Wei Chen2*
 Hongguang Ren1*
- 1Laboratory of Advanced Biotechnology, Beijing Institute of Biotechnology, Beijing, China
- 2School of Computer, National University of Defense Technology, Changsha, China
- 3Department of Stomatology, Hainan Hospital of Chinese PLA General Hospital, Sanya, China
Introduction: Antibiotic resistance is emerging as a critical global public health threat. The precise prediction of bacterial antibiotic resistance genes (ARGs) and phenotypes is essential to understand resistance mechanisms and guide clinical antibiotic use. Although high-throughput DNA sequencing provides a foundation for identification, current methods lack precision and often require manual intervention.
Methods: We developed a novel deep learning model for ARG prediction by integrating bacterial protein sequences using two protein language models, ProtBert-BFD and ESM-1b. The model further employs data augmentation techniques and Long Short-Term Memory (LSTM) networks to enhance feature extraction and classification performance.
Results: The proposed model demonstrated superior performance compared to existing methods, achieving higher accuracy, precision, recall, and F1-score. It significantly reduced both false negative and false positive predictions in identifying ARGs, providing a robust computational tool for reliable gene-level resistance detection. Moreover, the model was successfully applied to predict bacterial resistance phenotypes, demonstrating its potential for clinical applicability.
Discussion: This study presents an accurate and automated approach for predicting antibiotic resistance genes and phenotypes, reducing the need for manual verification. The model offers a powerful technical tool that can support clinical decision-making and guide antibiotic use, thereby addressing an urgent need in the fight against antimicrobial resistance.
1 Introduction
Bacterial antibiotic resistance transmission has become one of the greatest threats to global public health, with an estimated 700,000 deaths worldwide attributed to bacterial resistance, and this number is expected to rise to 10 million by 2050 (Sunuwar and Azad, 2021; Lázár and Kishony, 2019). Antibiotic Resistance Genes (ARGs) can be transmitted between different strains through various mediums such as food, water, animals, and humans, with hospital environments particularly facilitating the spread of resistant phenotypes and reducing the efficacy of antibiotic treatments (Karkman et al., 2018; Wang et al., 2018). Therefore, accurately identifying resistance genes and predicting strain resistance phenotypes is crucial for guiding clinical medication.
The advent of high-throughput DNA sequencing technology now provides a powerful tool for profiling the entire DNA complement, including ARGs, which encode proteins that confer resistance to antibiotics (Arango-Argoty et al., 2018). Focusing on DNA/protein sequences, bioinformatics is widely applied in the identification and analysis of resistance genes. Traditional identification methods are based on the computational principle of comparison of the ARGs database, using programs such as BLAST, Bowtie, or DIAMOND with a preset similarity cutoff and alignment length requirement (Boolchandani et al., 2019; Lakin et al., 2017; Li and Durbin, 2009). However, the false negative rate can be very high, that is a large number of actual ARGs will be predicted as non-ARGs by the best hit approaches above (Arango-Argoty et al., 2018). At the same time, the high sequence similarity between some non-resistant and resistant genes may also lead to false-positive predictions (Mathys et al., 2014; Fitzgibbon et al., 2021).
Comparatively, the AI-based algorithm for ARGs prediction demonstrated superior predictive performance, which could effectively reduce both false-negative and false-positive prediction outcomes simultaneously (Sunuwar and Azad, 2021; Alley et al., 2019; Li et al., 2018; Riesselman et al., 2018; Su et al., 2019; Sakagianni et al., 2023; Kim et al., 2022). For example, DeepARG (Arango-Argoty et al., 2018) effectively identifies ARGs by comparing experimental sample data with known sequences using a multilayer perceptron model. Additionally, deep learning methods like HMD-ARG (Li et al., 2021) have successfully distinguished between various resistance gene antibiotic group categories. These methods uniformly employ either conventional or deep learning models, which not only exhibit poor interpretability but also yield predictions constrained by training data, resulting in limited scalability.
To solve the problems above, we designed a novel ARGs prediction model by integrating pretrained protein language models for feature encoding and long short-term memory (LSTM) networks with multi-head (MH) attention mechanisms for feature extraction (Elnaggar et al., 2021; Al-Deen et al., 2021; Yu et al., 2019; Rives et al., 2021). Since this model is primarily based on large-scale pretrained protein encoding processes, it can enhance biological interpretability from the perspective of protein linguistics while simultaneously improving scalability for predicting diverse bacterial proteins. Finally, a comparison with traditional nucleotide-based (best hit) and emerging AI-based ARGs identification methods shows that our model outperforms these methods in various metrics such as accuracy, precision, recall, and F1-score, which means a significantly reduction of both false-negative and false-positive prediction rates across different microbial communities.
2 Materials and methods
2.1 Overall framework
The deep learning framework (Figure 1) proposed in this paper consists of four main modules, which are separately feature extraction module, data processing module, classification model and result integration module. The relevant codes can be found on GitHub: https://github.com/wr-sky/ARGs/tree/main/Code.
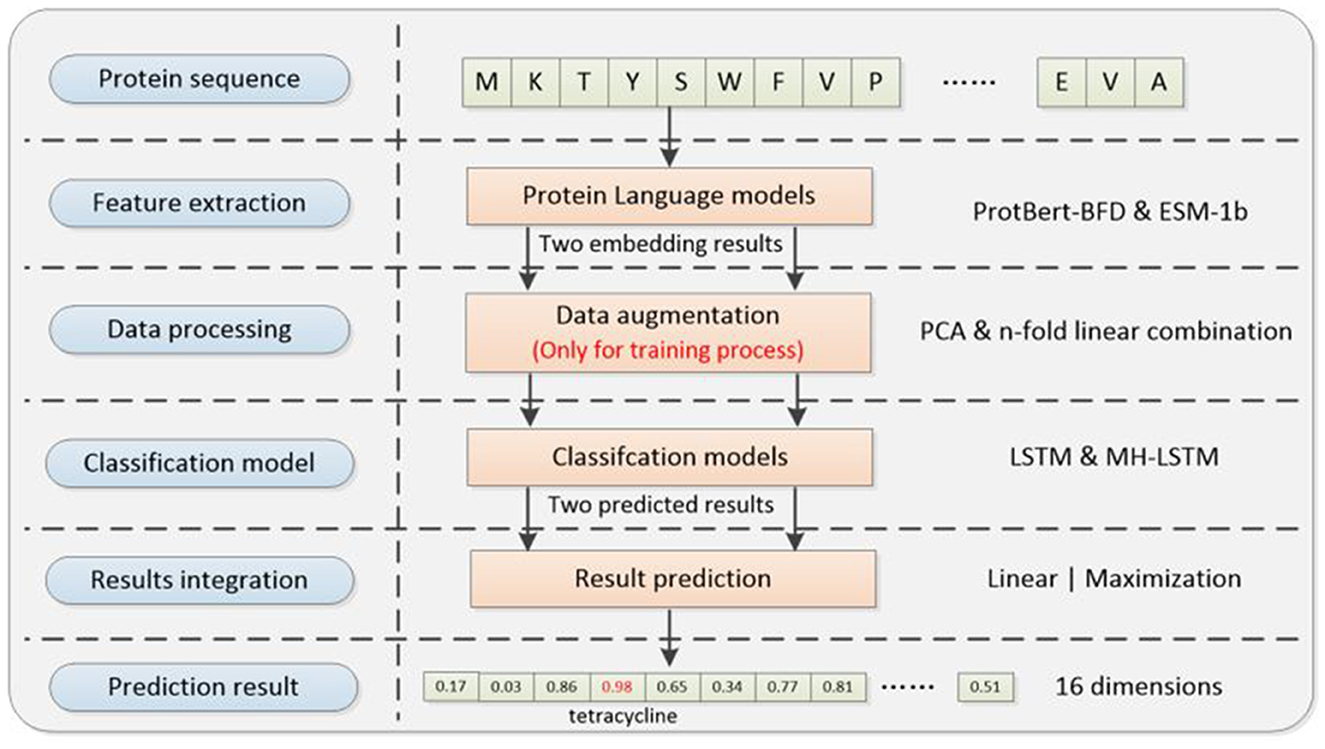
Figure 1. Overall framework of the system architecture. (1) Feature extraction: this step utilizes two protein language models, ProtBert-BFD and ESM-1b, which focus on different structural information of proteins to construct two sets of embedding feature datasets. (2) Data processing: this step utilizes a cross-referencing data augmentation method based on the ProtBert-BFD and ESM-1b embedding results to address the issue of data imbalance (only for training process). (3) Classification model: by exploring different model structure combinations, it assesses the adaptability of various models in capturing different feature vectors, given their varied focus. (4) Result integration: it includes two different ensemble learning strategies to integrate results from multiple models, enhancing the overall generalization performance and predictive effectiveness of the system.
Firstly, we utilize two different protein language models [ProtBert-BFD (Elnaggar et al., 2021) & ESM-1b (Rives et al., 2021)] to extract features from proteins sequences, which can facilitate both data augmentation and prediction accuracy compared with the single-language model. Secondly, by cross-referencing two protein language models, we designed a novel data augmentation method to enhance less prevalent ARGs examples during training process, which makes the training set more balanced. Thirdly, we used two semantic-based encoding models (LSTM & MH-LSTM) to classify the embedding results separately from ProtBert-BFD and ESM-1b. Finally, our framework provides a 16-dimension vector by integrating two classification results above. The position with the maximal value will be chosen and its corresponding ARGs type is the final prediction result.
2.2 Protein sequence
To ensure the authority and comparability of the data, this study primarily uses data from DeepARG and HMD-ARG as the basic ARGs dataset (Arango-Argoty et al., 2018; Li et al., 2021). Besides, 2,000 non-resistant genes reported in HyperVR (Ji et al., 2023) were included for related experiments. Protein sequences in three datasets (Table 1) are compared with blastp, removing completely identical sequences (identity = 100% & coverage = 100%). For ease of reference and result reproduction, detailed information of the protein sequence in Table 1 are uploaded to GihHub: https://github.com/wr-sky/ARGs/tree/main/Data.
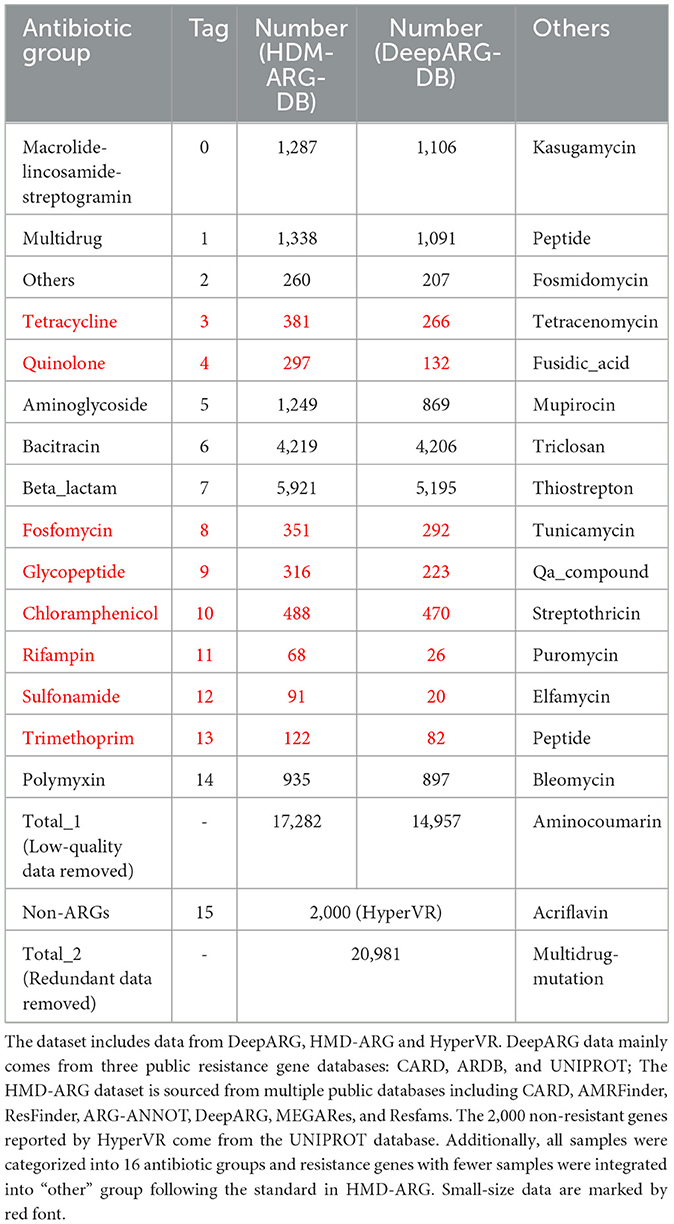
Table 1. Training and testing dataset composition.
All ARGs in Table 1 are categorized into 16 groups. Aside from the ARGs categorized as “other”, some resistance gene groups (marked in black) are more abundant, particularly those associated with bacitracin and beta-lactam resistance. In contrast, the remaining resistance gene groups (marked in red) are less prevalent. Each protein sequence, including the resistance or non-resistance genes, will be taken as initial input for our proposed framework.
2.3 Feature extraction
ARGs often contribute to bacterial metabolism through specific structures (both 2D and 3D) of the proteins they encode, resulting in resistance by degrading, obstructing, or expelling antibiotics (Darby et al., 2023; Kakoullis et al., 2021). We have analyzed existing protein language models and their characteristics (Supplementary material) (Elnaggar et al., 2021; Lin et al., 2023; Rao et al., 2020; Meier et al., 2021; Hsu et al., 2022). Based on the specifics of this study, we selected two pre-trained protein language models as upstream feature extractors to embed information carried by protein sequences. The ProtBert-BFD model extracts embedding vectors that capture key information from protein sequences and is also used in downstream tasks such as secondary structure prediction (Elnaggar et al., 2021). The ESM-1b model, through logistic regression and linear projection, encodes embedding features containing the secondary and tertiary structural information of protein sequences (Rives et al., 2021). Thus, this step employs these two models as feature extraction methods, embedding the sequence and structural features of the target proteins from different dimensions.
Both models take the protein sequence as input. ProtBert-BFD encodes each amino acid as a 30-dimensional vector. Each protein sequence is encoded into a 30,720-dimensional vector by padding 0 or vector truncation (1,024 amino acids). Similarly, ESM-1b encodes each amino acid as a 1,280-dimensional vector and each protein sequence is encoded into a 1,310,720-dimensional vector (1,024 amino acids).
2.4 Data augmentation
In Natural Language Processing (NLP) tasks, data augmentation for small datasets is a crucial strategy to enhance model performance and generalization (Chen et al., 2023). However, due to differences between resistance gene protein sequences and natural language features, traditional NLP data augmentation strategies cannot be directly applied to this task. Therefore, For the first time, we designed a new data augmentation method for the limited antibiotic resistance data (Figure 2). This method exponentially increased the limited amount of resistant gene data (marked as red in Table 1), making the input data for each type of resistant gene more balanced.
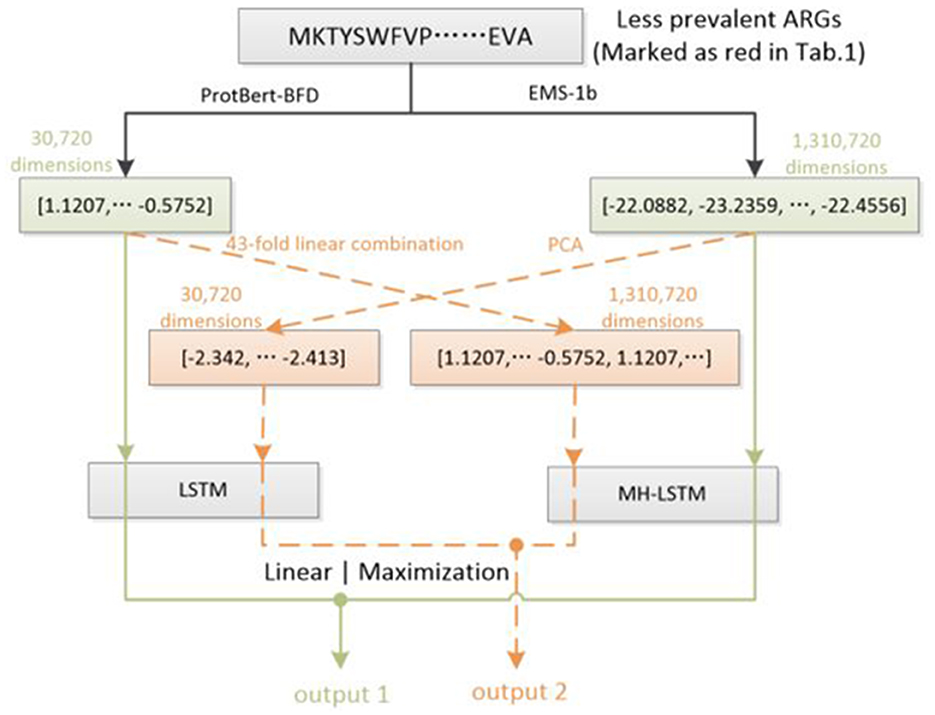
Figure 2. Dataset augmentation based on ProtBert-BFD and ESM-1b embedding results. For ESM-1b, the embedding results of each amino acid (1,280 dimensions) will be decreased to 32 dimensions by PCA. Each embedding results will be concatenated in order to represent a protein sequence (overall 32,768 dimensions) and truncated at the end according to the ProtBert-BFD's embedding results (30,720 dimensions). For ProtBert-BFD, the embedding results of the whole protein sequence (30,720 dimensions) will be extended using a 43-fold linear concatenation to 1,320,860 dimensions, which will be further truncated at the end according to the EMS-1b's embedding results (1,310,720 dimensions). By this way, each example in less prevalent ARGs will be utilized twice during training process, which can potentially double the training set of the corresponding ARGs.
We utilize Principal Component Analysis (PCA) (Hasan and Abdulazeez, 2021) to decrease ESM-1b's embedding results of each amino acid from 1,280 dimensions to 32 dimensions. The overall dimension of a protein sequence's (1,024 amino acids) embedding results is 32,768, which will further be truncated to 30,720 dimensions. For the embedding results of ProtBert-BFD, we use a 43-fold linear concatenation to directly extend the feature vector of the entire protein to 1,320,860 dimensions, which is also truncated to 1,310,720 dimensions. For each input, the green line forms one training process, and the orange line forms another training process, which can double the examples in less prevalent ARGs (red groups in Table 1).
The overall test results, which will be illustrated in the “Results” section below, provide evidence to support the feasibility of such a transformation between the two embedding spaces.
2.5 Classification model
LSTM is well-suited for handling long-range dependencies in language data and can effectively capture contextual information in sequential data, making it particularly suitable for processing the temporal nature of linguistic data (Yu et al., 2019). On the other hand, MH-LSTM introduces a multi-head mechanism that allows for the parallel processing of multiple types of contextual information, further enhancing the model's ability to understand the complex syntax, semantics, and ambiguity in language. Therefore, both LSTM and MH-LSTM are ideal choices for processing linguistically encoded data, as they are better at capturing the complex dependencies and multiple layers of contextual information in language, ultimately improving the model's performance and expressive power. In this paper, we employed Multi-Head Attention LSTM (MH-LSTM) and LSTM to extract effective information while reducing the dimensionality of the protein embedding vector (Figure 3). By mixing different models, MH-LSTM can fully extract features from high-dimensional embedding results (ESM-1b), while LSTM can avoid over-abstraction of relatively low-dimensional embedding results (ProtBert-BFD).

Figure 3. The architectures of classification models. (a) LSTM: A LSTM model for classification is utilized for the relatively lower-dimensional encoded data from ProtBert-BFD and its augmented data. (b) MH-LSTM: A classification model that integrates LSTM with MH is utilized for the high-dimensional encoded data from ESM-1b and its augmented data.
The input feature size is 30,720 dimensions for LSTM and 1,310,720 dimensions for MH-LSTM. Both models have hidden layers and output layers of size 512. The final classification is performed by a linear layer with GELU activation, which takes input sizes of 512, 1,024, and 2,048 across three layers (Table 2). These architecture parameters were determined through experimentation and preliminary trials. The output of the linear layer is a 16-dimensional vector, with each dimension representing a group of ARGs (Table 1).
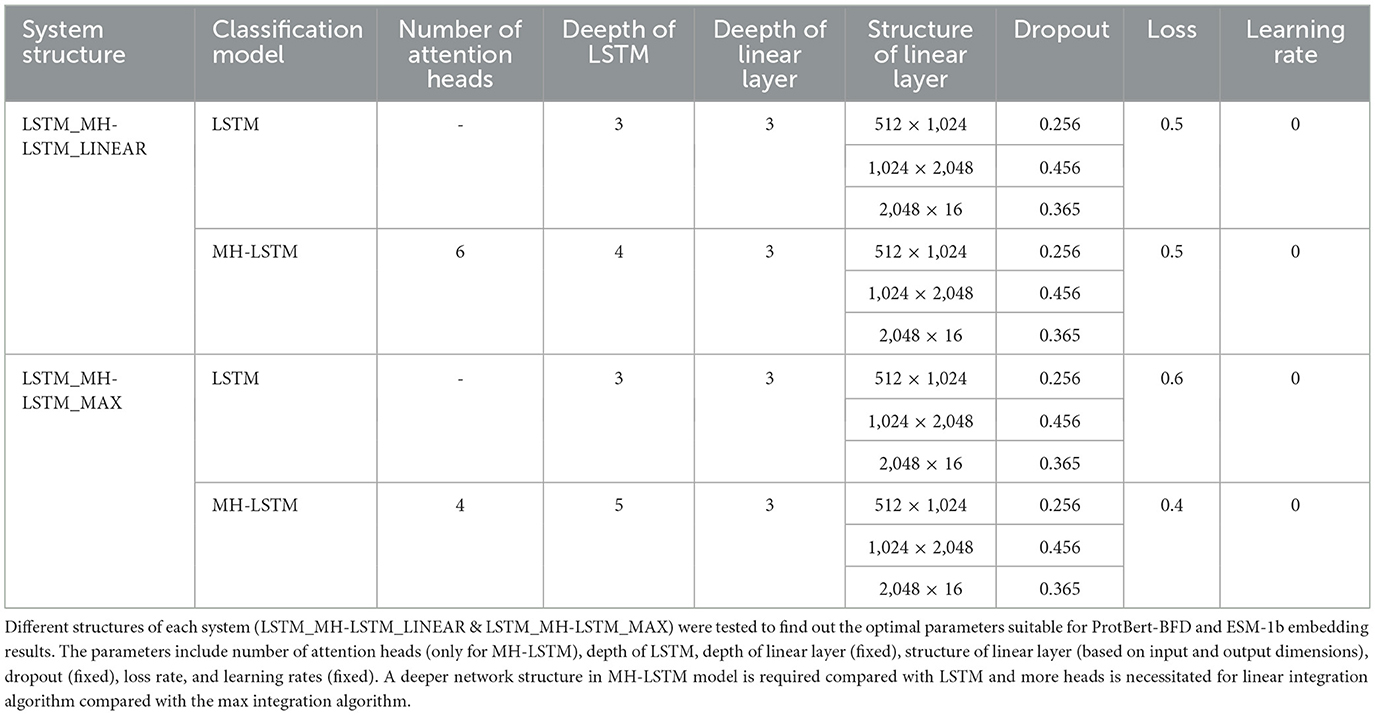
Table 2. The optimal parameters for each structure.
2.6 Result integration
By using ensemble learning, combining the predictions of two classification models can effectively reduce overfitting (Ying, 2019). At the same time, it increases the diversity and robustness of the model, thereby potentially improving prediction accuracy. In our proposed framework, we process the results of the two models using linear integration or probability maximization integration methods (Figure 4).
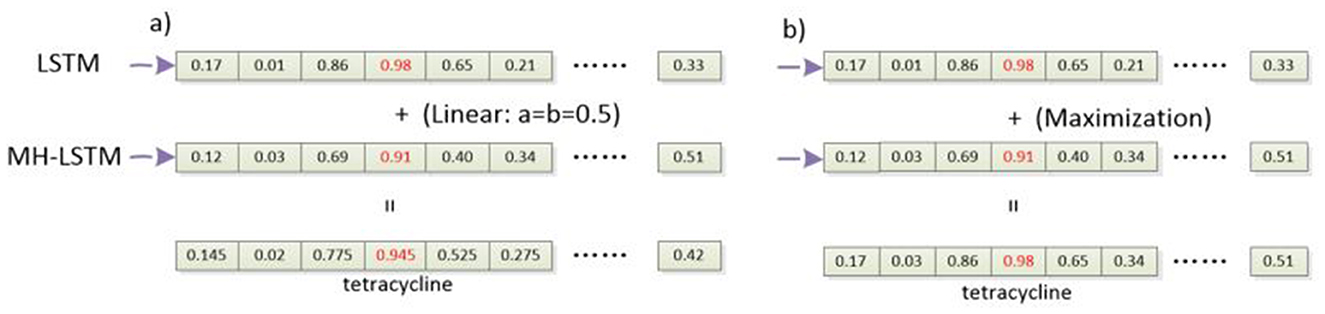
Figure 4. The process of integrating classification results. (a) Linear integration: linear integration involves process to weight and sum the prediction probabilities of the two models. (b) Probability maximization integration: probability maximization integration, on the other hand, compares the probability values of the predicted labels from both models and the label associated with the higher probability is chosen as the final prediction.
Especially, for linear integration (Figure 4a), the probability values output by the two models are linearly combined, as described by Equations 1, 2.
In this context, logits1 represents the probability vector output by the LSTM network, and logits2 represents the probability vector output by the MH-LSTM. a and b are constant coefficients, and their sum equals 1. Both a and b are initialized to 0.5 and dynamically adjusted during the training process. The argmax() function returns the index y_hat corresponding to the maximum probability in the logits, which indicates the final predicted label.
For probability maximization integration (Figure 4b), the probabilities corresponding to their predicted labels are compared, and the label associated with the higher probability is selected as the final prediction, as described by Equations 3, 4.
max_prob_1 and max_prob_2 represent the maximum probability values in the probability vectors output by the two models. max_index_1 and max_index_2 indicate the predicted label types corresponding to these maximum probability values. The max() function computes the maximum value and its index in the probability vectors. Then, the sizes of max_prob_1 and max_prob_2 are compared, and the label associated with the larger probability is chosen as the final predicted type.
Although appropriately increasing the number of models in ensemble learning can usually further improve prediction performance, it is also necessary to consider computational resources and effective fusion methods. Taking these factors into account, we adopt two models (ProtBert-BFD with LSTM & ESM-1b with MH-LSTM) in ensemble learning.
2.7 Training and testing
Based on the aforementioned structures, we developed two overall architectures of the prediction model: Linear-integration-based architecture (LSTM_MH-LSTM_LINEAR) and Probability-maximization-based architecture (LSTM_MH-LSTM_MAX). We constructed datasets for training, validation, and test purposes. The training process includes data processing step, and the other two processes exclude the step (Figure 5).
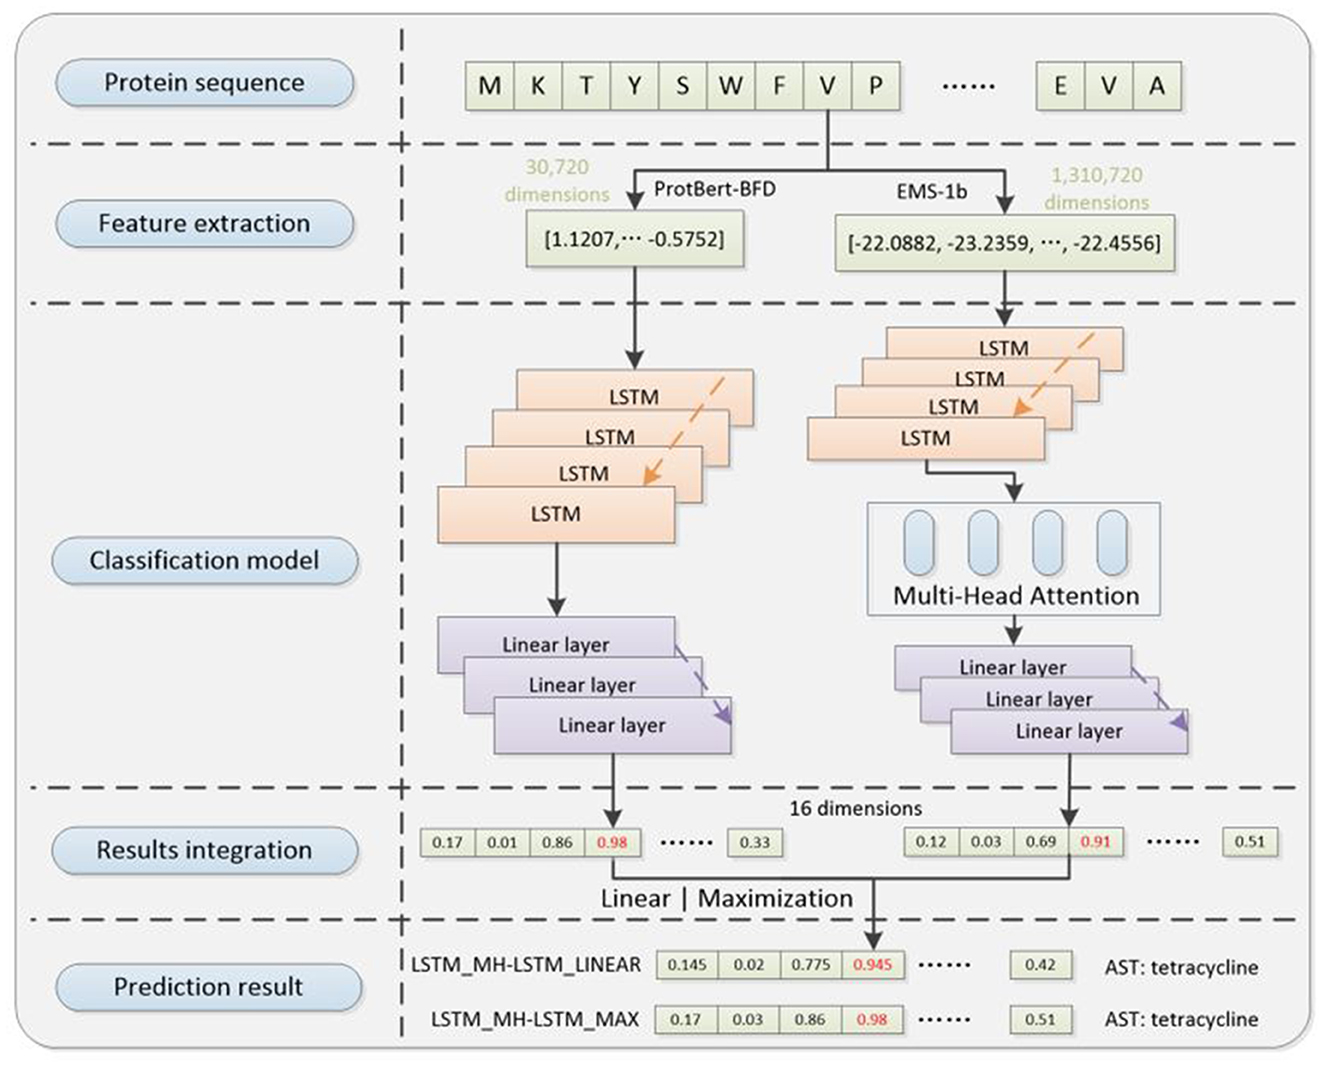
Figure 5. The diagram of LSTM_MH-LSTM_LINEAR and LSTM_MH-LSTM_Max structure in validation and test processes. It includes pre-trained ProtBert-BFD and ESM-1b protein language embedding models in the feature extraction step, LSTM and MH-LSTM language-analysis models (with linear layers) in the classification step, and linear or maximization algorithm in the results integration step.
We used the train_test_split function from the scikit-learn machine learning toolkit in Python to partition the data into training, validation, and test sets with a ratio of 0.6/0.2/0.2. We also selected Adam optimizer with a learning rate of 2e-4 for network training. To avoid overfitting, the optimizer includes a training termination mechanism: if the accuracy does not improve after 30 iterations, the training process will be terminated early, and the model weights will be saved. The final experimental results are obtained by testing the model on the test set. Performance evaluation is conducted using four metrics: accuracy, precision, recall, and F1 score, which provide a comprehensive assessment of the model's performance. Their mathematical expressions are shown in Equations 5–8, respectively.
In this context:
• TP (True Positive): The sample is positive, and the prediction is also positive.
• FP (False Positive): The sample is negative, but the prediction is positive.
• TN (True Negative): The sample is negative, and the prediction is also negative.
• FN (False Negative): The sample is positive, but the prediction is negative.
Precision represents the proportion of samples predicted as positive that are actually positive. Recall represents the proportion of actual positive samples that are correctly predicted as positive. The F1 Score considers both precision and recall, providing a comprehensive measure of the model's performance. These four metrics collectively account for both false-negative and false-positive scenarios. When all metrics approach 1, it indicates superior model performance with minimized misclassification rates for both negative and positive samples.
2.8 AMR phenotype prediction
Predicting the presence of ARGs fundamentally indicates whether a bacterial strain has the potential to develop a resistant phenotype. Comparatively, direct prediction of phenotypic resistance can more effectively guide clinical antibiotic selection for bacterial infections. However, defining the antimicrobial resistance (AMR) phenotype of a target bacterial strain solely based on the aggregate features of all its resistance genes would lead to substantially elevated false-positive prediction rates. Therefore, in this subsection, we further try to adapt the architecture of our previously proposed model to predict the whole-bacterial antimicrobial resistance (AMR) phenotypes.
In critical care, combination antibiotic therapy is often employed to achieve the most rapid therapeutic effect. Therefore, false-positive predictions should be rigorously minimized, as they may lead to the avoidance of first-line antibiotics that would have been most effective. In contrast, false-negative predictions in the context of multi-antibiotic regimens typically have less detrimental impact on overall therapeutic efficacy. As traditional best-hit approach has a low false-positive rate (Arango-Argoty et al., 2018), we incorporated this approach [CARD with blast (Alcock et al., 2023)] into our model as a whole-genome screening tool at the bacterial species level. The incorporation of CARD serves dual purposes: primarily filter out both negative and false-positive genes to reduce false-positive AMR predictions, while concurrently reducing computational load for downstream AI networks to accelerate the entire prediction pipeline.
The training and validation processes are omitted and only the test process is committed. The experimental steps (Figure 6) are as follows.
1) Data collection: we processed the proteome of each bacterial strain as a complete testing procedure. Each individual protein sequence from the strain was sequentially fed as input to our prediction system and the phenotype prediction result for the strain is the sum of the results for each protein.
2) Protein sequence screening: each protein sequence will be primarily screened by CARD RGI algorithm (v3.1) before the prediction process. RGI screening standards are categorized into Strict and Perfect. For downstream analysis, we retained only proteins receiving positive predictions while filtering out all negative predictions, thereby substantially minimizing false-positive identifications. The relevant codes can be found on GitHub: https://github.com/wr-sky/ARGs/tree/main/Code/3_CARD.
3) Feature Extraction and Prediction (Similar to ARGs classification): for each protein sequence in a single strain, embedding results are extracted using ProtBert-BFD and ESM-1b. These results are then processed by the LSTM (suitable for lower-dimensional ProtBert-BFD data) and MH-LSTM (suitable for higher-dimensional ESM-1b data) with the best model parameters to realize transfer application prediction.
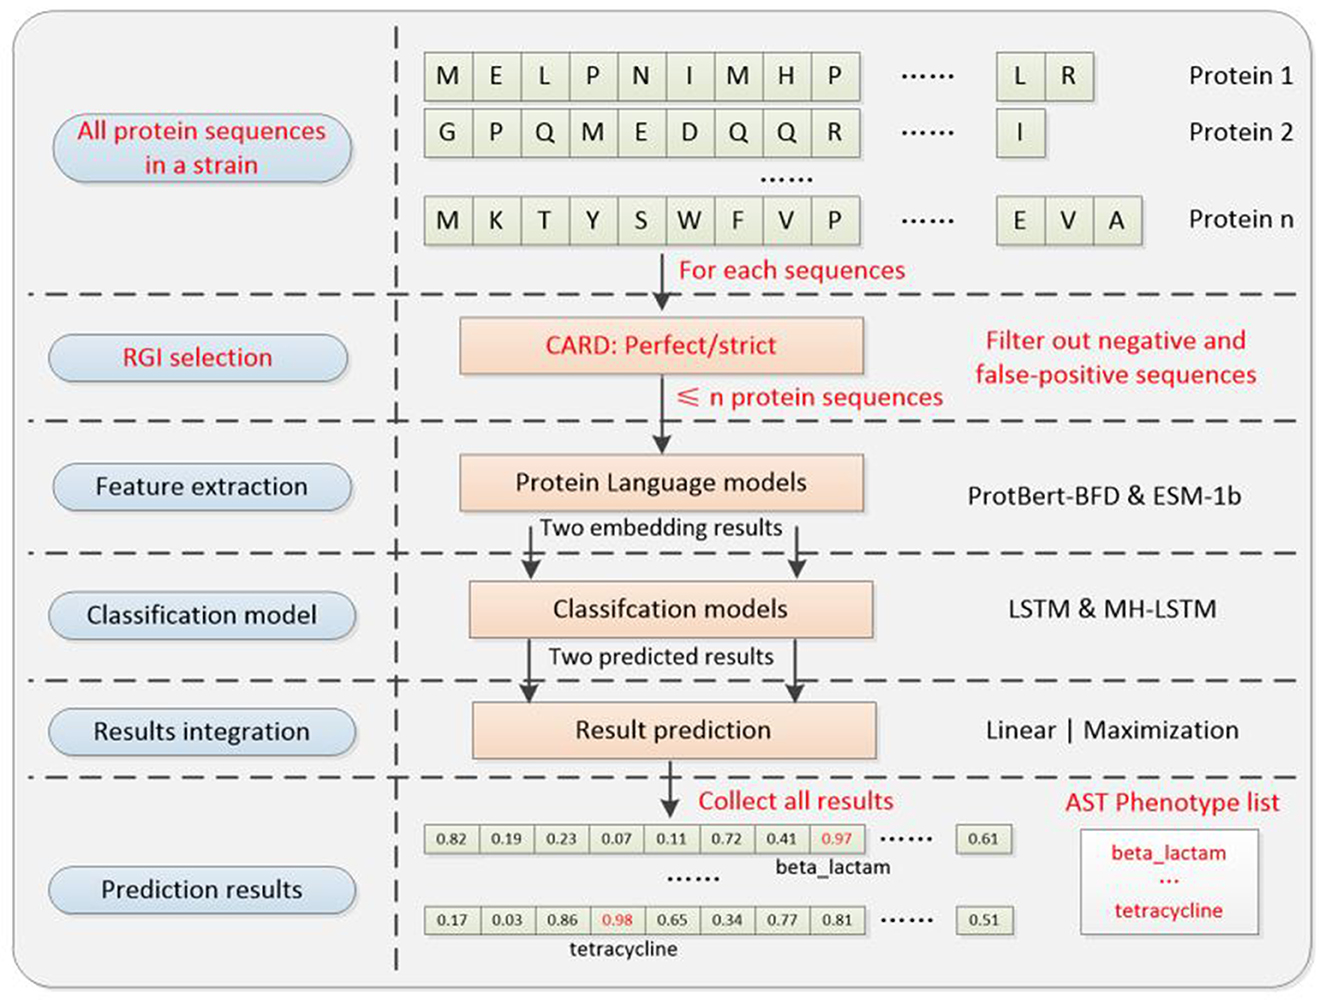
Figure 6. Transfer application system architecture diagram. The well-trained parameter in the classification and results integration models will be directly utilized for transfer application. Compared with the ARGs classification model, it additionally includes an RGI selection step, which could pre-filter most noise genes (negative and false-positive), to improve the overall prediction accuracy of the system. The AST phenotype prediction results are the collection of each protein sequence's ARG prediction result.
3 Results
3.1 LSTM and MH-LSTM performance testing
Based on the original data from DeepARG-DB, we test the LSTM and MH-LSTM performance on the ProtBert-BFD (Figure 7a) and ESM-1b (Figure 7b) embedding results respectively. For the ProtBert-BFD, LSTM with 3 layers network structure achieved the best performance with a clear advantage compared with other layers and MH-LSTM structures. This is likely because the low-dimensional data (30-dimensional ProtBert-BFD encoding per amino acid) is more suitable for small-scale, shallow networks, while the multi-head attention mechanism in MH-LSTM may lose some critical information. The embedding results of ESM-1b, which encodes each amino acid into 1,280 dimensions, is significantly higher than ProtBert-BFD's results. In this case, MH-LSTM with 6 layers network structure achieved the best performance. This improvement is due to the increased overall data dimensionality, which favors deep MH-LSTM networks for effective key data abstraction and extraction, while reducing interference from noisy information. In conclusion, proteins encoded by ProtBert-BFD are more suitable for LSTM structures with fewer layers (D3), while proteins encoded by ESM-1b is better suited for MH-LSTM structures with relatively more layers (D4~D6). However, an excessive number of LSTM layers (D7 as an example) increases the model's parameter count, leading to overfitting, which in turn causes a significant decline in test performance.
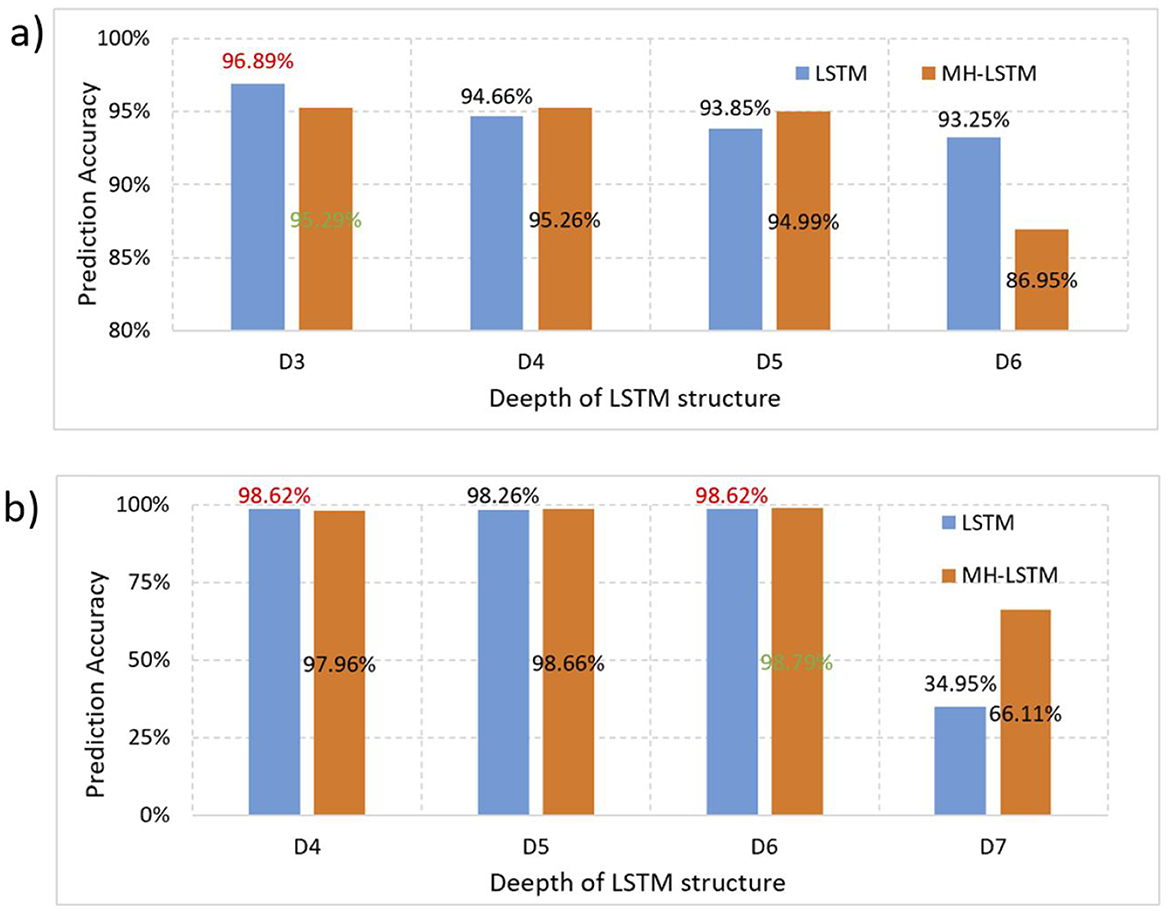
Figure 7. Performance test results separately based on the ProtBert-BFD and ESM-1b encoding results. (a) ProtBert-BFD: LSTM and MH-LSTM with depths ranging from 3 to 6 layers (D3-D6) were constructed to test their prediction accuracy. Both LSTM and MH-LSTM achieve the highest performance with 3 layers network structure and the LSTM yielded a higher accuracy compared to the MH-LSTM. (b) ESM-1b: Since ESM-1b results in a higher embedding dimensions, LSTM and MH-LSTM with deeper network ranging from 4 to 7 layer (D4–D7) were tested. The results show that multi-layer MH-LSTM networks perform better than LSTM and deeper network (D6) achieved higher performance in this case.
3.2 Experimental test for ARGs prediction
Based on the overall dataset (Table 1), we evaluated the prediction performance of different architectures under the optimal structures (Table 2). The optimal structure is determined through repeated experimental iteration with different structural combinations, which also follows the conclusion above. The evaluation was carried out using four metrics: accuracy, precision, recall, and F1-score. We compared our proposed methods with related works, including traditional sequence alignment methods like CARD and machine learning methods such as HMD-ARG and DeepARG. By applying these methods to ARGs identification (Figure 8a) and ARGs classification (Figure 8b) tasks, our proposed model consistently achieved superior performance almost across all evaluation metrics. The only exception is the CARD method under “perfect” criteria, the higher precision of which is due to its more lenient criteria for identifying resistant genes. This kind of criteria will result in a lower false-positive rate but a higher false-negative rate (Arango-Argoty et al., 2018), and consequently, performs the worst under the other three evaluation metrics. Besides, the framework including the data augmentation process usually provides better results compared with the framework without data augmentation technique.
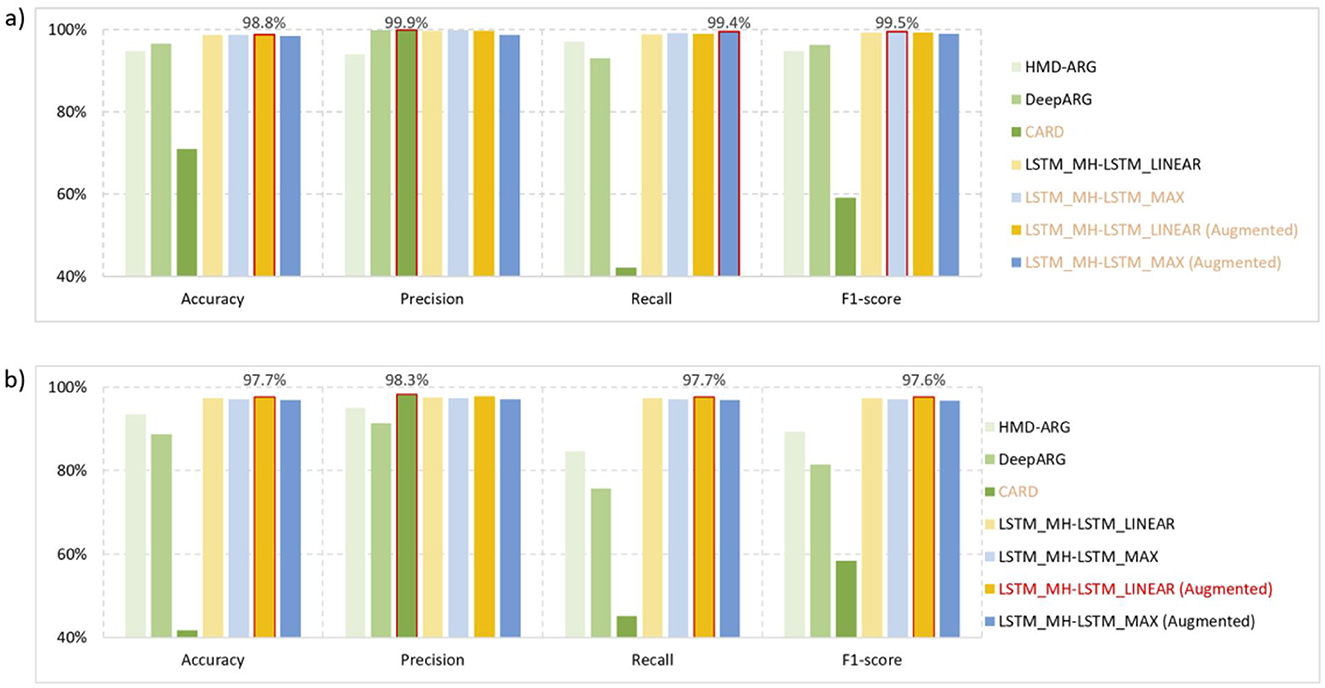
Figure 8. Performance test results. (a) ARGs identification: the task of ARGs identification is to distinguish resistant and non-resistant genes from all target genes. Comparatively, our proposed methods (with or without data augmentation) can always deliver satisfactory performance under four evaluation metrics. While CARD achieve slightly higher precision, it performs worst in the other three evaluation metrics. (b) ARGs classification: the task of ARGs classification is to classify the 16 different drug resistance gene strategies. The LSTM_MH-LSTM_LINEAR system architecture, based on augmented data, achieved the best results in terms of accuracy, recall, and F1-score. Regarding the precision metric, it is only slightly lower than the CARD method.
3.3 AMR prediction results
We manually screened 262 bacterial strains from NCBI which include both complete antibiotic susceptibility test (AST) results and whole-genome sequences. The strains involve S.enterica, E.coli, K.pneumoniae, C.freundii, S.marcescens, and etc. Each strain was annotated based on their AST results and our proposed 16 resistance labels (Table 1). For ease of replication studies, details of each stain can be found on GitHub: https://github.com/wr-sky/ARGs/blob/main/Data/AST_NCBI_id.txt.
In our application pipeline, we tested both “perfect” and “strict” screening standards (CARD RGI) as pre-screening tools for each protein sequence. Basically, the “strict” standard is relatively more lenient than the “perfect” standard, allowing us to optimally preserve high-fidelity resistance genes.
To comprehensively demonstrate predictive performance, we separately quantified model outputs encoded by ESM-1b (right panel of Figure 5 with MH-LSTM) and ProtBert-BFD (left panel of Figure 5 with LSTM). From the perspective of screening criteria, the test results show that datasets filtered by the RGI strict criteria achieve higher prediction accuracy (Equation 5) both for the ESM-1b and ProtBert-BFD embedding results (Figure 9). Compared to the “perfect” standard, the “strict” criteria effectively eliminate both negative and false-positive genes, reducing false-positive (FP) prediction probability and consequently enhancing overall prediction accuracy. From the perspective of embedding models, the ESM-1b model demonstrated superior prediction accuracy for label 2 (other), 4 (quinolone), and 12 (sulfonamide), whereas ProtBert-BFD achieved higher precision for label 3 (tetracycline) and 5 (aminoglycoside). Notably, both models attained 100% accuracy in predicting label 7 (β-lactam) and 11 (rifampin). When combining these two models' results, the prediction accuracy can theoretically exceed 90%, with peak performance reaching 100% for specific antibiotic classes. Overall, our model demonstrates exceptional performance in predicting specific resistance phenotypes (e.g., labels 5 (aminoglycoside), 7 (β-lactam), and 11 (rifampin)). However, prediction accuracy remains suboptimal for smaller datasets, particularly glycopeptide (label 9), chloramphenicol (label 10), and polymyxin (label 14) resistance categories, indicating areas for future improvement.
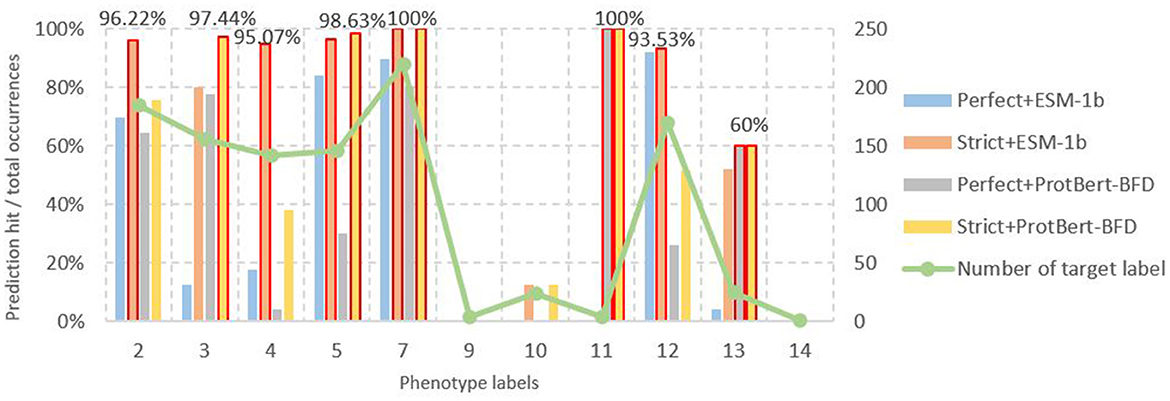
Figure 9. Number of different phenotype labels and their corresponding prediction accuracy results. In the results of ESM-1b based on MH-LSTM architecture, labels 2 (other), 4 (Quinolone), 5 (Aminoglycoside), 7 (Beta-lactam), and 12 (Sulfonamide) all achieve prediction accuracies above 95%, with label 7 reaching 100% precision. For the ProtBert-BFD based on MH-LSTM architecture, labels 3 (Tetracycline), 5 (Aminoglycoside), 7 (Beta-lactam), and 11 (Rifampin) achieve prediction accuracies above 95%, with labels 7 and 11 both reaching 100% precision. Annotations for the remaining groups, which are separately 0, 1, 6, 8, and 15, were missing among the 262 strains from NCBI.
4 Discussion
Conventional AST, as the gold standard for detection, yields results that are susceptible to testing procedural variations and requires specific operational expertise and laboratory conditions. Moreover, it can only test one resistance phenotype at a time, requiring several days to complete (Govender et al., 2021). At the genetic level, techniques such as DNA microarrays, polymerase chain reaction (PCR), and quantitative PCR (qPCR) were previously employed to detect antibiotic resistance genes (ARGs) (Singh and Sodhi, 2024). The scarcity of primers is a major drawback of amplification-based techniques (Ovchinnikov et al., 2017).
In comparison, whole-genome/metagenome-based computational approaches are unaffected by issues of operational experience, laboratory environment, or primer scarcity, and can simultaneously detect multiple resistance phenotypes within minutes. Early computational methods primarily relied on sequence alignment and gene annotation (Zhou et al., 2020), exemplified by tools such as MG-RAST, AMR-Finder, and PATRIC. However, the lack of allelic variant specificity significantly impacts results because different variations confer distinct phenotypic resistance profiles (Liang et al., 2023). Furthermore, the difficulty in standardizing alignment parameters (e.g., similarity thresholds, coverage criteria) across different resistance genes frequently leads to elevated rates of both false-negative and false-positive predictions (Arango-Argoty et al., 2018). Artificial intelligence-based prediction of resistance genes and phenotypes addresses these limitations by learning intrinsic feature correlations from existing large-scale genomic sequences and resistance data, thereby effectively reducing both false-negative and false-positive prediction rates (Singh and Sodhi, 2024).
Building upon prior work utilizing nucleotide-level sequences, our study proposes a novel approach employing protein sequences and recently pre-trained protein language models for antimicrobial resistance (AMR) prediction. Compared to nucleotide-based methods, amino acid sequences offer three key advantages: (i) Enhanced functional specificity through direct capture of critical protein features (e.g., drug binding sites and efflux pump active-site variants) and precise identification of resistance-associated domains via conserved motif analysis (Tondnevis et al., 2020); (ii) Improved cross-species generalizability by eliminating host GC content bias (Zhang et al., 2025); and (iii) Superior computational efficiency, as the 20-letter amino acid alphabet reduces dimensionality vs. the 64 possible codon combinations, and at the same time, enabling effective transfer learning from protein language models. Our comparative results (Figure 8) demonstrate significant accuracy improvements in resistance gene prediction, while simultaneously providing novel insights into the essential characteristics of genetic material and proteins from a biolinguistics perspective.
However, the transition from gene to protein sequences for antibiotic resistance prediction may introduce prediction errors due to the loss of critical genomic information: (i) Synonymous mutations: while preserving amino acid sequences, these mutations can alter mRNA secondary structures (e.g., ribosome binding site stability) or introduce rare codons affecting translation rates, thereby modulating resistance gene expression levels (Wong et al., 2022); (ii) Non-coding functional elements: key regulatory features in promoters or untranslated regions (UTRs) that control gene expression are absent in protein sequences (Zrimec et al., 2021); (iii) Mobile genetic elements: resistance-associated markers from insertion sequences (IS) or transposase genes are not captured (Partridge et al., 2018). Although the loss of these critical genomic features has relatively minor impacts on resistance gene prediction, it substantially compromises the accuracy of bacterial phenotype prediction, which likely accounts for the observed discrepancies in our phenotypic resistance predictions (Figure 9).
Focusing on the machine learning model, its quality relies heavily on the feature extraction phase, which converts diverse data forms such as images, text, data, and sequences into machine-readable encoding while retaining the original data features and minimizing irrelevant noise (Yan et al., 2020). This study employs pre-trained protein language models ProtBert-BFD and ESM-1b, which not only address the issue of insufficient data for training feature extraction models from scratch but also leverage these pre-trained models to extract amino acid interactions and protein structural features from different perspectives, providing accurate, noise-reduced encoding for subsequent classification processes (Elnaggar et al., 2021; Rives et al., 2021). Compared to using a single data source and model, this approach captures more effective information, reduces data redundancy, and ultimately enhances predictive performance (Figure 7).
The classification model is the core architecture of the system. It is crucial to design an appropriate architecture and depth so that the model's parameter scale aligns with the training data size, allowing for precise extraction of useful information while avoiding noise (Garg et al., 2021). Through experiments with small-scale data, we found that a relatively simple three-layer LSTM architecture is better suited for lower-dimensional data (ProtBert-BFD encoding), whereas a more complex six-layer MH-LSTM architecture is better for higher-dimensional data (ESM-1b encoding). The primary reason might be that lower-dimensional data distributions are not complex, so deeper networks or additional MH structures may abstract features too much, leading to the loss of critical information and decreased model generalization performance (Atienza, 2022; Deng et al., 2022). On the other hand, deeper MH-LSTM architectures can alleviate the issue of parameter explosion with high-dimensional data and make the model focus more on the effective information in the hidden layers, reducing noise influence (Vaswani et al., 2017).
The experimental results demonstrate that our model significantly outperforms sequence alignment and conventional AI algorithms in reducing both false-negative and false-positive predictions of ARGs (Figure 8). Concurrently, it achieves notable reductions in false-positive rates for resistance phenotype predictions while improving accuracy for specific phenotypes (Figure 9). High-accuracy ARG prediction enables AI to (i) Detect novel/rare ARG variants (Sodhi and Singh, 2022); (ii) Elucidate evolutionary pathways, e.g., horizontal gene transfer, mutation accumulation (Singh and Sodhi, 2024); (iii) Identify previously undetected ARGs beyond conventional methods' detection limits (Sodhi et al., 2023). For instance, AI-based model could predict distant ARG variants (< 30% homology to known genes) revealing novel resistance protein families and “silent” chromosomal resistance clusters (e.g., stress-inducible antibiotic-inactivating enzymes) (Singh et al., 2024).
Current AI-driven phenotype prediction holds transformative potential by potentially obviating laboratory culturing in infection diagnostics. However, pending resolution of implementation challenges, research focus remains on its theoretical promise rather than demonstrated clinical workflow impacts (d'Humières et al., 2021). Our model's high-precision phenotype prediction and low false-positive rates can guide targeted antibiotic use, reducing unnecessary broad-spectrum antibiotic reliance. In urinary tract infections (UTIs)—where rising antimicrobial resistance forces increasing broad-spectrum use—AI-based model could optimize empirical prescribing through rapid susceptibility profiling (Kanjilal et al., 2020). This enables tailored antibiotic selection for uncomplicated UTIs within 2 h vs. 48–72 h for conventional AST.
Overall, with the continuous expansion of subsequent datasets and ongoing optimization of algorithmic models, AI models are expected to progressively enhance their practical guidance significance for clinical treatment.
Data availability statement
All data associated with this study have been deposited in a publicly available repository to help other researchers evaluate our findings and build on our work. The codes and data used in this study are available on GitHub https://github.com/wr-sky/ARGs.
Author contributions
BW: Formal analysis, Investigation, Methodology, Project administration, Supervision, Writing – original draft, Writing – review & editing. RM: Conceptualization, Data curation, Methodology, Software, Writing – review & editing. ZL: Conceptualization, Formal analysis, Project administration, Visualization, Writing – review & editing. MH: Data curation, Resources, Writing – review & editing. XW: Investigation, Resources, Writing – review & editing. YZ: Data curation, Formal analysis, Writing – review & editing. ZC: Methodology, Writing – review & editing. YJ: Resources, Writing – review & editing. JY: Funding acquisition, Project administration, Writing – review & editing. WC: Conceptualization, Funding acquisition, Supervision, Writing – review & editing. HR: Conceptualization, Funding acquisition, Project administration, Supervision, Writing – review & editing.
Funding
The author(s) declare that financial support was received for the research and/or publication of this article. This study was supported by the National Natural Science Foundation of China (grant numbers 32070025, 31800136, and 62102439) and the Research Project of the State Key Laboratory of Pathogen and Biosecurity (grant numbers SKLPBS1807 and SKLPBS2214).
Conflict of interest
The authors declare that the research was conducted in the absence of any commercial or financial relationships that could be construed as a potential conflict of interest.
Generative AI statement
The author(s) declare that no Gen AI was used in the creation of this manuscript.
Any alternative text (alt text) provided alongside figures in this article has been generated by Frontiers with the support of artificial intelligence and reasonable efforts have been made to ensure accuracy, including review by the authors wherever possible. If you identify any issues, please contact us.
Publisher's note
All claims expressed in this article are solely those of the authors and do not necessarily represent those of their affiliated organizations, or those of the publisher, the editors and the reviewers. Any product that may be evaluated in this article, or claim that may be made by its manufacturer, is not guaranteed or endorsed by the publisher.
Supplementary material
The Supplementary Material for this article can be found online at: https://www.frontiersin.org/articles/10.3389/fmicb.2025.1628952/full#supplementary-material
References
Alcock, B. P., Huynh, W., Chalil, R., Smith, K. W., Raphenya, A. R., Wlodarski, M. A., et al. (2023). CARD 2023: expanded curation, support for machine learning, and resistome prediction at the comprehensive antibiotic resistance database. Nucleic Acids Res. 51, D690–D699. doi: 10.1093/nar/gkac920
Al-Deen, H. S. S., Zeng, Z., Al-Sabri, R., and Hekmat, A. (2021). An improved model for analyzing textual sentiment based on a deep neural network using multi-head attention mechanism. Appl. Syst. Innovation 4:85. doi: 10.3390/asi4040085
Alley, E. C., Khimulya, G., Biswas, S., AlQuraishi, M., and Church, G. M. (2019). Unified rational protein engineering with sequence-based deep representation learning. Nat. Methods 16, 1315–1322. doi: 10.1038/s41592-019-0598-1
Arango-Argoty, G., Garner, E., Pruden, A., Heath, L. S., Vikesland, P., and Zhang, L. (2018). DeepARG: a deep learning approach for predicting antibiotic resistance genes from metagenomic data. Microbiome 6, 1–15. doi: 10.1186/s40168-018-0401-z
Atienza, R. (2022). “Improving model generalization by agreement of learned representations from data augmentation,” in Proceedings of the IEEE/CVF Winter Conference on Applications of Computer Vision (Waikoloa, HI: IEEE), 3927–3936. doi: 10.1109/WACV51458.2022.00398
Boolchandani, M., D'Souza, A. W., and Dantas, G. (2019). Sequencing-based methods and resources to study antimicrobial resistance. Nat. Rev. Genet. 20, 356–370. doi: 10.1038/s41576-019-0108-4
Chen, J., Yang, D., Tam, D., Raffel, C., and Bansal, M. (2023). An empirical survey of data augmentation for limited data learning in nlp. Trans. Assoc. Comput. Ling. 11, 191–211. doi: 10.1162/tacl_a_00542
Darby, E. M., Trampari, E., Siasat, P., Gaya, M. S., Alav, I., Webber, M. A., et al. (2023). Molecular mechanisms of antibiotic resistance revisited. Nat. Rev. Microbiol. 21, 280–295. doi: 10.1038/s41579-022-00820-y
Deng, W., Gould, S., and Zheng, L. (2022). On the strong correlation between model invariance and generalization. Adv. Neural Inf. Process. Syst. 35, 28052–28067.
d'Humières, C., Salmona, M., Dellière, S., Leo, S., Rodriguez, C., Angebault, C., et al. (2021). The potential role of clinical metagenomics in infectious diseases: therapeutic perspectives. Drugs 81, 1453–1466. doi: 10.1007/s40265-021-01572-4
Elnaggar, A., Heinzinger, M., Dallago, C., Rehawi, G., Wang, Y., Jones, L., et al. (2021). Prottrans: toward understanding the language of life through self-supervised learning. IEEE Trans. Pattern Anal. Machine Intell. 44, 7112–7127. doi: 10.1109/TPAMI.2021.3095381
Fitzgibbon, M. M., Roycroft, E., Sheehan, G., Mc Laughlin, A. M., Quintyne, K. I., Brabazon, E., et al. (2021). False detection of rifampicin resistance using Xpert® MTB/RIF Ultra assay due to an A451V mutation in Mycobacterium tuberculosis. JAC-Antimicrob. Resist. 3:dlab101. doi: 10.1093/jacamr/dlab101
Garg, S., Ramakrishnan, G., and Thumbe, V. (2021). “Towards robustness to label noise in text classification via noise modeling,” in Proceedings of the 30th ACM International Conference on Information and Knowledge Management (New York, NY, USA: Association for Computing Machinery). doi: 10.1145/3459637.3482204
Govender, R. D., Hashim, M. J., Khan, M. A., Mustafa, H., and Khan, G. (2021). Global epidemiology of HIV/AIDS: a resurgence in North America and Europe. J. Epidemiol. Global Health 11, 296–301. doi: 10.2991/jegh.k.210621.001
Hasan, B. M. S., and Abdulazeez, A. M. (2021). A review of principal component analysis algorithm for dimensionality reduction. J. Soft Comput. Data Mining 2, 20–30. doi: 10.30880/JSCDM.2021.02.01.003
Hsu, C., Verkuil, R., Liu, J., Lin, Z., Hie, B., Sercu, T., et al. (2022). “Learning inverse folding from millions of predicted structures,” in Proceedings of the 39th International Conference on Machine Learning, Vol. 162 (PMLR), 8946–8970. doi: 10.1101/2022.04.10.487779
Ji, B., Pi, W., Liu, W., Liu, Y., Cui, Y., Zhang, X., et al. (2023). HyperVR: a hybrid deep ensemble learning approach for simultaneously predicting virulence factors and antibiotic resistance genes. NAR Genom. Bioinf. 5:lqad012. doi: 10.1093/nargab/lqad012
Kakoullis, L., Papachristodoulou, E., Chra, P., and Panos, G. (2021). Mechanisms of antibiotic resistance in important gram-positive and gram-negative pathogens and novel antibiotic solutions. Antibiotics 10:415. doi: 10.3390/antibiotics10040415
Kanjilal, S., Oberst, M., Boominathan, S., Zhou, H., Hooper, D. C., and Sontag, D. (2020). A decision algorithm to promote outpatient antimicrobial stewardship for uncomplicated urinary tract infection. Sci. Trans. Med. 12:eaay5067. doi: 10.1126/scitranslmed.aay5067
Karkman, A., Do, T. T., Walsh, F., and Virta, M. P. J. (2018). Antibiotic-resistance genes in waste water. Trends Microbiol. 26, 220–228. doi: 10.1016/j.tim.2017.09.005
Kim, J. I., Maguire, F., Tsang, K. K., Gouliouris, T., Peacock, S. J., McAllister, T. A., et al. (2022). Machine learning for antimicrobial resistance prediction: current practice, limitations, and clinical perspective. Clin. Microbiol. Rev. 35, e00179–21. doi: 10.1128/cmr.00179-21
Lakin, S. M., Dean, C., Noyes, N. R., Dettenwanger, A., Ross, A. S., Doster, E., et al. (2017). MEGARes: an antimicrobial resistance database for high throughput sequencing. Nucleic Acids Res. 45, D574–D580. doi: 10.1093/nar/gkw1009
Lázár, V., and Kishony, R. (2019). Transient antibiotic resistance calls for attention. Nat. Microbiol. 4, 1606–1607. doi: 10.1038/s41564-019-0571-x
Li, H., and Durbin, R. (2009). Fast and accurate short read alignment with Burrows-Wheeler transform. Bioinformatics 25, 1754–1760. doi: 10.1093/bioinformatics/btp324
Li, Y., Wang, S., Umarov, R., Xie, B., Fan, M., Li, L., et al. (2018). DEEPre: sequence-based enzyme EC number prediction by deep learning. Bioinformatics 34, 760–769. doi: 10.1093/bioinformatics/btx680
Li, Y., Xu, Z., Han, W., Cao, H., Umarov, R., Yan, A., et al. (2021). HMD-ARG: hierarchical multi-task deep learning for annotating antibiotic resistance genes. Microbiome 9, 1–12. doi: 10.1186/s40168-021-01002-3
Liang, J., Lin, H., Singh, B., Wang, A., and Yan, Z. (2023). A global perspective on compositions, risks, and ecological genesis of antibiotic resistance genes in biofilters of drinking water treatment plants. Water Res. 233:119822. doi: 10.1016/j.watres.2023.119822
Lin, Z., Akin, H., Rao, R., Hie, B., Zhu, Z., Lu, W., et al. (2023). Evolutionary-scale prediction of atomic-level protein structure with a language model. Science 379, 1123–1130. doi: 10.1126/science.ade2574
Mathys, V., van de Vyvere, M., de Droogh, E., Soetaert, K., and Groenen, G. (2014). False-positive rifampicin resistance on Xpert® MTB/RIF caused by a silent mutation in the rpoB gene. Int. J. Tuberculosis Lung Dis. 18, 1255–1257. doi: 10.5588/ijtld.14.0297
Meier, J., Verkuil, R., Liu, J., Sercu, T., Rives, A., and Rao, R. (2021). Language models enable zero-shot prediction of the effects of mutations on protein function. Adv. Neural Inf. Process. Syst. 34, 29287–29303. doi: 10.1101/2021.07.09.450648
Ovchinnikov, S., Park, H., Varghese, N., Huang, P. S., Pavlopoulos, G. A., Kim, D. E., et al. (2017). Protein structure determination using metagenome sequence data. Science 355, 294–298. doi: 10.1126/science.aah4043
Partridge, S. R., Kwong, S. M., Firth, N., and Jensen, S. O. (2018). Mobile genetic elements associated with antimicrobial resistance. Clin. Microbiol. Rev. 31, e00088–17. doi: 10.1128/CMR.00088-17
Rao, R., Meier, J., Sercu, T., Ovchinnikov, S., and Rives, A. (2020). Transformer protein language models are unsupervised structure learners. Biorxiv. doi: 10.1101/2020.12.15.422761
Riesselman, A. J., Ingraham, J. B., and Marks, D. S. (2018). Deep generative models of genetic variation capture the effects of mutations. Nat. Methods 15, 816–822. doi: 10.1038/s41592-018-0138-4
Rives, A., Meier, J., Sercu, T., Goyal, S., Lin, Z., Liu, J., et al. (2021). Biological structure and function emerge from scaling unsupervised learning to 250 million protein sequences. Proc. Natl. Acad. Sci. 118:e2016239118. doi: 10.1073/pnas.2016239118
Sakagianni, A., Koufopoulou, C., Feretzakis, G., Kalles, D., Verykios, V. S., Myrianthefs, P., et al. (2023). Using machine learning to predict antimicrobial resistance-a literature review. Antibiotics 12:452. doi: 10.3390/antibiotics12030452
Singh, C. K., and Sodhi, K. K. (2024). Targeting bioinformatics tools to study the dissemination and spread of antibiotic resistant genes in the environment and clinical settings. Crit. Rev. Microbiol. 51, 860–878. doi: 10.1080/1040841X.2024.2429603
Singh, C. K., Sodhi, K. K., and Singh, D. K. (2024). Understanding the bacterial community structure associated with the Eichhornia crassipes rootzone. Mol. Biol. Rep. 51:251. doi: 10.1007/s11033-024-09227-9
Sodhi, K. K., and Singh, C. K. (2022). Recent development in the sustainable remediation of antibiotics: a review. Total Environ. Res. Themes 3:100008. doi: 10.1016/j.totert.2022.100008
Sodhi, K. K., Singh, C. K., Kumar, M., and Singh, D. K. (2023). Whole-genome sequencing of Alcaligenes sp. strain MMA: insight into the antibiotic and heavy metal resistant genes. Front. Pharmacol. 14:1144561. doi: 10.3389/fphar.2023.1144561
Su, M., Satola, S. W., and Read, T. D. (2019). Genome-based prediction of bacterial antibiotic resistance. J. Clin. Microbiol. 57, e01405–18. doi: 10.1128/JCM.01405-18
Sunuwar, J., and Azad, R. K. (2021). A machine learning framework to predict antibiotic resistance traits and yet unknown genes underlying resistance to specific antibiotics in bacterial strains. Briefings Bioinf. 22:bbab179. doi: 10.1093/bib/bbab179
Tondnevis, F., Dudenhausen, E. E., Miller, A. M., McKenna, R., Altschul, S. F., Bloom, L. B., et al. (2020). Deep analysis of residue constraints (DARC): identifying determinants of protein functional specificity. Sci. Rep. 10:1691. doi: 10.1038/s41598-019-55118-6
Vaswani, A., Shazeer, N., Parmar, N., Uszkoreit, J., Jones, L., Gomez, A. N., et al. (2017). Attention is all you need. Adv. Neural Inf. Process. Syst. 30.
Wang, Q., Wang, P., and Yang, Q. (2018). Occurrence and diversity of antibiotic resistance in untreated hospital wastewater. Sci. Total Environ. 621, 990–999. doi: 10.1016/j.scitotenv.2017.10.128
Wong, J. L. C., David, S., Sanchez-Garrido, J., Woo, J. Z., Low, W. W., Morecchiato, F., et al. (2022). Recurrent emergence of Klebsiella pneumoniae carbapenem resistance mediated by an inhibitory ompK36 mRNA secondary structure. Proc. Natl. Acad. Sci. 119:e2203593119. doi: 10.1073/pnas.2203593119
Yan, J., Guo, X., Duan, S., Jia, P., Wang, L., Peng, C., et al. (2020). Feature extraction methods: a review. J. Phys. Conf. Ser. 1591:012028. doi: 10.1088/1742-6596/1591/1/012028
Ying, X. (2019). An overview of overfitting and its solutions. J. Phys. Conf. Ser. 1168:022022. doi: 10.1088/1742-6596/1168/2/022022
Yu, Y., Si, X., Hu, C., and Zhang, J. (2019). A review of recurrent neural networks: LSTM cells and network architectures. Neural Comput. 31, 1235–1270. doi: 10.1162/neco_a_01199
Zhang, P., Du, Q., Wang, Y., Wei, L., and Wang, X. (2025). Systematic representation and optimization enable the inverse design of cross-species regulatory sequences in bacteria. Nat. Commun. 16:1763. doi: 10.1038/s41467-025-57031-1
Zhou, K., Zhou, C., Sapre, A., Pavlock, J. H., Weaver, A., Muralidharan, R., et al. (2020). Dynamic laser speckle imaging meets machine learning to enable rapid antibacterial susceptibility testing (DyRAST). ACS Sens. 5, 3140–3149. doi: 10.1021/acssensors.0c01238
Keywords: ARGs, phenotypes, protein language models, deep learning, LSTM
Citation: Wang B, Meng R, Li Z, Hu M, Wang X, Zhao Y, Chai Z, Jin Y, Yue J, Chen W and Ren H (2025) Predicting antibiotic resistance genes and bacterial phenotypes based on protein language models. Front. Microbiol. 16:1628952. doi: 10.3389/fmicb.2025.1628952
Received: 15 May 2025; Accepted: 11 August 2025;
Published: 08 September 2025.
Edited by:
Mohamed Samir, University of Greenwich, United KingdomReviewed by:
Kushneet Kaur Sodhi, University of Delhi, IndiaRachana Banerjee, JIS Institute of Advanced Studies and Research, India
Copyright © 2025 Wang, Meng, Li, Hu, Wang, Zhao, Chai, Jin, Yue, Chen and Ren. This is an open-access article distributed under the terms of the Creative Commons Attribution License (CC BY). The use, distribution or reproduction in other forums is permitted, provided the original author(s) and the copyright owner(s) are credited and that the original publication in this journal is cited, in accordance with accepted academic practice. No use, distribution or reproduction is permitted which does not comply with these terms.
*Correspondence: Wei Chen, Y2hlbndlaUBudWR0LmVkdS5jbg==; Hongguang Ren, YmlvcmVuQDE2My5jb20=
†These authors have contributed equally to this work