 Hazrat Bilal1
 Xiaohui Li1Xunsong Wang2
 Muhammad Nadeem Khan3
 Muhammad Shafiq4Jiamei Yu1Hanman Qiu1
 Qiao-Li Lv1*Bin Xu1*
- 1Jiangxi Key Laboratory of Oncology (2024SSY06041), JXHC Key Laboratory of Tumor Metastasis, NHC Key Laboratory of Personalized Diagnosis and Treatment of Nasopharyngeal Carcinoma, Jiangxi Cancer Hospital & Institute, The Second Affiliated Hospital of Nanchang Medical College, Nanchang, Jiangxi, China
- 2Department of Medical Laboratory, Jiangxi Cancer Hospital, The Second Affiliated Hospital of Nanchang Medical College, Jiangxi Cancer Institute, Nanchang, Jiangxi, China
- 3Department of Cell Biology and Genetics, Shantou University Medical College, Shantou, China
- 4Department of Pharmacology, Research Institute of Clinical Pharmacy, Shantou University Medical College, Shantou, China
Background: Candidiasis in cancer patients remains largely unexplored in China. This study examines risk factors and antifungal susceptibility patterns of Candida in cancer patients from Jiangxi, China.
Methods: Clinical and demographic data on Candida in cancer patients (2018–2024) were retrospectively collected at Jiangxi Cancer Hospital, Nanchang, China. Candida distribution across cancers and antifungal susceptibility patterns were analyzed. Risk factors were identified via logistic regression, and antifungal consumption was correlated with Candida distribution. Survival probabilities were compared between patients with C. albicans and those with non-albicans Candida (NAC) infections.
Results: Among 2,761 Candida isolates, 1,703 (61.68%) were C. albicans and 1,058 (38.31%) were NAC, with a year-wise trend showing a decline in C. albicans and a rise in NAC. C. albicans was significantly higher in lung (40.57%) and nasopharyngeal (11.33%) cancers, while NAC were more common in gastric (7.56%), colon (8.69%), and urogenital (14.65%) cancers. NAC risk factors included inappropriate empirical therapy (OR 13.8, P < 0.001), hypoproteinemia (OR 1.35), anemia (OR 1.28), urinary tract infection (OR 1.71), and indwelling catheters (OR 1.27) (all P < 0.05). Radiotherapy, targeted therapy, glucocorticoids, chest tube insertion, and parenteral nutrition were associated with C. albicans (P ≤ 0.01). Amphotericin B (>99%) and echinocandins (>96%) showed the highest efficacy. C. tropicalis displayed notable azole resistance (40.9–74.45%). Caspofungin use negatively correlated with C. albicans (r = −0.84, P = 0.02) and positively with C. tropicalis (r = 0.78, P = 0.04) and N. glabrata (r = 0.85, p = 0.02). NAC infections showed 1.5-fold higher mortality rate than C. albicans (95% CI: 1.1–2.0; P = 0.0075).
Conclusion: These findings may aid healthcare officials in improving Candida management in the region and similar settings.
Introduction
Cancer patients are highly vulnerable to fungal infections due to immunosuppression from underlying malignancies and treatments (Shelke et al., 2024). Candida species are the most commonly reported fungi in cancer patients. They can colonize various body sites, including mucosal membranes, the gastrointestinal tract, and the urogenital tract. This colonization is exacerbated in cancer patients due to immunosuppression, mucosal disruption, and the use of antimicrobials. Colonization, especially at multiple body sites, significantly increases the risk of invasive candidiasis, which may develop within approximately 7 days. Risk factors influencing this transformation include underlying comorbidities, use of indwelling devices, exposure to broad-spectrum antimicrobials, and surgical or invasive procedures (Alenazy et al., 2021; Lass-Flörl et al., 2024). Each year, around 2.5 million people are reported to develop invasive candidiasis, with a mortality rate ranging from 25 to 50% (Bilal et al., 2023).
Historically, Candida albicans has been predominantly isolated in cases of candidiasis worldwide. However, recent studies show a shift toward non-albicans Candida (NAC) species (Meneghello et al., 2024). This trend is largely attributed to the widespread use of antifungals such as fluconazole and caspofungin. This has led to selective pressure favoring NAC species, which are often less susceptible to azoles and echinocandins.(Lass-Flörl et al., 2024; Lee et al., 2023). The specific distribution of NAC species varies by region and patient population, likely influenced by the use of antifungals and healthcare practices (Bilal et al., 2023; Meneghello et al., 2024; Ngamchokwathana et al., 2021).
In China, antifungal susceptibility patterns vary across regions, and recent studies have noted a decline in susceptibility compared to developed countries (Bilal et al., 2022). Antifungal susceptibility testing often requires a long time. Therefore, guidelines such as those from the European Society of Clinical Microbiology and Infectious Diseases (ESCMID) and the Infectious Diseases Society of America (IDSA) recommend tailoring empirical antifungal therapy based on local species distribution, risk factors, prior antifungal use, and susceptibility data (Pappas et al., 2009; Pappas et al., 2015; Ullmann et al., 2012). In this study, we aimed to analyze the distribution of Candida species in various cancer types, along with their associated risk factors and antifungal susceptibility profiles. We also examined the correlation between the consumption of commonly used antifungal drugs and both species distribution and the proportion of non-susceptible isolates in Jiangxi, China, over the past 7 years.
Materials and methods
Study setting and design
The current retrospective study was conducted at Jiangxi Cancer Hospital, Nanchang, China. The study center is the only tertiary A-level hospital specializing in cancer diagnosis and treatment in Nanchang, the capital of Jiangxi Province, China. The center is a 2030-bed hospital that provides treatment facilities to over 45 million urban and rural populations. The study was approved by the Ethics and Review Committee of Jiangxi Cancer Hospital (letter number 2024ky078). The committee waived the patient’s consent form due to the study’s retrospective design and the fact that it did not disclose identity of the patients or use their personal information.
Data collection
This study includes all Candida species diagnosed in cancer patients at Jiangxi Cancer Hospital from January 2018 to December 2024. Cases were included if Candida species were isolated by the hospital’s clinical microbiology laboratory and if treating physicians had a clinical suspicion of fungal infection based on presenting symptoms and guiedlines established by China Medical Associations (Keighley et al., 2021). For multiple detections of the same species, only the first Candida isolate was included in the analysis. The clinical and demographical data related to patient age, gender, Body Mass Index (BMI), Karnofsky Performance Status (KPS), cancer type, cancer treatment, underlying comorbidities, invasive procedures, medical interventions, days stayed in the hospital, 30 days, and all-cause mortality was collected from the hospital’s electronic record. The data on the consumption of antifungal drugs such as fluconazole and caspofungin were collected from the hospital’s information department. Antifungal doses were converted to defined daily doses per 1,000 patients (DDD/1,000 patients) following DDD classification and assignment guidelines (accessed January 12, 2025).1 The data related to the antifungal susceptibilities of Candida species were collected in the form of MICs detected against each species for each tested drug. Two groups of researchers cross-checked all the data to minimize subjective bias.
Routine microbiology laboratory protocol
Clinical specimens from suspected infection sites were routinely cultured on Sabouraud dextrose agar and Chromogenic Candida medium (Zhengzhou Renfu Bosai Biotechnology Co., Ltd., China). The plates were incubated at 28°C for 24–72 h. A Smart MS 5020 microbial mass spectrometer (Zhuhai Deere Bioengineering Co., Ltd., China) was used for species-level identification, employing matrix-assisted laser desorption ionization time-of-flight mass spectrometry (MALDI-TOF MS). Antifungal susceptibility testing was performed using the YO1O fungal susceptibility panel (Thermo Fisher Scientific, United States). Minimum inhibitory concentrations (MICs) were recorded, and phenotypic resistance or susceptibility was interpreted using CLSI M60 and M57S guidelines (CLSI, 2022; CLSI, 2024). For itraconazole against C. albicans, EUCAST breakpoints were used (accessed January 12, 2025).2 Where no official breakpoints were available (e.g., 5-flucytosine against all Candida species and itraconazole against P. kudriavzevii), interpretation was based on published literature (Pfaller et al., 2012).
Data and statistical analysis
All data were cleaned and processed using Excel 2021. Candida isolates were categorized into C. albicans and non-albicans Candida (NAC) groups. Year-wise incidence and species proportions were analyzed. Chi-square tests were used to compare C. albicans and NAC across cancer types, and the distribution of Candida species within each cancer type was assessed. Univariate and multivariate logistic regression analyses were conducted to identify risk factors associated with NAC compared to C. albicans. Antifungal susceptibility data were analyzed based on MIC values, including MIC ranges, MIC50, MIC90, isolate counts, and the percentages of susceptible/wild-type, resistant/non-wild-type, and intermediate/susceptible dose-dependent isolates for each drug and species. Pearson correlation analysis was performed between the consumption of fluconazole and caspofungin (expressed as DDD/1,000 patient days) and the distribution and proportion of non-susceptible isolates. The survival probabilities of C. albicans and the NAC group were evaluated via Kaplan-Meier survival curves analysis. Furthermore, the Cox proportional hazards regression model was used to analyze the risk of death in C. albicans versus NAC. All statistical analysis and visualization were performed using GraphPad Prism (v. 9) and R (v. 4.4.1). A p-value smaller than 0.05 was considered statistically significant in all cases.
Results
Distribution of Candida species
During the study, a total of 2,761 cases of Candida species were reported, of which 1,703 (61.68%) were C. albicans, 454 (16.44%) were C. tropicalis, 394 (14.27%) were Nakaseomyces glabrata, 123 (4.45%) were C. parapsilosis, 68 (2.46%) were Pichia kudriavzevii, 13 (0.47%) were Clavispora lusitaniae, and 6 (0.21%) were Meyerozyma guilliermondii. The high incidence of Candida species was reported in 2019 (7.89/1,000 admissions), followed by 2020 (6.63/1,000 admissions) and 2021 (6.5/1,000 admissions), while the lowest incidence was observed in 2018 (3.9/1,000 admissions). Overall, C. albicans remained more common than NAC, but its proportion declined each year from 2018 to 2024, while NAC rates increased. The year-wise incidence and proportion of Candida species are presented in Figure 1. Regarding various cancer types, a high proportion of Candida species were reported from lung cancer patients (n = 992, 35.93%), followed by nasopharyngeal cancer (n = 278. 10.07%), urogenital (n = 249, 9.02%), and colon cancer (n = 204, 7.38%). A total of 182 (6.59%) cases of hematological cancers were reported, of which 148 were lymphoma, 18 were myeloma, and 16 were leukemia. The proportion of various Candida species in different cancer types is presented in Figure 2. Furthermore, the distribution of C. albicans versus NAC was analyzed across multiple cancer types (Figure 3). C. albicans was significantly more prevalent in lung and nasopharyngeal cancer. In contrast, for the brain and CNS, colon, gastric, and urogenital cancers, the proportions of NAC were significantly higher than those of C. albicans.
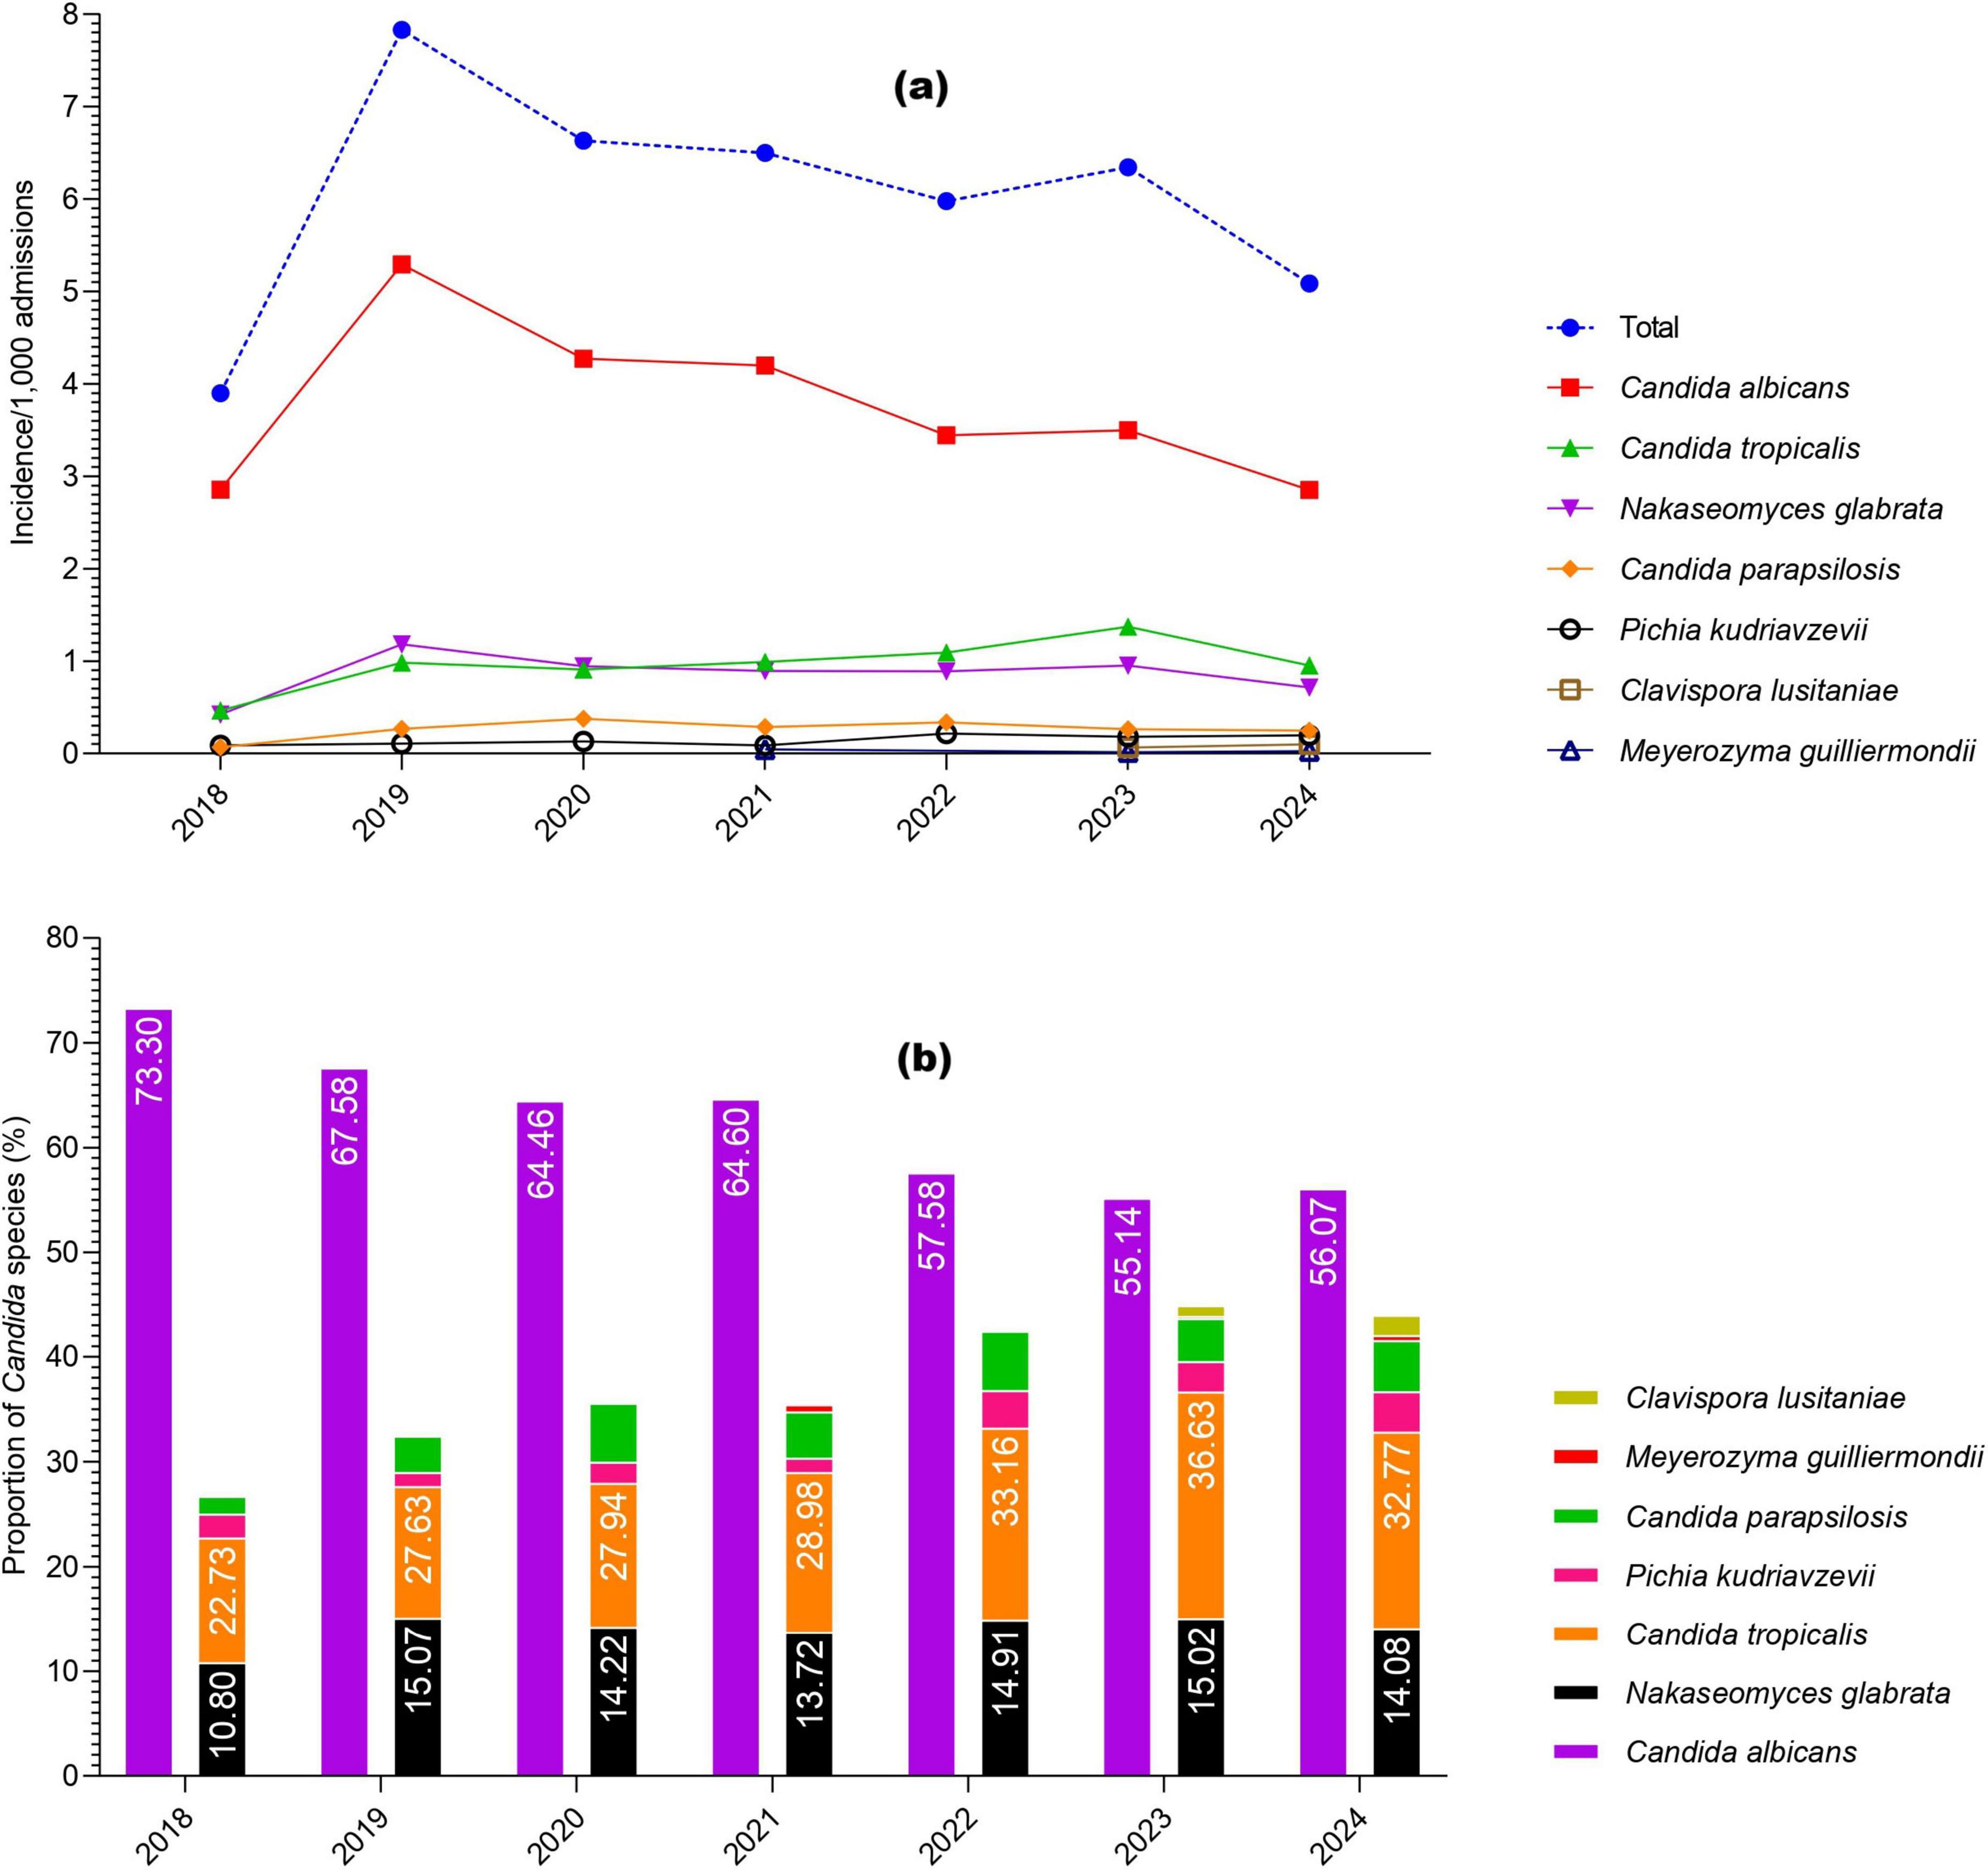
Figure 1. Year-wise occurrence of Candida species in the current study, (a) incidence per 1,000 admissions; (b) proportions of Candida species.
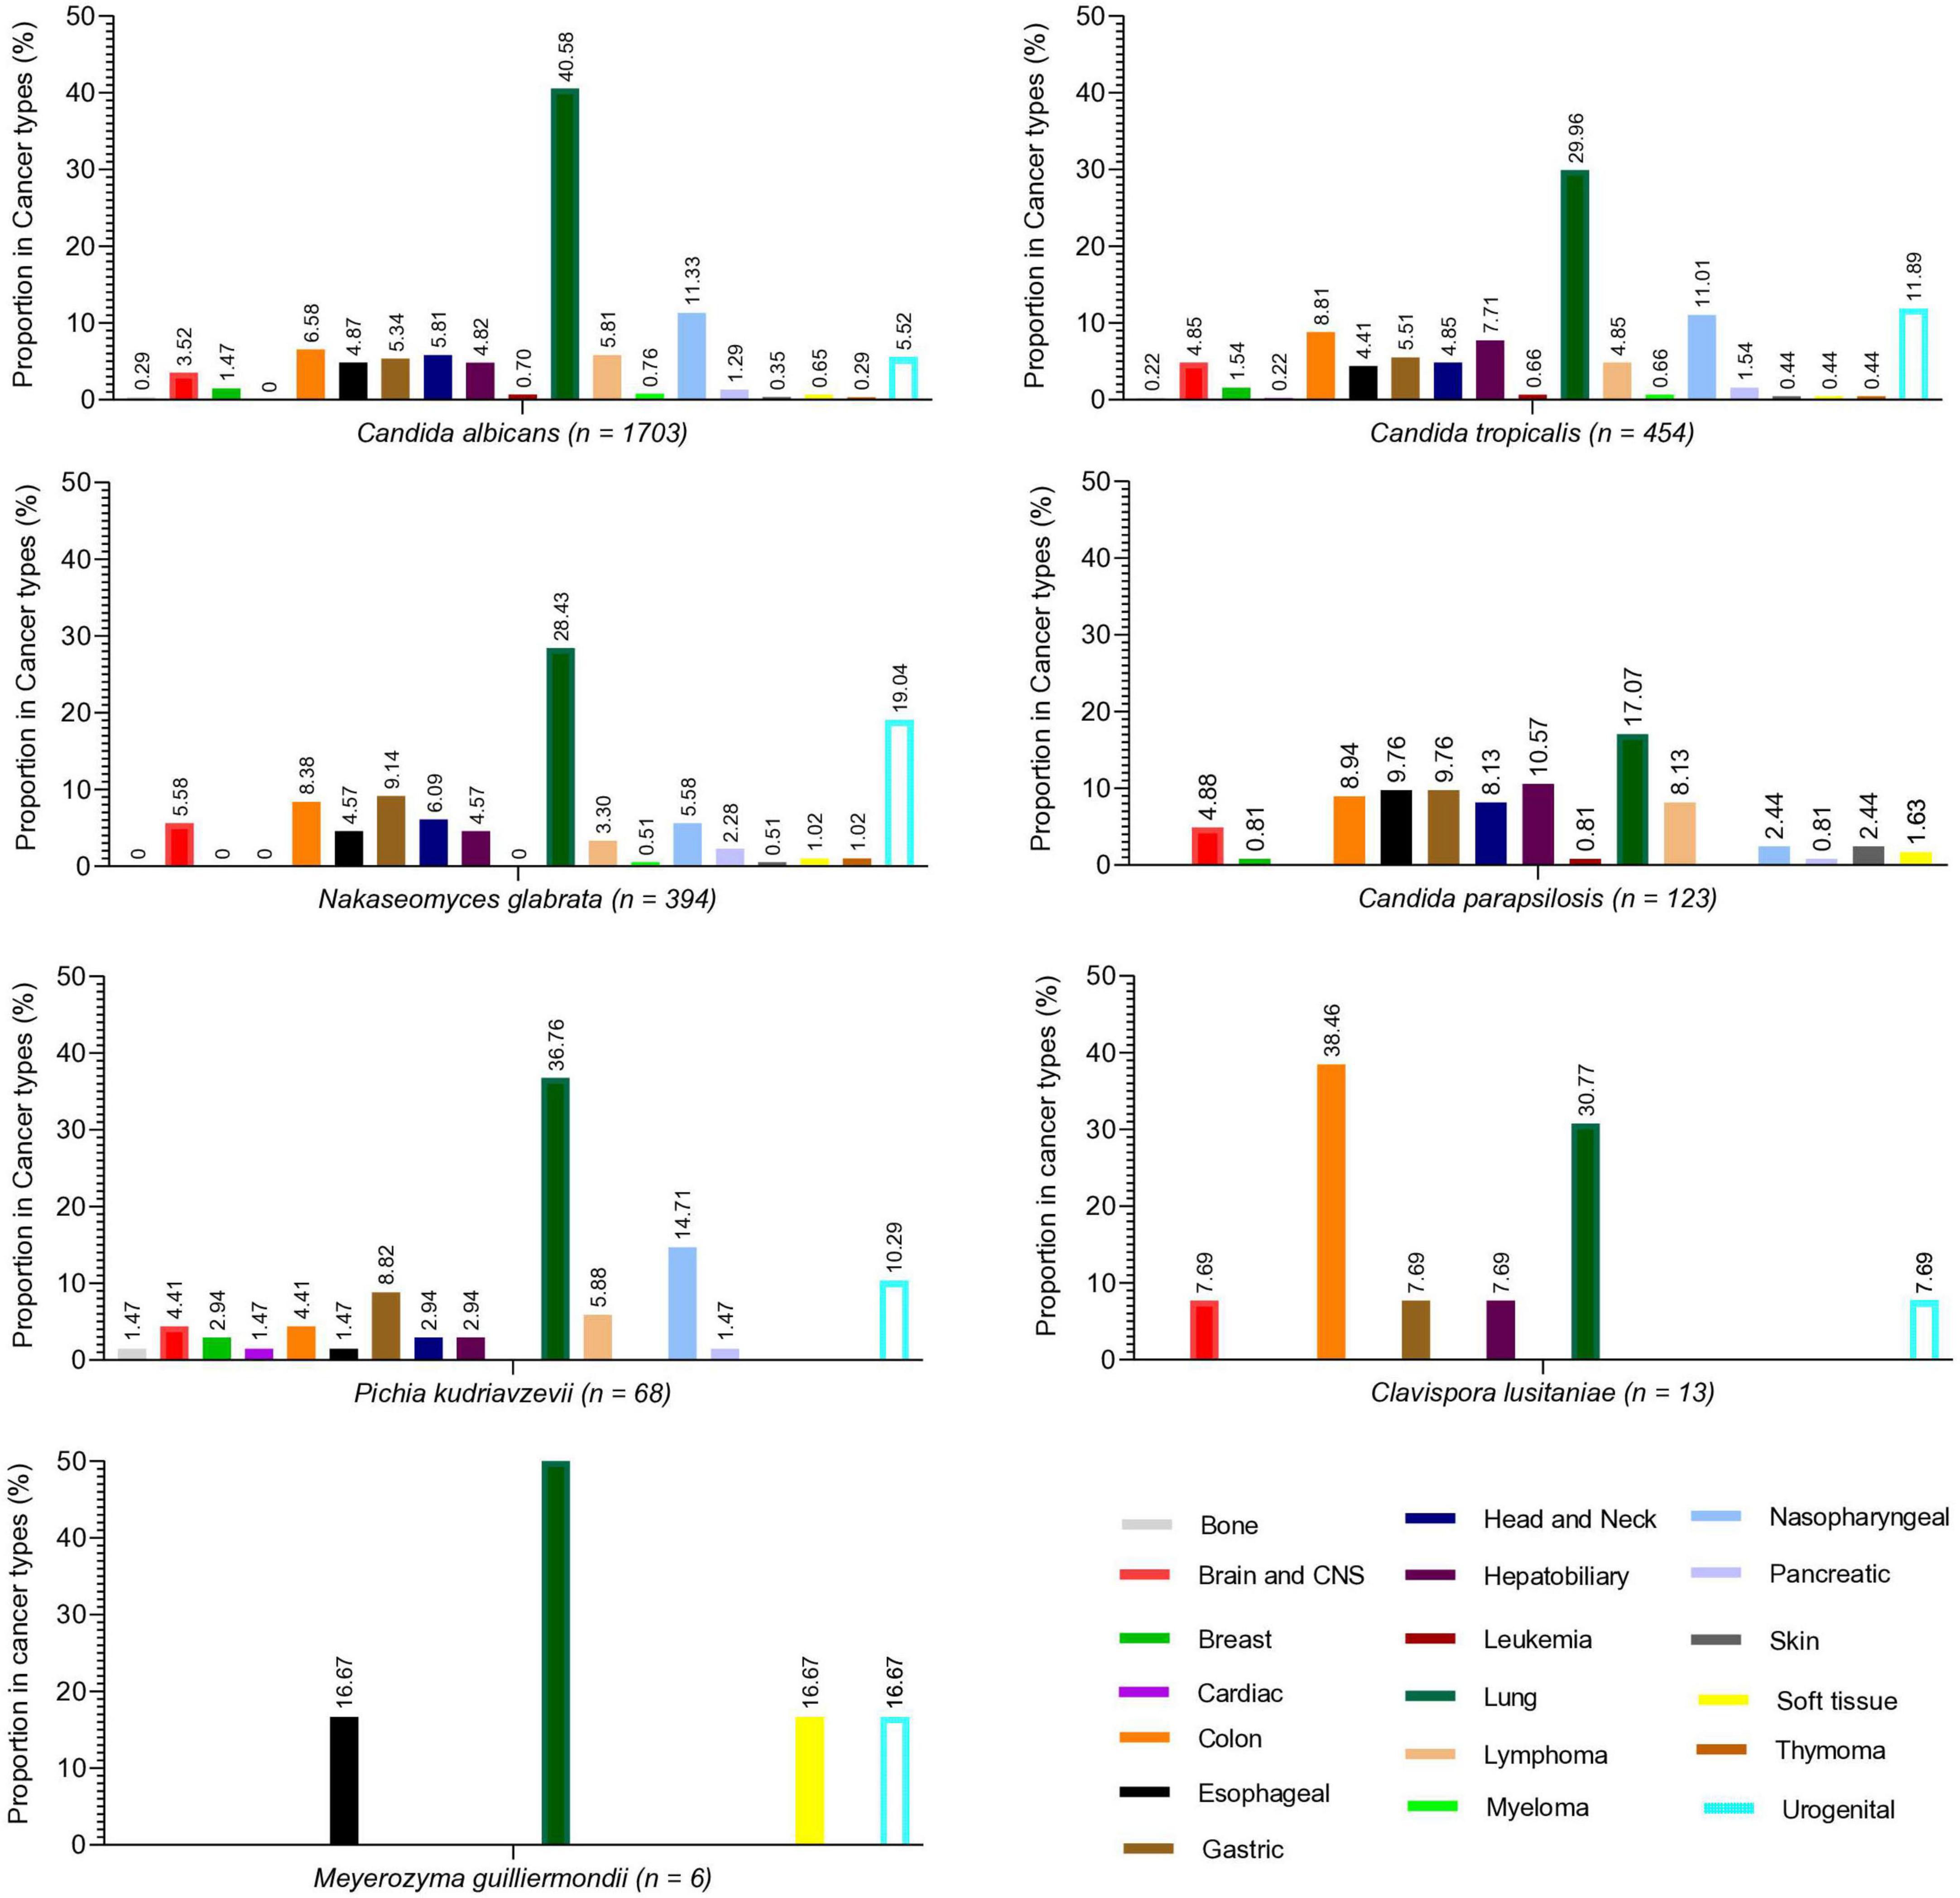
Figure 2. Proportion of different Candida species in various cancer types. Each species’ proportion in each cancer type is written at the top of each bar.
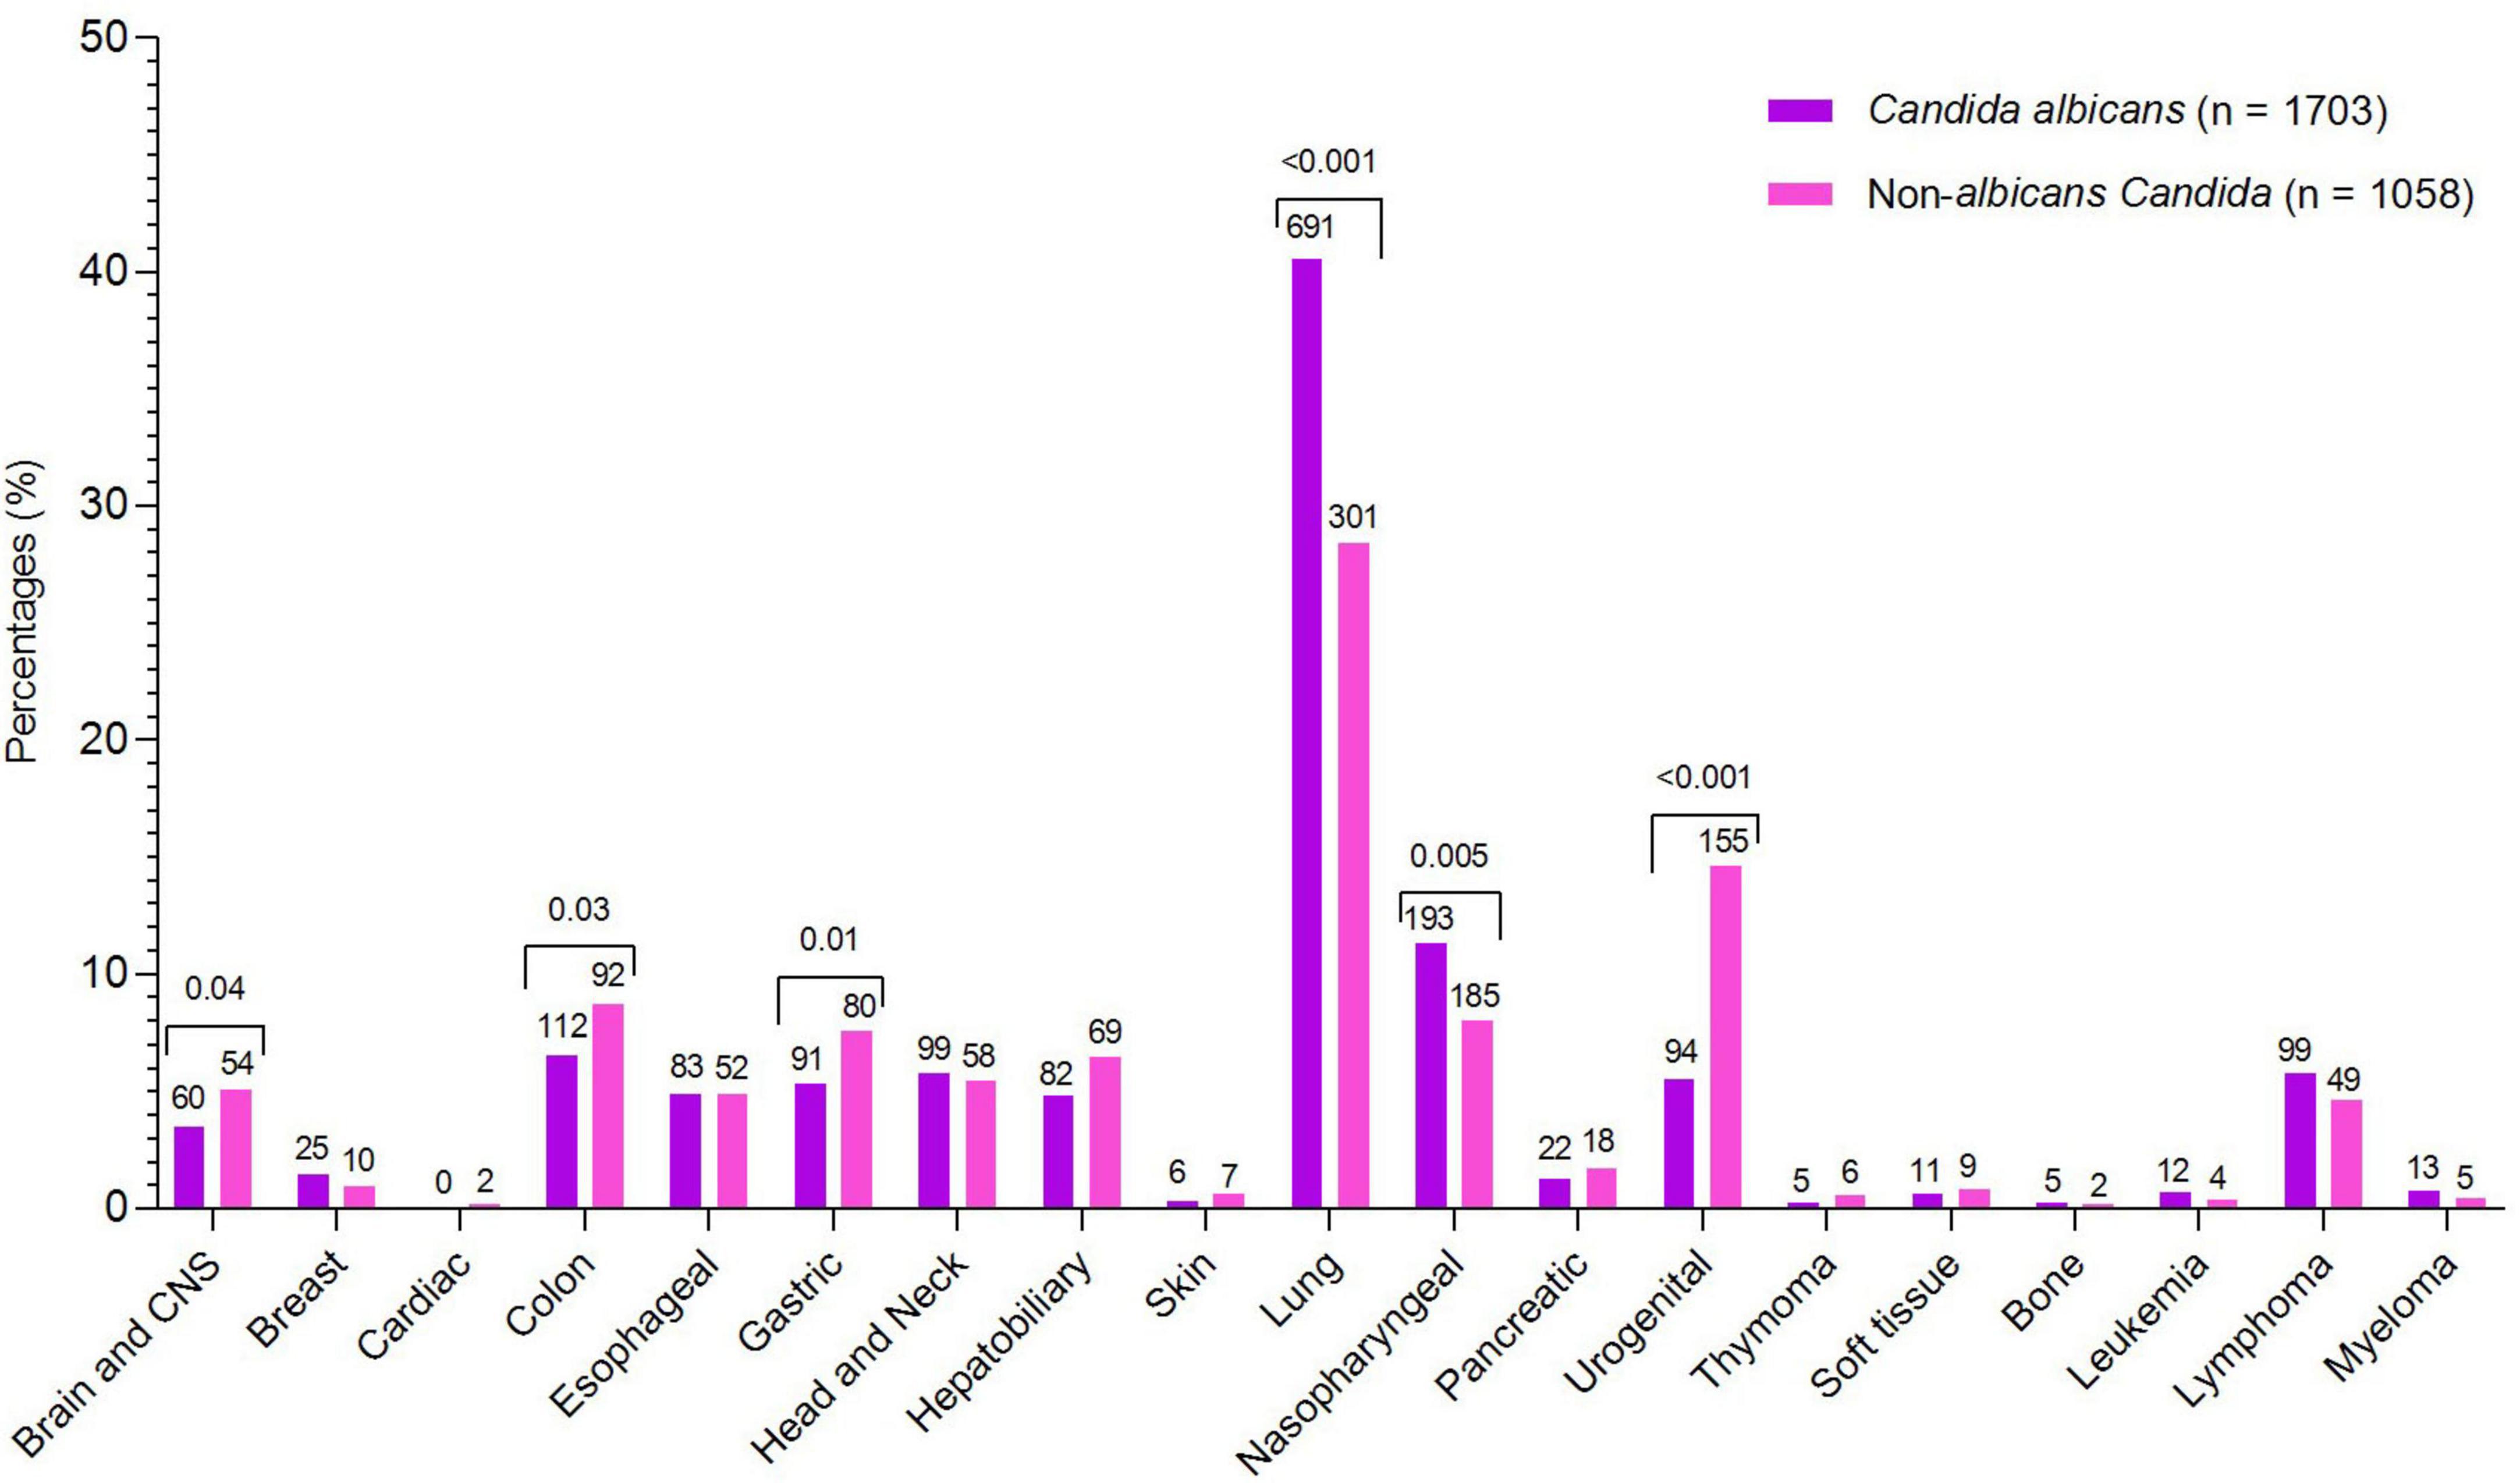
Figure 3. Comparative analysis of C. albicans and non-albicans Candida across cancer types. Species counts are shown above each bar, with significant p-values indicated above the corresponding cancer types.
A large number of cases involved lung cancer patients, leading to most Candida isolates being cultured from sputum (71.02%) and throat swabs (4.6%). From blood samples, a total of 39 cases were reported, of which 16 were C. parapsilosis, 14 were C. albicans, 5 were C. tropicalis, 2 were N. glabrata, and one each was P. kudriavzevii and M. guilliermondii. The percentages of Candida species reported from various specimen types are shown in Supplementary Figure 1.
Demographical, clinical, and risk factors analysis of non-albicans Candida versus C. albicans
The proportions of demographic and clinical variables related to risk factors, along with the univariate regression analysis of NAC versus C. albicans, are presented in Table 1. Regarding gender, the proportion of males (n = 1876, 67.95%) was higher than females (n = 885, 32.05%). The difference between NAC and C. albicans regarding gender was statistically insignificant. The median age (IQR) of the NAC group was 65 (55–72), while that for C. albicans was 64 (57–71). The median (IQR) for BMI, KPS, and hospital stay duration were slightly higher in the C. albicans group compared to the NAC group. Regarding cancer treatments, most patients underwent oncological surgeries (n = 844, 30.57%), followed by chemotherapy (n = 837, 30.32%), with only 6 patients (0.22%) receiving interventional therapies. The proportion of C. albicans was significantly higher in patients who underwent radiotherapy and targeted therapy. Respiratory failure, hypoproteinemia, electrolyte imbalance, anemia, hypokalemia, renal failure, thrombocytopenia, and urinary and biliary tract infections were significantly more common in the NAC group than in the C. albicans group. Invasive procedures and medical interventions, such as general surgeries, blood transfusions, mechanical ventilation, indwelling catheters, and inappropriate empirical therapies, were more commonly associated with the NAC group. Conversely, patients receiving glucocorticoids or parenteral nutrition, or those with chest tubes, had a higher proportion of C. albicans isolates.
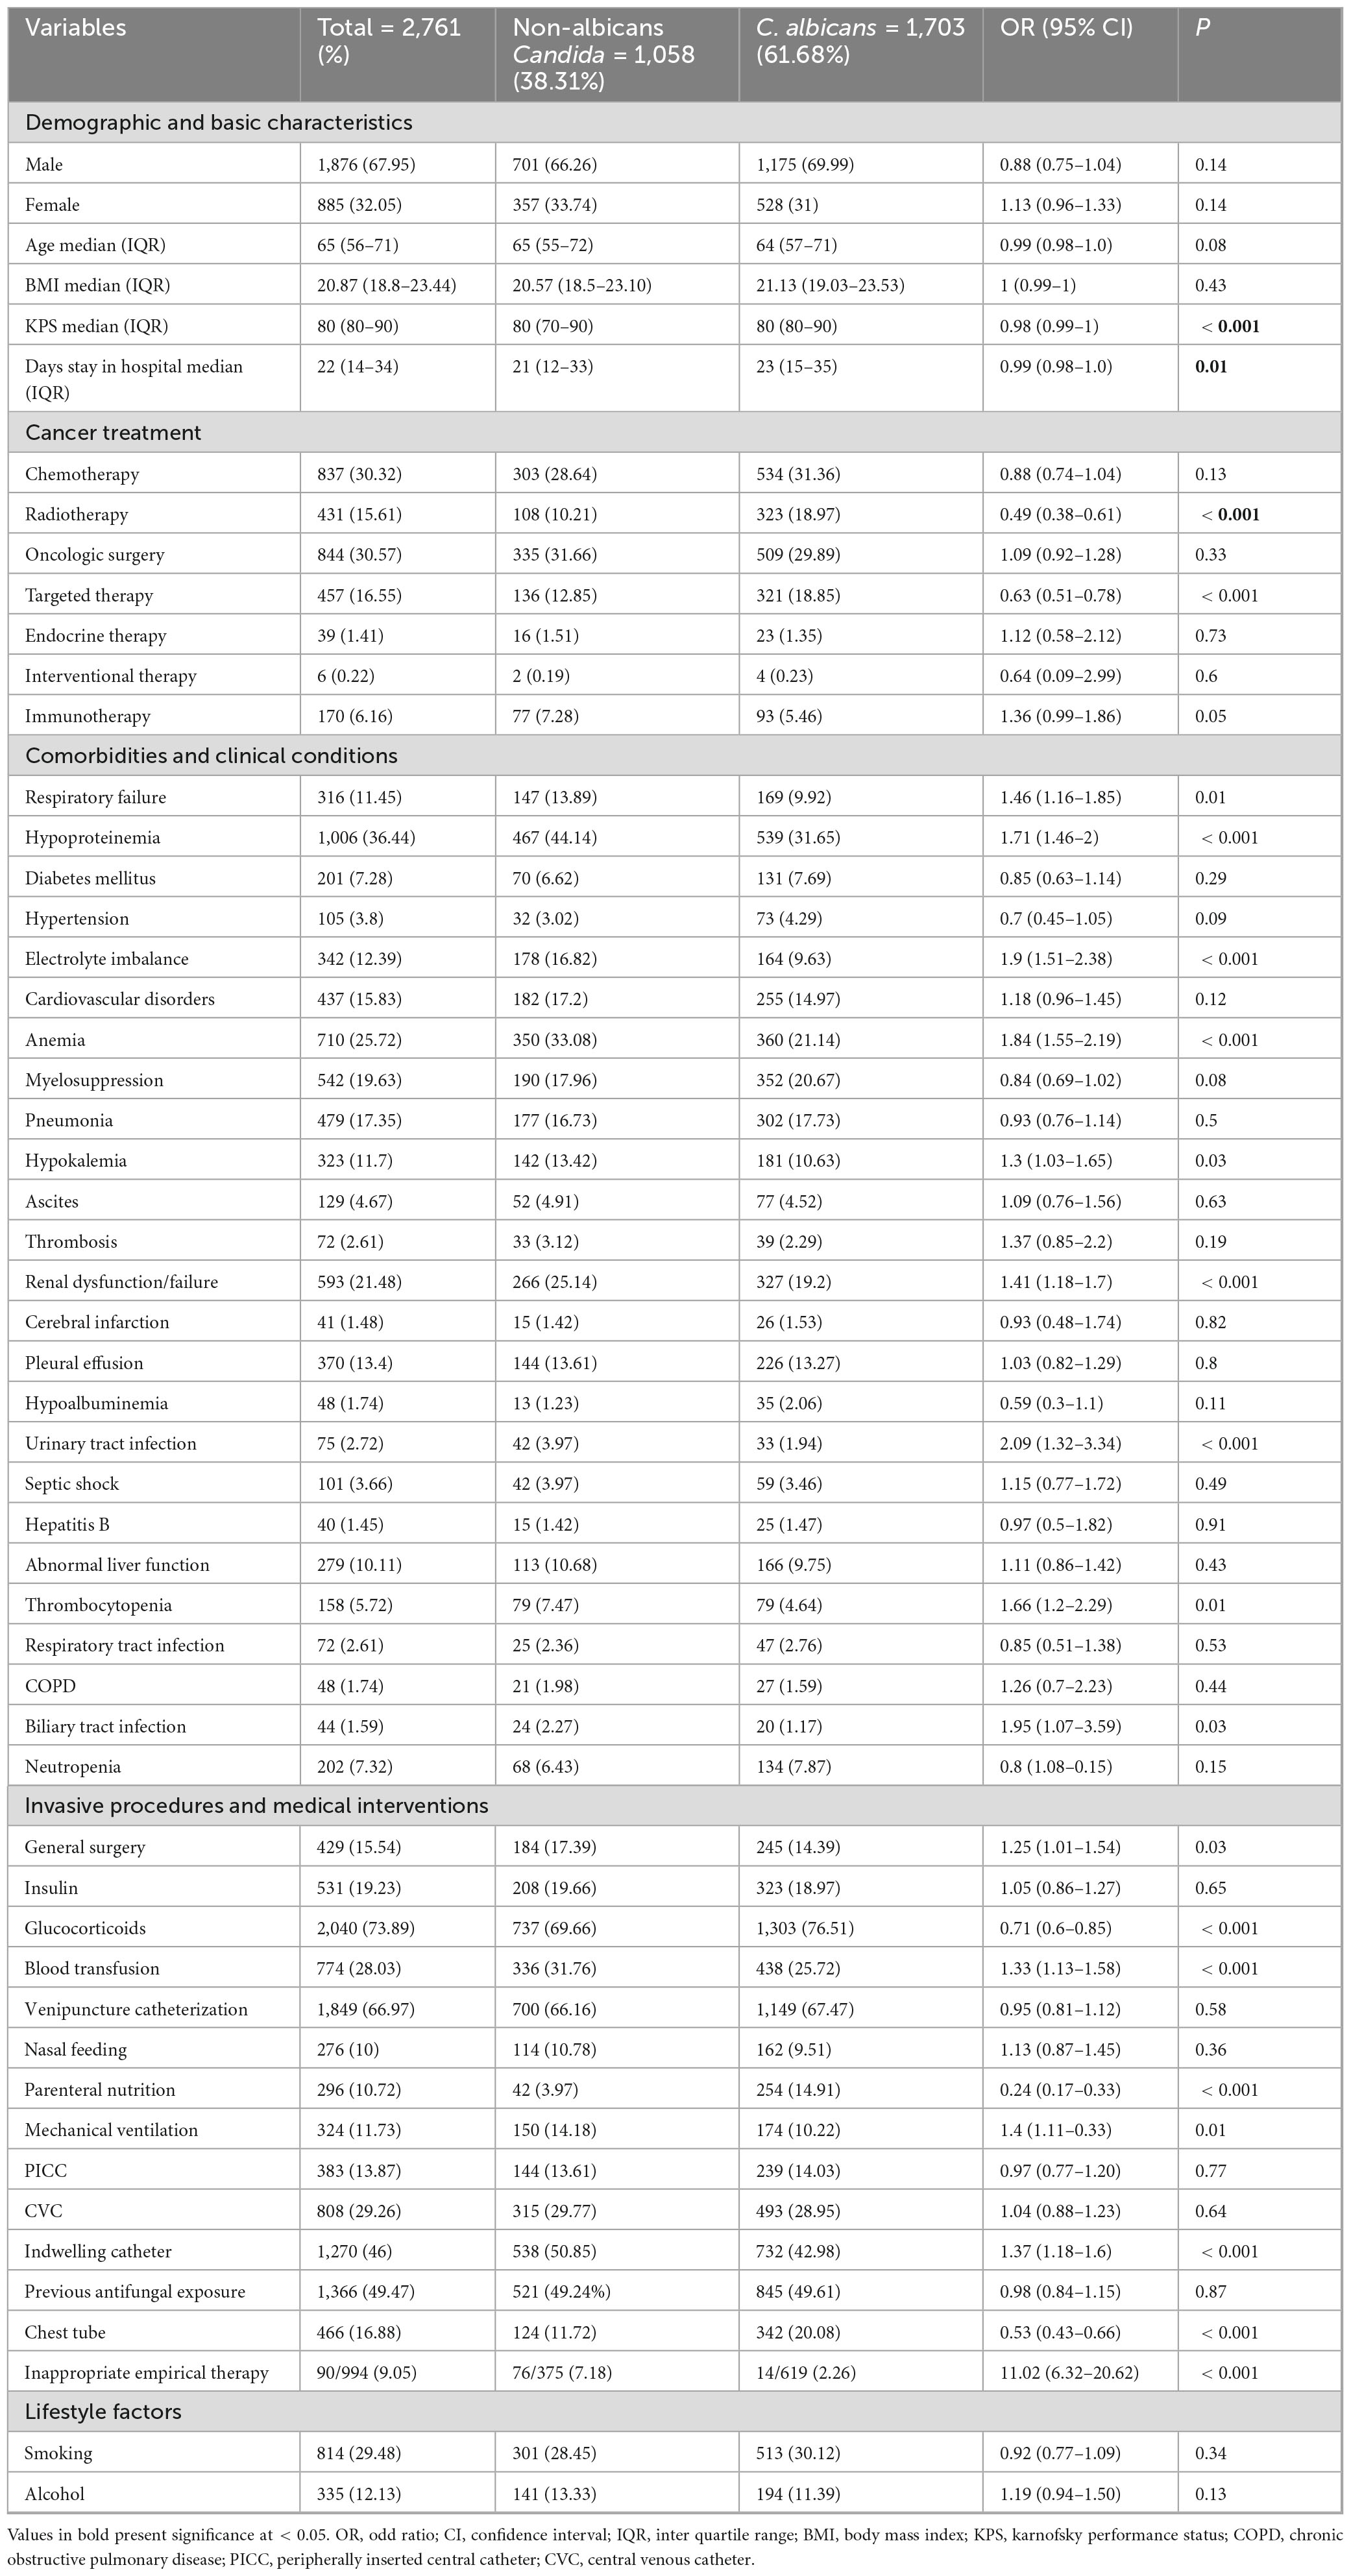
Table 1. Univariate regression analysis of NAC and C. albicans.
Furthermore, multivariate regression analysis was performed to determine independent risk factors for NAC and C. albicans groups. The inappropriate empirical therapies showed a significantly strong association with the NAC group, with the OR (95% CI) of 13.8 (7.57–26.89) and a p-value of < 0.001. Other independent risk factors for NAC included hypoproteinemia (OR = 1.35, P = 0.002), anemia (OR = 1.28, P = 0.02), urinary tract infection (OR = 1.71, P = 0.03), and the use of an indwelling catheter (OR = 1.27, P = 0.02). The OR (95% CI) and p-value for KPS were 0.99 (0.99–1) and 0.02, respectively, indicating that patients with poor performance status are more likely to develop NAC infections. Conversely, radiotherapy (OR = 0.59, P < 0.001), targeted therapy (OR = 0.74, P = 0.01), glucocorticoid use (OR = 0.71, P < 0.001), chest tube insertion (OR = 0.47, P < 0.001), and parenteral nutrition (OR = 0.23, P < 0.001) were significantly associated with C. albicans group (Table 2).
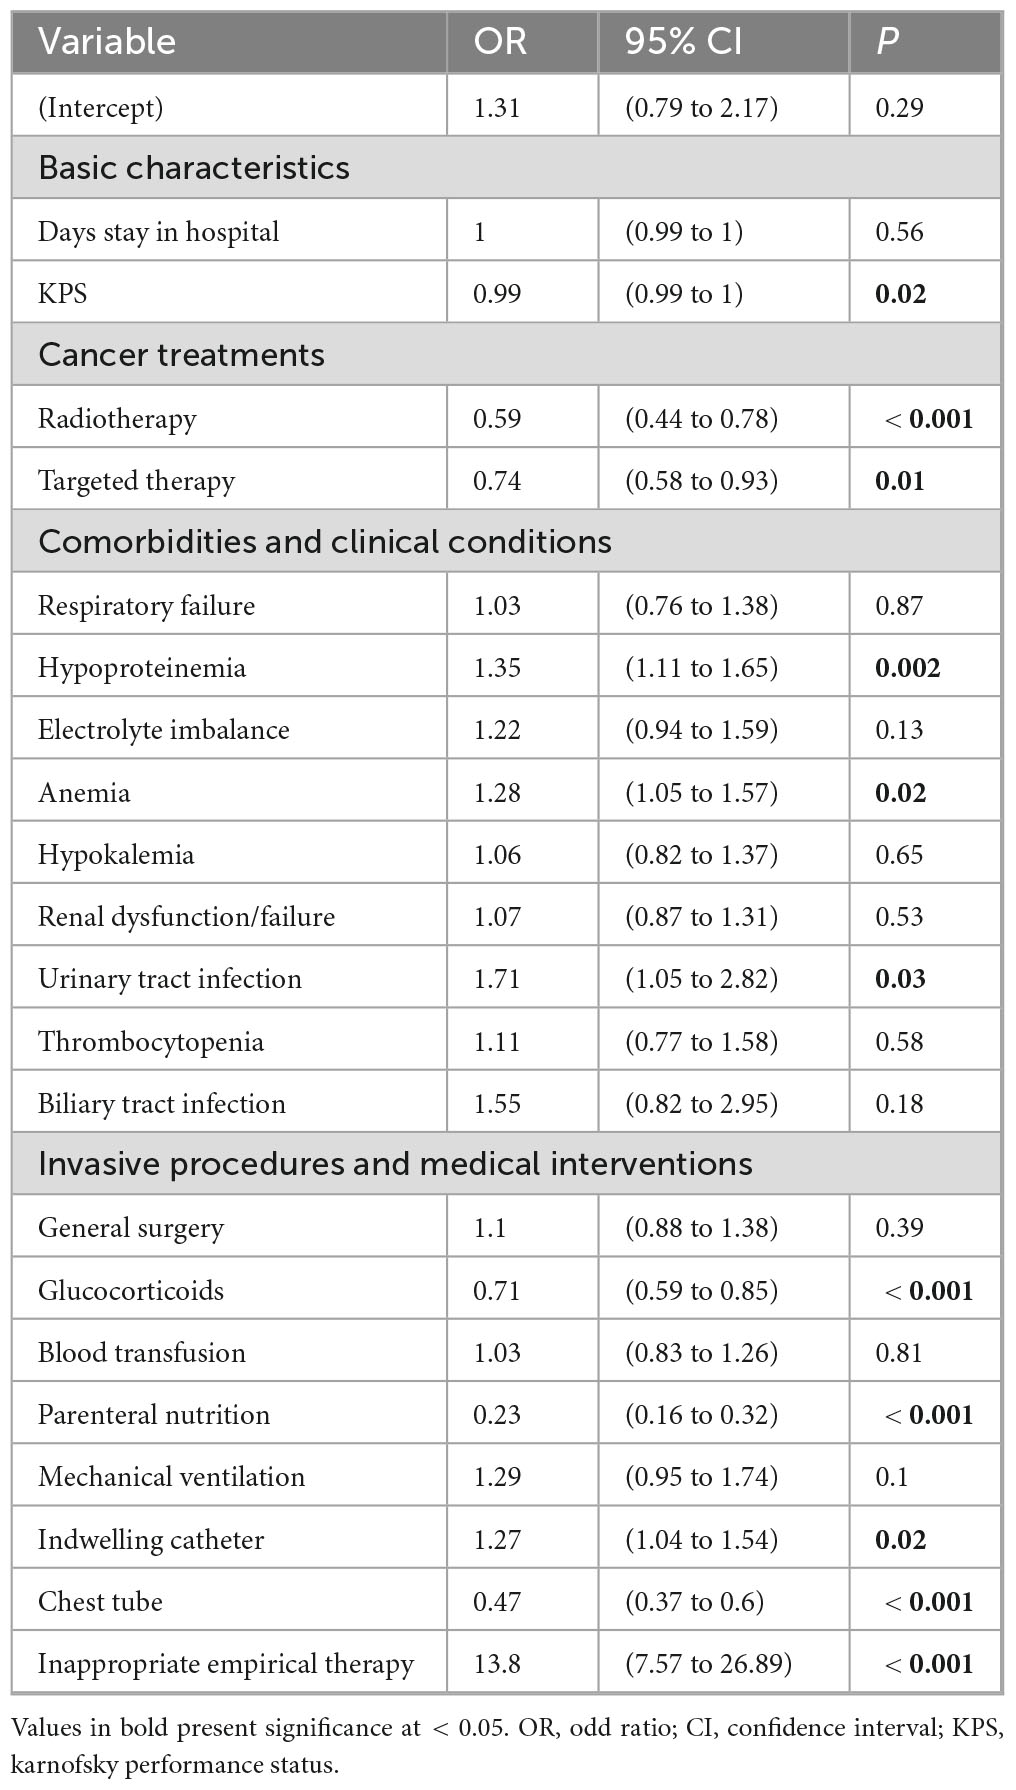
Table 2. Multivariate regression analysis of non-albicans Candida and C. albicans groups.
Antifungal susceptibility profiles
A total of nine antifungal drugs: amphotericin B, anidulafungin, caspofungin, fluconazole, voriconazole, itraconazole, micafungin, posaconazole, and 5-flucytosine, were tested against all Candida species. The MIC values analysis and percentage of susceptible/wild types, resistant/non-wild types, and intermediate or susceptible dose-dependent for all species are presented in Table 3. C. albicans showed > 99% susceptibility/non-wild types to amphotericin B, echinocandins and azoles such as voriconazole and posaconazole. However, 6.67 and 3.52% of C. albicans isolates were non-wild type for itraconazole and 5-flucytosine, respectively. Similarly, 1.23% of C. albicans isolates were resistant, and 1.29% were susceptible-dose dependent (SDD) to fluconazole. A high proportion of resistant or non-wild-type C. tropicalis isolates was noted against fluconazole, voriconazole, itraconazole, and posaconazole, with percentages of 40.9, 51.32, 74.45, and 64.98%, respectively. However, amphotericin B and echinocandins were effective, with susceptibilities of greater than 99% and greater than 96%, respectively. The resistant proportions of fluconazole, voriconazole, and posaconazole against N. glabrata isolates were 7.36, 12.94, and 6.6%, respectively. Amphotericin B (99.49%) remains the most effective drug against N. glabrata isolates. Among echinocandins, the lowest susceptibility was reported against micafungin (92.64%), followed by anidulafungin (93.91%) and caspofungin (94.42%). P. kudriavzevii isolates were 100% susceptible to amphotericin B and itraconazole. Similarly, 77.94% of P. kudriavzevii isolates were susceptible/non-wild types against voriconazole and 5-flucytosine. For C. parapsilosis, the lowest susceptibility was reported against fluconazole (79.67%), followed by voriconazole (89.43%). For all other drugs, susceptibility was greater than 90%. Among the 13 tested C. lusitaniae isolates, only three were non-wild type against fluconazole, while all remained wild type against the other tested drugs. Similarly, all six M. guilliermondii isolates were susceptible to all tested drugs. Amphotericin B was the more effective drug against all species, and echinocandins maintained robust activities.
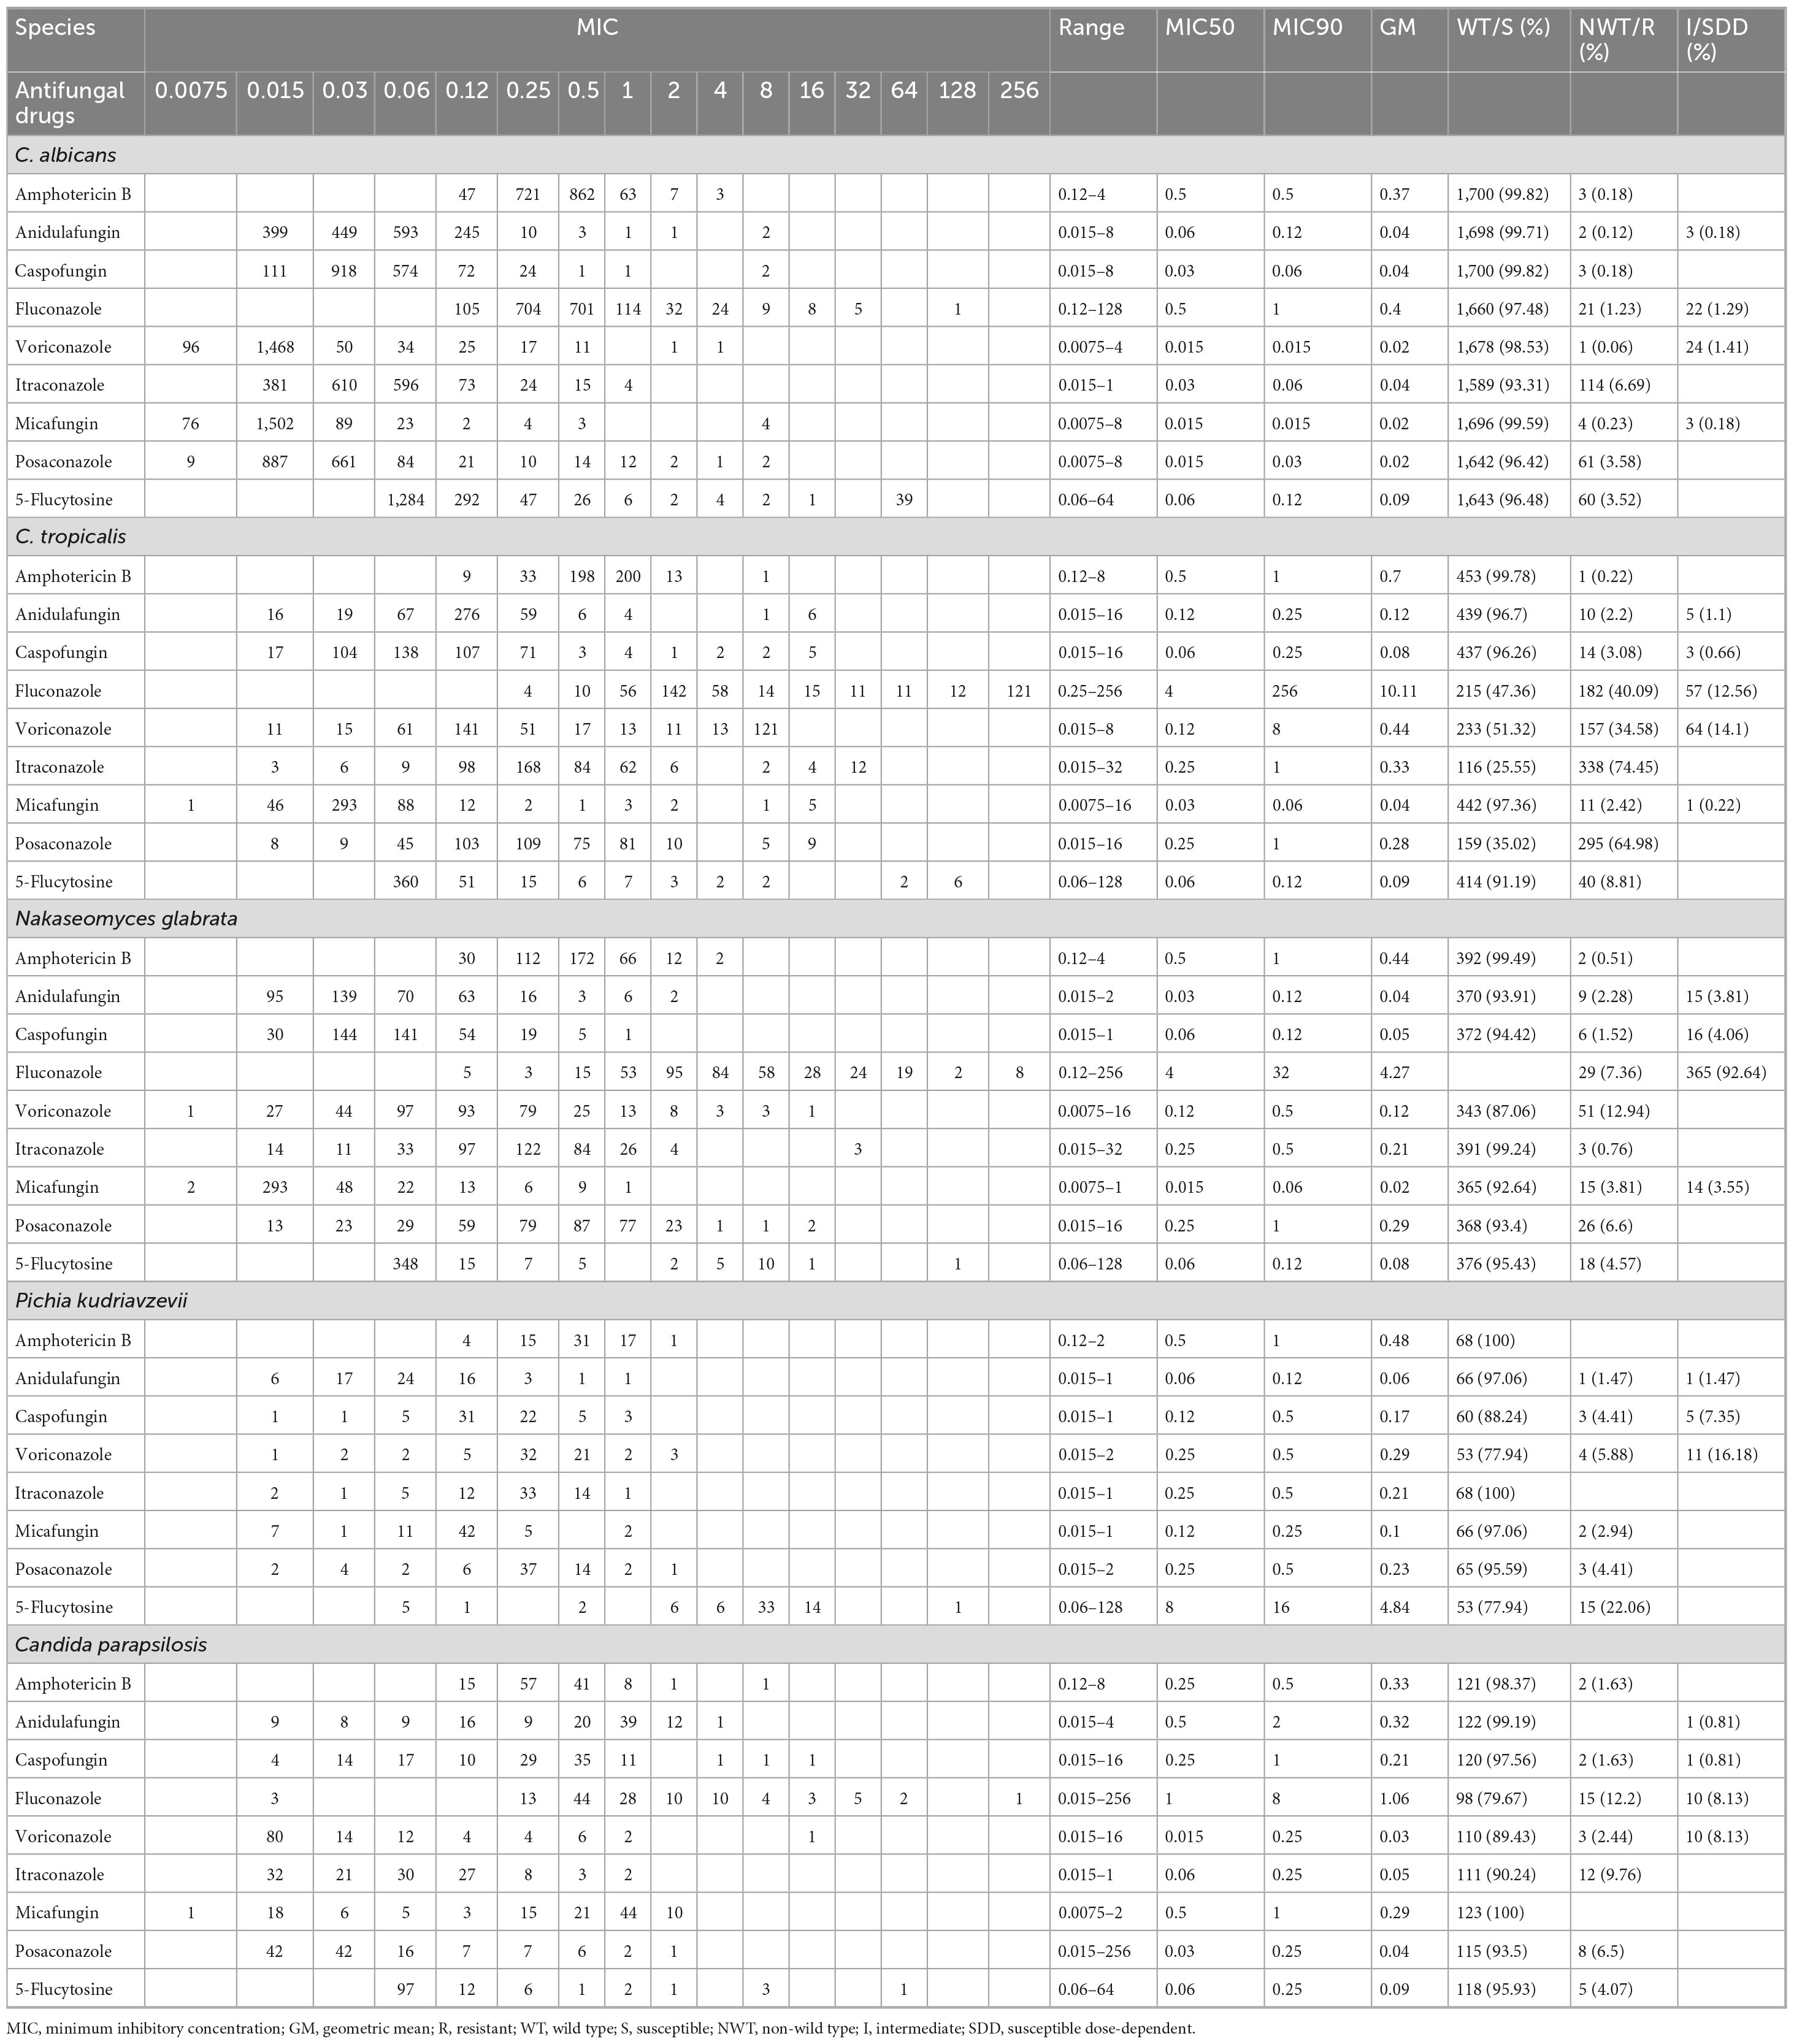
Table 3. Antifungal susceptibility profile of Candida species in the current study.
Correlation analysis of antifungal consumption and Candida species distribution and resistance
The data on antifungal consumption for fluconazole and caspofungin were converted to DDD/1,000 patients. For fluconazole, the highest DDDs per 1,000 patient-days were reported in 2020 (5.83), followed by 2023 (5.68) and 2022 (5.48). For caspofungin, the highest value was observed in 2023 (0.69), followed by 2024 (0.59) and 2021 (0.57). The linear regression analysis of fluconazole and caspofungin are shown in Supplementary Figure 2.
A Pearson correlation analysis was performed to examine the relationship between the consumption of caspofungin and fluconazole, species distribution, and the proportion of non-susceptible isolates (Table 4). No significant associations were observed between drug consumption and non-susceptibility, except for N. glabrata, where fluconazole consumption was negatively correlated with the proportion of non-susceptible isolates.
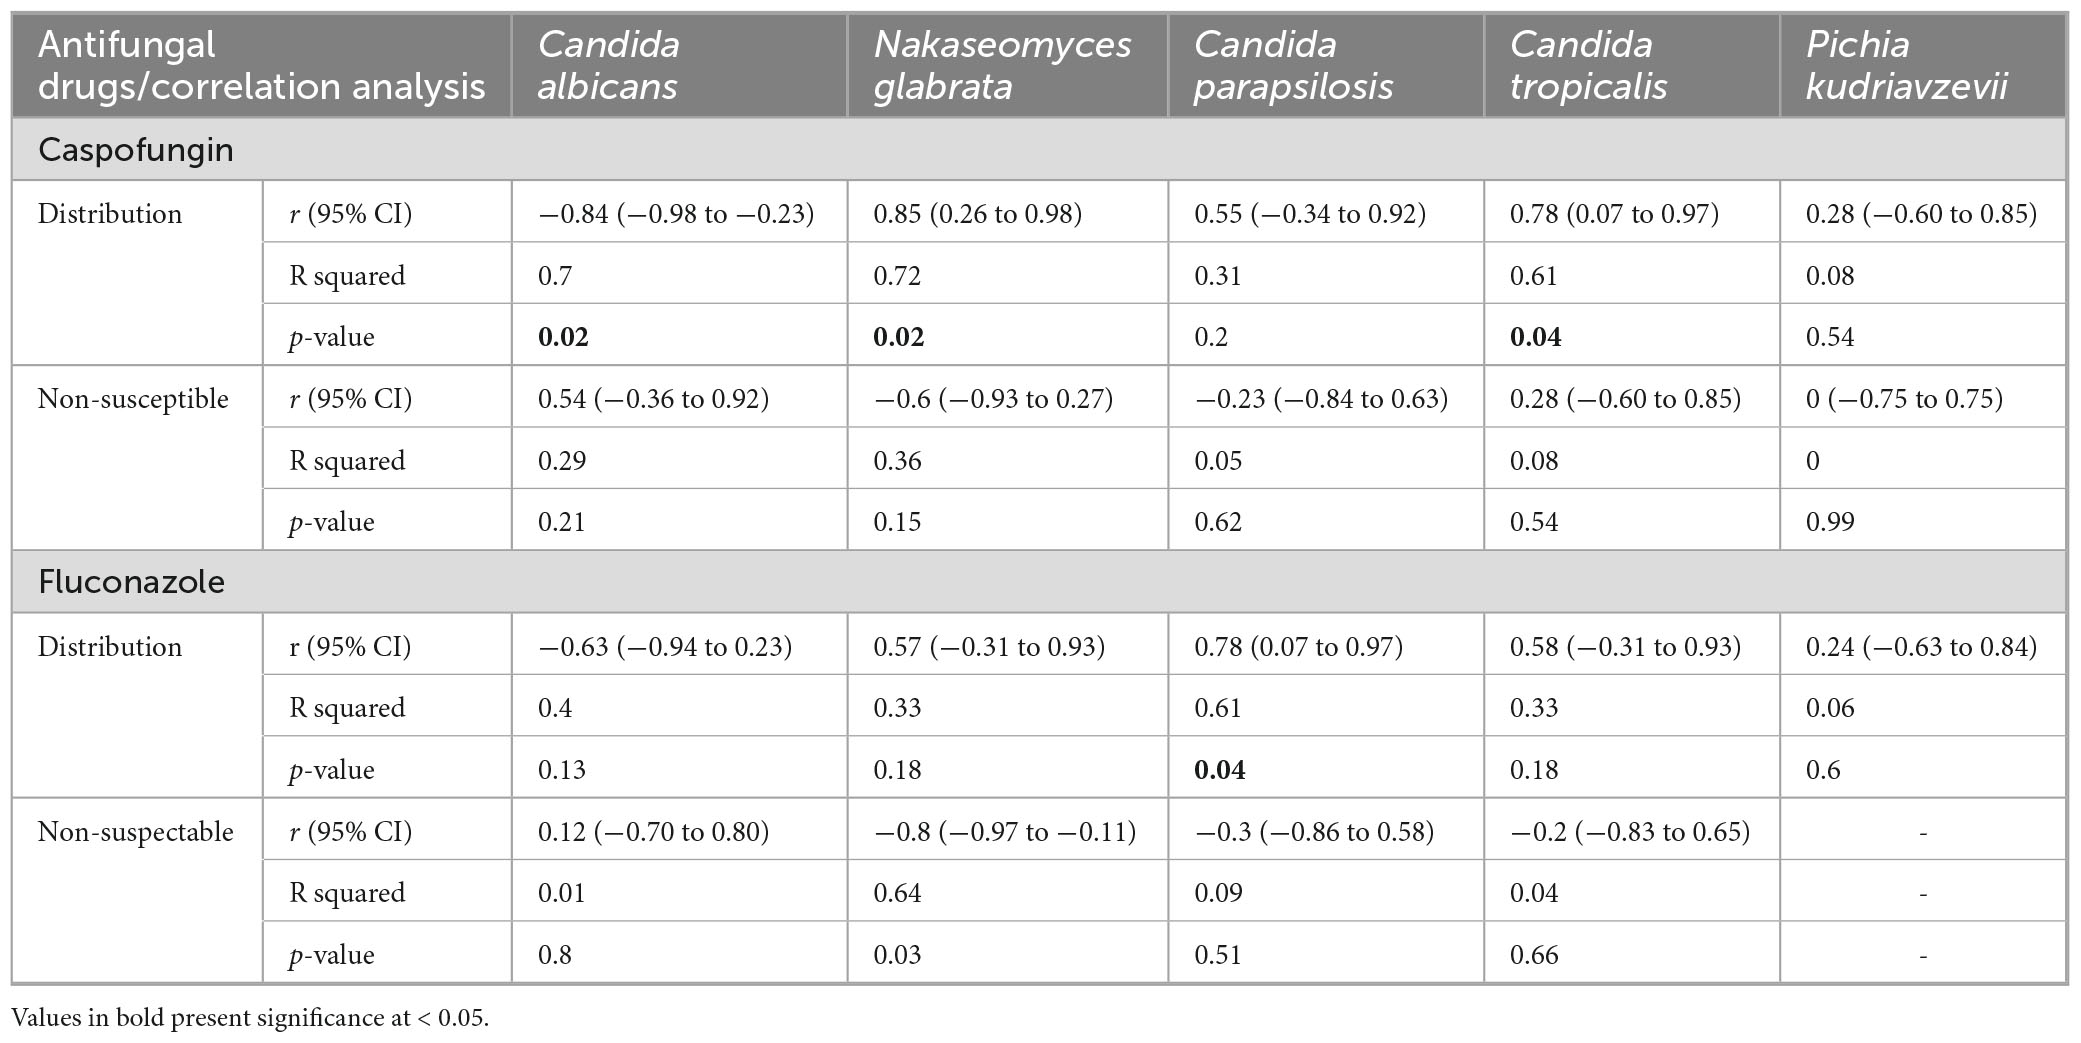
Table 4. Correlation analysis of caspofungin and fluconazole consumption and distribution and resistant proportion in the current study.
Notably, caspofungin consumption showed a significant negative correlation with C. albicans distribution (r = −0.84, P = 0.02) and significant positive correlation with C. tropicalis (r = 0.78, P = 0.04) and N. glabrata (r = 0.85, P = 0.02), suggesting a shift in Candida distribution from C. albicans to NAC species. Similarly, fluconazole consumption was significantly positively correlated with C. parapsilosis distribution (r = 0.78, P = 0.04), indicating a possible selective pressure favoring the proliferation of NAC species.
Survival analysis
A total of 185 (6.7%) 30-day mortality cases and 211 (7.64%) all-cause mortality cases were reported across all Candida cases. For the NAC group, the 30-day and all-cause mortality rates were 90 (8.69%) and 102 (9.85%), respectively. For the C. albicans group, these rates were 95 (5.58%) and 109 (6.4%), respectively. The Kaplan-Meier survival analysis revealed that patients infected with NAC species had a significantly lower survival probability than those infected with C. albicans (p = 0.0075, log-rank test) (Figure 4).
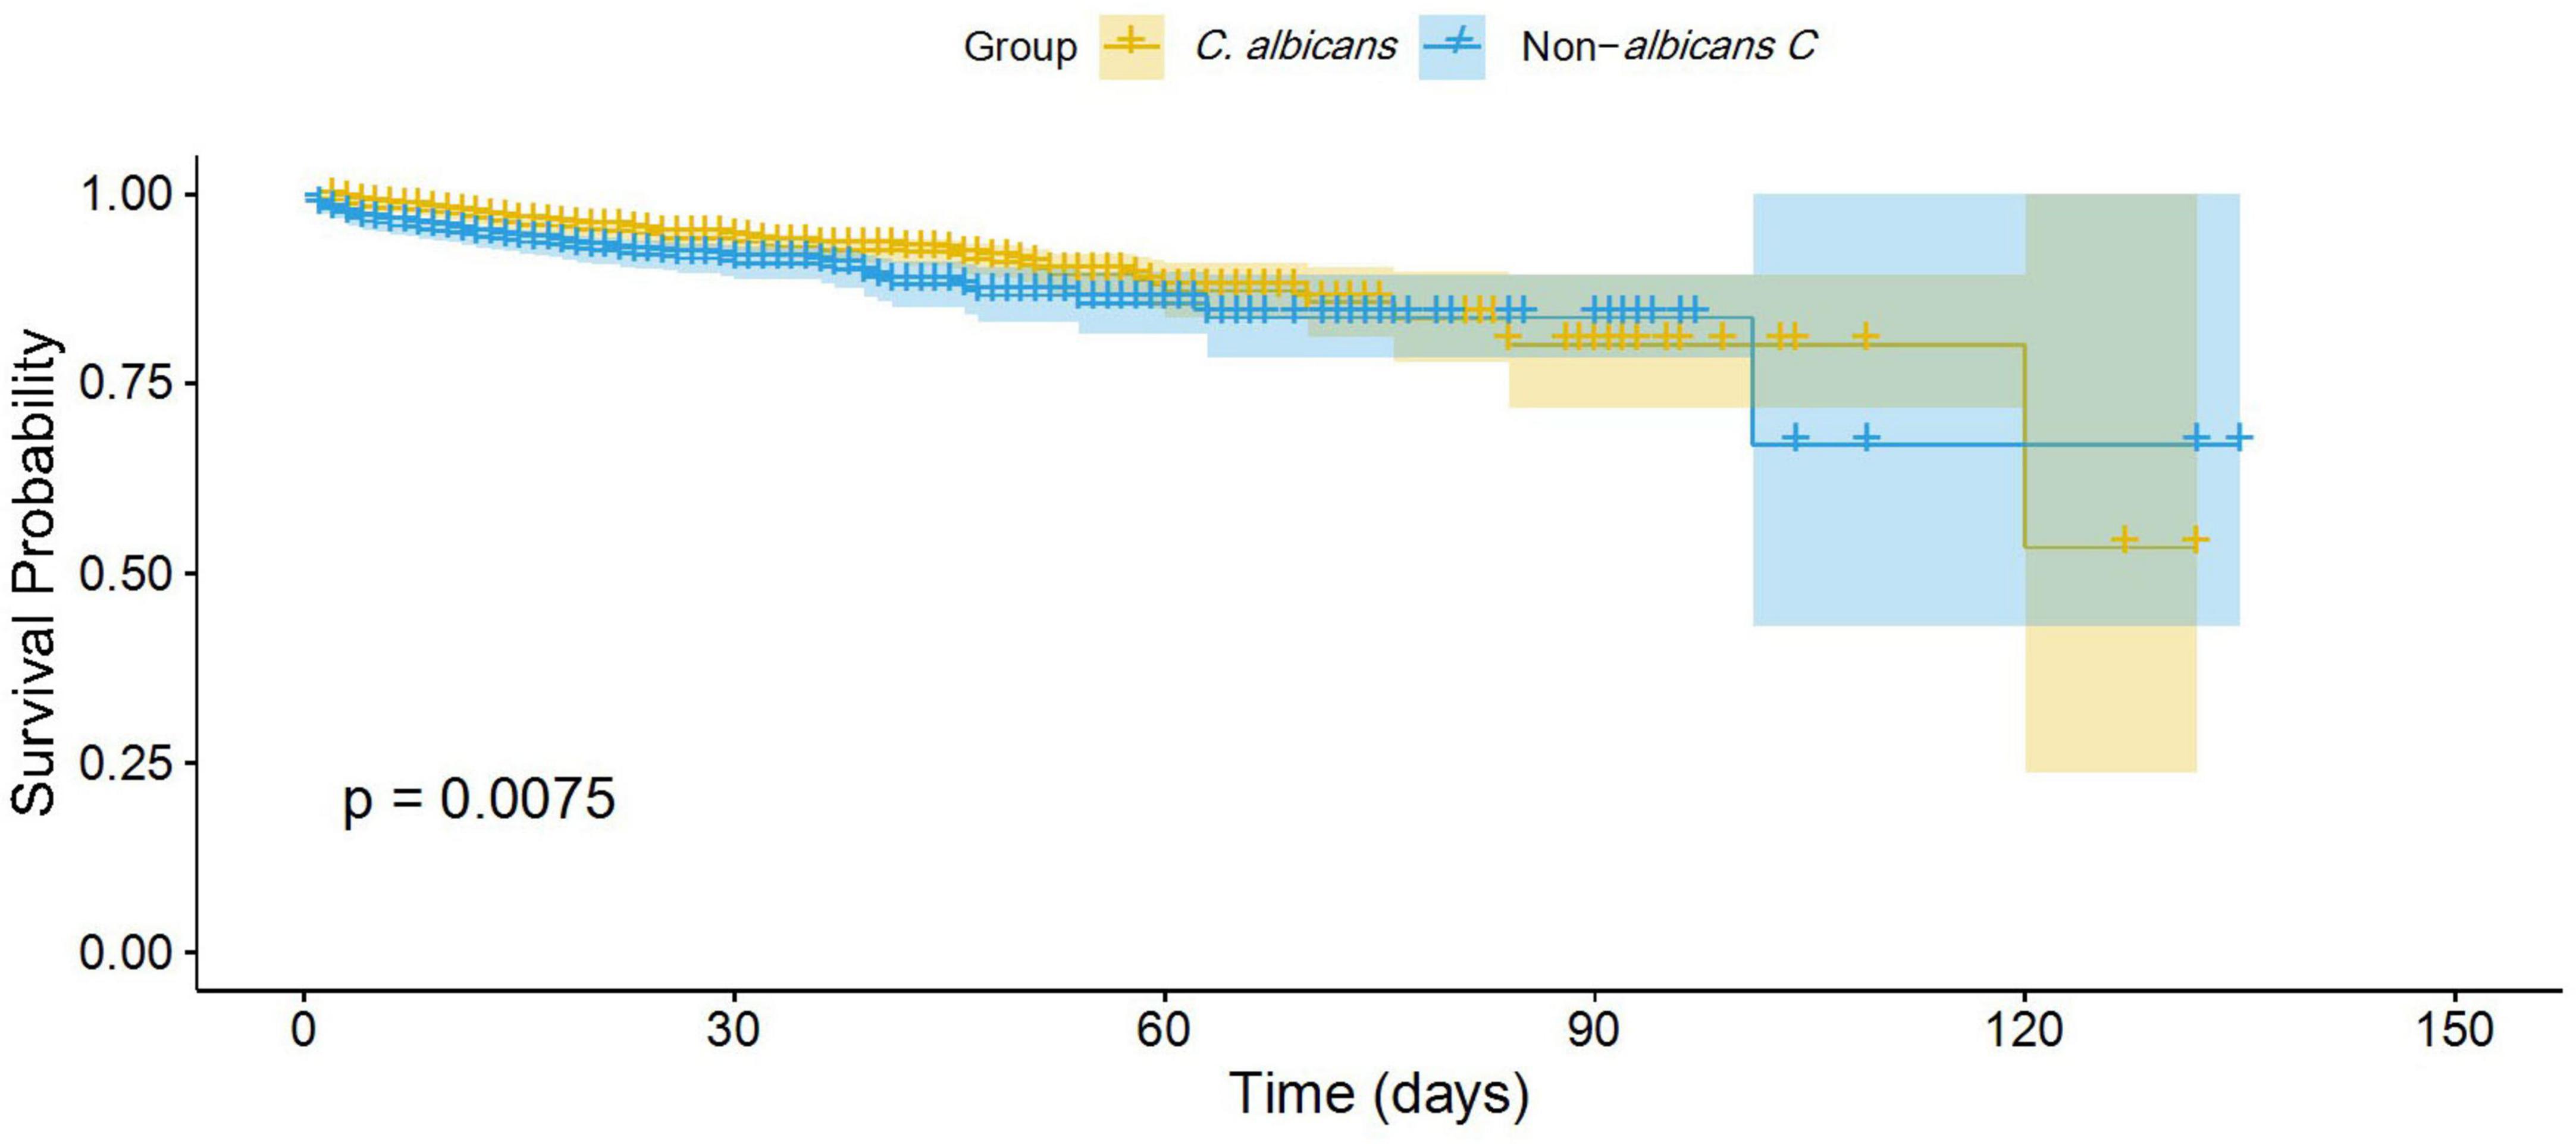
Figure 4. Kaplan-Meier survival curve analysis of C. albicans versus non-albicans Candida group.
Furthermore, the Cox proportional hazard model was applied to determine the mortality risk for NAC versus C. albicans groups. The result revealed that NAC cases had a 1.5-fold higher risk of mortality compared to C. albicans cases (HR = 1.5; 95% CI: 1.1–2.0; P = 0.008) (Figure 5).
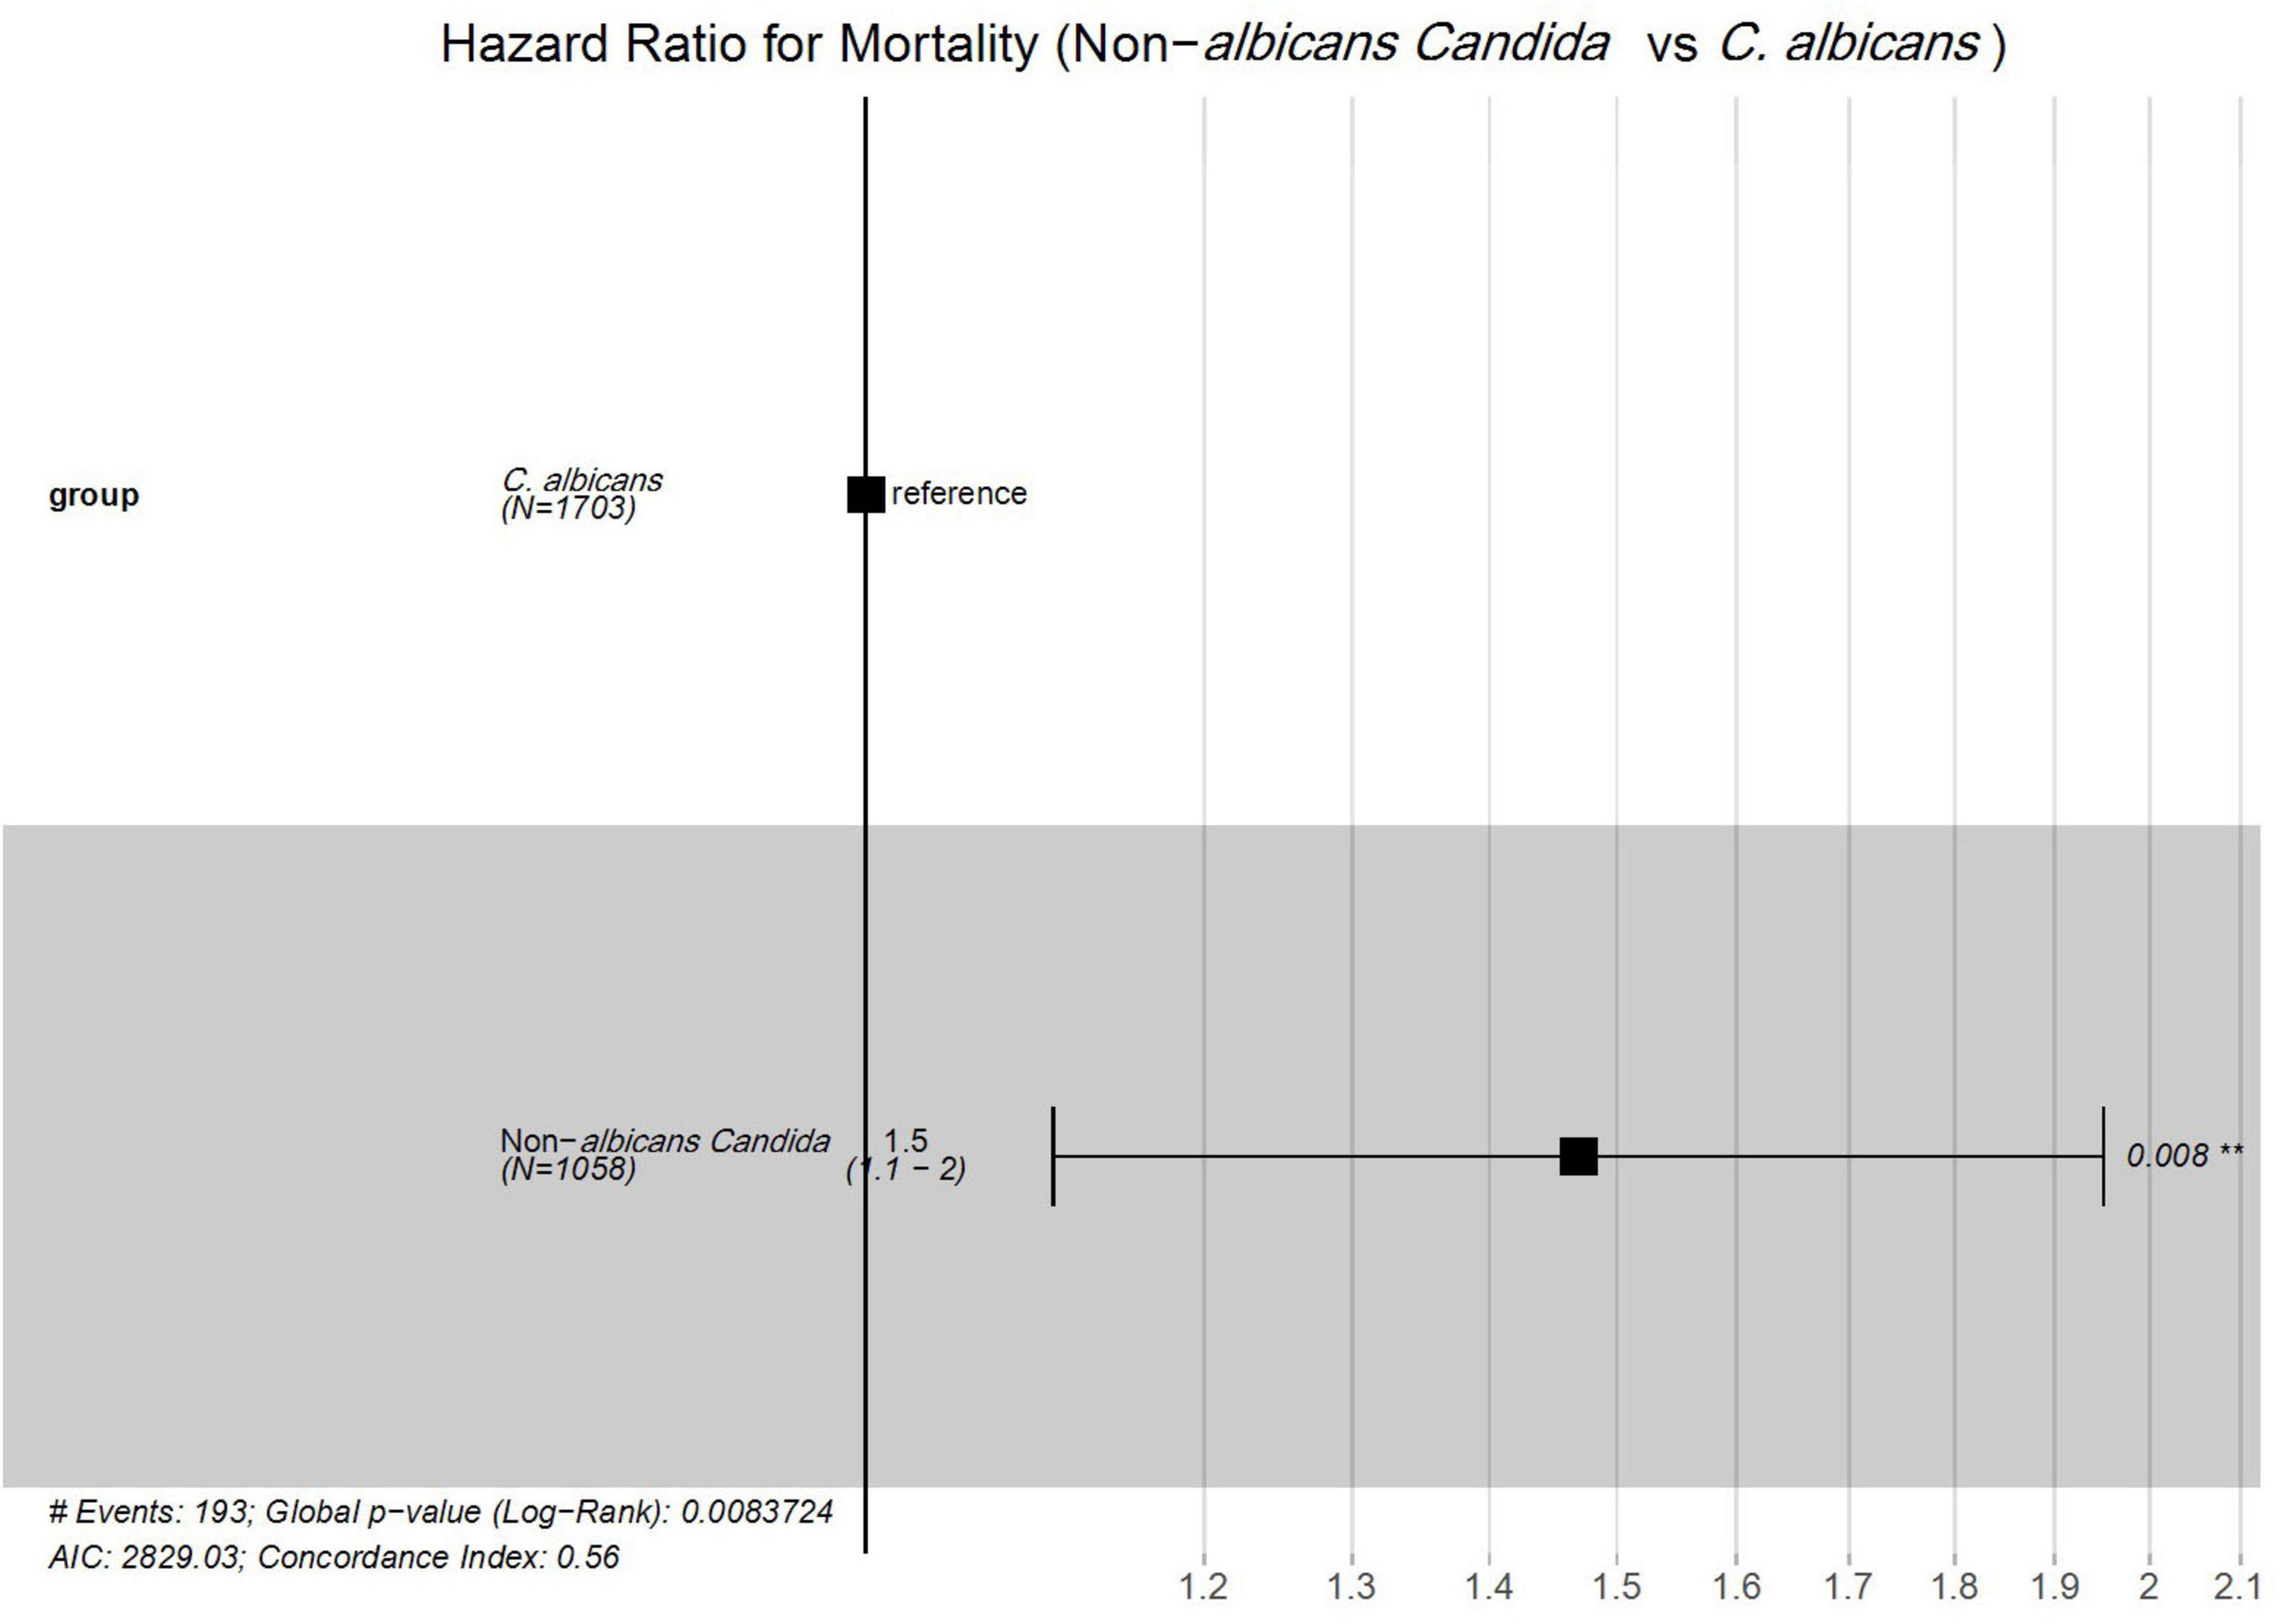
Figure 5. Cox proportional hazards analysis of mortality risk between Candida albicans and non-albicans Candida groups. #; Numbers, **; Significant.
Discussion
Candida infection is common in cancer patients due to their immunocompromised status, requiring timely management. However, studies focusing on Candida isolates from cancer patients in China are limited (Sharifi et al., 2023). This study comprehensively analyzed the species distribution, risk factors, and antifungal susceptibilities of Candida isolates from cancer patients in Jiangxi, China. Overall, C. albicans remains dominant in our study; however, the year-wise trend showed a decreasing incidence of C. albicans and an increasing trend of NAC. This shifting epidemiological landscape aligns with the previously published literature from China (Khan et al., 2025). Among the NAC group, C. tropicalis was the most frequently reported, followed by N. glabrata and C. parapsilosis. The high proportion of C. tropicalis in our study aligns with previous findings, contrasting with Europe and the United States, where N. glabrata is more common (Ricotta et al., 2020; Wang et al., 2021; Wolfgruber et al., 2024). The variation in species distribution might be due to differences in healthcare practice, patients’ demographics, and regional latitudes (Bilal et al., 2022; Khan et al., 2025). Among the sample types, sputum and throat swabs were the most frequent in our study. This is due to the high proportion of lung and nasopharyngeal cancer cases, for which sputum and throat swab collection is a less invasive and more patient-friendly method to obtain biological specimens (Lucaciu et al., 2024; Sharifi et al., 2023). C. parapsilosis was predominantly found in blood samples, consistent with its known role in candidemia, due to its affinity for intravascular catheters and ability to form biofilms (Franconi et al., 2023).
Among the cancer types, Candida species were most commonly isolated from patients with lung and nasopharyngeal malignancies. This may be due to their anatomical site, as the respiratory and upper aerodigestive tracts are exposed to the external environment, which poses a high risk of colonization and infection (Liu et al., 2025). Furthermore, radiotherapies in these cancers can cause salivary gland dysfunction, mucositis, and alterations in oral flora, which facilitate Candida colonization and infection (Bhumitrakul et al., 2024). NAC was significantly predominant in gastric, colon, and urogenital cancers, while C. albicans was significantly more prevalent in lung and nasopharyngeal cancers. The unique mucosal environment and frequent exposure to broad-spectrum antimicrobials might selectively favor the colonization of NAC in gastrointestinal and urogenital cancer (Sun et al., 2025). Conversely, the commensal nature of C. albicans in the oropharyngeal tract and its adaptability to an oxygen-rich environment might promote its colonization in infection among lung and nasopharyngeal cancer patients (Debta et al., 2022).
Regarding risk factor analysis, inappropriate empirical therapies were significantly associated with the NAC group. This may be due to the lower susceptibility of NAC species to commonly used empirical treatments, leading to delayed infection clearance and enabling their proliferation (Katsipoulaki et al., 2024). Furthermore, correlation analysis was performed with caspofungin and fluconazole consumption, with the distribution of Candida species, and the proportion of non-susceptibility. Notably, a negative correlation was observed between caspofungin consumption and C. albicans distribution, and positive correlations were observed with N. glabrata and C. tropicalis. Similarly, a positive correlation was found between fluconazole consumption and C. parapsilosis. This finding reinforces our previous observation of the epidemiological shift of C. albicans to NAC, as well as the significant association between inappropriate therapies and the NAC group. The C. albicans are comparatively more susceptible to antifungal drugs and are mostly cleared with empirical treatments. This selective pressure promotes the emergence of less susceptible NAC species (Dawoud et al., 2024). Besides this, hypoproteinemia, anemia, UTI, and indwelling catheter use were observed as independent risk factors for the NAC group. The low serum protein level and anemia indicate impaired immune function and oxygen delivery, favoring the proliferation of NAC species (Jørgensen, 2024). Similarly, UTI disrupts the normal urogenital flora, providing a conducive environment for NAC species colonization and infection. Catheterization is a well-documented risk factor for NAC, as C. parapsilosis and C. tropicalis form biofilms on its surface, facilitating candidiasis (Wijaya et al., 2023; Yamin et al., 2021). Radiotherapy, targeted therapy, glucocorticoid use, chest tube insertion, and parenteral nutrition were independent risk factors for the C. albicans group. Studies have shown that radiotherapy and glucocorticoid use impair mucosal immunity, promoting the adhesion and invasiveness of C. albicans (Pasman et al., 2022). Targeted therapy contributes to immunosuppression, promoting the pathogenic transformation of commensal C. albicans (Feng et al., 2024). Similarly, chest tubes and parenteral nutrition provide direct access to a nutritionally rich environment for the proliferation of C. albicans species (Cinti et al., 2024; Nagar et al., 2023).
Regarding the antifungal susceptibility profiles, amphotericin B was the most susceptible drug against all Candida species, reaffirming its status as a potent broad-spectrum antifungal agent. C. albicans isolates were susceptible primarily to the tested antifungal agents, except for itraconazole and 5-flucytosine, for which 6.67 and 3.52% of the tested isolates were non-wild types. These findings align with prior studies, which report generally high but not absolute susceptibility to tested antifungal agents (Bilal et al., 2022). The occasional resistance may be linked to mutations in genes involved in ergosterol biosynthesis, efflux pump regulation, cytosine permease function, and deaminase activity (Huang et al., 2025). Among the NAC, the azole drugs were less susceptible compared to other antifungal agents. Specifically, the C. tropicalis isolates showed high resistance to all azole drugs, with rates of 40.9, 51.32, 74.45, and 64.98% against fluconazole, voriconazole, itraconazole, and posaconazole, respectively. A previously published systematic analysis of data from the past 10 years in China reported high resistance rates, with 22.05% of C. tropicalis isolates being non-susceptible to fluconazole and 16.9% to itraconazole (Bilal et al., 2022). This high resistance to azole drugs reflects emerging regional resistant trends due to its widespread use. Previous literature attributes such resistance to mechanisms such as ERG11 mutation and efflux pump overexpression (Siqueira et al., 2025). The echinocandins showed a comparatively less resistant rate (<5%) against all NAC species. However, careful administration of echinocandin drugs is required, as some recent studies have reported the emergence of resistance due to mutations in the hotspot region of the FKS1 and FKS2 genes (ElFeky et al., 2025; Huang et al., 2025). Notably, 22.06% of P. kudriavzevii isolates were non-wild-types against 5-flucytosine. The resistance has been linked in previous reports to mutations in cytosine permease (FCY2) and deficient cytosine deaminase activity, which impair 5-flucytosine uptake and metabolism (Czajka et al., 2023). These mutations are reportedly more prevalent in P. kudriavzevii than in other NAC species (Jamiu et al., 2020). Therefore, based on the current literature, monotherapy with 5-flucytosine for P. kudriavzevii is often unsuitable and may require combination therapy with other antifungal agents such as echinocandins or amphotericin B (Nguyen et al., 2024).
Overall, the mortality rate in our study (6–10%) was comparatively lower than that reported in other studies from China, which have documented rates ranging from 20 to 50% (Bilal et al., 2023; Dai et al., 2025; Zhang et al., 2019). Our lower mortality rate may be attributed to the inclusion of all Candida cases, rather than only those involving invasive or bloodstream infections, which are typically associated with a higher mortality rate (Kwon et al., 2021). When comparing survival probabilities between the C. albicans and NAC groups, the NAC group showed a lower survival probability and a 1.5-fold higher mortality risk. The finding of a high mortality risk in the NAC group aligns with previous results reported by other researchers. This higher mortality risk associated with NAC may be attributed to their antifungal resistance mechanisms, particularly against azole drugs, and delays in initiating appropriate empirical therapies (Chastain et al., 2024; Hoenigl et al., 2024).
The increasing prevalence of azole-resistant non-albicans Candida species in our oncology patients highlights the need to reconsider empirical antifungal therapy, favoring agents such as amphotericin B and echinocandins, which have shown higher susceptibility. This aligns with IDSA guidelines, which recommend echinocandins as first-line treatment in high-resistance settings (Pappas et al., 2015). Incorporating local resistance data into antifungal stewardship programs can promote targeted, timely therapy, reduce unnecessary azole use, and prevent the development of further resistance. Stewardship efforts, including ongoing surveillance, clinician education, and region-specific treatment protocols, are crucial in oncology care to optimize antifungal use, enhance patient outcomes, and preserve drug efficacy (Fisher et al., 2022).
The limitations of the present study include its retrospective nature, single-center design, and the unavailability of isolates for molecular analysis, such as genotyping and detection of resistance mechanisms, including ERG11 and FKS mutations. Additionally, clearly distinguishing between colonization and invasive candidiasis was impossible due to the absence of some clinical details, such as radiological and biomarker data. These factors may limit the external validity of the findings, though they remain clinically relevant within similar hospital settings. Nevertheless, we included all culture-positive cases in which physicians had a clinical suspicion of fungal infection, reflecting real-world diagnostic practices. Despite these limitations, our study remains distinctive in providing a thorough evaluation of Candida cases among cancer patients, a dataset that is rarely available. The findings from this work are expected to aid healthcare professionals in more effectively managing Candida infections in similar clinical settings.
Conclusion
This study retrospectively analyzed the species distribution, risk factors, and antifungal susceptibility patterns of Candida isolates among cancer patients in Jiangxi, China. While C. albicans remained the predominant species, a year-wise trend indicated a declining proportion of C. albicans and a rising incidence of NAC. Caspofungin consumption showed a negative correlation with C. albicans and positive correlations with N. glabrata and C. tropicalis distribution. A higher proportion of C. albicans isolates were recovered from lung and nasopharyngeal cancers, whereas NAC species were more frequently associated with gastric, colon, and urogenital cancers. Inappropriate empirical therapy, hypoproteinemia, anemia, and the use of indwelling catheters were identified as independent risk factors for NAC infections. In contrast, radiotherapy, targeted therapy, and glucocorticoid use were significantly associated with C. albicans. The NAC group exhibited a 1.5-fold higher mortality risk than the C. albicans group. Amphotericin B and echinocandins demonstrated good activity against Candida species, whereas lower susceptibility rates to azole drugs were observed, particularly among NAC isolates. Future large-scale, multicenter molecular studies are warranted to investigate emerging azole resistance mechanisms in NAC species.
Data availability statement
The raw data supporting the conclusions of this article will be made available by the authors, without undue reservation.
Ethics statement
The studies involving humans were approved by the Human Research Ethics Committee of the Jiangxi Cancer Hospital and Institute. The studies were conducted in accordance with the local legislation and institutional requirements. The human samples used in this study were acquired from a by- product of routine care or industry. Written informed consent for participation was not required from the participants or the participants’ legal guardians/next of kin in accordance with the national legislation and institutional requirements.
Author contributions
HB: Conceptualization, Writing – review & editing, Methodology, Writing – original draft, Visualization, Software, Investigation. XL: Validation, Data curation, Writing – review & editing. XW: Methodology, Resources, Writing – review & editing. MK: Writing – review & editing, Software. MS: Writing – review & editing, Formal Analysis. JY: Data curation, Writing – review & editing, Resources. HQ: Writing – review & editing, Visualization. Q-LL: Project administration, Conceptualization, Writing – review & editing, Funding acquisition. BX: Funding acquisition, Conceptualization, Supervision, Writing – review & editing.
Funding
The author(s) declare that financial support was received for the research and/or publication of this article. This work was supported by the Science and Technology Research Project of Jiangxi Provincial Department of Education (GJJ2403604) and (GJJ2203508), Research Start-Up Fund of Jiangxi Cancer Hospital (BSQDJ2024001), The Distinguished Young Scholars Program of the Natural Science Foundation of Jiangxi Province (20224ACB216015), The Distinguished Young Scholars Fund of Jiangxi Cancer Hospital (2021DYS01), and 2023 Key Project for Science and Technology Innovation of Jiangxi Provincial Health Commission (2023ZD005).
Acknowledgments
We are thankful to the Jiangxi Cancer Hospital for supporting this study.
Conflict of interest
The authors declare that the research was conducted in the absence of any commercial or financial relationships that could be construed as a potential conflict of interest.
Generative AI statement
The authors declare that no Generative AI was used in the creation of this manuscript.
Publisher’s note
All claims expressed in this article are solely those of the authors and do not necessarily represent those of their affiliated organizations, or those of the publisher, the editors and the reviewers. Any product that may be evaluated in this article, or claim that may be made by its manufacturer, is not guaranteed or endorsed by the publisher.
Supplementary material
The Supplementary Material for this article can be found online at: https://www.frontiersin.org/articles/10.3389/fmicb.2025.1630226/full#supplementary-material
Footnotes
References
Alenazy, H., Alghamdi, A., Pinto, R., and Daneman, N. (2021). Candida colonization as a predictor of invasive candidiasis in non-neutropenic icu patients with sepsis: A systematic review and meta-analysis. Int. J. Infect. Dis. 102, 357–362. doi: 10.1016/j.ijid.2020.10.092
Bhumitrakul, J., Lam-Ubol, A., and Matangkasombut, O. (2024). Oral Candida in post-radiotherapy patients with xerostomia/hyposalivation: A narrative review. Oral Dis. doi: 10.1111/odi.15060 [Epub ahead of print].
Bilal, H., Muhammad, S., Bing, H., Rehmat, I., Nadeem, K. M., Ullah, K. R., et al. (2022). Distribution and antifungal susceptibility pattern of Candida species from mainland China: A systematic analysis. Virulence 13, 1573–1589. doi: 10.1080/21505594.2022.2123325
Bilal, H., Zhang, D., Shafiq, M., Khan, M. N., Chen, C., Khan, S., et al. (2023). Six-Year retrospective analysis of epidemiology, risk factors, and antifungal susceptibilities of candidiasis from a tertiary care hospital in South China. Microbiol. Spect. 11:e0070823. doi: 10.1128/spectrum.00708-23
Chastain, D. B., White, B. P., Tu, P. J., Chan, S., Jackson, B. T., Kubbs, K. A., et al. (2024). Candidemia in adult patients in the ICU: A reappraisal of susceptibility testing and antifungal therapy. Ann. Pharmacotherapy 58, 305–321. doi: 10.1177/10600280231175201
Cinti, J., Gomez, P., and Agrawal, S. (2024). Community-Acquired Candida albicans empyema leading to tension physiology: A case report. Clin. Pract. Cases Emerg. Med. 8, 273–276. doi: 10.5811/cpcem.19426
CLSI (2022). Epidemiological cutoff values for antifungal susceptibility testing, 4th Edn. Wayne, PA: Clinical and Laboratory Standards Institute. CLSI supplement M57S.
CLSI (2024). Performance standards for antifungal susceptibility testing of yeasts, 2nd Edn. Wayne, PA: Clinical and Laboratory Standards Institute. CLSI Supplement, M60.
Czajka, K. M., Venkataraman, K., Brabant-Kirwan, D., Santi, S. A., Verschoor, C., Appanna, V. D., et al. (2023). Molecular mechanisms associated with antifungal resistance in pathogenic Candida species. Cells 12:2655. doi: 10.3390/cells12222655
Dai, Z., Lan, X., Cai, M., Liao, Y., Zhang, J., Ye, N., et al. (2025). Nineteen years retrospective analysis of epidemiology, antifungal resistance and a nomogram model for 30-Day mortality in nosocomial candidemia patients. Front. Cell. Infect. Microbiol. 15:1504866. doi: 10.3389/fcimb.2025.1504866
Dawoud, A. M., Saied, S. A., Torayah, M. M., Ramadan, A. E., and Elaskary, S. A. (2024). Antifungal susceptibility and virulence determinants profile of Candida species isolated from patients with candidemia. Sci. Rep. 14:11597. doi: 10.1038/s41598-024-61813-w
Debta, P., Swain, S. K., Sahu, M. C., Abuderman, A. A., Alzahrani, K. J., Banjer, H. J., et al. (2022). Evaluation of candidiasis in upper-aerodigestive squamous cell carcinoma patients—a clinico-mycological aspect. Int. J. Environ. Res. Public Health 19:8510. doi: 10.3390/ijerph19148510
ElFeky, D. S., El-Wakil, D. M., Mwafy, M. M., Atia, M. M. A., and Gohar, N. M. (2025). Comparative evaluation of antifungal susceptibility testing methods of invasive Candida species and detection of fks genes mutations in caspofungin intermediate and resistant isolates. BMC Infect. Dis. 25:114. doi: 10.1186/s12879-024-10435-8
Feng, Z., Lu, H., and Jiang, Y. (2024). Promising immunotherapeutic targets for treating candidiasis. Front. Cell. Infect. Microbiol. 14:1339501. doi: 10.3389/fcimb.2024.1339501
Fisher, M. C., Alastruey-Izquierdo, A., Berman, J., Bicanic, T., Bignell, E. M., Bowyer, P., et al. (2022). Tackling the emerging threat of antifungal resistance to human health. Nat. Rev. Microbiol. 20, 557–571. doi: 10.1038/s41579-022-00720-1
Franconi, I., Rizzato, C., Tavanti, A., Falcone, M., and Lupetti, A. (2023). Paradigm shift: Candida parapsilosis sensu stricto as the most prevalent Candida species isolated from bloodstream infections with increasing azole-non-susceptibility rates: Trends from 2015–2022 Survey. J. Fungi 9:1012. doi: 10.3390/jof9101012
Hoenigl, M., Arastehfar, A., Arendrup, M. C., Brüggemann, R., Carvalho, A., Chiller, T., et al. (2024). Novel antifungals and treatment approaches to tackle resistance and improve outcomes of invasive fungal disease. Clin. Microbiol. Rev. 37:e0007423. doi: 10.1128/cmr.00074-23
Huang, X., Dong, Q., Zhou, Q., Fang, S., Xu, Y., Long, H., et al. (2025). Genomics insights of candidiasis: Mechanisms of pathogenicity and drug resistance. Front. Microbiol. 16:1531543. doi: 10.3389/fmicb.2025.1531543
Jamiu, A. T., Albertyn, J., Sebolai, O. M., and Pohl, C. H. (2020). Update on Candida krusei, a potential multidrug-resistant pathogen. Med. Mycol. 59, 14–30. doi: 10.1093/mmy/myaa031
Jørgensen, M. R. (2024). Pathophysiological microenvironments in oral candidiasis. APMIS 132, 956–973. doi: 10.1111/apm.13412
Katsipoulaki, M., Stappers, M. H. T., Malavia-Jones, D., Brunke, S., Hube, B., and Gow, N. A. R. (2024). Candida albicans and Candida glabrata: Global priority pathogens. Microbiol. Mol. Biol. Rev. 88:e0002123. doi: 10.1128/mmbr.00021-23
Keighley, C., Cooley, L., Morris, A. J., Ritchie, D., Clark, J. E., Boan, P., et al. (2021). Consensus guidelines for the diagnosis and management of invasive Candidiasis in haematology, oncology and intensive care settings, 2021. Int. Med. J. 51, 89–117. doi: 10.1111/imj.15589
Khan, S., Cai, L., Bilal, H., Khan, M. N., Fang, W., Zhang, D., et al. (2025). An 11-Year retrospective analysis of Candidiasis epidemiology, risk factors, and antifungal susceptibility in a tertiary care hospital in China. Sci. Rep. 15:7240. doi: 10.1038/s41598-025-92100-x
Kwon, Y. J., Won, E. J., Jeong, S. H., Shin, K. S., Shin, J. H., Kim, Y. R., et al. (2021). Dynamics and predictors of mortality due to candidemia caused by different Candida species: Comparison of intensive care unit-associated candidemia (Icuac) and non-icuac. J. Fungi 7:597. doi: 10.3390/jof7080597
Lass-Flörl, C., Kanj, S. S., Govender, N. P., Thompson, G. R., Ostrosky- Zeichner, L., and Govrins, M. A. (2024). Invasive Candidiasis. Nat. Rev. Dis. Prim. 10:20. doi: 10.1038/s41572-024-00503-3
Lee, Y., Robbins, N., and Cowen, L. E. (2023). Molecular mechanisms governing antifungal drug resistance. NPJ Antimicrob. Resis. 1:5. doi: 10.1038/s44259-023-00007-2
Liu, X., Shi, F., Zeng, J., Bi, J., Mo, C., Chai, Y., et al. (2025). Oral microbiota and respiratory diseases: Advances and perspectives. Clin. Microbiol. Rev. 38:e0015024. doi: 10.1128/cmr.00150-24
Lucaciu, S.-R., Domokos, B., Puiu, R., Ruta, V., Motoc, S. N., Rajnoveanu, R., et al. (2024). Lung microbiome in lung cancer: A systematic review. Microorganisms 12:2439. doi: 10.3390/microorganisms12122439
Meneghello, S., Bernabè, G., Di Pietra, G., Di Sopra, S., Del Vecchio, C., Cattelan, A. M., et al. (2024). Prevalence, species distribution and resistance of candidemia in pediatric and adult patients in a Northeast italy university hospital. J. Fungi 10:707. doi: 10.3390/jof10100707
Nagar, T., Ramakrishna, J. M., Reddy, T., and Turk, I. (2023). Invasive pulmonary candidiasis in a patient requiring chronic total parenteral nutrition. ACG Case Rep. J. 10:e01138. doi: 10.14309/crj.0000000000001138
Ngamchokwathana, C., Chongtrakool, P., Waesamaae, A., and Chayakulkeeree, M. (2021). Risk factors and outcomes of non-albicans Candida bloodstream infection in patients with candidemia at siriraj hospital—Thailand’s largest national tertiary referral hospital. J. Fungi 7:269. doi: 10.3390/jof7040269
Nguyen, T. A., Kim, H. Y., Stocker, S., Kidd, S., Alastruey-Izquierdo, A., Dao, A., et al. (2024). Pichia kudriavzevii (Candida krusei): A systematic review to inform the world health organisation priority list of fungal pathogens. Med. Mycol. 62:myad132. doi: 10.1093/mmy/myad132
Pappas, P. G., Kauffman, C. A., Andes, D., Benjamin, D. K. Jr., Calandra, T. F., and Edwards, J. E. Jr., et al. (2009). Clinical practice guidelines for the management Candidiasis: 2009 update by the infectious diseases society of America. Clin. Infect. Dis. 48, 503–535. doi: 10.1086/596757
Pappas, P. G., Kauffman, C. A., Andes, D. R., Clancy, C. J., Marr, K. A., Ostrosky-Zeichner, L., et al. (2015). Clinical practice guideline for the management of Candidiasis: 2016 update by the infectious diseases society of America. Clin. Infect. Dis. 62, e1–e50. doi: 10.1093/cid/civ933
Pasman, R., Krom, B. P., Zaat, S. A. J., and Brul, S. (2022). The role of the oral immune system in oropharyngeal Candidiasis-facilitated invasion and dissemination of Staphylococcus aureus. Front. Oral Health 3:851786. doi: 10.3389/froh.2022.851786
Pfaller, M. A., Espinel-Ingroff, A., Canton, E., Castanheira, M., Cuenca-Estrella, M., Diekema, D. J., et al. (2012). Wild-Type mic distributions and epidemiological cutoff values for amphotericin b, flucytosine, and itraconazole and Candida spp. As determined by CLSI broth microdilution. J. Clin. Microbiol. 50, 2040–2046. doi: 10.1128/jcm.00248-12
Ricotta, E. E., Lai, Y. L., Babiker, A., Strich, J. R., Kadri, S. S., Lionakis, M. S., et al. (2020). Invasive Candidiasis species distribution and trends, United States, 2009–2017. J. Infect. Dis. 223, 1295–1302. doi: 10.1093/infdis/jiaa502
Sharifi, M., Badiee, P., Abastabar, M., Morovati, H., Haghani, I., Noorbakhsh, M., et al. (2023). A 3-Year study of Candida infections among patients with malignancy: Etiologic agents and antifungal susceptibility profile. Front. Cell. Infect. Microbiol. 13:1152552. doi: 10.3389/fcimb.2023.1152552
Shelke, A., Priya, P., Mishra, S., Chauhan, R., Murti, K., Ravichandiran, V., et al. (2024). Investigation of antimicrobial susceptibility patterns, risk factors and their impact on mortality in Cancer patients at a tertiary care Cancer hospital- a prospective study. Ann. Clin. Microbiol. Antimicrob. 23:59. doi: 10.1186/s12941-024-00703-5
Siqueira, A. C., Bernardi, G. A., Arend, L. N. V. S., Cordeiro, G. T., Rosolen, D., Berti, F. C. B., et al. (2025). Azole resistance and Erg11 mutation in clinical isolates of Candida tropicalis. J. Fungi 11:24. doi: 10.3390/jof11010024
Sun, J., Song, S., Liu, J., Chen, F., Li, X., and Wu, G. (2025). Gut microbiota as a new target for anticancer therapy: From mechanism to means of regulation. NPJ Biofilms Microb. 11:43. doi: 10.1038/s41522-025-00678-x
Ullmann, A. J., Akova, M., Herbrecht, R., Viscoli, C., Arendrup, M. C., Arikan-Akdagli, S., et al. (2012). Escmid guideline for the diagnosis and management of Candida diseases 2012: Adults with haematological malignancies and after haematopoietic stem cell transplantation (Hct). Clin. Microbiol. Infect. 18, 53–67. doi: 10.1111/1469-0691.12041
Wang, Y., Fan, X., Wang, H., Kudinha, T., Mei, Y.-N., Ni, F., et al. (2021). Continual decline in azole susceptibility rates in Candida tropicalis over a 9-Year period in China. Front. Microbiol. 12:702839. doi: 10.3389/fmicb.2021.702839
Wijaya, M., Halleyantoro, R., and Kalumpiu, J. F. (2023). Biofilm: The invisible culprit in catheter-induced Candidemia. AIMS Microbiol. 9, 467–485. doi: 10.3934/microbiol.2023025
Wolfgruber, S., Sedik, S., Klingspor, L., Tortorano, A., Gow, N. A. R., Lagrou, K., et al. (2024). Insights from three pan-european multicentre studies on invasive Candida infections and outlook to ecmm Candida IV. Mycopathologia 189:70. doi: 10.1007/s11046-024-00871-0
Yamin, D. H., Husin, A., and Harun, A. (2021). Risk factors of Candida parapsilosis catheter-related bloodstream infection. Front. Public Health 9:631865. doi: 10.3389/fpubh.2021.631865
Keywords: Candida species, cancer patients, antifungal resistance, antifungal consumption, epidemiology and risk factors
Citation: Bilal H, Li X, Wang X, Khan MN, Shafiq M, Yu J, Qiu H, Lv Q-L and Xu B (2025) Epidemiology risk factors and antifungal resistance patterns of Candida in cancer patients in Jiangxi China. Front. Microbiol. 16:1630226. doi: 10.3389/fmicb.2025.1630226
Received: 17 May 2025; Accepted: 11 July 2025;
Published: 22 July 2025.
Edited by:
Maurizio Sanguinetti, Catholic University of the Sacred Heart, ItalyReviewed by:
Maria Rapala-Kozik, Jagiellonian University, PolandAylin Döğen, Mersin University, Türkiye
Rashi Verma, Morehouse School of Medicine, United States
Copyright © 2025 Bilal, Li, Wang, Khan, Shafiq, Yu, Qiu, Lv and Xu. This is an open-access article distributed under the terms of the Creative Commons Attribution License (CC BY). The use, distribution or reproduction in other forums is permitted, provided the original author(s) and the copyright owner(s) are credited and that the original publication in this journal is cited, in accordance with accepted academic practice. No use, distribution or reproduction is permitted which does not comply with these terms.
*Correspondence: Qiao-Li Lv, bHZxaWFvbGkyMDA4QDEyNi5jb20=; Bin Xu, eHViaW4xOTY4QDEyNi5jb20=