 Jinglu Ye
 Qian Sun
 Qiaoping Wu1
 Ye Yang
- 1Department of Clinical Laboratory, The Affiliated LiHuiLi Hospital of Ningbo University, Ningbo, China
- 2State Key Laboratory for Diagnosis and Treatment of Severe Zoonostic Infectious Disease, Wuhan, China
Objective: To investigate the effects and mechanisms of common antibiotics induction on the expression of class 2 integron integrase and variable region resistance genes in bacteria, as well as potential structural mutations.
Methods: Clinical isolates containing non-functional class 2 integrons and functional class 2 integrons were selected. Strains containing non-functional class 2 integrons or functional class 2 integrons were constructed using isolated DNA templates. These strains were subjected to continuous induction with drug concentrations of 1/2 MIC and 1/4 MIC (ciprofloxacin, ampicillin, and kanamycin) and a concentration of 0.2 μg/ml (mitomycin C) over 8 days. The relative expression levels of relevant genes were measured on days 1, 3, and 8. Drug resistance in the experimental strains was assessed before and after induction to identify any differences. Finally, the sequence of the non-functional class 2 integron integrase gene was analyzed for structural changes that occurred as a result of induction.
Results: All drugs selected in this study increased the relative expression levels of recA, intI2, dfrA1, sat2, and aadA1. Significant differences in inductive abilities were observed among the drugs. The 1/2 MIC concentrations were more effective than 1/4 MIC concentrations in increasing the relative expression levels of target genes and enhancing the resistance of the experimental strains. The relative expression levels of recA, intI2, and dfrA1 rose on day 1, peaked on day 3, and slightly declined by day 8. Induced strains exhibited increased resistance to the drugs, with the most significant changes observed in the clinical isolates, particularly concerning CIP resistance. Notably, clinical isolate 7b induced with 1/2 MIC KAN exhibited the loss of one base at position 12bp in the integrase sequence. However, none of the four drugs induced mutations at the 444 bp position of class 2 integrons.
Conclusion: Sub-MIC concentrations of drugs have been shown to induce an increase in the relative expression level of the SOS response-related gene recA, as well as the integrase and resistance genes of class 2 integrons. Continuous induction leads to sustained upregulation of these genes, which stabilizes or slightly decreases upon reaching a plateau. However, the capacity of different drugs to induce expression varies significantly. Short-term antibiotic exposure did not result in critical mutations that convert class 2 integrons into functional forms.
1 Introduction
Integrons (Stokes and Hall, 1989; Akrami et al., 2019; Ghaly et al., 2022) are natural cloning and expression vectors that are common multifunctional gene capture systems in bacterial genomes that enable bacteria to generate phenotypic diversity and form adaptive responses (Partridge et al., 2018; Ahmadian et al., 2020; Ali et al., 2020; Bhat et al., 2023). This capability plays a vital role in the emergence and spread of antibiotic resistance. Class 1 integrons are most commonly seen in clinical settings, followed by class 2 integrons (Jové et al., 2017; Ahmadian et al., 2020). The majority of class 2 integrons currently isolated from clinical samples are non-functional (Jiang et al., 2023), their integrases cannot translate the complete integrase protein, rendering them unable to integrate and excise antibiotic resistance gene cassettes. Functional class 2 integrons (Márquez et al., 2008; Wei et al., 2014; Lu et al., 2022) are a unique subset characterized by a mutation in the integrase gene that replaces a stop codon (TAA), inserted after the 178th amino acid, with a codon for an active amino acid. This mutation enables the translation and synthesis of a complete integrase protein, facilitating the integration and excision of resistance gene cassettes. Functional class 2 integrons are extremely rare in clinical environments (Lu et al., 2022). Gene cassettes carried by integrons have evolved antimicrobial resistance in key clinical environments (Bhat et al., 2023). Class 2 integrons typically harbor three resistance gene cassettes: dfrA1, sat2, and aadA1 (Jové et al., 2017). The dfrA1 gene encodes dihydrofolate reductase (DHFR), which mediates resistance to trimethoprim. The sat2 gene encodes streptothricin acetyltransferase, which confers resistance by transferring an adenylyl group to the streptothricin molecule, thereby inactivating it. The aadA1 gene encodes aminoglycoside adenylyltransferase, which modifies specific sites on aminoglycoside antibiotics (such as streptomycin and spectinomycin), preventing their binding to bacterial ribosomes.
Studies on class 1 integrons have revealed that various drugs can trigger the SOS response, which collaborates with host regulatory networks to control the expression of integrases and resistance gene cassettes. This mechanism ultimately transforms integrons into a genetically stable and efficient system, endowing bacteria with a low-cost, highly adaptable evolutionary potential (Ahmadian et al., 2020; Mohanraj and Mandal, 2022). However, current research on class 2 integrons mainly focuses on their clinical distribution and the types and structures of gene cassettes in the variable region (Jové et al., 2017; Alonso et al., 2018). Reports on functional class 2 integrons are rare. The mechanisms underlying the TAA to CAA conversion in the integrase gene, the expression status and regulatory mechanisms of functional class 2 integrase, and its relationship with variable region gene cassettes remain poorly understood. Therefore, this study aims to investigate the mutation and expression regulation of class 2 integron integrase genes under the induction of common drugs. Furthermore, the research explores the role of these drugs in modulating the mutation and expression of both class 2 integron and functional class 2 integron integrase genes and examines their correlation with gene cassettes in the variable region.
2 Materials and methods
2.1 Selection of experimental strains and plasmids construction
In this study, one strain of non-functional class 2 integron-positive and functional class 2 integron-positive bacteria was selected, both clinically isolated and designated as 7b and 5b, respectively. Both strains are Proteus mirabilis and are class 1 integron-negative (Our research group had previously successfully identified 3 functional class 2 integron-positive strains and 61 non-functional class 2 integron-positive strains from clinically isolated Proteus mirabilis). This study was conducted following the principles of the Helsinki Declaration and obtained approval from the Ethics Committee of Li Huili Hospital, Ningbo City (Approval No. KY2024SL306-01). Clinical DNA from the integron-positive strains was used as a template to construct recombinant plasmids, which were subsequently transformed into Escherichia coli TOP10. The bacteria containing the recombinant plasmids were named pAC-FA1, pAC-FA3, and pAC-FA6. The strains used in this study are detailed in Table 1.
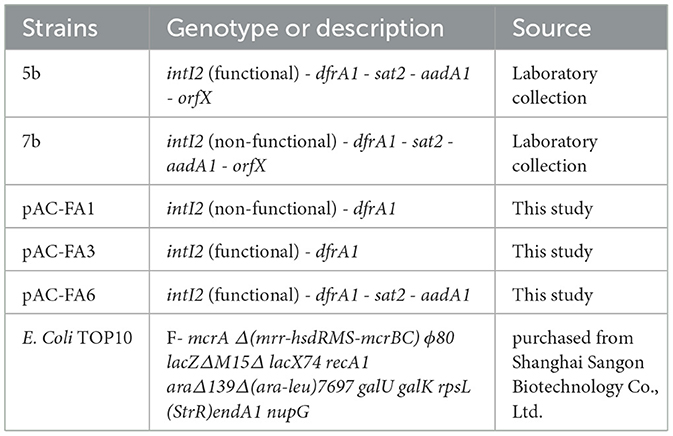
Table 1. Strains used in this study.
The construction of the strains was carried out as follows: The integron genes from clinically isolated strains 7b and 5b were used as DNA templates for the design of corresponding primers to amplify and purify target fragments. Plasmid pACYC184 was extracted and double-digested using the restriction enzymes Ase I and Hind III. The enzyme-digested products were then verified and purified through electrophoresis. According to the seamless cloning reaction system, the target gene fragments were ligated with the enzyme-digested plasmids to form recombinant plasmids, which were subsequently transformed into E. coli TOP10 competent cells. Post-transformation, the bacteria were spread onto LB plates containing chloramphenicol (25 μg/ml) and cultured overnight. Successful transformation of the plasmid into E. coli TOP10 was confirmed by the growth of the bacteria on chloramphenicol plates, as plasmid pACYC184 contains the chloramphenicol resistance gene (cat). Finally, plasmids were extracted from selected colonies for sequencing validation. The oligonucleotide primers used in this study are listed in Supplementary Table S1. Restriction enzymes Ase I and Hind III were purchased from SibEnzyme Ltd. Plasmid extraction kits and competent cells were purchased from Shanghai Sangon Biotechnology Co., Ltd.
2.2 Antibiotic sensitivity testing of experimental strains
In this study, four drugs were selected: ciprofloxacin (CIP), ampicillin (AMP), kanamycin (KAN), and mitomycin C (MMC). The minimum inhibitory concentrations (MICs) of CIP, AMP, and KAN were determined using the broth microdilution method, following the guidelines of the Clinical and Laboratory Standards Institute (CLSI) (CLSI, 2022), for subsequent antibiotic induction experiments. Antibiotic susceptibility of the experimental strains was assessed before and after drug induction using the Kirby-Bauer disk diffusion method (KB method) to compare changes in resistance. During the experiment, E. coli ATCC25922 was utilized as the quality control strain, and E. coli TOP10 served as the negative control strain. Antibiotic susceptibility discs were purchased from Oxoid Limited, and the antibiotics were purchased from Shanghai Sangon Biotechnology Co., Ltd.
2.3 Experimental strains for drug induction
The experimental strains were induced for 8 consecutive days to explore the changes in the relative expression of the target genes and antibiotic resistance. For CIP, AMP, and KAN, two concentrations, 1/2 MIC and 1/4 MIC, were utilized. The induction concentration for MMC was set at 0.2 μg/ml (Baharoglu et al., 2012). The induction process involved mixing LB liquid medium containing the specified drug concentrations with the experimental strains, followed by overnight incubation at 37 °C with shaking. The following day, a fresh LB liquid medium containing the same antibiotic concentration (5 ml) was prepared, and 50 μl of the overnight cultured bacteria were added and incubated overnight. This procedure was repeated daily for a total of 8 days of continuous culture.
2.4 Quantitative RT-PCR (RT-qPCR) detection of relative gene expression
The study aimed to explore the relative transcription levels of recA, intI2, and variable region resistance genes (dfrA1, sat2, and aadA1) in the experimental strains following drug induction. Bacterial RNA was extracted using a column-based total RNA extraction and purification kit from 1 ml of overnight bacterial culture on days 1, 3, and 8 of induction. The extracted RNA was purified and subjected to reverse transcription (RT) to obtain cDNA templates. RT-qPCR was conducted to monitor the expression levels of selected genes throughout the induction process using an ABI7500 real-time quantitative PCR instrument. A blank control was included on each plate, with double-distilled H2O replacing the template cDNA. The internal reference gene of clinically isolated strains was 16S rRNA, while for constructed strains, it was cat. All experiments were performed in triplicate (n = 3 biological replicates) to ensure reproducibility. Relative expression levels were calculated using the 2−ΔΔCt method and each reaction was performed in triplicate. The oligonucleotide primers used in this study are listed in Supplementary Table S1. The reagents used in the process were purchased from Shanghai Sangon Biotechnology Co., Ltd.
2.5 Analysis of structural changes in class 2 integron integrase
The constructed strains pAC-FA1 and clinically isolate 7b were selected for analysis both before and after induction. Primers were designed to amplify the class 2 integron integrase, and the resulting purified product was sent to Shanghai Sangon Biotech Company for sequencing. The sequencing results were analyzed using Vector NTI software to compare the integrase gene sequences of the integrons before and after induction. Additionally, potential amino acid sequences were inferred based on these gene sequences, in conjunction with changes in transcription and expression levels of the integrase and variable region genes observed before and after induction.
2.6 Statistical analysis
Data were tabulated and analyzed using Origin 2021. Statistical analysis between the experimental and control groups was performed using one-way ANOVA, followed by Tukey's multiple comparison test. A P-value of < 0.05 was considered statistically significant.
3 Results
3.1 Original MIC of experimental strains
Prior to drug induction, the MIC of the experimental strains was determined using the broth microdilution method, with ciprofloxacin (CIP), ampicillin (AMP), and kanamycin (KAN) being tested (Table 2). The constructed strains showed sensitivity to all three drugs. Clinical isolates were intermediate in response to KAN and susceptible to CIP and AMP (Supplementary Table S2).
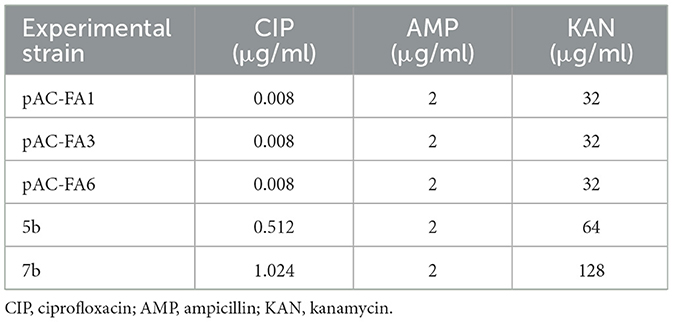
Table 2. The original MIC of the experimental strains.
3.2 Relative expression and trends of recA after induction
After 1 day of culture induced by various drugs, the relative expression of recA in the experimental strains all increased to different extents (Figure 1). The constructed strain pAC-FA6 exhibited the most significant increases, with inductions by all drugs, except 1/4 MIC of AMP, reaching 5–12 times the pre-induction levels (P < 0.05), with KAN and MMC having the strongest effects. Constructed strains pAC-FA1 and pAC-FA3, which are structurally similar, exhibited similar induction patterns. The relative expression after induction by all drugs, except MMC, was 2–5 times higher than pre-induction levels. CIP had the strongest induction effect on pAC-FA1, whereas the induction effects of the three drugs on pAC-FA3 were not significantly different. In the clinical isolates 5b and 7b, MMC exhibited the most substantial effect on recA expression, reaching 4–6 times the pre-induction level (P < 0.001). In strain 5b, 1/4 MIC treatments did not result in a significant increase in the relative expression of recA after 1 day of induction, but continuous induction led to a sustained increase in expression. Compared to 1/4 MIC drug concentrations, 1/2 MIC concentrations more effectively increased recA expression, with significant differences observed in the induction capabilities among the different drugs (Figure 2). The trend generally showed a clear increase in recA expression on Day 1, peaking on Day 3, and slightly decreasing by Day 8.
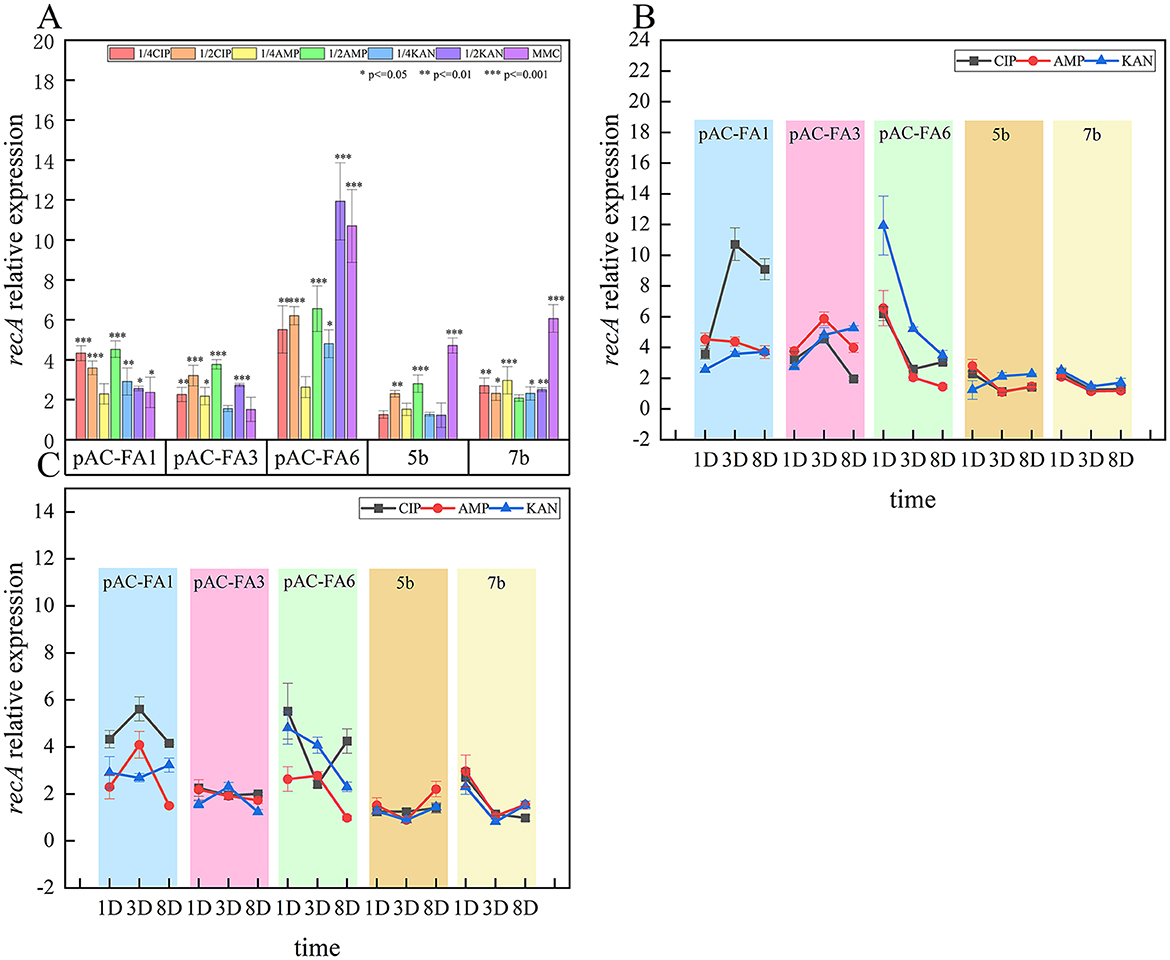
Figure 1. Relative expression and trends of recA. (A) Relative expression level of recA in experimental strains 1 day post-induction with different drugs (B) Changes in relative expression level of recA in experimental strains on the 1st, 3rd, and 8th days at a 1/2 MIC concentration (C) Changes in relative expression level of recA in experimental strains on the 1st, 3rd, and 8th days at a 1/4 MIC concentration. The vertical axis values represent the ratio of relative expression of recA in the experimental group to the control group. ***P < 0.001, **P < 0.01, *P < 0.05. The p-values and effect sizes for the line graph are listed in Supplementary Table S3.
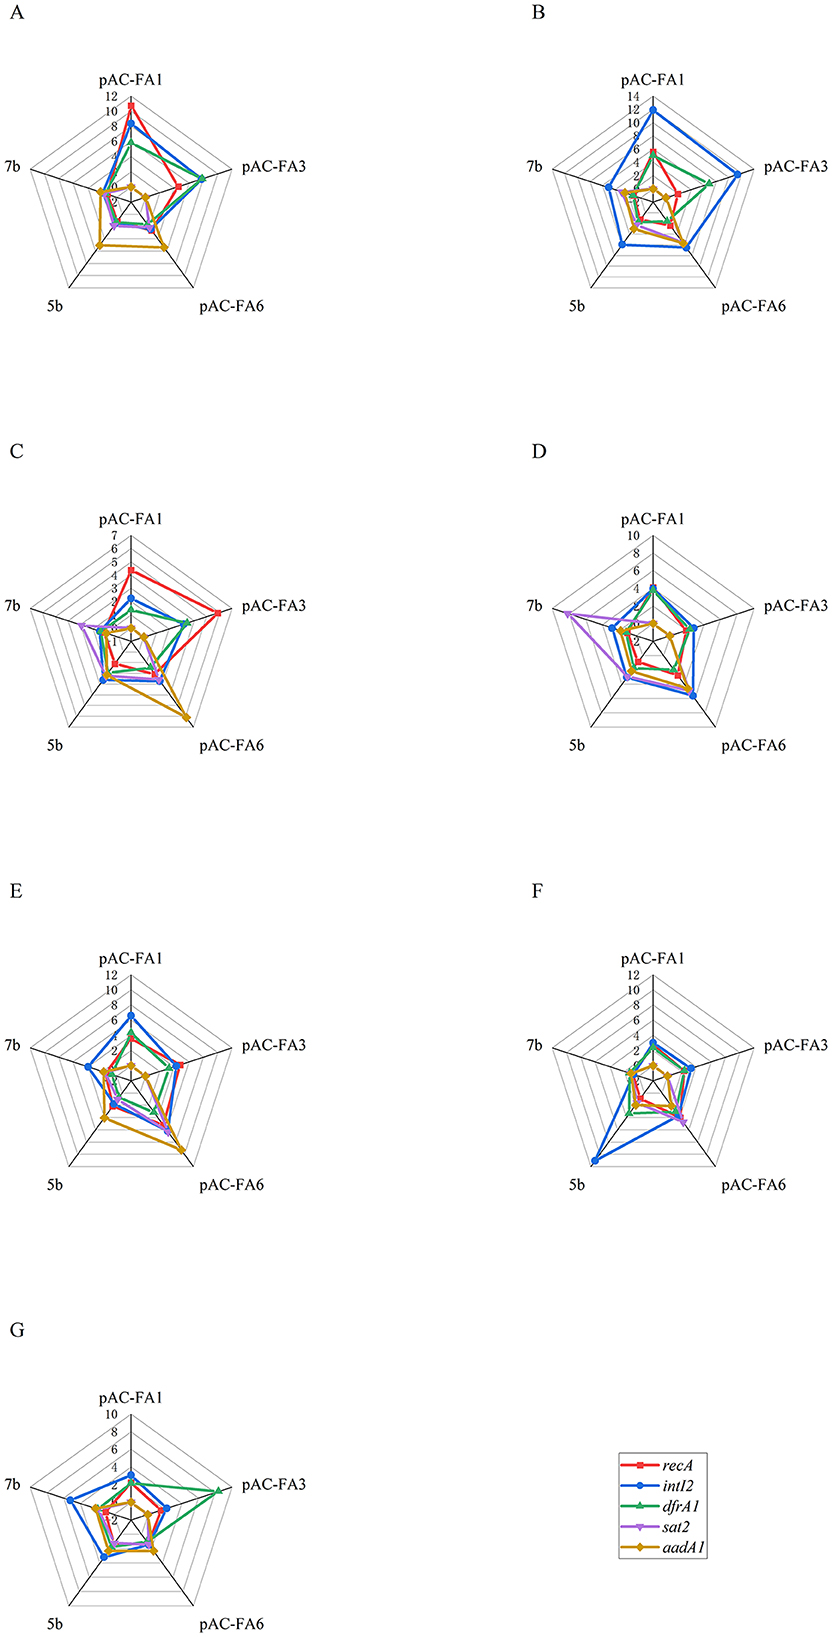
Figure 2. The relative expression of the target genes after 3 days of induction with different drugs. (A) 1/2 MIC of CIP. (B) 1/4 MIC of CIP. (C) 1/2 MIC of AMP. (D) 1/4 MIC of AMP. (E) 1/2 MIC of KAN. (F) 1/4 MIC of KAN. (G) MMC. Constructed strains pAC-FA1 and pAC-FA3 lack sat2 and aadA1 genes, which are represented as a value of 0.
3.3 Relative expression level of integrase and resistance genes
intI2 (Figure 3A): In pAC-FA1, the relative expression level of intI2 increased to 2–5 times the pre-induction level after drug-induced culture, with statistically significant differences observed (P < 0.05). In contrast, in pAC-FA3 and pAC-FA6, a statistically significant increase in intI2 expression was only noted after induction with AMP and 1/2 MIC KAN (P < 0.001). In strains 5b and 7b, MMC was the most potent inducer of intI2 expression, achieving levels more than 10 times the pre-induction levels. Furthermore, the increase in intI2 expression was more pronounced than that of the resistance genes following the same drug induction (Figure 2).
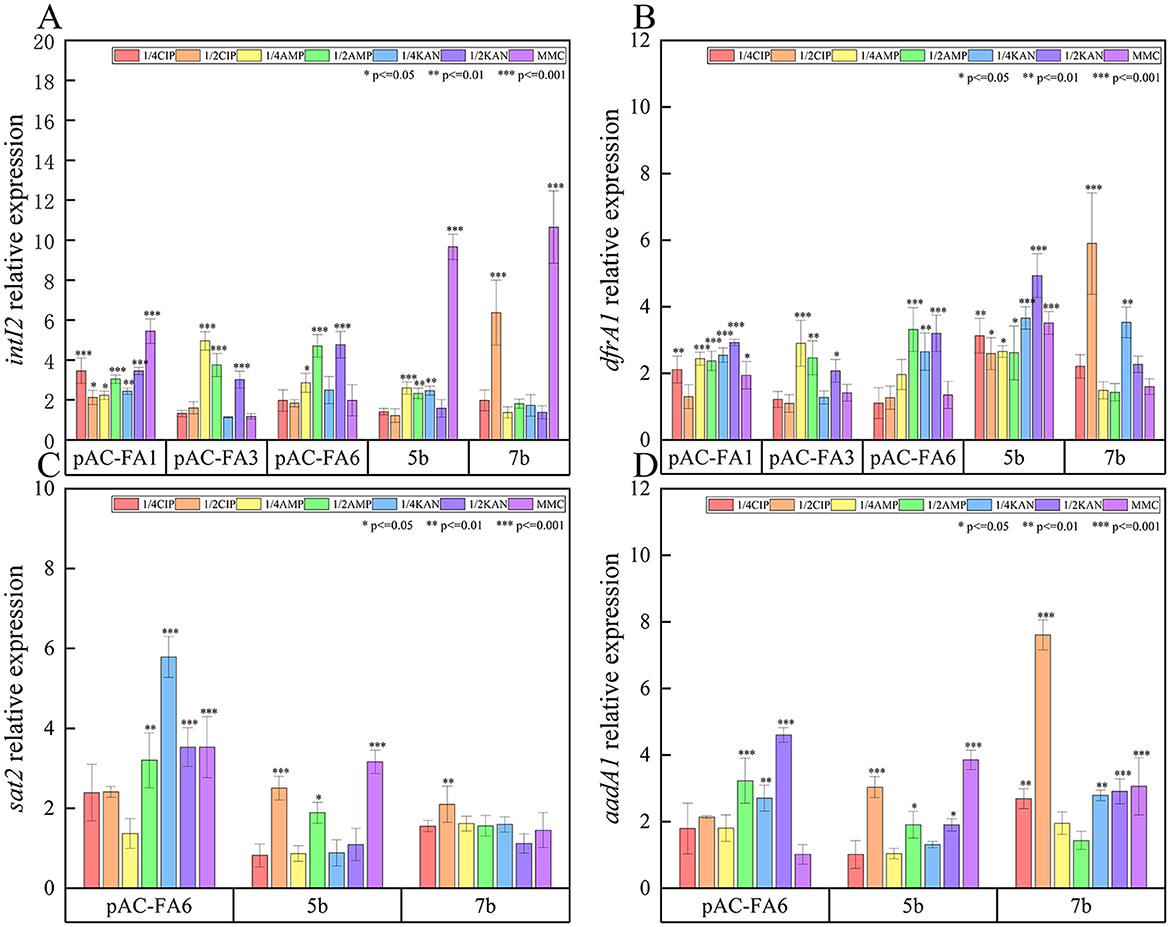
Figure 3. Relative expression of integrase (intI2) and resistance genes (dfrA1, sat2 and aadA1). (A) The relative expression level of intI2 after different drug-induced cultivation of experimental strains 1 day. (B) The relative expression level of dfrA1 after different drug-induced cultivation of experimental strains 1 day. (C) The relative expression level of sat2 after different drug-induced cultivation of experimental strains 1 day. (D) The relative expression level of aadA1 after different drug-induced cultivation of experimental strains 1 day. The vertical axis values represent the ratio of relative expression of target genes in the experimental group to the control group. ***P < 0.001, **P < 0.01, *P < 0.05.
dfrA1 (Figure 3B): In the constructed strains, the pattern of relative expression changes in dfrA1 after induction with various drugs mirrored that of intI2. In strain 5b, all drugs significantly induced an increase in dfrA1 expression, reaching levels 2-5 times higher than those before induction (P < 0.05). In strain 7b, only 1/2 MIC of CIP and 1/4 MIC of KAN led to significant increases in dfrA1 expression, while other conditions did not result in notable changes.
sat2 (Figure 3C): In pAC-FA6, the relative expression level of sat2 increased to 2–6 times the pre-induction level following induction by all drugs except for 1/4 MIC of AMP, with KAN having the most pronounced effect. In strain 5b, the relative expression level of sat2 increased to 2–3 times the pre-induction level only after induction with 1/2 MIC concentrations of CIP, AMP, and MMC, with statistically significant differences (P < 0.05). In strain 7b, the increase in the relative expression level of sat2 was not substantial.
aadA1 (Figure 3D): In pAC-FA6, KAN, and AMP at 1/4 MIC led to a significant 3–5 fold increase in aadA1 expression compared to pre-induction levels (P < 0.01). In strain 5b, MMC, along with 1/2 MIC concentrations of CIP, AMP, and KAN, caused a substantial rise in aadA1 expression (P < 0.05). In strain 7b, induction with all agents except AMP led to a significant increase in aadA1 expression, with CIP at 1/2 MIC inducing more than a 7-fold increase post-induction (P < 0.01).
3.4 Trends in changes of integrase and resistance genes
intI2 (Figures 4A, B): In the constructed strains, drug-induced intI2 expression generally increased initially, peaked on day 3, and then declined. In most instances, CIP demonstrated the strongest induction. For clinical isolates, CIP was the most potent inducer at 1/2 MIC, while KAN was most effective at 1/4 MIC.
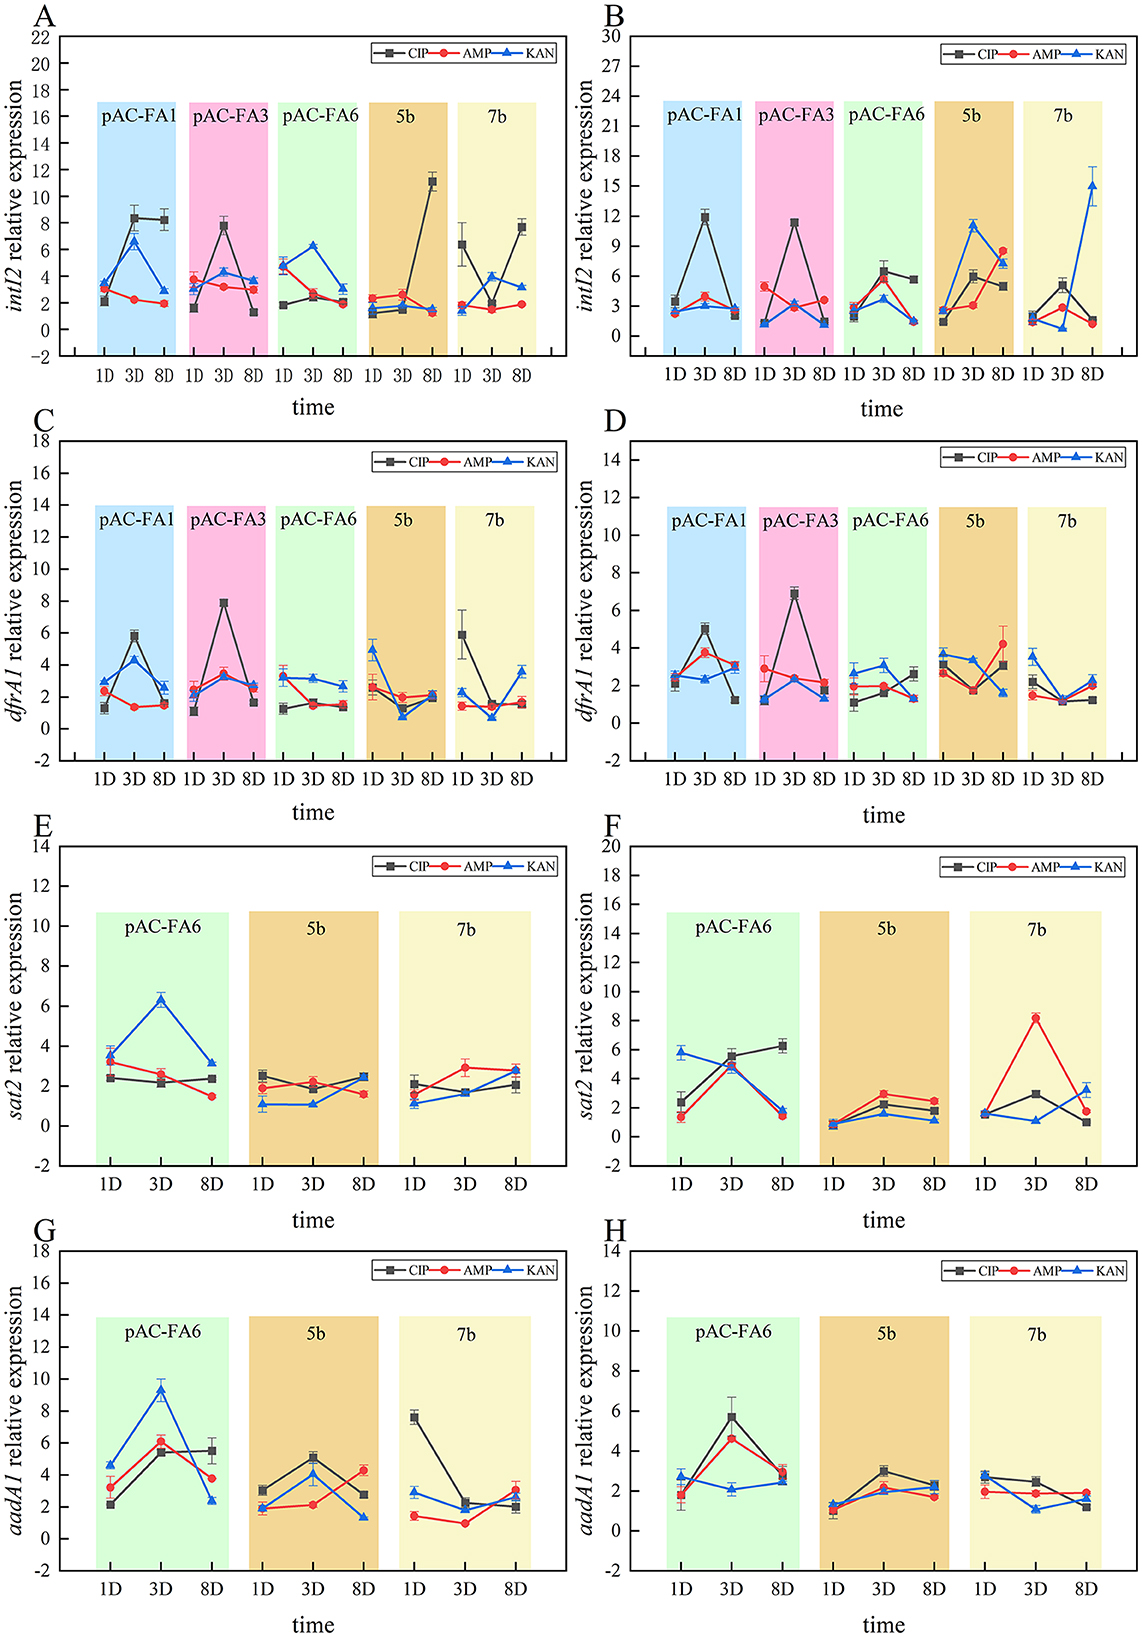
Figure 4. Trends in changes of integrase (intI2) and resistance genes (dfrA1, sat2 and aadA1). (A, C, E, G) illustrate the changes in relative expression levels of the intI2, dfrA1, sat2, and aadA1 genes, respectively, in the experimental strain under a 1/2 MIC concentration on days 1, 3, and 8. (B, D, F, H) show the changes in relative expression levels of the intI2, dfrA1, sat2, and aadA1 genes, respectively, under a 1/4 MIC concentration on the same days. The vertical axis values represent the ratio of the relative expression of the target genes in the experimental group to the control group. The p-values and effect sizes are listed in Supplementary Table S3.
dfrA1 (Figures 4C, D): In constructed strains, dfrA1 expression followed a similar pattern, with an initial increase, peaking on day 3, and then decreasing. In strains 5b and 7b, the most pronounced increase in relative expression occurred on day 1, with the induction effects of all three drugs being relatively similar.
sat2 (Figures 4E, F): Changes in the relative expression of sat2 following drug induction were not significant. In pAC-FA6, at a 1/2 MIC concentration, KAN demonstrated stronger induction than CIP and AMP, whereas, at a 1/4 MIC concentration, the induction effects of the three drugs were more similar. In strains 5b and 7b, the induction effects of the three drugs were relatively comparable.
aadA1 (Figures 4G, H): In pAC-FA6, aadA1 expression showed the most significant changes following KAN induction at 1/2 MIC, peaking on day 3. At 1/4 MIC, there was no significant difference in the effects of the three drugs, but all showed a marked increase on day 3. In clinical isolates, no significant increase in aadA1 expression was observed, except for strain 7b induced by CIP at 1/2 MIC, and no consistent trend in changes was noted.
3.5 Changes in antibiotic resistance after induction with different drugs
In pAC-FA1, induction with CIP, AMP, and MMC resulted in a shift from sensitivity to resistance to AMP, while changes to other drugs were not significant. KAN induction caused pAC-FA1 to become resistant to certain aminoglycosides. In pAC-FA3 and pAC-FA6, the trends before and after induction were similar to those observed in pAC-FA1. In strains 5b and 7b, CIP induction led to a transition from sensitivity to resistance to CIP, especially at a 1/2 MIC concentration, where the effect was more pronounced. When induced with 1/2 MIC of AMP, strains 5b and 7b shifted from sensitivity to intermediate resistance to AMP, whereas induction with 1/4 MIC did not alter AMP resistance. After KAN induction, 5b and 7b transitioned from intermediate to resistant to some aminoglycosides (Figure 5).
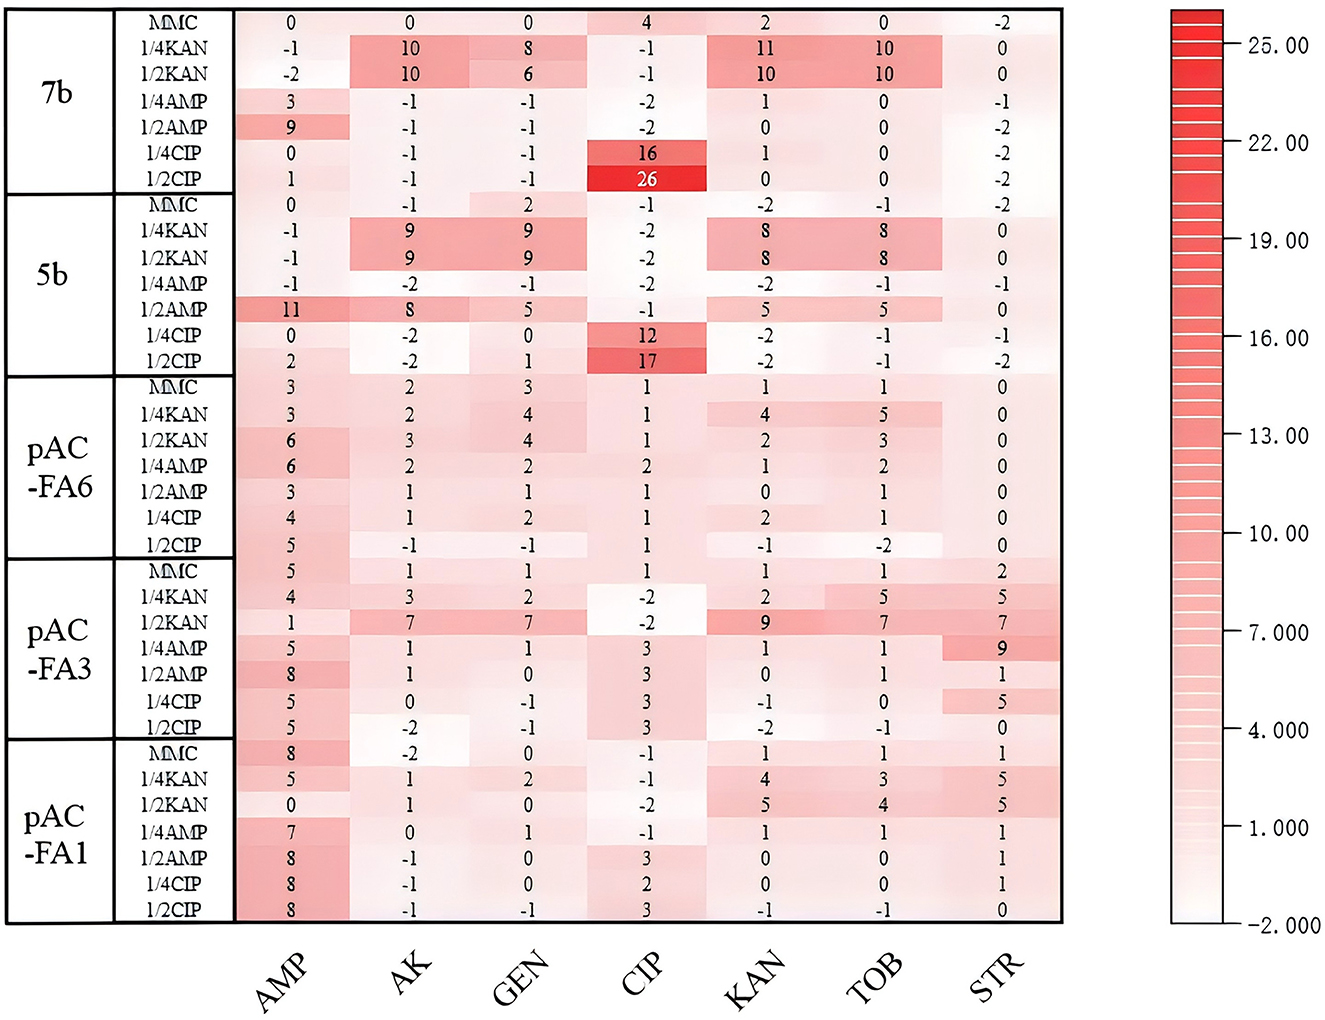
Figure 5. Changes in inhibition zones of experimental strains. The values in the figure represent the differences in inhibition zone sizes of the experimental strains before and after 8 days of drug induction. The vertical axis denotes the experimental strains and the inducing drugs, while the horizontal axis indicates the drugs measured.
3.6 Structural changes in integrase after induction with different drugs
Alignment of integrase sequences in 7b, conducted before and after drug induction, revealed a missing base at position 12 bp in the integrase sequence following KAN induction at 1/2 MIC. During this induction experiment, no mutations were detected at position 444 bp of the integrase gene in either pAC-FA1 or 7b (Figure 6).
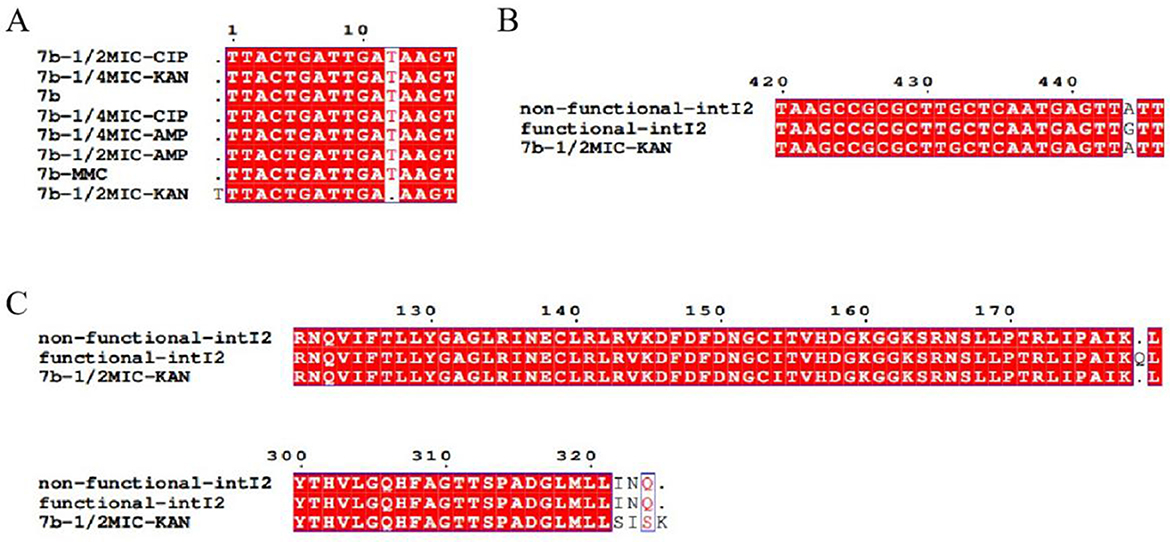
Figure 6. Sequencing results of integrase. (A) Post-induction with 1/2 MIC of KAN, the integrase of strain 7b exhibits a deletion of one base compared to its pre-induction sequence. (B) A mutation from A to G is observed at the 444 bp position in the sequence of the functional class 2 integrase. (C) Differences in the translated amino acid sequences of 7b and functional class 2 integrons before and after induction with 1/2 MIC of KAN.
4 Discussion
Bacteria develop resistance under the pressure of antibiotics. The emergence and widespread clinical dissemination of resistant strains have become a significant challenge to public health (Wistrand-Yuen et al., 2018). Class 2 integrons typically harbor three resistance gene cassettes: dfrA1, sat2, and aadA1, which confer resistance to trimethoprim, streptothricin, and aminoglycosides, respectively (Jové et al., 2017). The intI2 integrase of non-functional class 2 integrons contains a stop codon, TAA, inserted after the 178th amino acid, rendering this class of integrases incapable of integrating and excising resistance gene cassettes, resulting in a truncated integrase protein. In contrast, functional class 2 integrons possess a stop codon mutation from TAA to CAA in the integrase gene, enabling the production of an active integrase, which facilitates the acquisition or rearrangement of gene cassettes.
Bacteria exposed to antibiotics can induce the SOS response (Sheng et al., 2021; Van Alstine and Sandler, 2022), which serves to maintain genomic integrity and enhance survival chances (Blázquez et al., 2018). Numerous studies on class 1 integrons have shown that fluoroquinolones, trimethoprim, and β-lactams can trigger the SOS response, activating horizontal gene transfer elements, including integrons (Ahmadian et al., 2020), thereby facilitating the spread of antibiotic resistance genes (Phillips et al., 1987; Goerke et al., 2006; Maiques et al., 2006; Mohanraj and Mandal, 2022). Drug concentrations below the minimum inhibitory concentration (MIC) are referred to as sub-inhibitory concentrations (sub-MIC) (Davies et al., 2006; Gu et al., 2020). The widespread clinical use of antibiotics (Patel et al., 2019; Singh and Bhunia, 2019; Polianciuc et al., 2020) as well as their improper use in agriculture and animal husbandry (Shen et al., 2008; Liu et al., 2023), results in low-level antibiotic exposures (sub-MIC) that are insufficient to kill bacteria but can induce changes in gene expression, leading to phenotypic changes (Sato et al., 2018; Davarzani et al., 2021) and increased mutation rates (Drlica, 2003; Drlica and Zhao, 2007; Gullberg et al., 2011; Barrett et al., 2019), thereby enhancing the potential for adaptive genetic variations. Studies have indicated that sub-MIC levels of antimicrobial agents may be more significant in contributing to bacterial resistance than lethal concentrations (Andersson and Hughes, 2012; Hughes and Andersson, 2012; Laureti et al., 2013). Class 2 integrons, as key mobile elements carrying resistance gene cassettes, are critically linked to the dissemination of resistance genes. This study systematically explores the dynamic relationship between SOS stress response, integron expression, and resistance phenotypes by inducing constructed strains (pAC-FA1, pAC-FA3, pAC-FA6) and clinical isolates (5b, 7b) with functional or non-functional class 2 integrons using two sub-MIC concentrations of antibiotics and mutagens (AMP, CIP, KAN, MMC). The findings provide experimental evidence for understanding the mechanisms of resistance evolution under low-level antibiotic exposure in vitro.
The SOS response plays a critical role in protecting bacterial communities from extreme environmental conditions, mediating survival and adaptation to genotoxic stress (Miura et al., 2020; Niccum et al., 2020), and contributing to the development of antibiotic resistance (Maslowska et al., 2019; Podlesek and Žgur Bertok, 2020; Xu et al., 2024). This response is a widespread regulatory network controlled by various regulatory proteins and enzymes and is highly conserved across different pathogens. Among these, RecA and LexA are essential proteins required universally for DNA damage-mediated SOS repair in bacteria. Even under non-inducing conditions, RecA is expressed at basal levels, but in induced cells, RecA rapidly binds to ssDNA and facilitates the degradation of LexA, ensuring a swift and effective SOS response (Ghodke et al., 2019). The expression level of recA is a key indicator of SOS response activation. In this study, the SOS response was monitored by measuring the relative expression levels of recA using real-time quantitative PCR. Our experiments revealed that the relative expression of recA in experimental strains increased to varying degrees following induction with various drugs, exhibiting both concentration and time dependency. Drug concentrations at 1/2 MIC were more effective in elevating recA expression than 1/4 MIC concentrations. Comparing days 1, 3, and 8 of induction showed that recA expression significantly increased after just 1 day, peaked on the third day, and slightly decreased by the eighth day. This dynamic change suggests that bacteria can quickly mobilize related genes to trigger the SOS response when faced with adverse conditions, aiding in their survival until they adapt to the stressor. There were notable differences in how different strains responded to the drugs: after CIP induction, pAC-FA1 exhibited the greatest increase in recA expression. In pAC-FA3, the effects of the drugs were relatively similar, while in pAC-FA6, KAN had the most notable effect. In strains 5b and 7b, MMC showed the strongest induction effect. These findings demonstrate that all four antibiotics tested in this experiment can enhance recA expression, thereby triggering the bacterial SOS response to combat adverse conditions. However, the tolerance of each strain to different drugs varies, and even at the same concentration, different levels of SOS response may be triggered to counteract these stressors. Additionally, although the relative expression of recA was highest in pAC-FA6, the change in resistance after 8 days of continuous antibiotic induction was not the most significant. The high heterogeneity within bacterial populations (Orman and Brynildsen, 2013), coupled with potential indirect feedback inhibition and differences in regulatory proteins due to different antibiotic mechanisms (Schaenzer and Wright, 2020; Wilson et al., 2020; Huang et al., 2022; Baranova et al., 2023), may collectively contribute to a non-linear relationship between recA levels and resistance changes, underscoring the need for further research in this area. Under identical induction conditions, differences in the relative expression levels of recA were observed between the constructed strains and clinical isolates, with the constructed strains showing a more pronounced increase. The survival mechanisms of cellular stress responses are closely linked to bacterial metabolism (Recacha et al., 2024). We hypothesize that E. coli TOP10, being a genetically engineered strain, has well-developed regulatory systems such as cAMP-CRP (Heyde et al., 2021) and LexA (Cory et al., 2024). Engineered expression vectors often contain strong promoters and terminators, and the strain's faster growth rate can support the higher energy demands of foreign protein expression. In contrast, the natural genome of Proteus mirabilis may have target genes regulated by upstream inhibitory elements, leading to slower growth and a greater allocation of energy to basic metabolism rather than foreign gene expression.
After drug induction, the relative expression levels of class 2 integron integrase and resistance genes in the variable region of experimental strains increased to varying degrees. In the constructed strains pAC-FA1 and pAC-FA3, CIP exhibited the strongest induction effect compared to AMP and KAN, generally showing an initial increase with a peak on day 3, followed by a decline. In pAC-FA6, the induction effects of all four drugs were relatively similar, although KAN specifically led to a noticeable rise in the expression levels of sat2 and aadA1. In clinical isolates, 5b and 7b, MMC strongly induced expression of the class 2 integron integrase gene, whereas the other three drugs did not demonstrate significant differences in their effects. It can be observed that non-functional intI2, although unable to modify its gene cassettes array, can still effectively express the gene cassettes (Jové et al., 2017). The expression of integrases must be regulated, “turning on” and “off” as required to obtain the functional diversity encoded by gene cassettes. From an evolutionary perspective, the ability of intI2 to upregulate transcription in strains with non-functional integrases may serve as a stress reserve (Escudero et al., 2015). Moreover, even among constructed strains, the same drug can exert substantially different effects. It is hypothesized that the presence of non-functional class 2 integrons, functional class 2 integrons, and even the number of resistance genes linked to class 2 integrons might influence the adaptive capabilities of bacteria, leading to variations in growth rates and drug sensitivities. As independent clinical isolates, 5b and 7b exhibit inherent genomic differences beyond the presence of class 2 integrons. The genetic heterogeneity of clinical strains may also lead to differential responses in stress regulatory networks, such as the SOS response system, to the same antibiotic concentration, resulting in inconsistent upregulation trends of resistance genes between the two strains. Further experiments are needed to confirm these hypotheses.
Integrons facilitate the rapid dissemination of bacterial resistance by capturing and expressing resistance gene cassettes, and their activity is regulated by environmental stress. This study found that, following drug-induced culture, the relative expression levels of class 2 integron integrase and resistance genes in the variable region of experimental strains increased to varying degrees, aligning with the expression trend of recA (Figures 2–4). This suggests a potential association between the expression of class 2 integrons and the SOS response. Research on class 1 integrons has identified a potential LexA binding site on the intI1 promoter, suggesting that the SOS response can specifically and directly induce the expression of class 1 integrase (Guérin et al., 2010). In class 2 integrons, a potential LexA binding site overlaps with the PintI2 promoter; however, subsequent experiments have shown that the LexA protein does not bind to this region. The antibiotic-induced SOS response could activate other LexA binding sites within the bacterial genome, such as promoters of DNA repair genes, thereby indirectly promoting the expression of intI2 and resistance genes through shared regulatory networks like RecA-mediated transcription factor activation. The expression of integrons is closely linked to bacterial physiology and environmental conditions, adapting as needed. Additionally, class 2 integrons might possess alternative stress-sensing mechanisms, potentially regulating expression by responding to other stress signaling pathways like oxidative stress or membrane damage response. This hypothesis requires validation through future transcriptomic or protein interaction studies (Erill et al., 2007).
The inhibition zone assay demonstrated that sub-MIC concentrations of antibiotics can significantly alter bacterial resistance phenotypes (Figure 5). After AMP induction, the sensitivity of constructed strains pAC-FA1 and pAC-FA3 to AMP decreased markedly, shifting from sensitive to resistant/intermediate. Clinical isolates 5b and 7b exhibited significantly enhanced resistance to CIP, with a reduction in the inhibition zone size. This finding supports the conclusion that low-level antibiotic exposure can drive resistance evolution (Barrett et al., 2019; Anderson et al., 2023). The induction effect at 1/2 MIC concentration was stronger than at 1/4 MIC, suggesting that higher sub-MIC concentrations exert greater selective pressure on resistance genes, thereby more readily promoting the emergence of resistant phenotypes. The differences in resistance between clinical and constructed strains are also noteworthy. Clinical isolates rapidly acquired resistance to the corresponding drugs after induction (especially with CIP), while the phenotypic changes in constructed strains were more limited. This may be attributed to the accumulation of gene elements, such as multiple mobile genetic elements, in clinical strains through long-term natural evolution, allowing for more efficient mobilization of resistance genes in response to stress. In contrast, constructed strains, with simpler genomes like that of E. coli TOP10, carrying only a single integron element, have limited adaptive evolutionary capacity. Additionally, some strains exhibited increased resistance to unrelated antibiotics after induction with a specific drug, corroborating the idea that antibiotics can promote multidrug resistance through “cross-selection” (Blázquez et al., 2018).
Sequencing of the class 2 integrase genes before and after induction did not reveal mutations in the stop codon TAA, which is inserted after the 178th amino acid in the integrase gene. The evolutionary capacity of bacteria depends not only on the rate at which genetic diversity is generated but also on the population size (Blázquez et al., 2018). In clinical and environmental settings, bacteria are often continuously exposed to multiple antibiotics, with pressure intensity dynamically changing over time. This “chronic mixed pressure” can accelerate the accumulation of adaptive mutations (Good et al., 2017; Lenski, 2017). Short-term antibiotic exposure may not lead to mutations at critical sites of class 2 integrons. Additionally, it is possible that any induced mutations are of low frequency and were not detected by the methods employed in this study. Occasionally, tester strains exhibited a base deletion downstream of the stop codon; however, due to the presence of the stop codon, their integrase gene would not have translated an intact integrase protein, rendering the mutation apparently ineffective on the integrase function. Further investigation is required to elucidate the mutation mechanisms of functional class 2 integrons.
5 Conclusion
Sub-MIC concentrations of drugs have been shown to induce an increase in the relative expression of recA, associated with the bacterial SOS response. This induction also elevates the expression levels of class 2 integron integrase and resistance genes. Continuous induction results in a sustained upregulation of these genes, which stabilizes or slightly decreases upon reaching a plateau, ultimately driving the evolution of clinical-level resistance in different antibiotic classes with various cellular targets. Moreover, higher sub-MIC levels more effectively trigger bacterial responses to adverse environments, enhancing population survival. The induction capacities of different drugs vary significantly, and the underlying mechanisms require further investigation. Short-term exposure to a single antibiotic did not result in critical mutations that would transform class 2 integrons into a functional form. The widespread use of antimicrobial agents in clinical settings, agriculture, and livestock inevitably leads to low-level antibiotic exposure, providing sufficient evolutionary pressure for bacterial resistance. It is imperative to develop effective, targeted strategies to address this challenge.
Data availability statement
All key information data generated or analyzed during this study are included in this article/Supplementary material.
Author contributions
JY: Investigation, Writing – original draft, Methodology, Formal analysis, Data curation. QS: Data curation, Writing – original draft, Methodology, Formal analysis, Investigation. QW: Methodology, Data curation, Writing – original draft. JX: Investigation, Resources, Writing – original draft. YY: Writing – original draft, Investigation, Supervision. RZ: Writing – original draft, Data curation, Investigation. QL: Methodology, Writing – review & editing, Funding acquisition, Supervision.
Funding
The author(s) declare that financial support was received for the research and/or publication of this article. This study was supported by the research grants from Medical and Health Research Project of Zhejiang Province (Grant Nos. 2024KY288, 2025KY208, and 2025KY1303), Traditional Chinese Medical Research Project of Zhejiang Province (Grant No. 2024ZL940), Natural Science Foundation of Zhejiang Province (Grant No. LKLY25H200007), Ningbo Major Research and Development Plan Project (Grant No.2024Z215), and was partly supported Ningbo Health Science and Technology plan project (Grant No. 2022Y03), State Key Laboratory for Diagnosis and Treatment of Severe Zoonotic Infectious Diseases (Grant No. 2024KF10012).
Acknowledgments
Thanks to all my colleagues in the laboratory. And thanks to the laboratory of State Key Laboratory for Diagnosis and Treatment of Severe Zoonostic Infectious Disease. Thanks to Home for Researchers editorial team (www.home-for-researchers.com) for language editing service.
Conflict of interest
The authors declare that the research was conducted in the absence of any commercial or financial relationships that could be construed as a potential conflict of interest.
Generative AI statement
The author(s) declare that no Gen AI was used in the creation of this manuscript.
Any alternative text (alt text) provided alongside figures in this article has been generated by Frontiers with the support of artificial intelligence and reasonable efforts have been made to ensure accuracy, including review by the authors wherever possible. If you identify any issues, please contact us.
Publisher's note
All claims expressed in this article are solely those of the authors and do not necessarily represent those of their affiliated organizations, or those of the publisher, the editors and the reviewers. Any product that may be evaluated in this article, or claim that may be made by its manufacturer, is not guaranteed or endorsed by the publisher.
Supplementary material
The Supplementary Material for this article can be found online at: https://www.frontiersin.org/articles/10.3389/fmicb.2025.1632813/full#supplementary-material
References
Ahmadian, L., Haghshenas, M. R., Mirzaei, B., Norouzi Bazgir, Z., and Goli, H. R. (2020). Distribution and molecular characterization of resistance gene cassettes containing class 1 integrons in multi-drug resistant (MDR) clinical isolates of Pseudomonas aeruginosa. Infect. Drug Resist. 13, 2773–2781. doi: 10.2147/IDR.S263759
Akrami, F., Rajabnia, M., and Pournajaf, A. (2019). Resistance integrons; a mini review. Caspian J. Intern. Med. 10, 370–376. doi: 10.22088/cjim.10.4.370
Ali, N., Lin, Y., Qing, Z., Xiao, D., Ud Din, A., Ali, I., et al. (2020). The role of agriculture in the dissemination of class 1 integrons, antimicrobial resistance, and diversity of their gene cassettes in Southern China. Genes 11:1014. doi: 10.3390/genes11091014
Alonso, C. A., Cortés-Cortés, G., Maamar, E., Massó, M., Rocha-Gracia, R. D. C., Torres, C., et al. (2018). Molecular diversity and conjugal transferability of class 2 integrons among Escherichia coli isolates from food, animal and human sources. Int. J. Antimicrob. Agents 51, 905–911. doi: 10.1016/j.ijantimicag.2018.02.001
Anderson, J. R., Lam, N. B., Jackson, J. L., Dorenkott, S. M., Ticer, T., Maldosevic, E., et al. (2023). Progressive sub-MIC exposure of Klebsiella pneumoniae 43816 to cephalothin induces the evolution of beta-lactam resistance without acquisition of beta-lactamase genes. Antibiotics 12:887. doi: 10.3390/antibiotics12050887
Andersson, D. I., and Hughes, D. (2012). Evolution of antibiotic resistance at non-lethal drug concentrations. Drug Resist. Updat. 15, 162–172. doi: 10.1016/j.drup.2012.03.005
Baharoglu, Z., Krin, E., and Mazel, D. (2012). Connecting environment and genome plasticity in the characterization of transformation-induced SOS regulation and carbon catabolite control of the Vibrio cholerae integron integrase. J. Bacteriol. 194, 1659–1667. doi: 10.1128/JB.05982-11
Baranova, A. A., Tyurin, A. P., Korshun, V. A., and Alferova, V. A. (2023). Sensing of antibiotic-bacteria interactions. Antibiotics 12:1340. doi: 10.3390/antibiotics12081340
Barrett, T. C., Mok, W. W. K., Murawski, A. M., and Brynildsen, M. P. (2019). Enhanced antibiotic resistance development from fluoroquinolone persisters after a single exposure to antibiotic. Nat. Commun. 10:1177. doi: 10.1038/s41467-019-09058-4
Bhat, B. A., Mir, R. A., Qadri, H., Dhiman, R., Almilaibary, A., Alkhanani, M., et al. (2023). Integrons in the development of antimicrobial resistance: critical review and perspectives. Front. Microbiol. 14:1231938. doi: 10.3389/fmicb.2023.1231938
Blázquez, J., Rodríguez-Beltrán, J., and Matic, I. (2018). Antibiotic-induced genetic variation: how it arises and how it can be prevented. Annu. Rev. Microbiol. 72, 209–230. doi: 10.1146/annurev-micro-090817-062139
CLSI (2022). Performance Standards for Antimicrobial Susceptibility Testing. 32th Edn. CLSIsupplement M100. Wayne, PA: Clinical and Laboratory Standards Institute.
Cory, M. B., Li, A., Hurley, C. M., Carman, P. J., Pumroy, R. A., Hostetler, Z. M., et al. (2024). The LexA-RecA* structure reveals a cryptic lock-and-key mechanism for SOS activation. Nat. Struct. Mol. Biol. 31, 1522–1531. doi: 10.1038/s41594-024-01317-3
Davarzani, F., Yousefpour, Z., Saidi, N., and Owlia, P. (2021). Different effects of sub-minimum inhibitory concentrations of gentamicin on the expression of genes involved in alginate production and biofilm formation of Pseudomonas aeruginosa. Iran. J. Microbiol. 13, 808–816. doi: 10.18502/ijm.v13i6.8085
Davies, J., Spiegelman, G. B., and Yim, G. (2006). The world of subinhibitory antibiotic concentrations. Curr. Opin. Microbiol. 9, 445–453. doi: 10.1016/j.mib.2006.08.006
Drlica, K. (2003). The mutant selection window and antimicrobial resistance. J. Antimicrob. Chemother. 52, 11–17. doi: 10.1093/jac/dkg269
Drlica, K., and Zhao, X. (2007). Mutant selection window hypothesis updated. Clin. Infect. Dis. 44, 681–688. doi: 10.1086/511642
Erill, I., Campoy, S., and Barbé, J. (2007). Aeons of distress: an evolutionary perspective on the bacterial SOS response. FEMS Microbiol. Rev. 31, 637–656. doi: 10.1111/j.1574-6976.2007.00082.x
Escudero, J. A., Loot, C., Nivina, A., and Mazel, D. (2015). The integron: adaptation on demand. Microbiol. Spectr. 3:Mdna3-0019-2014. doi: 10.1128/microbiolspec.MDNA3-0019-2014
Ghaly, T. M., Penesyan, A., Pritchard, A., Qi, Q., Rajabal, V., Tetu, S. G., et al. (2022). Methods for the targeted sequencing and analysis of integrons and their gene cassettes from complex microbial communities. Microb. Genom. 8:000788. doi: 10.1099/mgen.0.000788
Ghodke, H., Paudel, B. P., Lewis, J. S., Jergic, S., Gopal, K., Romero, Z. J., et al. (2019). Spatial and temporal organization of RecA in the Escherichia coli DNA-damage response. Elife 8:e42761. doi: 10.7554/eLife.42761.026
Goerke, C., Köller, J., and Wolz, C. (2006). Ciprofloxacin and trimethoprim cause phage induction and virulence modulation in Staphylococcus aureus. Antimicrob. Agents Chemother. 50, 171–177. doi: 10.1128/AAC.50.1.171-177.2006
Good, B. H., McDonald, M. J., Barrick, J. E., Lenski, R. E., and Desai, M. M. (2017). The dynamics of molecular evolution over 60,000 generations. Nature 551, 45–50. doi: 10.1038/nature24287
Gu, Y., Wang, S., Huang, L., Sa, W., Li, J., Huang, J., et al. (2020). Development of resistance in Escherichia coli ATCC25922 under exposure of sub-inhibitory concentration of olaquindox. Antibiotics 9:791. doi: 10.3390/antibiotics9110791
Guérin, E., Cambray, G., Da Re, S., Mazel, D., and Ploy, M. C. (2010). [The SOS response controls antibiotic resistance by regulating the integrase of integrons]. Med. Sci. 26, 28–30. doi: 10.1051/medsci/201026128
Gullberg, E., Cao, S., Berg, O. G., Ilbäck, C., Sandegren, L., Hughes, D., et al. (2011). Selection of resistant bacteria at very low antibiotic concentrations. PLoS Pathog. 7:e1002158. doi: 10.1371/journal.ppat.1002158
Heyde, S. A. H., Frendorf, P. O., Lauritsen, I., and Nørholm, M. H. H. (2021). Restoring global gene regulation through experimental evolution uncovers a NAP (nucleoid-associated protein)-like behavior of Crp/Cap. MBio 12:e0202821. doi: 10.1128/mBio.02028-21
Huang, L., Wu, C., Gao, H., Xu, C., Dai, M., Huang, L., et al. (2022). Bacterial multidrug efflux pumps at the frontline of antimicrobial resistance: an overview. Antibiotics 11:520. doi: 10.3390/antibiotics11040520
Hughes, D., and Andersson, D. I. (2012). Selection of resistance at lethal and non-lethal antibiotic concentrations. Curr. Opin. Microbiol. 15, 555–560. doi: 10.1016/j.mib.2012.07.005
Jiang, H., Jiao, X., Yu, T., Wang, W., Cheng, H., Huang, G., et al. (2023). Contribution of different class 2 integron elements to fitness costs in multi-drug resistant Escherichia coli and evaluation of their adaptability in “farm-to-table” environments. Food. Microbiol. 113:104279. doi: 10.1016/j.fm.2023.104279
Jové, T., Da Re, S., Tabesse, A., Gassama-Sow, A., and Ploy, M. C. (2017). Gene expression in class 2 integrons is SOS-independent and involves two Pc promoters. Front. Microbiol. 8:1499. doi: 10.3389/fmicb.2017.01499
Laureti, L., Matic, I., and Gutierrez, A. (2013). Bacterial responses and genome instability induced by subinhibitory concentrations of antibiotics. Antibiotics 2, 100–114. doi: 10.3390/antibiotics2010100
Lenski, R. E. (2017). Experimental evolution and the dynamics of adaptation and genome evolution in microbial populations. ISME J. 11, 2181–2194. doi: 10.1038/ismej.2017.69
Liu, J., Huang, T., Xu, Z., Mao, Y., Soteyome, T., Liu, G., et al. (2023). Sub-MIC streptomycin and tetracycline enhanced Staphylococcus aureus Guangzhou-SAU749 biofilm formation, an in-depth study on transcriptomics. Biofilm 6:100156. doi: 10.1016/j.bioflm.2023.100156
Lu, W., Qiu, Q., Chen, K., Zhao, R., Li, Q., and Wu, Q. (2022). Distribution and molecular characterization of functional class 2 integrons in clinical proteus mirabilis isolates. Infect. Drug Resist. 15, 465–474. doi: 10.2147/IDR.S347119
Maiques, E., Ubeda, C., Campoy, S., Salvador, N., Lasa, I., Novick, R. P., et al. (2006). beta-lactam antibiotics induce the SOS response and horizontal transfer of virulence factors in Staphylococcus aureus. J. Bacteriol. 188, 2726–2729. doi: 10.1128/JB.188.7.2726-2729.2006
Márquez, C., Labbate, M., Ingold, A. J., Roy Chowdhury, P., Ramírez, M. S., Centrón, D., et al. (2008). Recovery of a functional class 2 integron from an Escherichia coli strain mediating a urinary tract infection. Antimicrob. Agents Chemother. 52, 4153–4154. doi: 10.1128/AAC.00710-08
Maslowska, K. H., Makiela-Dzbenska, K., and Fijalkowska, I. J. (2019). The SOS system: A complex and tightly regulated response to DNA damage. Environ. Mol. Mutagen. 60, 368–384. doi: 10.1002/em.22267
Miura, S., Tamamura, Y., Takayasu, M., Sasaki, M., Nishimura, N., Tokugawa, K., et al. (2020). Influence of SOS-inducing agents on the expression of ArtAB toxin gene in Salmonella enterica and Salmonella bongori. Microbiology 166, 785–793. doi: 10.1099/mic.0.000939
Mohanraj, R. S., and Mandal, J. (2022). Azithromycin can induce SOS response and horizontal gene transfer of SXT element in Vibrio cholerae. Mol. Biol. Rep. 49, 4737–4748. doi: 10.1007/s11033-022-07323-2
Niccum, B. A., Coplen, C. P., Lee, H., Mohammed Ismail, W., Tang, H., and Foster, P. L. (2020). New complexities of SOS-induced “untargeted” mutagenesis in Escherichia coli as revealed by mutation accumulation and whole-genome sequencing. DNA Repair 90:102852. doi: 10.1016/j.dnarep.2020.102852
Orman, M. A., and Brynildsen, M. P. (2013). Dormancy is not necessary or sufficient for bacterial persistence. Antimicrob. Agents Chemother. 57, 3230–3239. doi: 10.1128/AAC.00243-13
Partridge, S. R., Kwong, S. M., Firth, N., and Jensen, S. O. (2018). Mobile genetic elements associated with antimicrobial resistance. Clin. Microbiol. Rev. 31:e00088-17. doi: 10.1128/CMR.00088-17
Patel, M., Kumar, R., Kishor, K., Mlsna, T., Pittman, C. U. Jr., and Mohan, D. (2019). Pharmaceuticals of emerging concern in aquatic systems: chemistry, occurrence, effects, and removal methods. Chem. Rev. 119, 3510–3673. doi: 10.1021/acs.chemrev.8b00299
Phillips, I., Culebras, E., Moreno, F., and Baquero, F. (1987). Induction of the SOS response by new 4-quinolones. J. Antimicrob. Chemother. 20, 631–638. doi: 10.1093/jac/20.5.631
Podlesek, Z., and Žgur Bertok, D. (2020). The DNA damage inducible SOS response is a key player in the generation of bacterial persister cells and population wide tolerance. Front. Microbiol. 11:1785. doi: 10.3389/fmicb.2020.01785
Polianciuc, S. I., Gurzău, A. E., Kiss, B., Stefan, M. G., and Loghin, F. (2020). Antibiotics in the environment: causes and consequences. Med. Pharm. Rep. 93, 231–240. doi: 10.15386/mpr-1742
Recacha, E., Kuropka, B., Díaz-Díaz, S., García-Montaner, A., González-Tortuero, E., Docobo-Pérez, F., et al. (2024). Impact of suppression of the SOS response on protein expression in clinical isolates of Escherichia coli under antimicrobial pressure of ciprofloxacin. Front. Microbiol. 15:1379534. doi: 10.3389/fmicb.2024.1379534
Sato, Y., Unno, Y., Ubagai, T., and Ono, Y. (2018). Sub-minimum inhibitory concentrations of colistin and polymyxin B promote Acinetobacter baumannii biofilm formation. PLoS ONE 13:e0194556. doi: 10.1371/journal.pone.0194556
Schaenzer, A. J., and Wright, G. D. (2020). Antibiotic resistance by enzymatic modification of antibiotic targets. Trends Mol. Med. 26, 768–782. doi: 10.1016/j.molmed.2020.05.001
Shen, L., Shi, Y., Zhang, D., Wei, J., Surette, M. G., and Duan, K. (2008). Modulation of secreted virulence factor genes by subinhibitory concentrations of antibiotics in Pseudomonas aeruginosa. J. Microbiol. 46, 441–447. doi: 10.1007/s12275-008-0054-x
Sheng, D. H., Wang, Y., Wu, S. G., Duan, R. Q., and Li, Y. Z. (2021). The regulation of LexA on UV-induced SOS response in Myxococcus xanthus based on transcriptome analysis. J. Microbiol. Biotechnol. 31, 912–920. doi: 10.4014/jmb.2103.03047
Singh, A. K., and Bhunia, A. K. (2019). Animal-use antibiotics induce cross-resistance in bacterial pathogens to human therapeutic antibiotics. Curr. Microbiol. 76, 1112–1117. doi: 10.1007/s00284-019-01744-2
Stokes, H. W., and Hall, R. M. (1989). A novel family of potentially mobile DNA elements encoding site-specific gene-integration functions: integrons. Mol. Microbiol. 3, 1669–1683. doi: 10.1111/j.1365-2958.1989.tb00153.x
Van Alstine, S., and Sandler, S. J. (2022). Positive charges are important for the SOS constitutive phenotype in recA730 and recA1202 mutants of Escherichia coli K-12. J. Bacteriol. 204:e0008122. doi: 10.1128/jb.00081-22
Wei, Q., Hu, Q., Li, S., Lu, H., Chen, G., Shen, B., et al. (2014). A novel functional class 2 integron in clinical Proteus mirabilis isolates. J. Antimicrob. Chemother. 69, 973–976. doi: 10.1093/jac/dkt456
Wilson, D. N., Hauryliuk, V., Atkinson, G. C., and O'Neill, A. J. (2020). Target protection as a key antibiotic resistance mechanism. Nat. Rev. Microbiol. 18, 637–648. doi: 10.1038/s41579-020-0386-z
Wistrand-Yuen, E., Knopp, M., Hjort, K., Koskiniemi, S., Berg, O. G., and Andersson, D. I. (2018). Evolution of high-level resistance during low-level antibiotic exposure. Nat. Commun. 9:1599. doi: 10.1038/s41467-018-04059-1
Keywords: class 2 integron, recA, resistance genes, integrase gene, sub-MIC, antibiotic
Citation: Ye J, Sun Q, Wu Q, Xu J, Yang Y, Zhao R and Li Q (2025) The expression regulation of recA gene and bacterial class 2 integron-associated genes induced by antibiotics. Front. Microbiol. 16:1632813. doi: 10.3389/fmicb.2025.1632813
Received: 21 May 2025; Accepted: 11 August 2025;
Published: 29 August 2025.
Edited by:
Abid Ali, Henry Ford Health System, United StatesReviewed by:
Nizami Duran, Mustafa Kemal University, TürkiyeSantosh Dulal, Management Sciences for Health, United States
Copyright © 2025 Ye, Sun, Wu, Xu, Yang, Zhao and Li. This is an open-access article distributed under the terms of the Creative Commons Attribution License (CC BY). The use, distribution or reproduction in other forums is permitted, provided the original author(s) and the copyright owner(s) are credited and that the original publication in this journal is cited, in accordance with accepted academic practice. No use, distribution or reproduction is permitted which does not comply with these terms.
*Correspondence: Qingcao Li, bHFjX2xhYkAxNjMuY29t
†These authors have contributed equally to this work and share first authorship