 Xuefeng Yan1†Yuhong Zhou2†Songwei Liu2
 Congwei Gu3,4Wudian Xiao3,4Mingde Zhao3,4
 Zehui Yu3,4
 Lvqin He3,4*
- 1School of Physical Education, Southwest Medical University, Luzhou, China
- 2School of Pharmacy, Southwest Medical University, Luzhou, China
- 3Department of Technology, Experimental Animal Center, Southwest Medical University, Luzhou, China
- 4Model Animal and Human Disease Research of Luzhou Key Laboratory, Southwest Medical University, Luzhou, China
Introduction: Glaesserella parasuis (G. parasuis) causes agent Glässer’s disease in swine. This study investigated the mechanism of QseC in G. parasuis.
Methods: The study utilized transcriptomic and metabolomic sequencing techniques. The ΔqseC mutant was examined using transmission electron microscopy.
Results: Transmission electron microscopy revealed that ΔqseC mutant exhibited cell wall dissolution and cytoplasmic rarefaction, indicating membrane homeostasis disruption. Metabolomics analysis identified 819 metabolites, with 24/36 showing significant alterations in positive/negative ion modes. KEGG enrichment indicated abnormalities in amino acid synthesis and quorum sensing. Transcriptomic revealed 663 differentially expressed genes (DEGs), including upregulated membrane synthesis genes (plsB and wecA) and downregulated virulence factors (hrpA and pilW). Integrated analysis demonstrated that plsB and wecA formed association networks with methionine and prostaglandin metabolites.
Discussion: These results establish QseC’s global regulatory role in G. parasuis, providing insights for novel control strategies.
1 Introduction
Glaesserella parasuis is a Gram-negative bacterium of the Pasteurellaceae family, exhibiting pleomorphic morphology (spherical, rod-shaped, and filamentous forms) and non-motility (Neil et al., 1969). As an NAD-dependent pathogens, it colonizes porcine respiratory tracts and causes polyserositis under stress conditions (Segalés et al., 1997). Affected pigs display characteristic clinical manifestations including fibrinous polyserositis (peritonitis and“fuzzy heart”), arthritis, meningitis, and sepsis (Neil et al., 1969; Castilla et al., 2012). The distinct clinical presentations of acute versus chronic infections likely reflect strain-dependent virulence factors and host immune variability (Oliveira and Pijoan, 2004). Despite its significant pathogenicity, the molecular mechanisms of G. parasuis infection remain poorly characterized, and no effective broad-spectrum vaccines currently exist-presenting substantial challenges for disease control.
The histidine kinase QseC, a conserved membrane-bound sensor in the QseB/QseC two-component system (TCS) of G. parasuis (Sperandio et al., 2002; Rooks et al., 2017). TCS primarily comprises histidine protein kinase (HPK) on the cell membrane and response regulator (RR) in the cytoplasm (Stock et al., 2000). In Escherichia coli, qseC deletion disrupts QseB dephosphorylation, establishing a dysregulated positive feedback loop that attenuates virulence gene expression (Hadjifrangiskou et al., 2011). Given QseC’s established role as a virulence amplifier in diverse pathogens (Rasko et al., 2008) (including diffusely adhering E. coli O104: H4 and enteropathogenic E. coli) (Curtis et al., 2014), and its involvement in regulating antibiotic resistance via crosstalk with PmrAB TCS (Fernandez-Ciruelos et al., 2023), this system represents a promising target for novel antibacterials.
The qseC gene is highly conserved across G. parasuis serotypes serotypes 1–15 (Yan et al., 2022). We previously constructed a ΔqseC mutant in serotype 13 and demonstrated that deletion: (i) reduces tolerance to osmotic/oxidative/thermal stress, (ii) impairs iron acquisition and biofilm formation, and (iii) attenuates virulence in murine models (He et al., 2018). Notably, recombinant QseC protein activates cellular immunity in mice and triggers pro-inflammatory cytokine secretion (IL-1β, IL-6, TNF-α) in RAW 264.7 macrophages via JNK MAPK, p38, and NF-κB pathways (Yan et al., 2024). While QseB phosphorylation is directly controlled by QseC kinase activity, the mechanistic details of their interaction remain unresolved. To address this gap, we performed comparative transcriptomics of wild-type MY1902 and ΔqseC strains.
Here, we aimed to elucidate the global regulatory network governed by QseC in G. parasuis through integrated RNA-seq and UHPLC-Q-TOF MS-based metabolomics. By synthesizing transcriptional and metabolic profiles, this study specifically seeks to: (i) identify molecular mechanisms underlying the ΔqseC phenotypic alterations, and (ii) establish a multi-omics framework for understanding QseB/QseC-mediated pathogenesis in G. parasuis.
2 Materials and methods
2.1 Bacterial strains and culture conditions
The wild-type G. parasuis strain MY1902 (serotype 13) was generously provided by the Swine Disease Research Center at Sichuan Agricultural University. The ΔqseC mutant and its complemented strain (c-ΔqseC) were constructed via homologous recombination as detailed in previous study (He et al., 2018), with all strains cryopreserved at −80 °C in our laboratory repository. The ΔqseC mutant was constructed by replacing the gene with a kanamycin resistance cassette using overlap PCR and homologous recombination via the suicide vector pK18mobsacB. The complementation strain was generated by cloning the qseC gene into the replicative vector pSF116 and introducing it into the mutant. Strains were cultured Tryptic Soy Broth/Agar (TSB/TSA; BD-Difco) supplemented with 5% heat-inactivated newborn bovine serum (Solarbio) and 0.1% (w/v) NAD (Sigma-Aldrich). Kanamycin (100 μg/mL) was added for mutant selection.
2.2 Observation of the internal structure of bacteria
The effect of qseC gene deletion on the morphology of G. parasuis was assessed using TEM. The wild-type strain MY1902 and ΔqseC mutant strain were inoculated into fresh TSB at a 1:100 dilution and cultured at 80 rpm for 24 h. When the OD600 nm reached approximately 1.2, the culture was centrifuged at 4,000 rpm for 10 min. The resulting bacterial pellet was gently rinsed once with phosphate-buffered saline (PBS) and re-centrifuged at 5,000 rpm for 2 min. After discarding the PBS supernatant, we added 3 mL of electron microscopy fixative (2.5% glutaraldehyde solution) to the pellet. The pellet was then gently resuspended and dispersed in the fixative. Fixation was performed at room temperature in the dark for 2 h, followed by storage at 4 °C. The fixed samples were subsequently processed and imaged using a transmission electron microscope by a commercial service provider. Images were acquired and analyzed to evaluate morphological differences.
2.3 Metabolite extraction for LC–MS/MS analysis
Intracellular metabolites were extracted from exponentially growing cultures (OD600 ≈ 0.8) of both the G. parasuis MY1902 and the ΔqseC mutant strain to compare their metabolite profiles. Cells were harvested by centrifugation (4 °C, 4,000 rpm, 5 min) from TSB cultures. A representative aliquot of the resulting bacterial pellet was subjected to metabolite extraction. For this purpose, the pellet aliquot was resuspended in 300 μL of ice-cold 80% (v/v) aqueous methanol to quench metabolism and initiate extraction. Immediate flash-freezing in liquid nitrogen for 5 min was performed to further arrest metabolic activity and facilitate cell disruption. The frozen suspension was then thawed on ice and vortexed vigorously for 30 s. Complete cell lysis was achieved by ultrasonication for 6 min on ice to ensure efficient metabolite release. Cellular debris was removed by centrifugation (4 °C, 5,000 rpm, 1 min). The metabolite-containing supernatant was carefully transferred to a new tube and lyophilized to dryness to concentrate the metabolites and remove volatile solvents. The dried metabolite extract was subsequently reconstituted in a volume of 10% (v/v) methanol solution equivalent to the initial pellet aliquot volume to achieve a consistent concentration suitable for LC–MS/MS injection. Finally, the reconstituted extracts were analyzed by liquid chromatography–tandem mass spectrometry (LC–MS/MS) to characterize the metabolite composition.
2.4 Data preprocessing and metabolite identification
Raw mass spectrometry data files (.raw format) acquired from LC–MS/MS analyses were imported into Compound Discoverer (CD) software (version 3.3) for comprehensive preprocessing. Initial data processing included alignment of chromatographic retention times and mass-to-charge ratios (m/z) across all samples to ensure consistent feature detection and matching. To correct for potential instrumental drift and enhance quantitative accuracy, peak areas were normalized relative to the first quality control (QC1) sample injected during the analytical sequence. Putative metabolite identification was then performed by matching the experimentally observed molecular ion masses ([M + H]+, [M−H]−, etc.) and characteristic fragmentation patterns against spectral libraries within the mzCloud, mzVault, and Masslist databases. Signals originating from solvents, reagents, or background contaminants were removed by subtracting features consistently detected in blank (solvent-only) samples run alongside the biological samples. For relative quantification, the raw peak area of each metabolite in each sample was normalized using the following formula to account for variations in overall metabolite abundance and instrumental response: Relative Peak Area = (Raw Peak Area of Metabolite in Sample)/(Total Sum of All Metabolite Peak Areas in Sample/Total Sum of All Metabolite Peak Areas in QC1). This normalization yielded the relative abundance of each metabolite. To ensure data quality and reproducibility, metabolites exhibiting a coefficient of variation (CV) of relative peak area exceeding 30% across the replicate QC samples were excluded from further analysis. The final curated dataset comprised the confidently identified metabolites and their corresponding relative quantitative values, providing the basis for subsequent statistical comparisons between strains. Processed metabolomics data underwent multivariate analysis using the metaX software package, where log-transformed and scaled data were subjected to Partial Least Squares-Discriminant Analysis (PLS-DA) to derive the Variable Importance in Projection (VIP) score for each metabolite. For univariate analysis, Student’s t-test was applied to calculate the statistical significance (p-value) of intergroup differences for individual metabolites, while the fold change (FC) between groups was computed to quantify relative abundance differences. Differentially abundant metabolites (DAMs) were defined using the following thresholds: VIP > 1.0, FC > 1.2 or FC < 0.833, and p < 0.05.
2.5 Statistical analysis of metabolome
Identified metabolites were functionally annotated using the Kyoto Encyclopedia of Genes and Genomes (KEGG), Human Metabolome Database (HMDB), and LIPID MAPS databases to assign putative biological roles and pathway associations. For multivariate analysis, the processed metabolomics data were log-transformed (or otherwise scaled) and mean-centered using the metaX software package prior to dimensionality reduction. Principal Component Analysis (PCA) was performed to visualize inherent data structure and detect potential outliers. Partial Least Squares-Discriminant Analysis (PLS-DA) was subsequently applied to maximize the separation between the MY1902 parental strain and the ΔqseC mutant groups and to identify metabolites contributing most significantly to this discrimination. Differentially abundant metabolites (DAMs) between the two strains were selected based on the following combined criteria: a Variable Importance in Projection (VIP) score > 1 from the PLS-DA model, a p < 0.05 derived from univariate statistical testing (e.g., Student’s t-test or Wilcoxon rank-sum test), and an absolute fold change (FC) ≥ 2. Pairwise Pearson correlation coefficients among the DAMs were calculated using the cor () function in R. The statistical significance of these correlations was assessed using the cor.mtest () function in R, with a p < 0.05 considered significant. To elucidate the biological implications of the observed metabolic alterations, functional enrichment analysis of the DAMs was conducted based on KEGG pathways. A pathway was considered enriched if the proportion of DAMs mapping to it (x/n) significantly exceeded the proportion of all identified metabolites mapping to the same pathway (y/N), where: x = Number of DAMs mapped to the pathway, n = Total number of DAMs, y = Number of all identified metabolites mapped to the pathway, N = Total number of identified metabolites. The statistical significance of pathway enrichment was evaluated using the hypergeometric test, with a hypergeometric p < 0.05 indicating significantly enriched pathways.
2.6 Preparation of prokaryotic transcriptome samples
Exponentially growing cultures (OD600 ≈ 0.8) of the G. parasuis parental strain (MY1902) and the isogenic ΔqseC mutant were harvested by centrifugation (4 °C, 4,000 rpm, 5 min) to capture transcriptomes representative of mid-logarithmic phase growth. Total RNA was isolated from the bacterial pellets using the OMEGA Bio-Tek Bacterial Total RNA Extraction Kit according to the manufacturer’s protocol to obtain high-quality, genomic DNA-free RNA suitable for sequencing. RNA integrity and concentration were rigorously assessed using an Agilent 2100 Bioanalyzer (Agilent Technologies, CA, United States) to ensure sample quality met the stringent requirements for downstream strand-specific library construction.
2.7 Strand-specific RNA-seq library construction and quality control
Ribosomal RNA (rRNA) was depleted from qualified total RNA samples using a prokaryote-specific rRNA removal kit to enrich messenger RNA (mRNA) and non-coding RNAs. The purified rRNA-depleted RNA was fragmented under optimized conditions. First-strand cDNA synthesis was performed using random hexamer primers. To enable strand-of-origin determination, dUTP was incorporated during second-strand cDNA synthesis instead of dTTP. The resulting double-stranded cDNA underwent end repair, 3′-end adenylation (A-tailing), and ligation of Illumina-compatible adapters. Adapter-ligated fragments within the target size range (typically 250–450 bp) were size-selected. Uracil-containing second strands were enzymatically digested using USER enzyme (NEB) to generate strand-specific libraries. The libraries were then amplified with index primers via limited-cycle PCR and purified. Final library concentration was quantified using Qubit fluorometry and qPCR, while fragment size distribution was verified using an Agilent Bioanalyzer. Libraries passing quality control (appropriate size distribution, absence of adapter dimers, sufficient concentration) were pooled in equimolar ratios based on qPCR-derived effective concentrations to achieve uniform sequencing depth across samples during paired-end sequencing (2×150 bp) on an Illumina NovaSeq 6,000 platform.
2.8 Bioinformatics analysis of transcriptome
The method for standardizing differences in transcriptomic data in this study is TMM. The differential analysis software is edgeR, and the filtering threshold is: padj≤0.005, |log2FoldChange| ≥1.0. Bioinformatic analysis commenced with alignment of filtered sequencing reads to the G. parasuis reference genome using Bowtie 2 to facilitate transcript reconstruction. Rockhopper software assembled these alignments, identifying novel transcript regions through comparison with annotated gene models; putative functions for novel transcripts were assigned via Blastx against the non-redundant (nr) database. Gene expression quantification (FPKM metric) was performed using HTSeq v0.6.1. Differential expression analysis between MY1902 and ΔqseC strains was conducted with DESeq2, defining differentially expressed genes (DEGs) as those with Benjamini-Hochberg adjusted p < 0.05 to control false discovery. Functional enrichment analysis of DEGs elucidated the biological impact of qseC deletion: GOseqR identified enriched Gene Ontology terms (p < 0.05, length-bias corrected), KOBAS revealed significant KEGG pathways, and protein–protein interaction networks were reconstructed from DEGs using the STRING database to uncover functional associations.
2.9 Quantitative real-time reverse transcription-PCR (qRT-PCR) validation
The qRT-PCR was performed to validate RNA-seq results by assessing transcription levels of eight randomly selected differentially expressed genes in G. parasuis strains MY1902 and ΔqseC. Bacterial cultures were harvested at mid-log phase (OD600 = 0.8), followed by total RNA extraction and reverse transcription into cDNA. Using 16S rRNA as the endogenous control (primers in Table 1), reactions were conducted in technical triplicates on a LightCycler® 96 system (Roche) with SYBR Premix Ex Taq II (Takara Bio) under standardized cycling conditions: 95 °C/30s; 45 cycles of 95 °C/5 s, 54 °C/30s, 72 °C/30s; and melting curve analysis. Gene expression fold-changes were calculated via the 2−ΔΔCT method to confirm transcriptomic differences between strains.
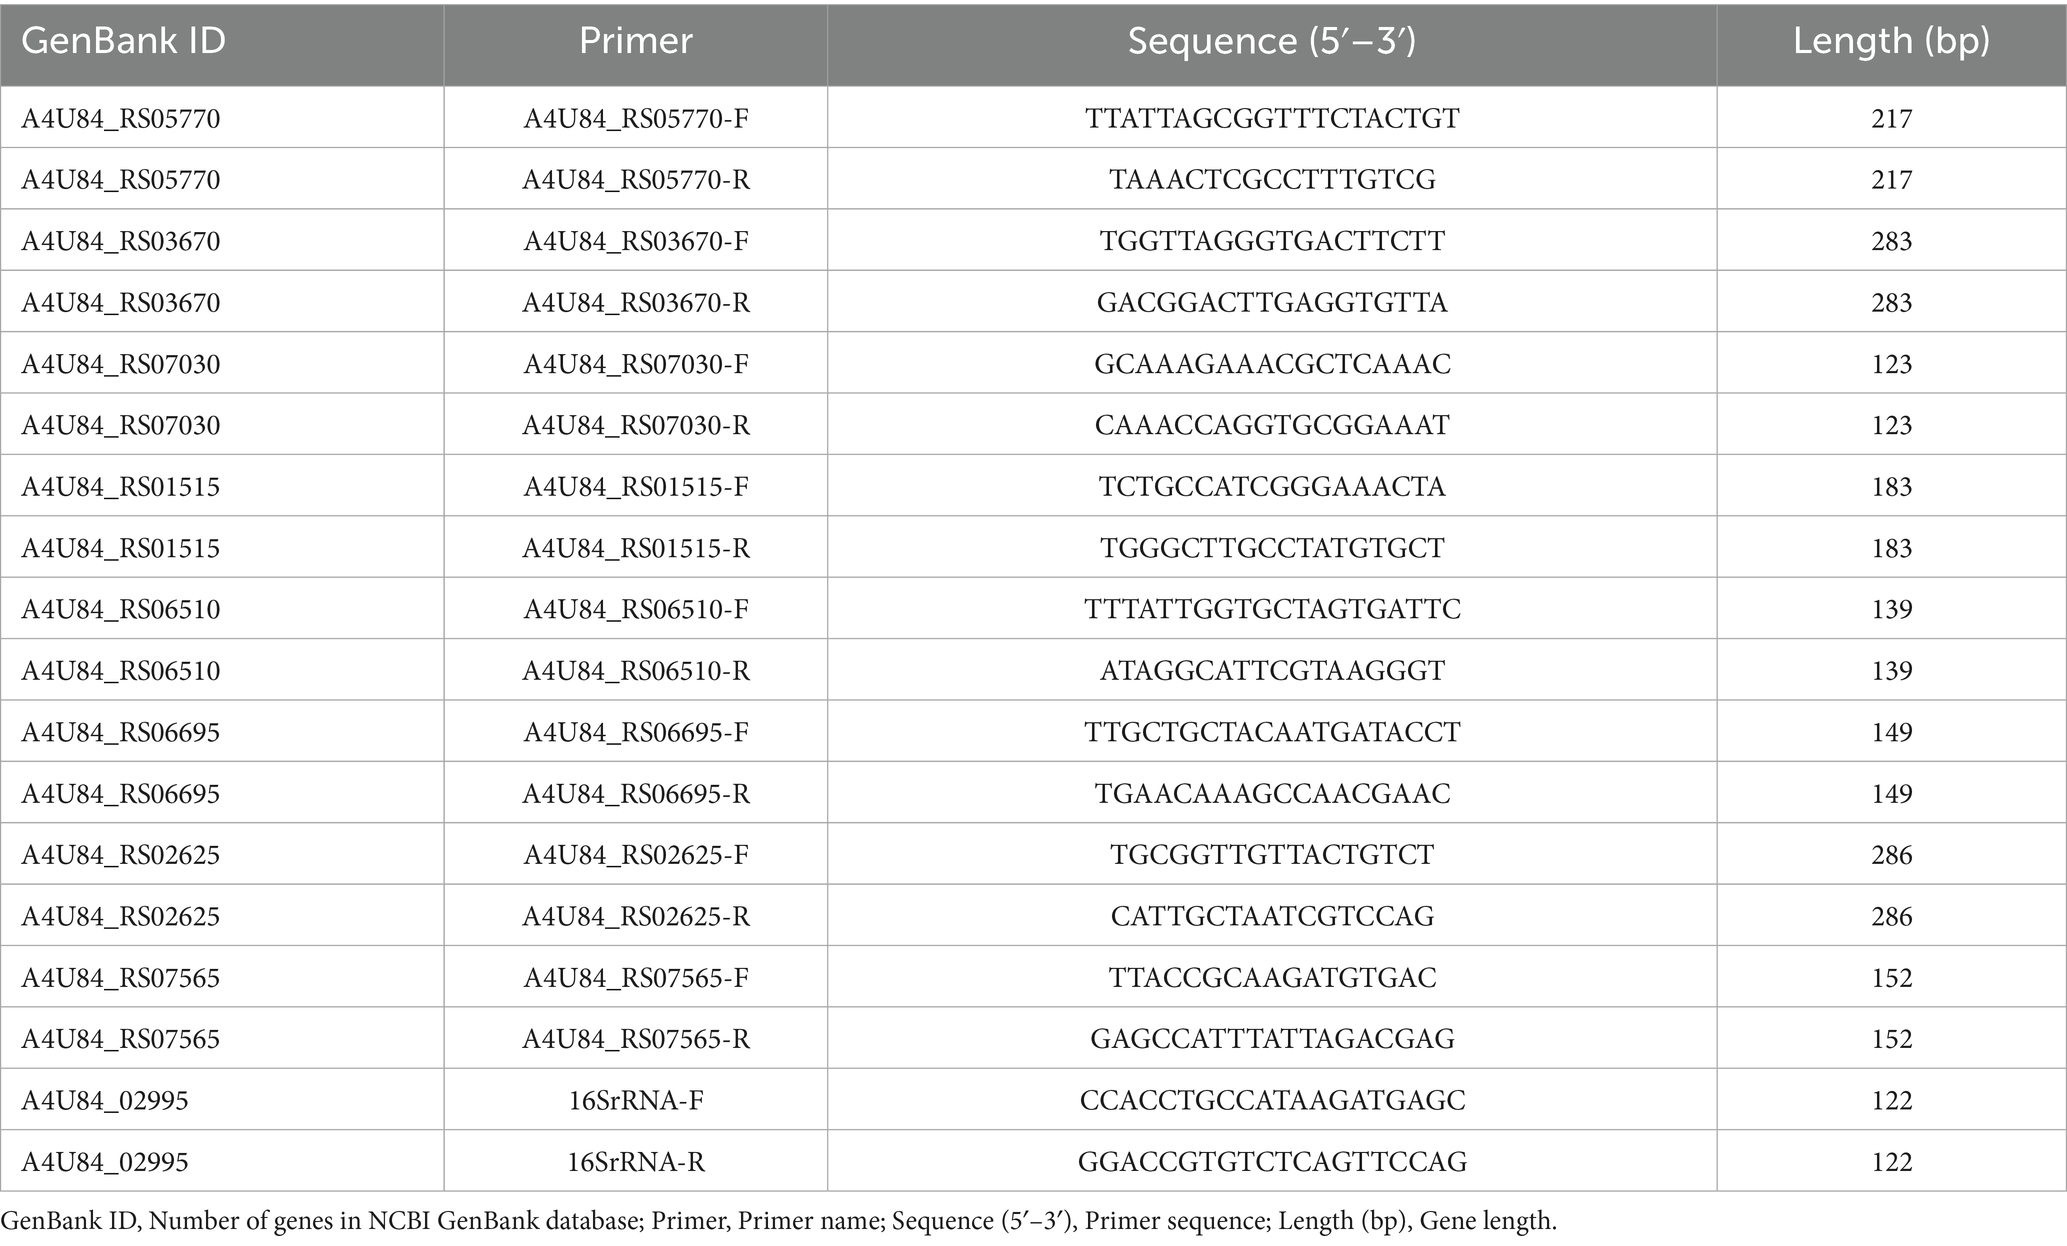
Table 1. Primers used for microarray results validation with qRT-PCR.
2.10 Combined analysis of transcriptome and metabolome
Integrated transcriptomic-metabolomic analysis was conducted to identify key post-transcriptional regulators (e.g., RNA-binding proteins, non-coding RNAs) governing metabolic flux in G. parasuis. This approach correlated RNA-level expression patterns with small-molecule metabolite dynamics to elucidate system-level adaptations resulting from qseC deletion.
2.11 Statistical analysis
All experimental data were analyzed using GraphPad Prism 6.0, with continuous variables assessed by Student’s t-test (two-group) or one-way ANOVA (multi-group), survival data analyzed via log-rank (Mantel-Cox) test, and statistical significance defined as p < 0.05 (denoted by asterisks).
3 Results
This study tested the central hypothesis that QseC, a membrane-associated histidine kinase, orchestrates critical envelope-metabolic homeostasis in G. parasuis. We proposed QseC regulates: (i) structural integrity through cell envelope maintenance, and (ii) metabolic flux via stress-responsive pathways. To evaluate this, we systematically analyzed ΔqseC mutants using multimodal approaches-initiating with ultrastructural assessment to probe envelope defects predicted for a membrane sensor, followed by metabolomic/transcriptomic profiling to identify downstream functional impacts.
3.1 TEM revealed QseC-dependent structural defects
As QseC is a membrane-localized sensor kinase, we first interrogated whether its deletion compromises cellular integrity using TEM-the gold standard for ultrastructural analysis. Wild-type MY1902 exhibited intact cell walls and membranes without cytoplasmic separation, with electron-dense cytoplasmic inclusions observed (Figure 1A, red arrows). In contrast, ΔqseC mutants showed focal wall/membrane dissolution (Figure 1B, red arrows), cytoplasmic separation (Figure 1B, yellow arrows), and protoplast disintegration. These defects indicate QseC was essential for maintaining envelope integrity and cytoplasmic organization in G. parasuis, validating our structural stability hypothesis.
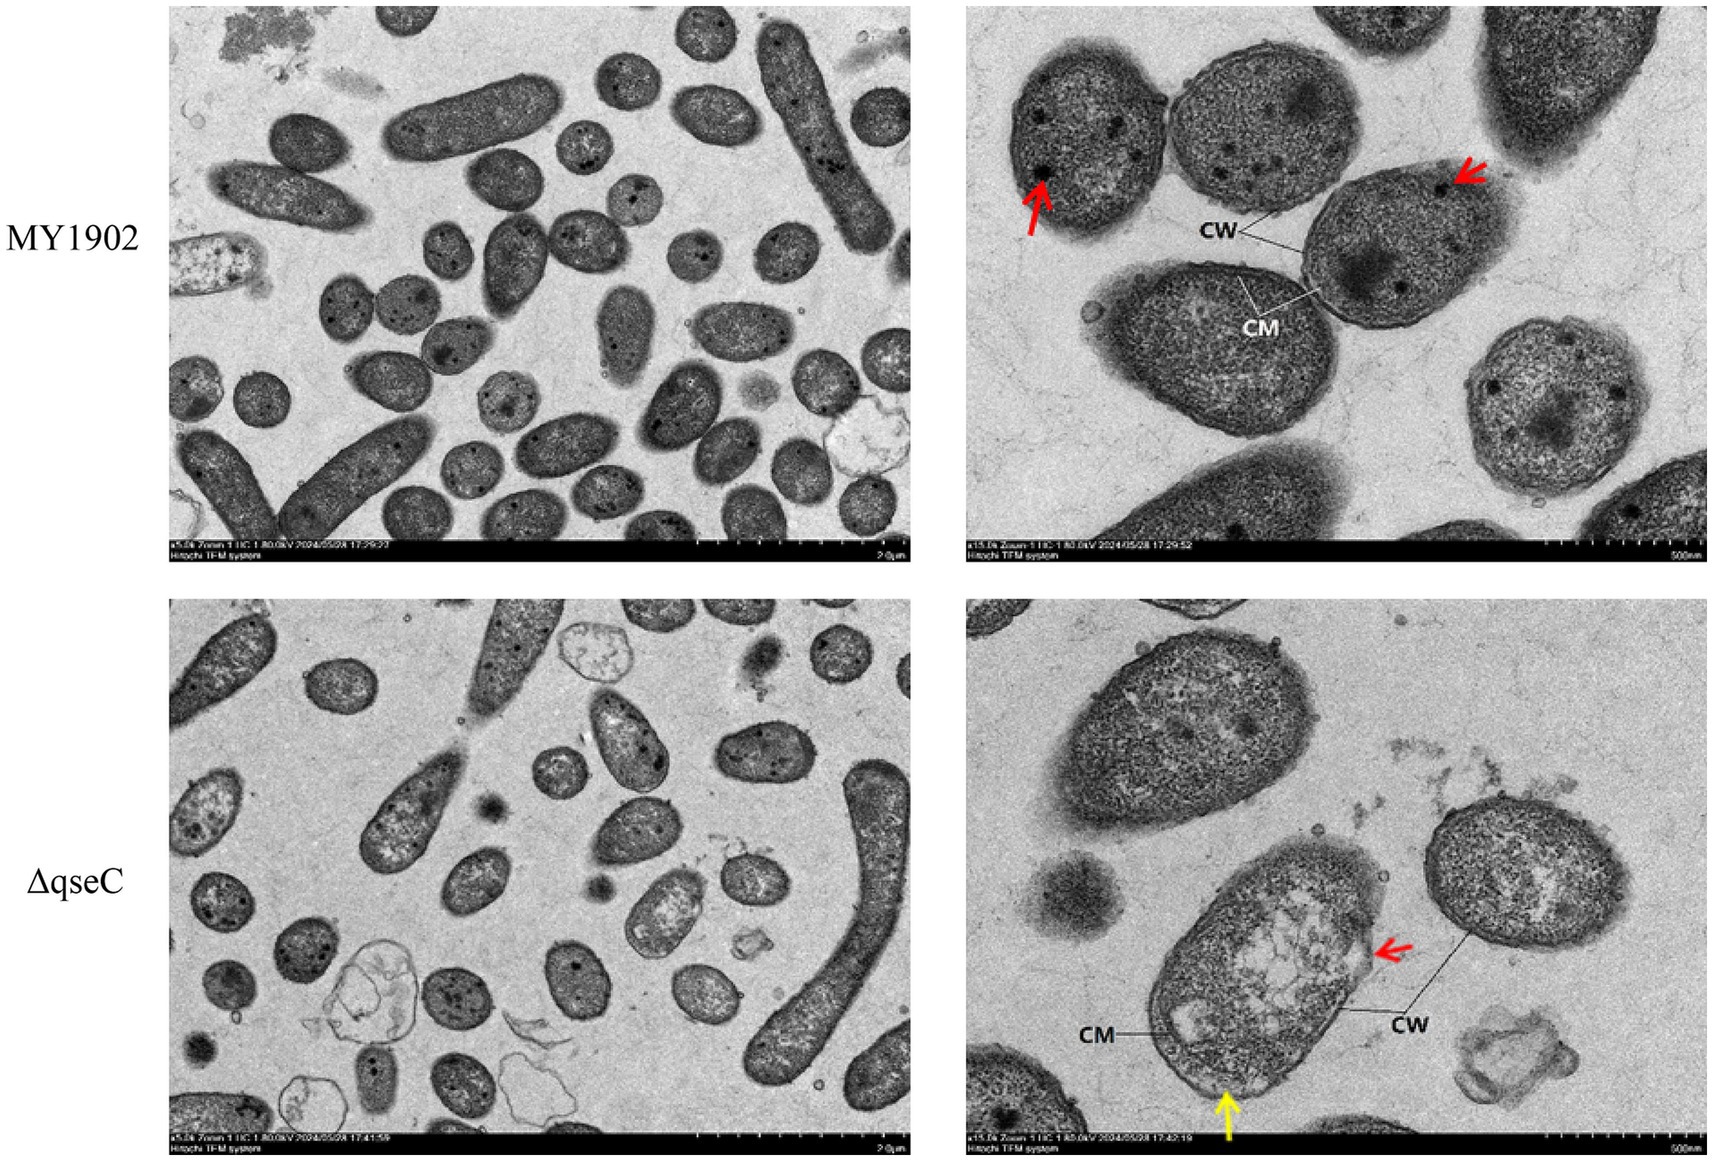
Figure 1. Ultrastructural comparison of G. parasuis. Wild-type MY1902 displayed intact envelopes and dense cytoplasm. ΔqseC showed wall dissolution (red arrows) and cytoplasmic detachment (yellow arrows).
3.2 Metabolomic profiling revealed QseC-dependent reprogramming
Given the structural defects observed, we next performed untargeted metabolomics to test whether QseC deletion disrupts metabolic networks supporting envelope biogenesis and stress adaptation. We performed untargeted metabolomics using UHPLC-Q-TOF MS. Data were deposited in MetaboLights (MTBLS12504).
3.2.1 Metabolic alterations in ΔqseC
We detected 819 metabolites (Supplementary Tables S1, S2), with lipids (21.89–37.00%) and organic acid derivatives (18.45–28.33%) as dominant classes. Principal component analysis confirmed analytical reproducibility through tight QC clustering (Supplementary Figures S1, S2). We investigated how deleting the qseC gene changes bacterial metabolism. Our comparison of ΔqseC and MY1902 strains found 60 significantly changed metabolites (Figures 2A,B; Supplementary Tables S3, S4). In positive ion mode, 24 metabolites differed: 9 increased (like prostaglandin F2α-ester) and 15 decreased (including nucleotide metabolites hypoxanthine and UDP). In negative ion mode, 36 metabolites changed: 11 increased (lipid signaling molecules) and 25 decreased (structural building blocks like cysteine). Volcano plots showed these changes based on statistical importance. Cluster analysis revealed connected metabolic networks (Figures 2C,D). The differentially abundant metabolites functionally explain TEM-observed structural damage and demonstrate QseC’s role as a metabolic orchestrator—depletions in envelope precursors directly correlate with membrane dissolution, while altered stress metabolites reflect compromised homeostasis. The altered metabolites explained the structural damage seen in TEM images, showing QseC controlled cellular chemistry. Lower cell wall building blocks caused membrane breakdown, while changed stress chemicals indicated lost internal balance.
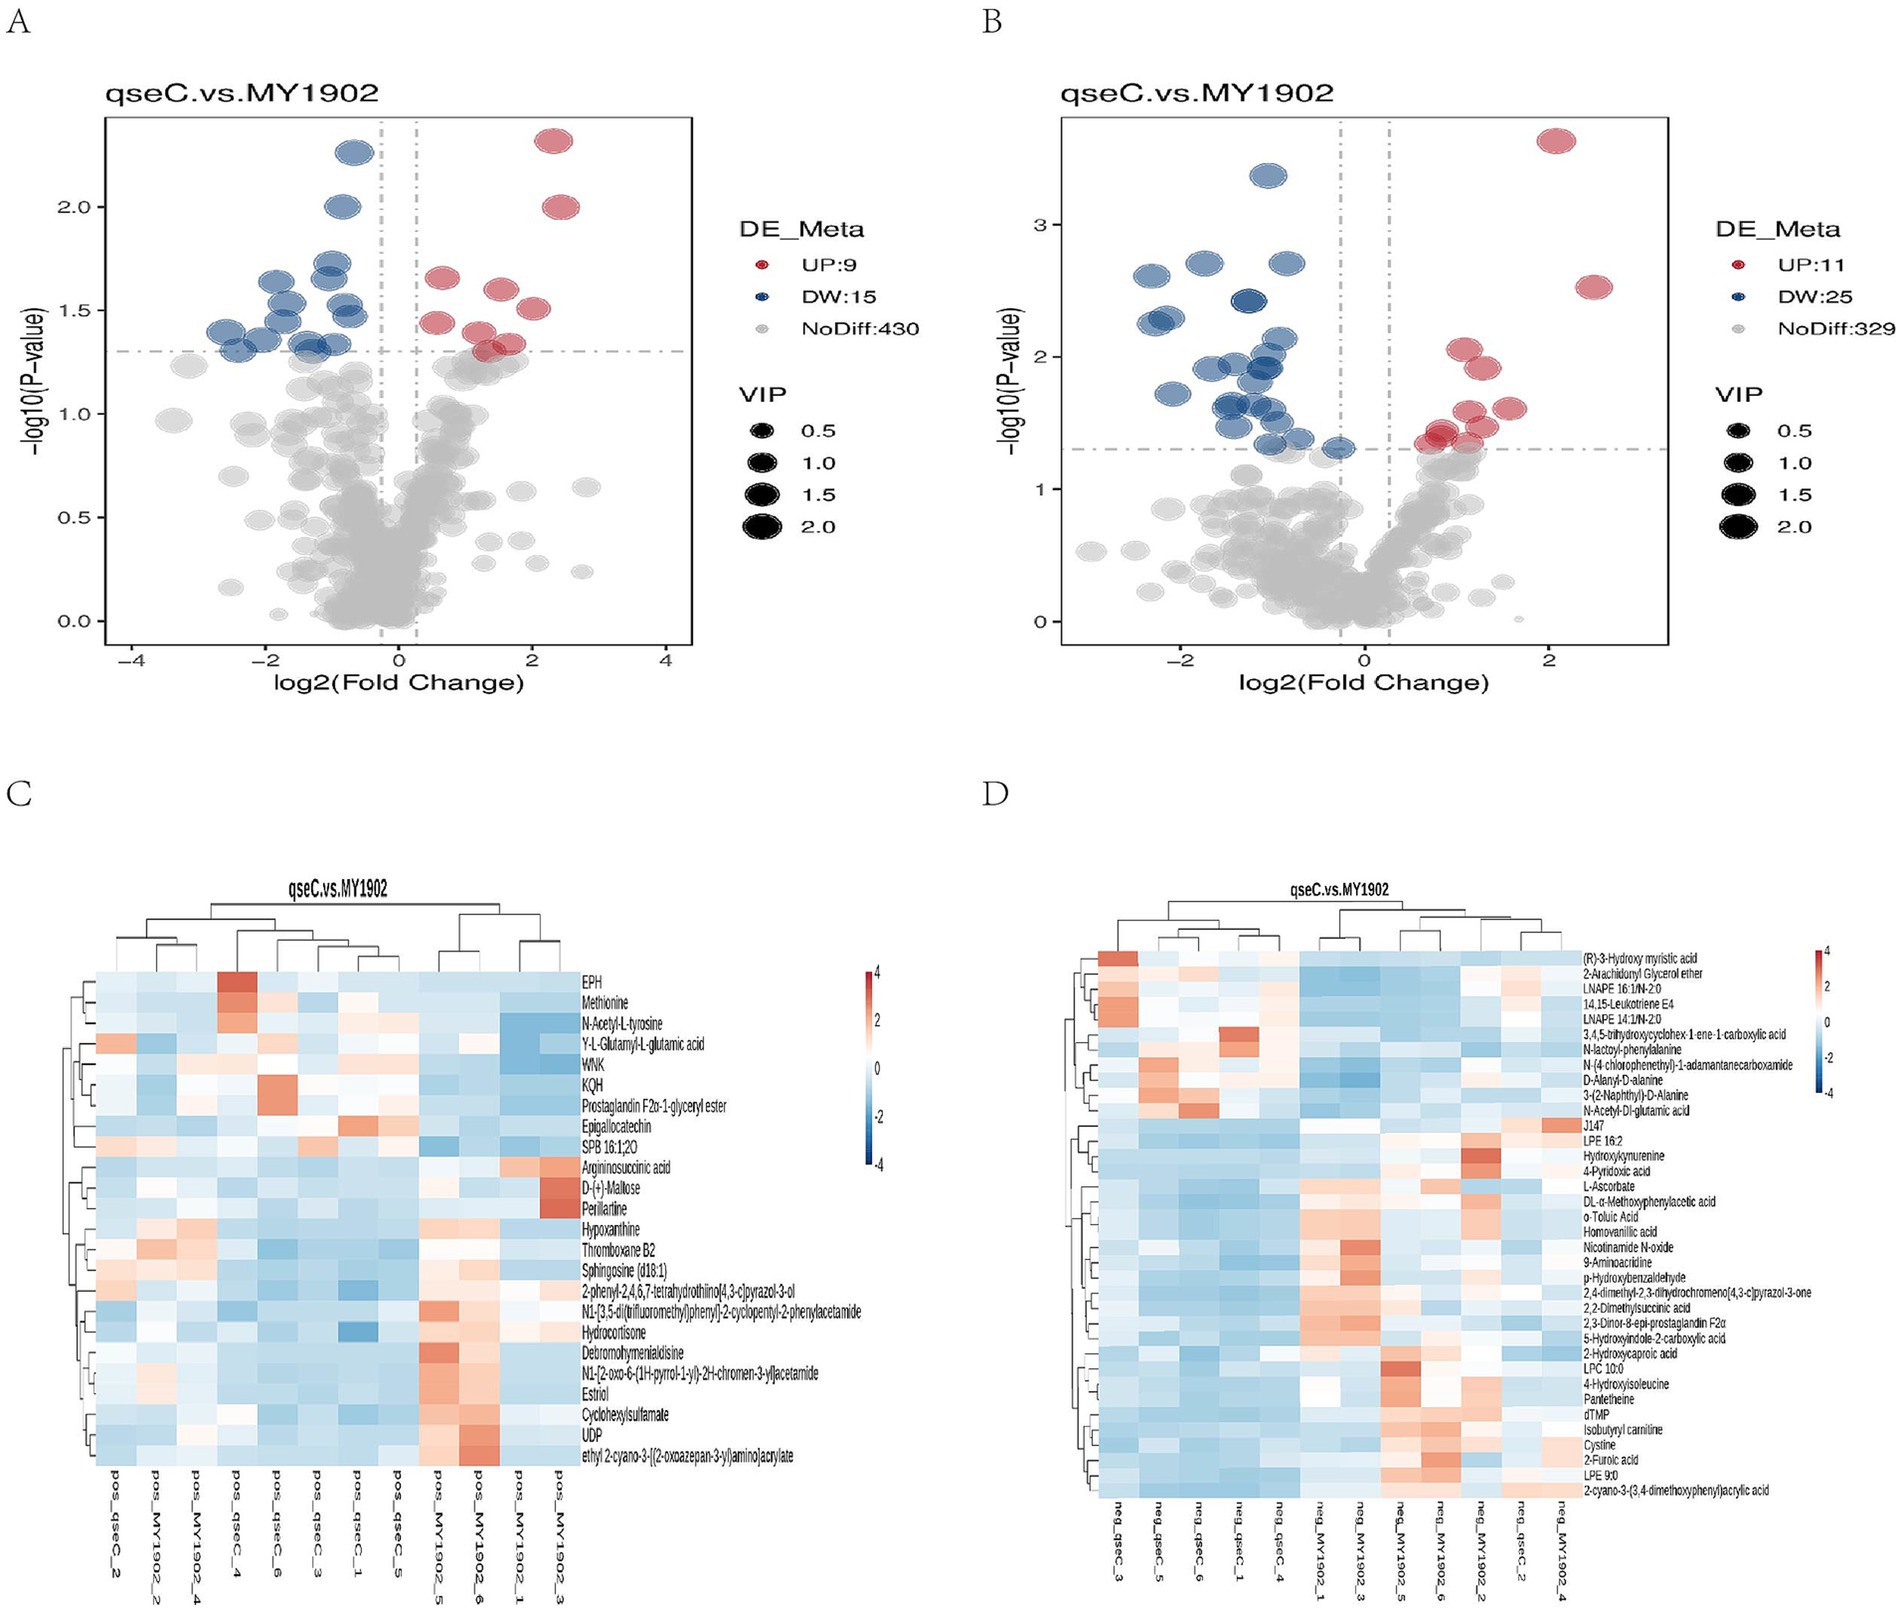
Figure 2. Metabolic alterations in in ΔqseC. (A,B) Volcano plots prioritized significantly altered metabolites (p < 0.05) in positive/negative ion modes based on fold change (log2[FC], horizontal axis) and statistical significance (−log10[p-value], vertical axis). Red/blue points denote up/downregulated metabolites; dot size indicates variable importance. (C,D) Hierarchical clustering of dysregulated metabolites revealed coordinated expression patterns functionally linked to cell envelope biosynthesis (explaining TEM-observed damage) and nucleotide metabolism. Shorter branch lengths indicate higher similarity between metabolites or samples.
3.2.2 KEGG pathway analysis revealed functional impacts
To establish system-level consequences of metabolic dysregulation, we mapped differentially abundant metabolites to biological pathways. Bubble plots (Figures 3A,B) showed significant enrichment in nucleotide/amino acid metabolism (positive ion mode) and cell envelope biosynthesis and membrane function (negative ion mode). Regulatory network mapping connected these metabolic changes to cell wall damage (Figures 3C,D). Pathway analysis confirmed QseC maintained essential links between metabolism and cell structure. Its deletion disrupted the flow of building blocks for cell walls and weakened stress response capacity. This mechanistically explained the structural damage observed earlier.
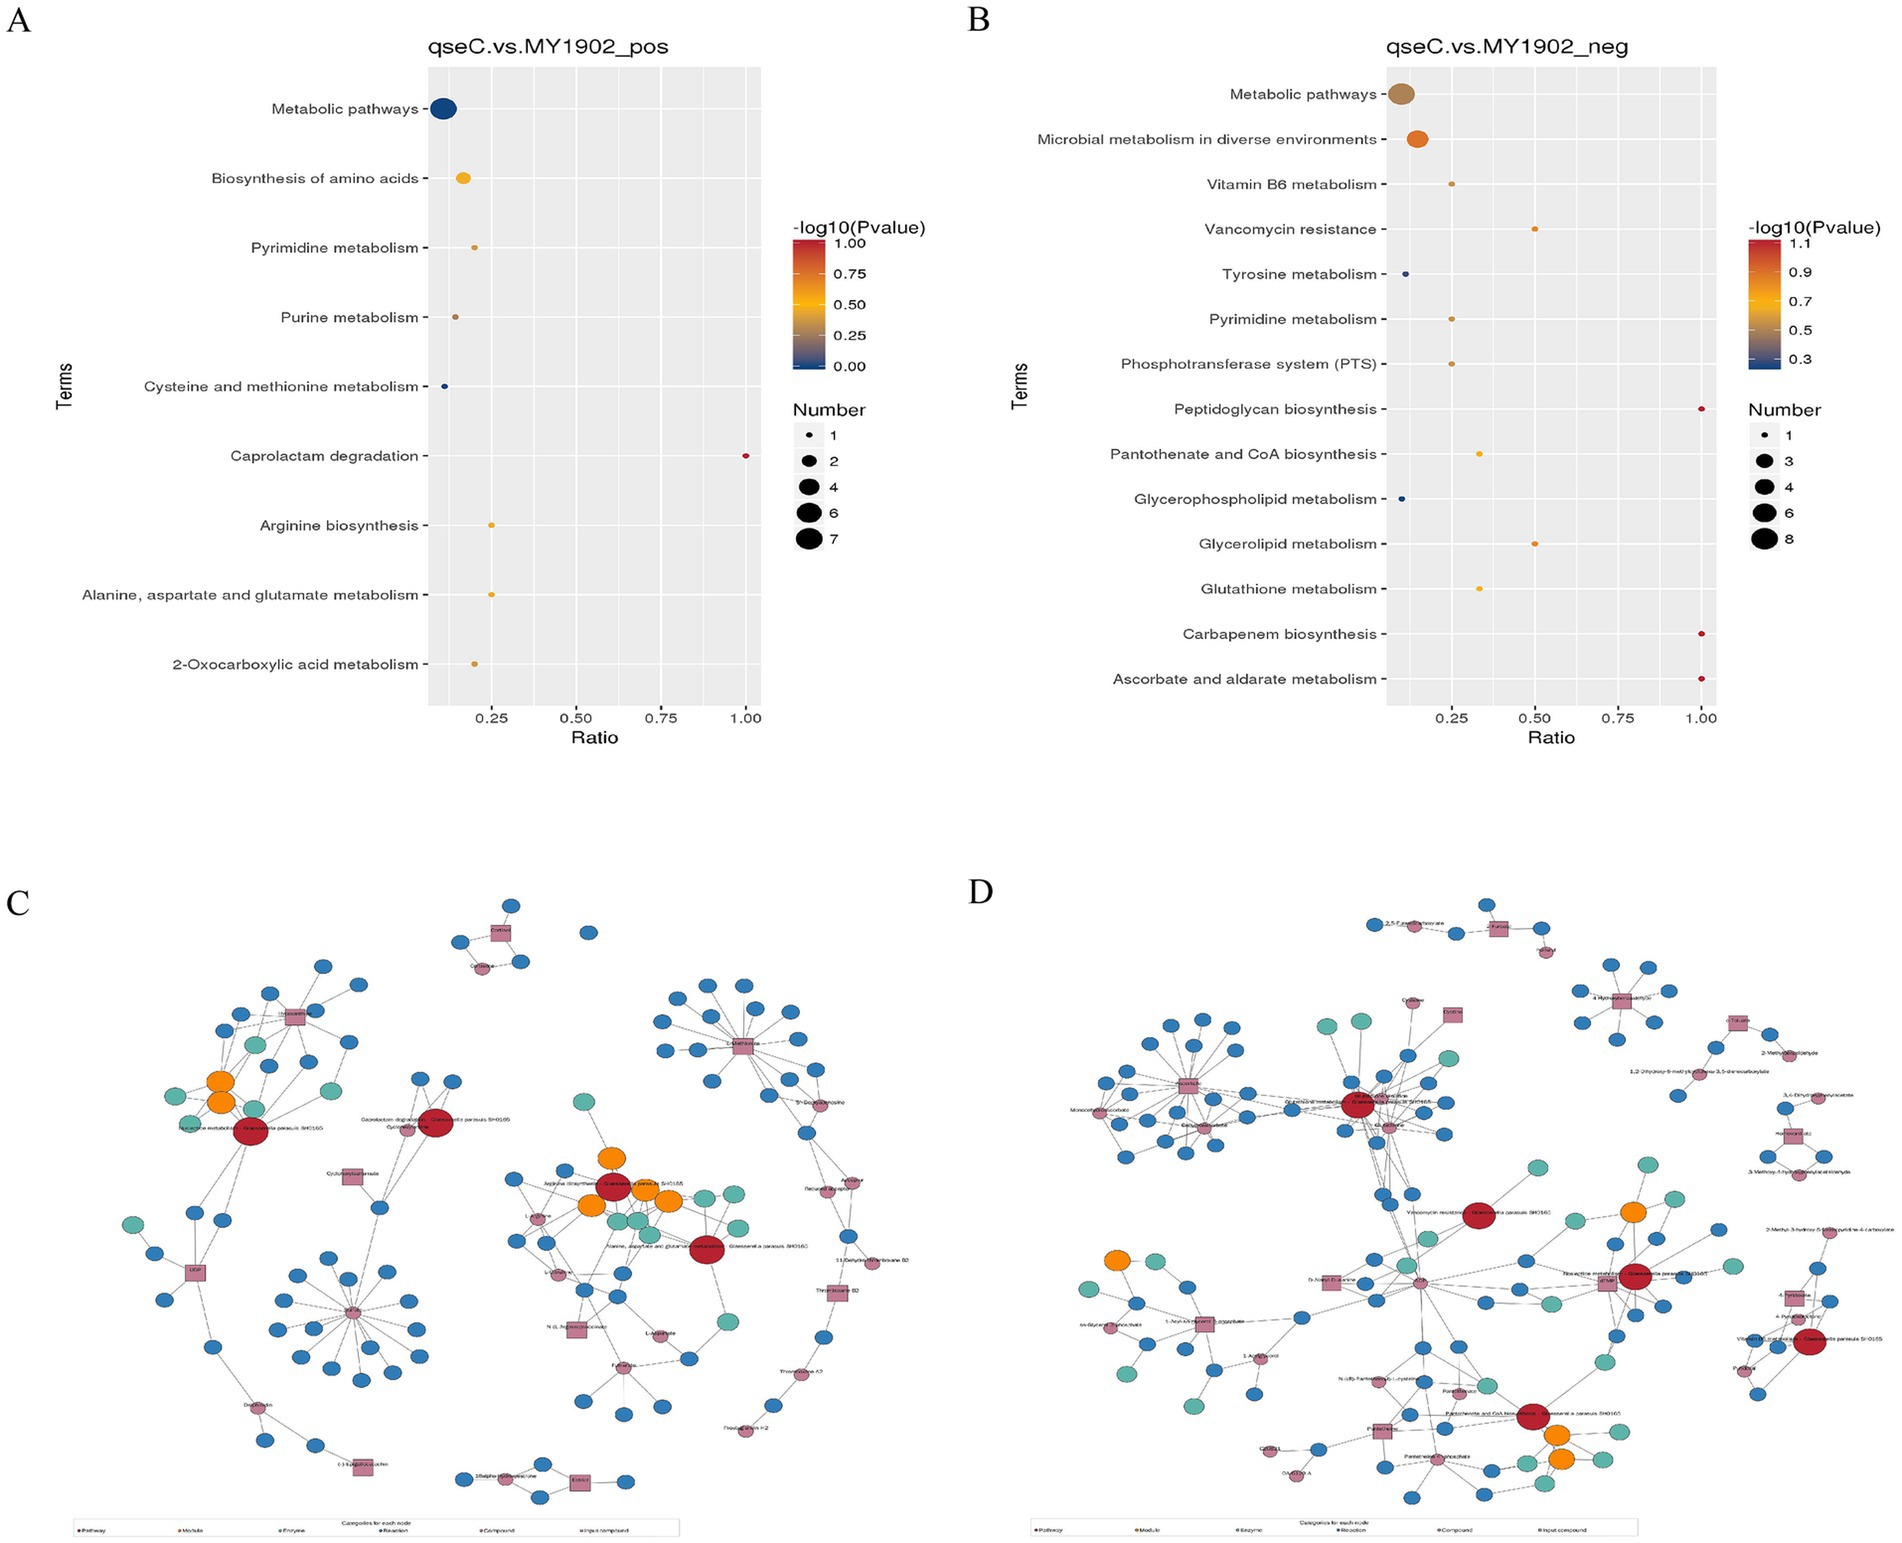
Figure 3. Metabolic pathway dysregulation in ΔqseC. (A,B) Bubble plots showing significantly enriched KEGG pathways (p < 0.05), with dot size indicating metabolite count and color indicating p-value significance. (C,D) Regulatory networks connecting altered pathways (red nodes) to ΔqseC-specific metabolites (purple squares), where lines denote functional relationships to cell structural defects.
3.3 Transcriptome analysis of ΔqseC mutant
Based on QseC’s predicted function as a signal transduction kinase, we hypothesized it directly regulates transcriptional programs for envelope maintenance and stress adaptation. This hypothesis was tested through comparative transcriptomics of WT and ΔqseC strains. The raw transcriptome data have been deposited in the National Center for Biotechnology Information (NCBI) database under the accession number PRJNA1297586.
3.3.1 Sequencing data quantitation
To establish a reliable foundation for detecting transcriptional changes, we first validated RNA-seq data quality and batch effects. The Illumina HiSeq™ 2,500 platform sequenced six samples (three per strain). Wild-type MY1902 produced 14,856,120 clean reads after filtering. The ΔqseC mutant produced 14,932,644 clean reads. Both groups met quality standards (Q20 > 98.99%, error rate 0.01%; Supplementary Table S7). To analyze gene expression, we mapped reads using Bowtie 2. Mapping rates were high (MY1902: 92.04%, ΔqseC: 94.29%). These exceeded the 70% minimum requirement. Multi-mapped reads were below 10% (Supplementary Table S8). This confirmed good reference genome selection and no contamination. We quantified gene expression using FPKM values (Supplementary Table S9). Density plots showed similar expression distributions across samples (Supplementary Figure S3A). PCA analysis clearly separated wild-type and mutant groups (Supplementary Figure S3B). These results confirmed technical robustness and distinct transcriptional states in the mutant.
3.3.2 Differential gene expression analysis
To identify QseC-dependent transcriptional targets, we analyzed differentially expressed genes (DEGs) using DEGseq. This revealed 663 significant DEGs (303 upregulated, 360 downregulated; Figure 4A, Supplementary Tables S10, S11). Hierarchical clustering was performed to group genes with similar expression patterns. The resulting heatmap (Figure 4B) showed distinct clusters. Genes within each cluster likely share related functions. This demonstrated that QseC broadly coordinates transcription of envelope/stress pathways.
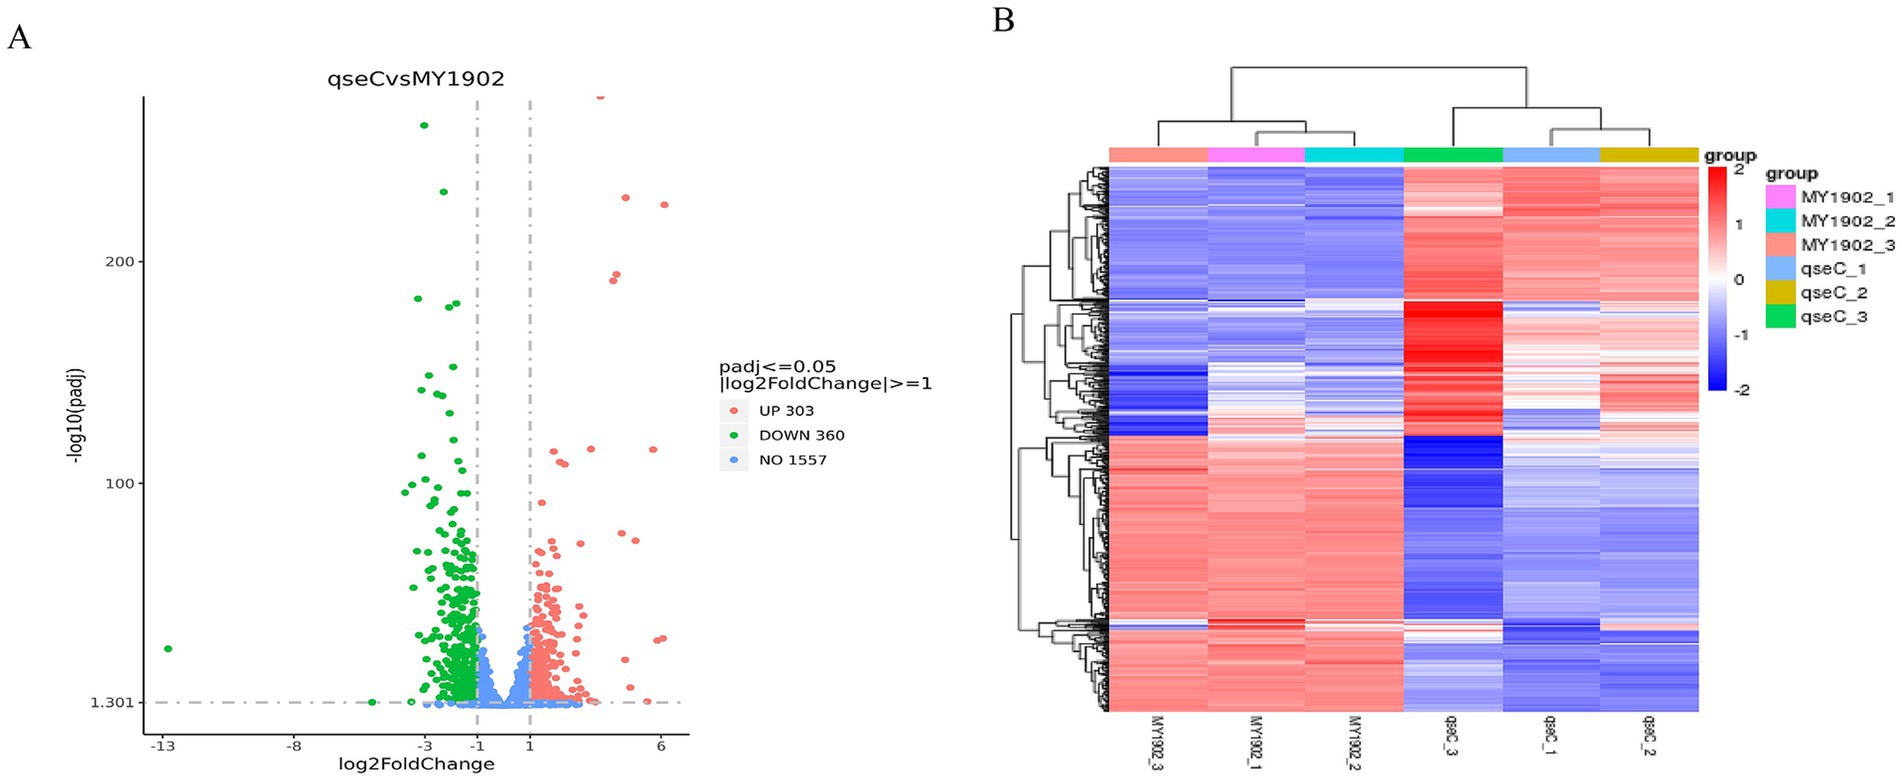
Figure 4. Differential gene analysis. (A) Volcano plot showing DEGs between wild-type and ΔqseC strains. Red dots: upregulated genes. Green dots: downregulated genes. (B) Clustered heatmap of DEG expression patterns. Red indicates high expression. Blue indicates low expression.
3.3.3 Functional enrichment analysis of DEGs
To define biological processes controlled by QseC, we mapped DEGs to functional pathways. The 663 DEGs were assigned to 354 GO terms. Transport-related processes were most prominent, including ion transport and transmembrane transporter activity. Enrichment analysis revealed significant GO terms (Supplementary Table S12), with the top 30 shown in Figure 5A. KEGG pathway analysis mapped these DEGs to 59 pathways. Key enriched pathways included ABC transporters (39 genes), two-component systems (15 genes), and quorum sensing (17 genes). The top 20 enriched pathways are shown in Figure 5B (full results in Supplementary Table S13). These findings validated QseC as a master regulator of signal transduction and envelope homeostasis.
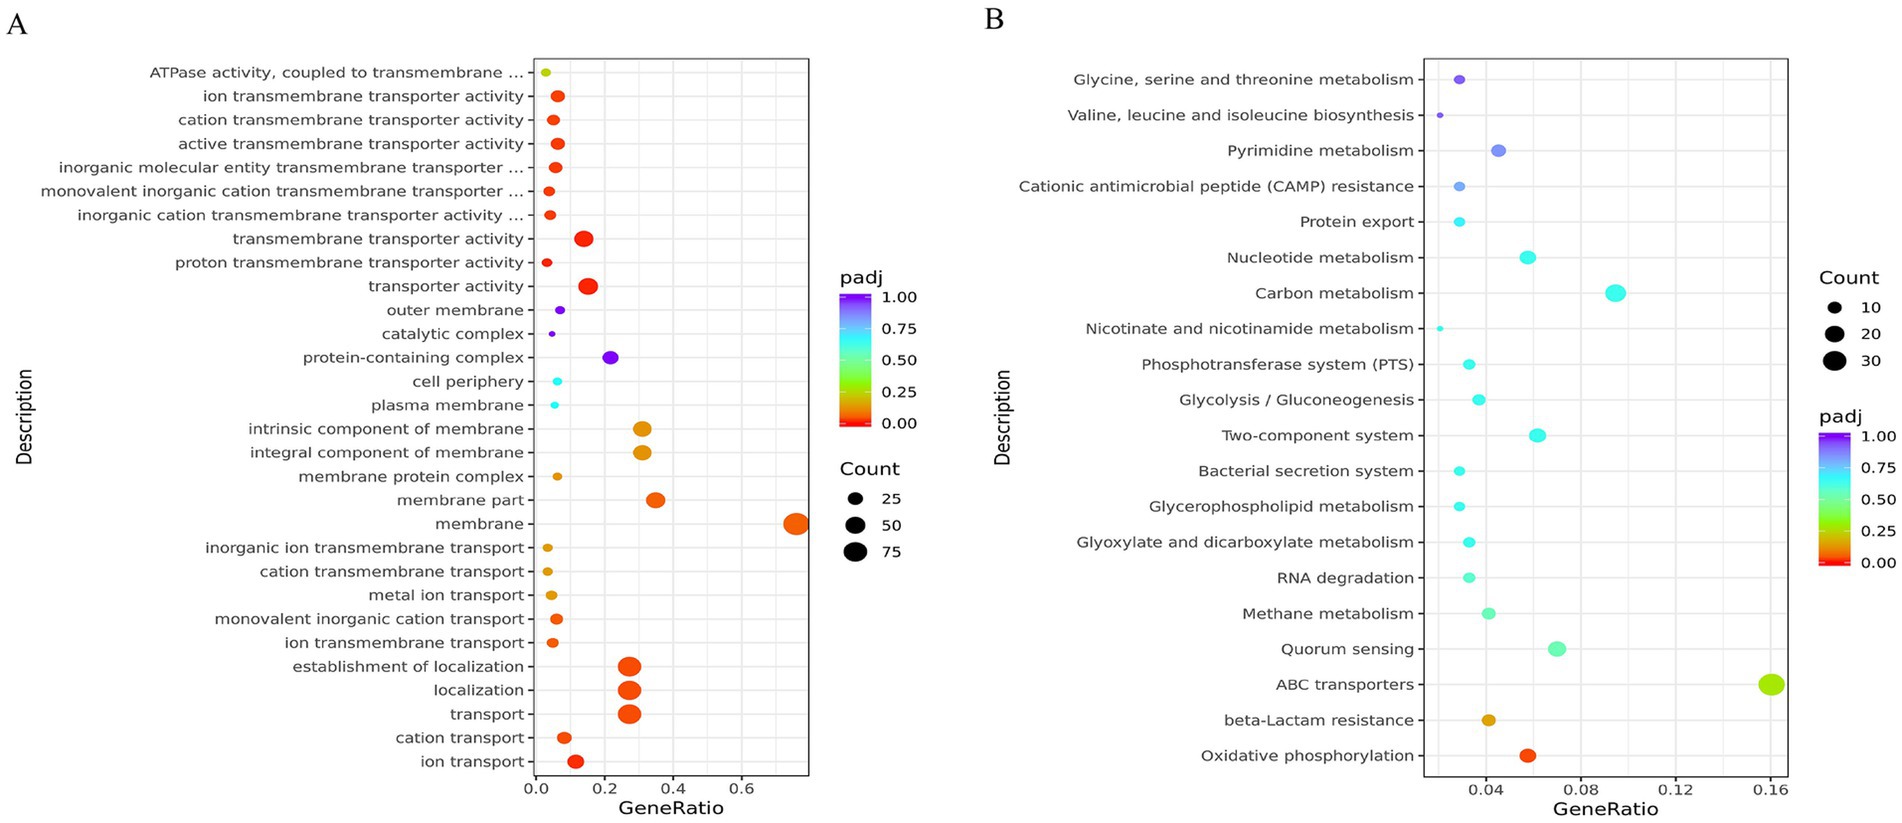
Figure 5. Functional enrichment analysis of differentially expressed genes. (A) GO term enrichment results. Dot color indicates enrichment significance (red = high). Dot size represents gene count. (B) KEGG pathway enrichment results. Color intensity shows enrichment strength (red = strong). Dot size indicates gene numbers. Both analyses reveal biological pathways significantly altered by qseC deletion.
3.3.4 Validation of RNA-seq results by qRT-PCR
We performed qRT-PCR to confirm the reliability of our transcriptome data. Eight differentially expressed genes (four upregulated, four downregulated) were randomly selected. Using 16S rRNA as reference, we measured their expression in both strains. The qRT-PCR results matched the RNA-seq patterns for all eight genes (Figure 6). This independent validation confirmed the accuracy of our transcriptome analysis.
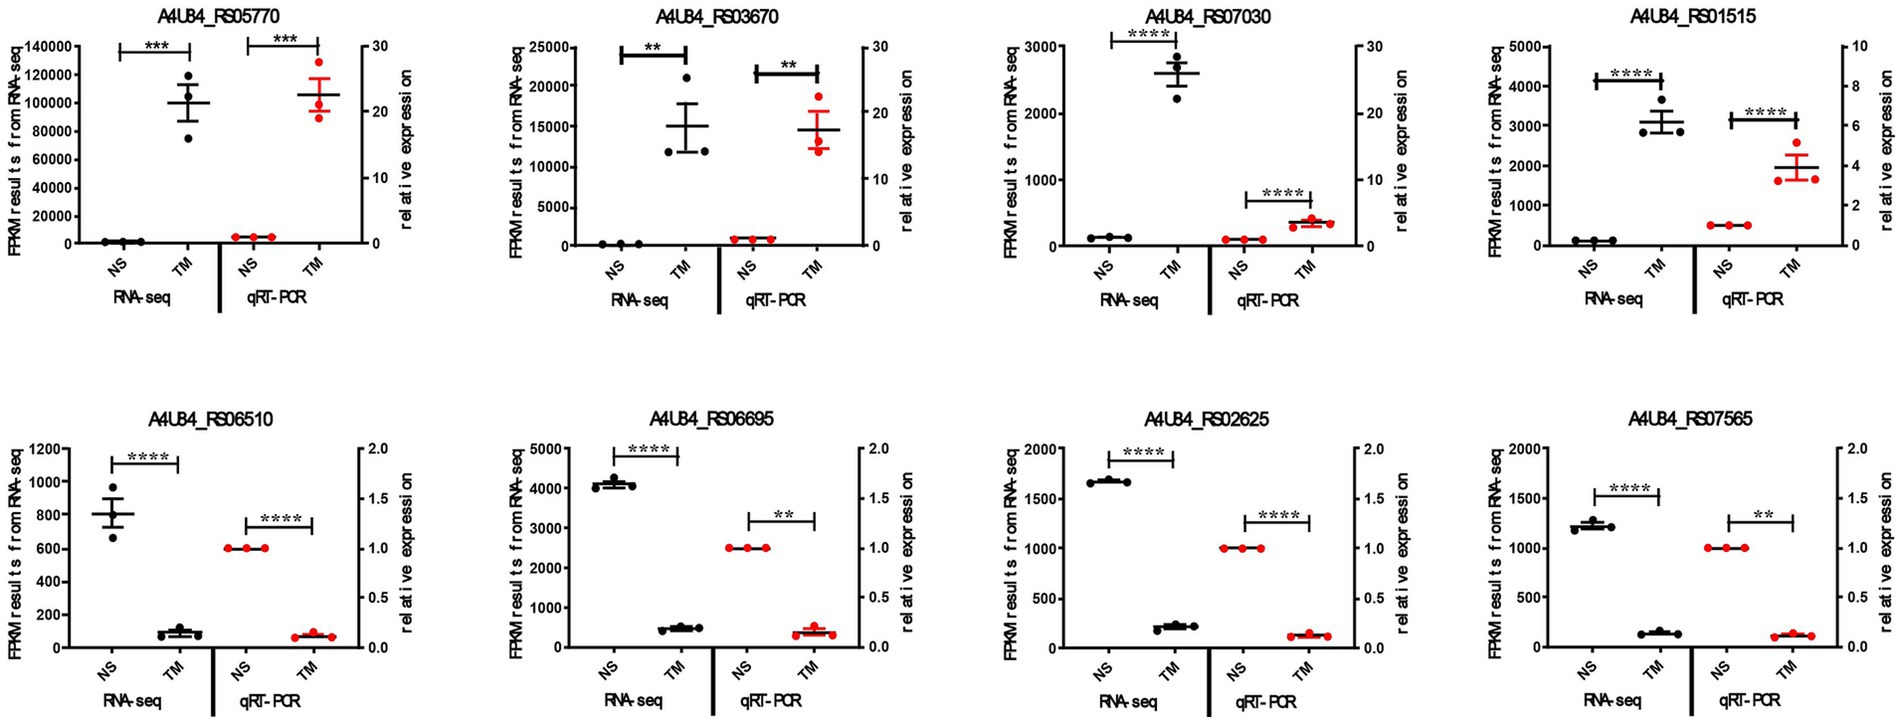
Figure 6. qRT-PCR validation of RNA-seq results. Expression levels of eight DEGs in wild-type vs. ΔqseC strains. Data show mean ± SEM. **p < 0.01, ***p < 0.001, ****p < 0.0001.
3.4 Integrated transcriptome-metabolome analysis
We integrated transcriptomic and metabolomic data to identify regulatory networks affected by qseC deletion. Pearson correlation analysis revealed significant associations between differentially expressed genes and metabolites. The top 50 genes and metabolites with strongest correlations were shown in Figures 7A,B. Key relationships between the top 10 DEGs and top 5 metabolites were displayed in Figures 7C,D (Supplementary Tables S14, S15). To map shared biological pathways, we analyzed KEGG enrichment. In positive ion mode, co-enriched pathways included amino acid and purine metabolism. In negative ion mode, enriched pathways involved cell wall synthesis and lipid metabolism (Figures 8A,B, Supplementary Tables S16, S17). Integrated visualizations showed coordinated changes in these pathways (Figures 8C,D). These results demonstrated that QseC synchronizes transcriptional and metabolic programs to maintain structural-metabolic coupling.
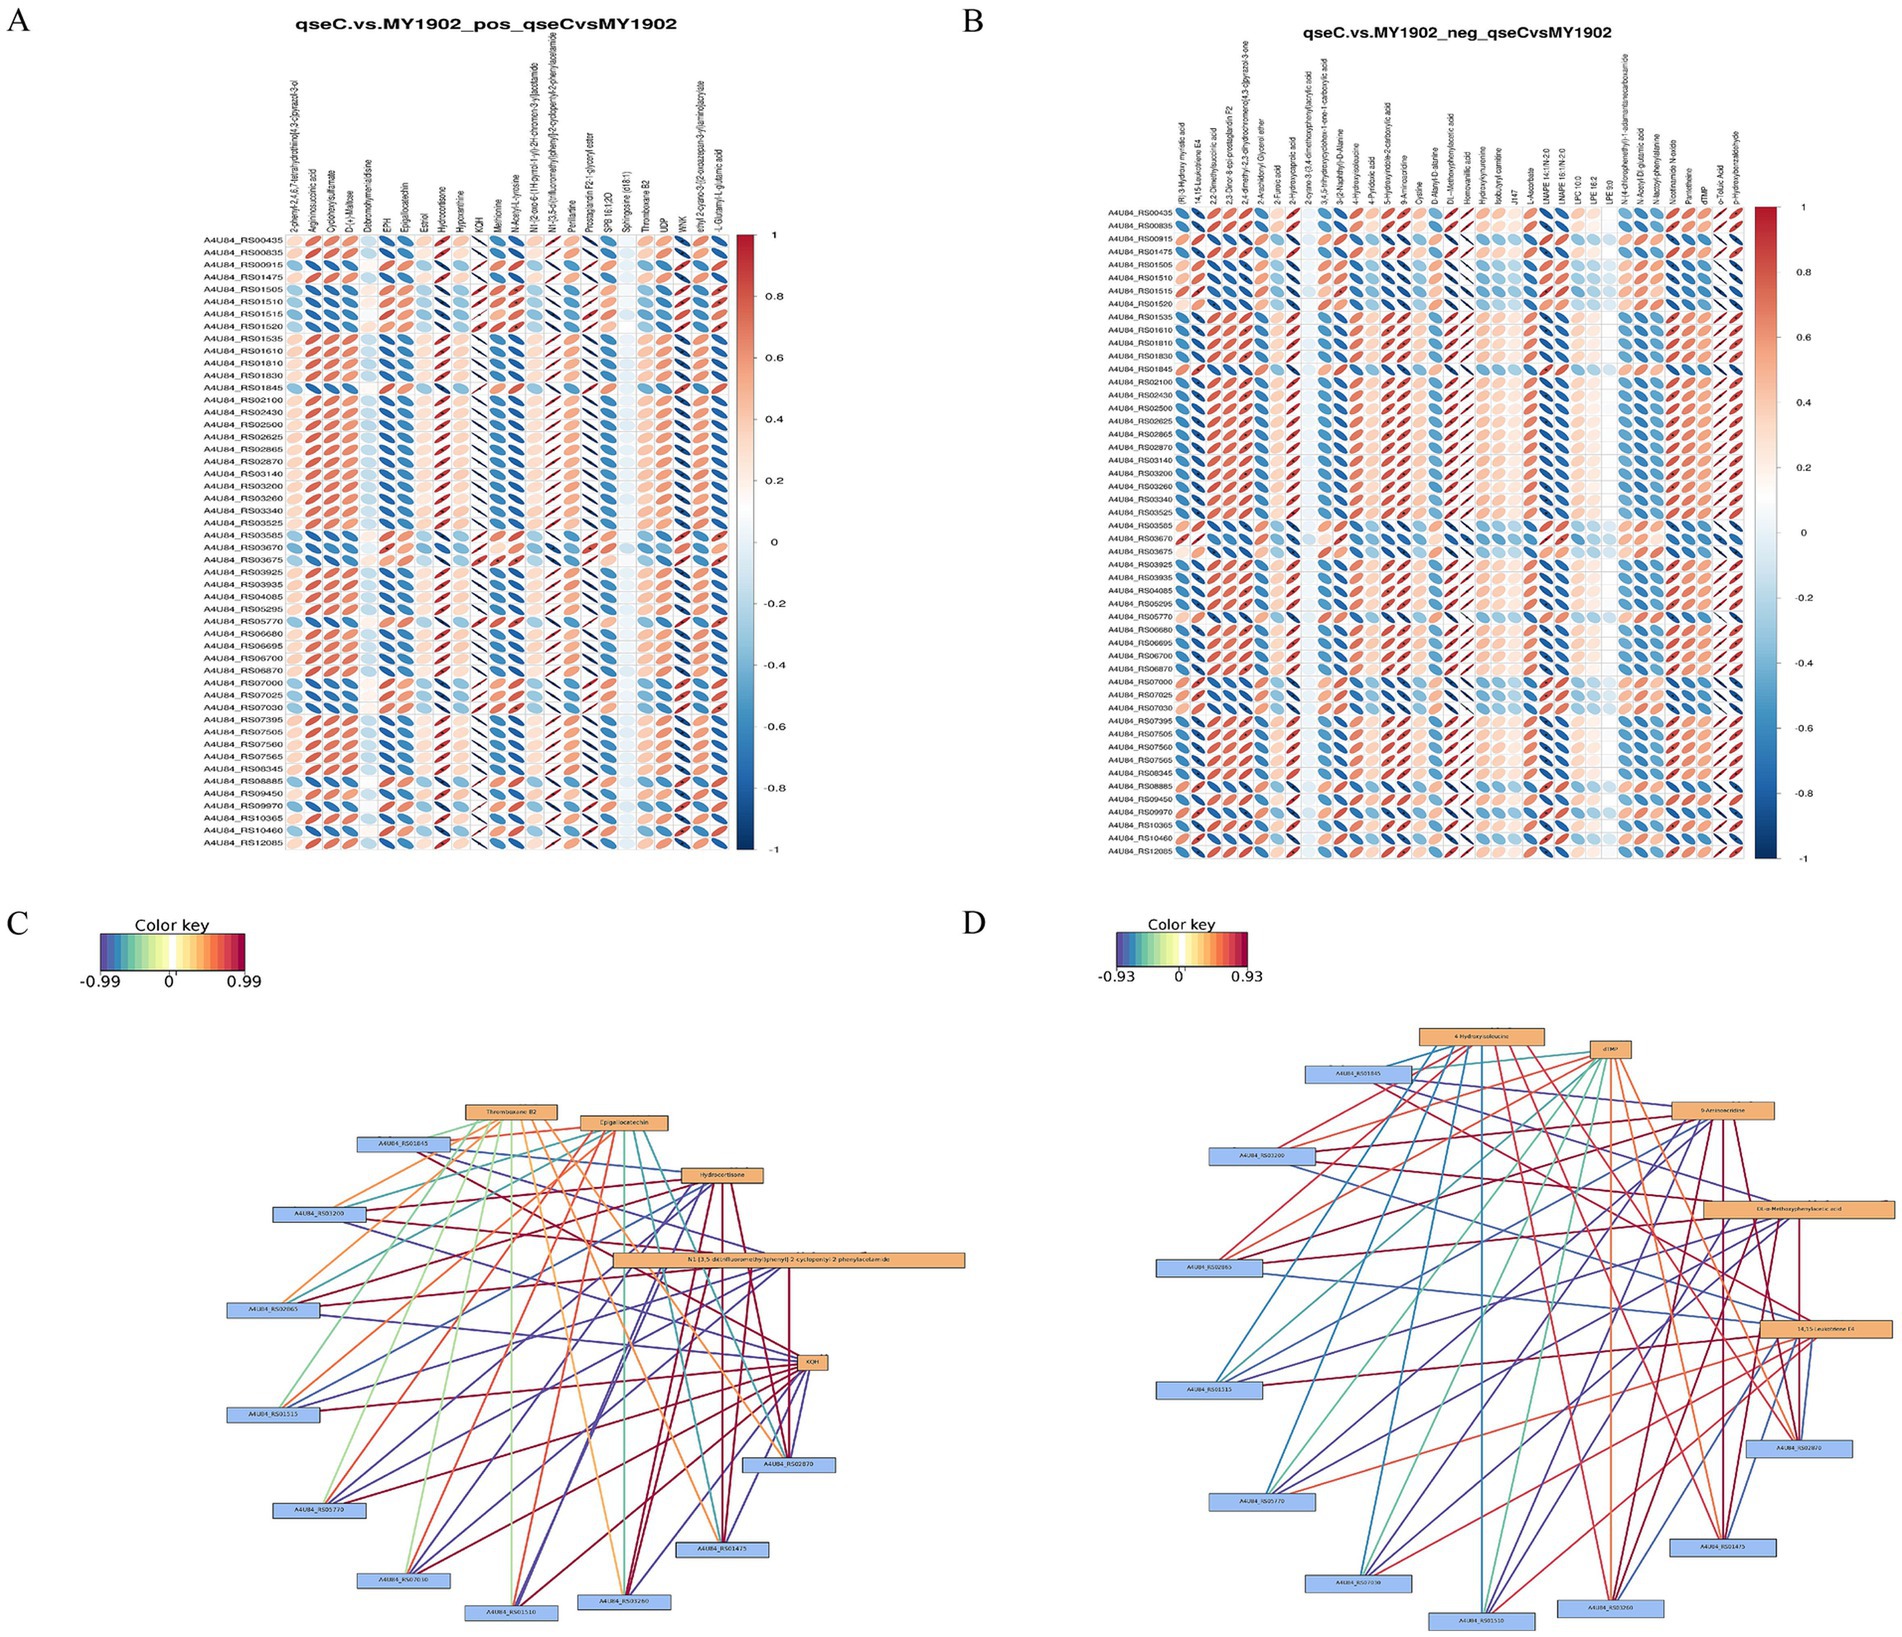
Figure 7. Integrated transcriptome-metabolome correlation analysis identifies qseC-dependent regulatory relationships. (A,B) Correlation heatmaps between differential metabolites and genes in (A) positive and (B) negative ion modes. Vertical axes represent metabolites; horizontal axes represent genes. Blue indicates negative correlations, red indicates positive correlations. Matrices display top 500 entities sorted by ascending p-value. (C,D) Interaction networks of key molecular relationships in (C) positive and (D) negative modes. Yellow boxes denote metabolites; blue boxes denote genes. Line colors reflect correlation strength (red indicates positive, blue indicates negative), with darker hues representing stronger correlations.
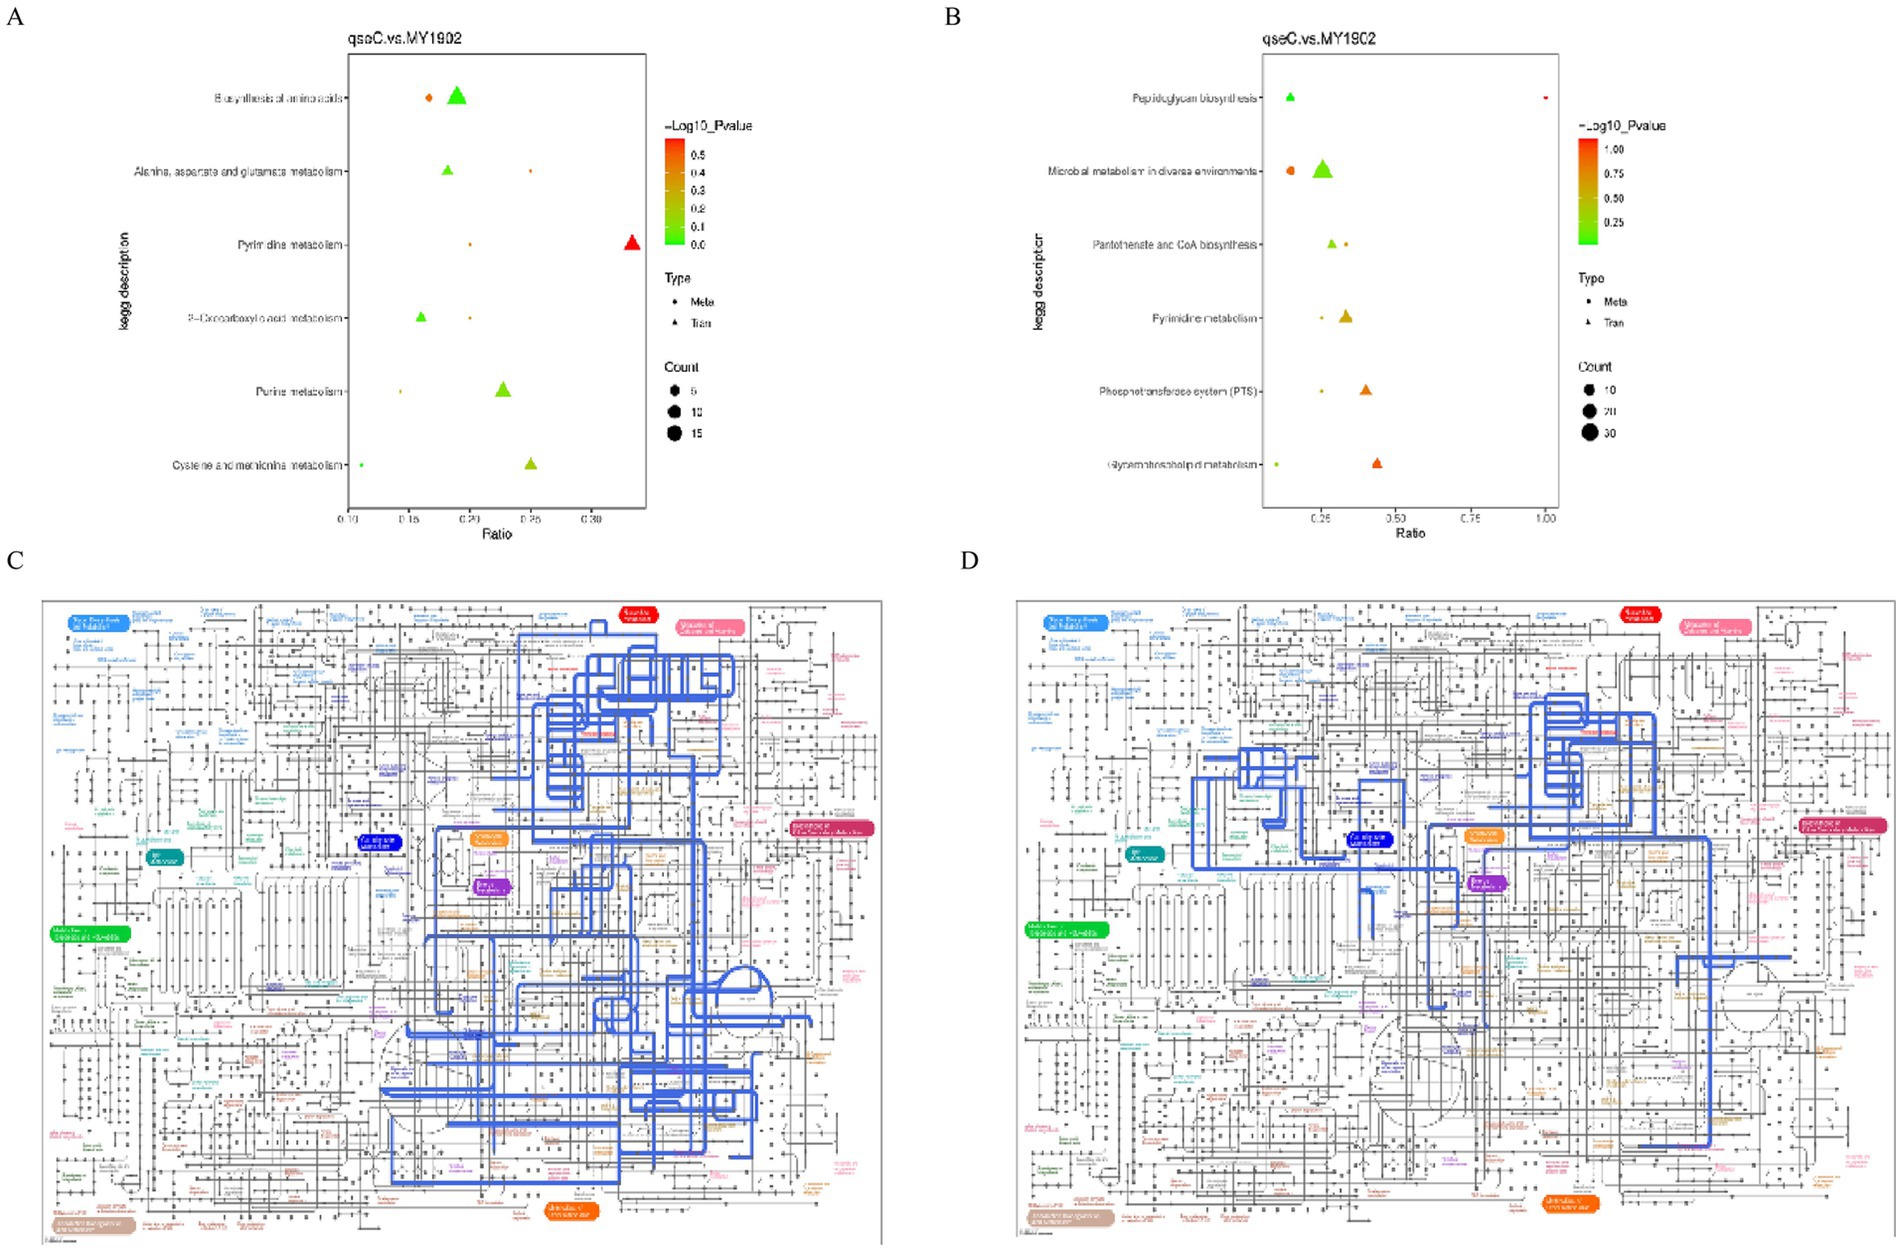
Figure 8. Integrated pathway analysis reveals qseC-dependent disruption of metabolic networks. (A,B) KEGG enrichment bubble plots for co-altered biomolecules in (A) positive and (B) negative ion modes. Horizontal axes represent enrichment ratio (rich factor); vertical axes list significantly enriched pathways (p < 0.05). Bubble size corresponds to biomolecule count; color intensity indicates statistical significance (brighter red indicates lower p-value). (C,D) IPath metabolic network mapping of consensus pathways in (C) positive and (D) negative modes. Nodes represent metabolites/enzymes; edges indicate biochemical reactions. Blue-highlighted routes denote pathways with coordinated transcriptome-metabolome alterations validated in (A,B).
Environmental stressors activated the histidine kinase QseC, triggering phosphorylation of response regulator QseB. This phosphorylation drove transcriptional reprogramming with upregulation of membrane genes plsB and wecA, and downregulation of hrpA and pilW. Concurrent metabolic changes showed increased epigallocatechin and KQH alongside decreased thromboxane B2. Transmission electron microscopy confirmed membrane damage in ΔqseC mutants, linking this network to cell integrity maintenance. Loss of QseC function caused impaired biofilm formation, reduced stress resistance and compromised osmotic tolerance. Figure 9 illustrated this QseC-dependent regulatory pathway, confirming its role in bacterial adaptability through coordinated transcriptomic-metabolic control. The cell signal transduction pathway map was created with BioGDP.com (Jiang et al., 2024).
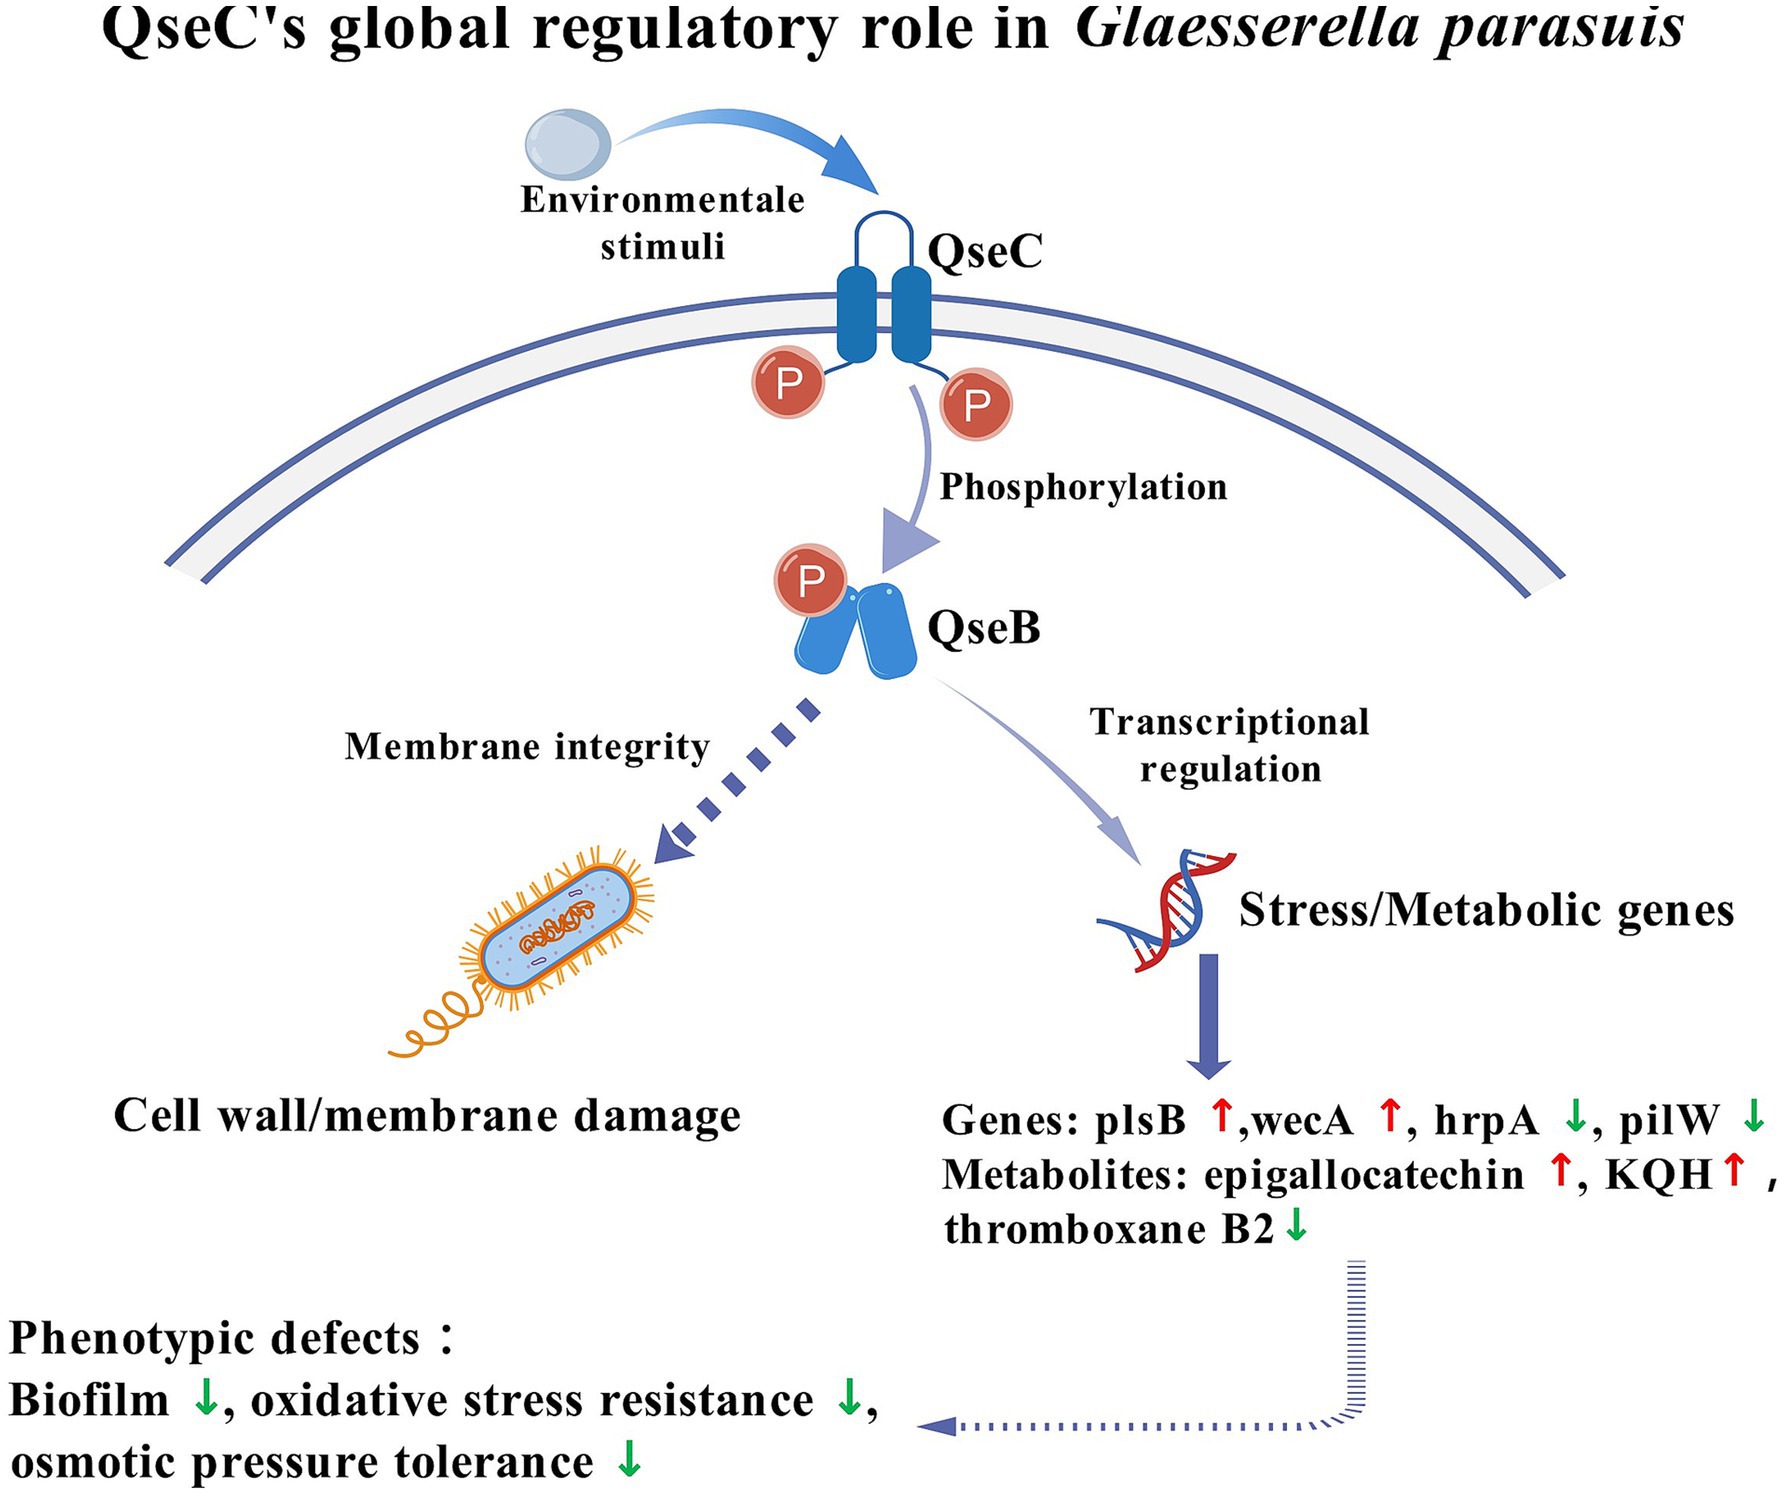
Figure 9. QseC mediated environmental adaptation and toxicity regulation network.
4 Discussion
The QseB/QseC system plays a key role in regulating virulence in Enterobacteriaceae and Pasteurellaceae (Weigel and Demuth, 2016). Research on virulence factors and pathogenic mechanisms of G. parasuis remains limited. In our study, natural transformation was employed to generate a double-gene knockout strain (ΔqseBC). Then we tested SC1401 and ΔqseBC with H2O2, high-concentration NaCl, and high-temperature. The results demonstrated that qseB/C deletion reduced osmotic pressure tolerance, oxidative stress resistance, and thermotolerance in G. parasuis, while impairing biofilm formation, serum bactericidal resistance, and antibiotic susceptibility (He et al., 2022).
Sequence alignment revealed high QseC homology across pathogenic bacteria, including G. parasuis, Actinobacillus pleuropneumoniae, Haemophilus influenzae, Salmonella, and Escherichia coli. Structural predictions confirmed conservation of critical amino acid residues in QseC among these species (He et al., 2018). Our findings established QseC’s involvement in stress adaptation, iron transport, and biofilm dynamics in G. parasuis, though its mechanistic role during host infection requires further investigation. Transmission electron microscopy revealed significant ultrastructural damage in ΔqseC, including localized cell wall/membrane dissolution, cytoplasmic detachment, and reduced cytoplasmic density compared to MY1902. These structural defects highlight QseC’s essential role in maintaining cellular integrity and metabolic homeostasis, potentially increasing susceptibility to environmental stressors.
Transcriptomic sequencing of MY1902 and ΔqseC using the Illumina platform identified 291 significantly differentially expressed genes (DEGs), comprising 107 upregulated and 184 downregulated genes. The upregulated genes in ΔqseC included djlA, dusC, ushA, plsB, oppB, oppC, wecAt, and ruA, etc. DjlA is a co-chaperone protein of the DnaJ family, and its overexpression enhances colanic acid capsule production in Escherichia coli by activating the Rcs phosphate relay system (Schachterle et al., 2018; Clarke et al., 1997). Michou et al. developed the Escherichia coli strain SuptoxD to optimize membrane protein production. This engineered strain addresses two critical challenges through djlA co-expression: (1) mitigating membrane protein overexpression toxicity, and (2) enhancing yield of properly folded membrane proteins (Michou et al., 2020). Researchers proposed a novel substrate recognition mechanism utilizing a small adapter molecule for Dus (TthDusC) in Thermus thermophilus. The crystal structure of Escherichia coli DusC (EcoDusC) comprises two domains: an N-terminus catalytic domain and a C-terminus tRNA binding domain (Chen et al., 2013). In E. coli, DusB and DusC may require in vivo cofactors for oxidation–reduction reactions, analogous to the NADH/Cbr1/Dph3 electron donor system in mcm5s2U34 biosynthesis biosynthesis (Lea-Marie et al., 2024). UshA functions as a 5′-nucleotidase, UDP-sugar hydrolase, and CDP-alcohol hydrolase, facilitating virulence factors expression and host immune evasion (Ribeiro and Cameselle, 2023). PlsB, a membrane-bound enzyme essential for unsaturated fatty acid biosynthesis, is extensively characterized in microbial systems. Both Vibrio cholerae FadR and Escherichia coli FadR bind to the plsB promoter region in Vibrio cholerae, with long-chain fatty acyl CoA thioesters reversing this binding (Feng and Cronan, 2011). As a plsB transcriptional repressor, FadR critically regulates LPS synthesis by modulating fatty acid precursor availability (Noga et al., 2020). The OppABCD complex (a type I ABC transporter) mediates low molecular weight peptide import for nutrient acquisition and host immune modulation (Yang et al., 2024). OppABCD consists of C-class substrate binding protein (SBP) OppA, transmembrane components OppB and OppC, and ATPase OppD containing two nucleotide binding domains (NBDs). In E. coli, five opp genes are arranged in an oppABCDF operon. The coding sequence of oppA and the early part of oppB have multiple promoter-like regions. This has sparked interest in whether oppBCDF and oppA can be transcribed separately. Masulis et al. demonstrated OppB’s autonomous transcriptional regulation under cationic peptide protamine exposure (Masulis et al., 2020). The phosphotransferase WecA of Mycobacterium tuberculosis initiates arabinogalactan biosynthesis and is considered a target of the anti-tuberculosis drug candidate CPZEN-45 (a Kapuzamycin derivative) (Huszár et al., 2017). CpxAR promotes growth, stress resistance, and virulence of Actinobacillus pleuropneumoniae by upregulating wecA transcription (Yan et al., 2020). The truA gene is essential for type III secretion gene expression in Pseudomonas aeruginosa (Ahn et al., 2004). Downregulated genes in ΔqseC included hrpA, lptA, metF, recA, dnaJ and dnaK, tolA, pilW, znuA, fur, and groL., etc. HrpA plays a crucial role in meningococcal infection and neuronal cell transport, regulating the apoptosis-pyroptosis balance (Talà et al., 2022). In Escherichia coli, HrpA serves as a ribosome rescue factor through its DexH-box ATPase and 3′–5′ RNA helicase activities, resolving ribosome stalling caused by aberrant peptides or antibiotic effects (Campbell et al., 2024). LptA and LptC form an LPS transport complex. This complex moves LPS from the inner to outer membrane. Blocking their interaction causes membrane defects and cell death. These proteins represent therapeutic targets against Gram-negative pathogens (Dai et al., 2021). Neisseria gonorrhoeae lptA mutants showed heightened neutrophil susceptibility (Handing and Criss, 2015). MetF serves as an essential GroEL/ES substrate (Singh et al., 2020). Our study found that metF disruption increased bacterial L-lysine production from methanol (Ishikawa et al., 2008). RecD2 regulates replication restart. It inhibits RecA-mediated chain exchange through precursor filament suppression (Ramos et al., 2022). SOS pathway activation requires RecA-LexA interaction. This interaction generates signals via ATP/ssDNA-dependent oligomerization (Cory et al., 2022). In E. coli, DnaK collaborates with DnaJ and GrpE (To et al., 2022). These chaperones ensure correct protein folding (Bhandari and Houry, 2015). The Tol-Pal complex maintains cell envelope integrity. It contains three inner membrane proteins (TolA, TolQ, TolR), periplasmic TolB, and outer membrane Pal. TolA domains recognize division sites independently. The intermediate domain (TolAII) directs contraction site localization. TolAI recruitment requires TolQ. TolAIII recruitment needs TolB, Pal, and CpoB together (Hale et al., 2022). Tol-Pal complex maintains cell envelope integrity. It contains three inner membrane proteins (TolA, TolQ, TolR), periplasmic TolB, and outer membrane Pal (Baccelli et al., 2022). PilW enables natural transformation in Streptococcus thermophilus. It also facilitates T4P extrusion through ATPase DNA linkage (Yaman and Averhoff, 2021). PilW and PilV form core TfP subunits in acidophilic bacteria. These resemble P. aeruginosa PAO1 components (Alfaro-Saldaña et al., 2019). FUR proteins maintain prokaryotic metal homeostasis. They bind specific metals: iron (Fur), zinc (Zur), manganese (Mur), or nickel (Nur) (Steingard and Helmann, 2023). Their DNA interactions with auxiliary regulators fine-tune iron metabolism. These pathways are critical for virulence (Sevilla et al., 2021).
This study demonstrated the systematic impact of qseC deletion on G. parasuis through integrated untargeted metabolomics. In positive ion mode, methionine exhibited significant upregulation, indicating enhanced methyl donor metabolism (S-adenosylmethionine cycle) and antioxidant pathways (eglutathione synthesis) as responses to oxidative stress. Concurrent UDP precursor downregulation correlated with impaired peptidoglycan biosynthesis, consistent with QseC’s established role in maintaining cell wall integrity. Negative ion mode data revealed central lipid metabolism dysregulation, where elevated lysophosphatidylcholine species (LNAPE 14:1/N-2:0) suggested adaptive membrane remodeling. Pantetheine depletion reflected disrupted coenzyme A biosynthesis, potentially compromising energy homeostasis by restricting β-oxidation and acetylation-dependent secondary metabolism. This metabolic perturbation aligned with QseC’s proposed regulatory function in carbon utilization. Furthermore, cysteine downregulation implied redox imbalance, potentially activating thiol-mediated redox buffering systems to preserve intracellular reducing conditions.
Our integrated transcriptome-metabolome analysis identified key molecular relationships through expression correlation between differentially expressed genes and metabolites. The top five metabolites included: thromboxane B2 (0.99-fold downregulation), epigallocatechin (2.43-fold upregulation), hydrocortisone (0.84-fold downregulation), N1-[3,5-di(trifluoromethyl)phenyl]-2-cyclopentyl-2-phenylacetamide (0.67-fold downregulation), and KQH (2.32-fold upregulation). Corresponding top differentially expressed genes comprised: plsB (3.7-fold upregulation), A4U84_RS03200 (3.03-fold downregulation), cysB (2.23-fold downregulation), A4U84_RS01515 (4.67-fold upregulation), A4U84_RS05770 (6.14-fold upregulation), A4U84_RS07030 (4.3-fold upregulation), dusC (4.18-fold upregulation), A4U84_RS03260 (3.26-fold downregulation), lptB (1.81-fold downregulation), and yjjG (2.08-fold downregulation).
Correlation analysis demonstrated that the significantly upregulated gene plsB exhibited a positive correlation with metabolites such as epigallocatechin and KQH, suggesting its involvement in membrane lipid metabolism regulation and antioxidant defense due to PlsB’s established role in phosphatidic acid biosynthesis. Concurrently, the downregulation cysB and associated genes showed strong negative correlations with thromboxane B2 and hydrocortisone levels, indicating potential impairments in sulfur amino acid metabolism and glucocorticoid-mediated immune regulation pathways. Furthermore, the positive correlation between dusC and both epigallocatechin and KQH implied its functional role in purine salvage pathways and tRNA thiolation modification. These coordinated alterations in metabolic and transcriptional profiles revealed that QseC deletion compromised bacterial antioxidant capacity and immune evasion mechanisms through dysregulation of membrane integrity maintenance, redox homeostasis, and stress response systems. Collectively, these findings established novel insights into QseC’s central role in G. parasuis pathogenicity by orchestrating adaptive responses to environmental challenges.
5 Conclusion
This study comprehensively characterized the impact of qseC deletion on G. parasuis through integrated electron microscopy and multi-omics analysis. Transmission electron microscopy revealed compromised cell wall and membrane integrity in the ΔqseC mutant compared to MY1902, with significantly sparser cytoplasmic density. Metabolomics profiling identified 24 and 36 significantly altered metabolites in positive and negative ion modes respectively, implicating key pathways including oxidative stress response, inflammatory regulation, and membrane lipid metabolism. Transcriptomics analysis detected 663 differentially expressed genes primarily enriched in transport systems, metabolism processes, and signal transduction cascades. Integrated multi-omics correlation confirmed qseC deletion triggers systemic reprogramming of metabolic and transcriptional networks. These findings establish that QseC critically regulates bacterial environmental adaptation and virulence mechanisms by maintaining structural integrity and coordinating stress response pathways. This work provides a mechanistic foundation for developing novel anti-infective strategies targeting the QseC signaling pathway.
Data availability statement
The original contributions presented in the study are publicly available. This data can be found here: https://www.ebi.ac.uk/metabolights/, accession number MTBLS12504; https://www.ncbi.nlm.nih.gov/, accession number PRJNA1297586.
Author contributions
XY: Writing – review & editing, Software, Methodology, Writing – original draft. YZ: Writing – original draft, Software, Data curation. SL: Methodology, Investigation, Writing – review & editing, Conceptualization. CG: Writing – review & editing. WX: Data curation, Writing – review & editing. MZ: Writing – review & editing, Data curation. ZY: Conceptualization, Writing – review & editing. LH: Writing – original draft, Data curation, Methodology, Investigation.
Funding
The author(s) declare that financial support was received for the research and/or publication of this article. This work was sponsored by the Science and Technology Strategic Cooperation Programs of Luzhou Municipal People’s Government and Southwest Medical University (No. 2023LZXNYDPT001), the Scientific Research Projects of Southwest Medical University (No. 2024ZKZ015), the Southwest Medical University 2023 Undergraduate Innovation and Entrepreneurship Training Program (No. 202310632077), and the Sichuan Science and Technology Program (No. 2023NSFSC1553).
Conflict of interest
The authors declare that the research was conducted in the absence of any commercial or financial relationships that could be construed as a potential conflict of interest.
Generative AI statement
The authors declare that no Gen AI was used in the creation of this manuscript.
Any alternative text (alt text) provided alongside figures in this article has been generated by Frontiers with the support of artificial intelligence and reasonable efforts have been made to ensure accuracy, including review by the authors wherever possible. If you identify any issues, please contact us.
Publisher’s note
All claims expressed in this article are solely those of the authors and do not necessarily represent those of their affiliated organizations, or those of the publisher, the editors and the reviewers. Any product that may be evaluated in this article, or claim that may be made by its manufacturer, is not guaranteed or endorsed by the publisher.
Supplementary material
The Supplementary material for this article can be found online at: https://www.frontiersin.org/articles/10.3389/fmicb.2025.1637383/full#supplementary-material
References
Ahn, K. S., Ha, U., Jia, J., Wu, D., and Jin, S. (2004). The truA gene of Pseudomonas aeruginosa is required for the expression of type III secretory genes. Microbiology 150, 539–547. doi: 10.1099/mic.0.26652-0
Alfaro-Saldaña, E., Hernández-Sánchez, A., Patrón-Soberano, O. A., Astello-García, M., Méndez-Cabañas, J. A., and García-Meza, J. V. (2019). Sequence analysis and confirmation of the type IV pili-associated proteins PilY1, PilW and PilV in Acidithiobacillus thiooxidans. PLoS One 14:e0199854. doi: 10.1371/journal.pone.0199854
Baccelli, P., Rachedi, R., Serrano, B., Petiti, M., Bernard, C. S., Houot, L., et al. (2022). Timing of TolA and TolQ recruitment at the septum depends on the functionality of the Tol-pal system. J. Mol. Biol. 434:167519. doi: 10.1016/j.jmb.2022.167519
Bhandari, V., and Houry, W. A. (2015). Substrate interaction networks of the Escherichia coli chaperones: trigger factor, DnaK and GroEL. Adv. Exp. Med. Biol. 883, 271–294. doi: 10.1007/978-3-319-23603-2_15
Campbell, A., Esser, H. F., Maxwell Burroughs, A., Berninghausen, O., Becker, T., Green, R., et al. (2024). The RNA helicase HrpA rescues collided ribosomes in E. coli. bioRxiv. 85, 999–1007. doi: 10.1101/2024.09.11.612461
Castilla, K. S., de, D., Moreno, L. Z., Paixão, R., Coutinho, T., dos, J., et al. (2012). Characterization of Haemophilus parasuis isolated from Brazilian swine through serotyping, AFLP and PFGE. Res. Vet. Sci 92, 366–371. doi: 10.1016/j.rvsc.2011.04.006
Chen, M., Yu, J., Tanaka, Y., Tanaka, M., Tanaka, I., and Yao, M. (2013). Structure of dihydrouridine synthase C (DusC) from Escherichia coli. Acta Crystallogr. Sect. F. Struct. Biol. Cryst. Commun. 69, 834–838. doi: 10.1107/S1744309113019489
Clarke, D. J., Holland, I. B., and Jacq, A. (1997). Point mutations in the transmembrane domain of DjlA, a membrane-linked DnaJ-like protein, abolish its function in promoting colanic acid production via the Rcs signal transduction pathway. Mol. Microbiol. 25, 933–944. doi: 10.1111/j.1365-2958.1997.mmi528.x
Cory, M. B., Li, A., Hurley, C. M., Hostetler, Z. M., Venkatesh, Y., Jones, C. M., et al. (2022). Engineered RecA constructs reveal the minimal SOS activation complex. Biochemistry 61, 2884–2896. doi: 10.1021/acs.biochem.2c00505
Curtis, M. M., Russell, R., Moreira, C. G., Adebesin, A. M., Wang, C., Williams, N. S., et al. (2014). QseC inhibitors as an antivirulence approach for gram-negative pathogens. MBio 5:e02165. doi: 10.1128/mBio.02165-14
Dai, X., Zhu, X., Si, S., Li, Y., and Yuan, L. (2021). Development of a BLI assay-based method for detecting LptA/LptC interaction. Sheng Wu Gong Cheng Xue Bao 37, 3300–3309. doi: 10.13345/j.cjb.200709
Feng, Y., and Cronan, J. E. (2011). The Vibrio cholerae fatty acid regulatory protein, FadR, represses transcription of plsB, the gene encoding the first enzyme of membrane phospholipid biosynthesis. Mol. Microbiol. 81, 1020–1033. doi: 10.1111/j.1365-2958.2011.07748.x
Fernandez-Ciruelos, B., Potmis, T., Solomin, V., and Wells, J. M. (2023). Cross-talk between QseBC and PmrAB two-component systems is crucial for regulation of motility and colistin resistance in Enteropathogenic Escherichia coli. PLoS Pathog. 19:e1011345. doi: 10.1371/journal.ppat.1011345
Hadjifrangiskou, M., Kostakioti, M., Chen, S. L., Henderson, J. P., Greene, S. E., and Hultgren, S. J. (2011). A central metabolic circuit controlled by QseC in pathogenic Escherichia coli. Mol. Microbiol. 80, 1516–1529. doi: 10.1111/j.1365-2958.2011.07660.x
Hale, C. A., Persons, L., and de Boer, P. A. J. (2022). Recruitment of the TolA protein to cell constriction sites in Escherichia coli via three separate mechanisms, and a critical role for FtsWI activity in recruitment of both TolA and TolQ. J. Bacteriol. 204:e0046421. doi: 10.1128/jb.00464-21
Handing, J. W., and Criss, A. K. (2015). The lipooligosaccharide-modifying enzyme LptA enhances gonococcal defence against human neutrophils. Cell. Microbiol. 17, 910–921. doi: 10.1111/cmi.12411
He, L., Dai, K., Wen, X., Ding, L., Cao, S., Huang, X., et al. (2018). QseC mediates osmotic stress resistance and biofilm formation in Haemophilus parasuis. Front. Microbiol. 9:212. doi: 10.3389/fmicb.2018.00212
He, L., Yan, X., Wen, X., Cao, S., Huang,, Xiao, W., et al. (2022). Construction and biological characteristic of Glaesserella parasuis strain with qseB, qseC double gene deletion. Acta Vet. Zootech. Sin. 2:53. doi: 10.11843/i.issn.0366-6964.2022.02.019
Huszár, S., Singh, V., Polčicová, A., Baráth, P., Barrio, M. B., Lagrange, S., et al. (2017). N-Acetylglucosamine-1-phosphate transferase, WecA, as a validated drug target in Mycobacterium tuberculosis. Antimicrob. Agents Chemother. 61, e01310–e01317. doi: 10.1128/AAC.01310-17
Ishikawa, K., Asahara, T., Gunji, Y., Yasueda, H., and Asano, K. (2008). Disruption of metF increased L-lysine production by Methylophilus methylotrophus from methanol. Biosci. Biotechnol. Biochem. 72, 1317–1324. doi: 10.1271/bbb.70818
Jiang, S., Li, H., Zhang, L., Mu, W., Zhang, Y., Chen, T., et al. (2024). Generic diagramming platform (GDP): a comprehensive database of high-quality biomedical graphics. Nucleic Acids Res. 53, D1670–D1676. doi: 10.1093/nar/gkae973
Lea-Marie, K., Simone, Z., Virginie, M., Bourguignon, V., Sudol, C., Brégeon, D., et al. (2024). Differential redox sensitivity of tRNA dihydrouridylation. Nucleic Acids Res. 21, 12784–12797. doi: 10.1093/nar/gkae964
Masulis, I. S., Sukharycheva, N. A., Kiselev, S. S., Andreeva, Z. S., and Ozoline, O. N. (2020). Between computational predictions and high-throughput transcriptional profiling: in depth expression analysis of the OppB trans-membrane subunit of Escherichia coli OppABCDF oligopeptide transporter. Res. Microbiol. 171, 55–63. doi: 10.1016/j.resmic.2019.10.005
Michou, M., Stergios, A., and Skretas, G. (2020). SuptoxD20: a second-generation engineered Escherichia coli strain achieving further enhanced levels of recombinant membrane protein production. Biotechnol. Bioeng. 117, 2434–2445. doi: 10.1002/bit.27378
Neil, D., McKay, K., L'Ecuyer, C., and Corner, A. H. (1969). Glasser's disease of swine produced by the intratracheal inoculation of Haemophilus suis. Can. J. Comp. Med. 33, 187–193
Noga, M. J., Büke, F., van den Broek, N. J. F., Imholz, N. C. E., Scherer, N., Yang, F., et al. (2020). Posttranslational control of PlsB is sufficient to coordinate membrane synthesis with growth in Escherichia coli. MBio 11:e02703-19. doi: 10.1128/mBio.02703-19
Oliveira, S., and Pijoan, C. (2004). Haemophilus parasuis: new trends on diagnosis, epidemiology and control. Vet. Microbiol. 99, 1–12. doi: 10.1016/j.vetmic.2003.12.001
Ramos, C., Hernández-Tamayo, R., López-Sanz, M., Carrasco, B., Serrano, E., Alonso, J. C., et al. (2022). The RecD2 helicase balances RecA activities. Nucleic Acids Res. 50, 3432–3444. doi: 10.1093/nar/gkac131
Rasko, D. A., Moreira, C. G., Li, D. R., Reading, N. C., Ritchie, J. M., Waldor, M. K., et al. (2008). Targeting QseC signaling and virulence for antibiotic development. Science 321, 1078–1080. doi: 10.1126/science.1160354
Ribeiro, J. M., and Cameselle, J. C. (2023). Genomic distribution of ushA-like genes in Bacteria: comparison to cpdB-like genes. Genes 14:47. doi: 10.3390/genes14081657
Rooks, M. G., Veiga, P., Reeves, A. Z., Lavoie, S., Yasuda, K., Asano, Y., et al. (2017). QseC inhibition as an antivirulence approach for colitis-associated bacteria. Proc. Natl. Acad. Sci. USA. 114, 142–147. doi: 10.1073/pnas.1612836114
Schachterle, J. K., Stewart, R. M., Schachterle, M. B., Calder, J. T., Kang, H., Prince, J. T., et al. (2018). Yersinia pseudotuberculosis BarA-UvrY two-component regulatory system represses biofilms via CsrB. Frontiers in cellular and infection. Microbiology 8:8. doi: 10.3389/fcimb.2018.00323
Segalés, J., Domingo, M., Solano, G. I., and Pijoan, C. (1997). Immunohistochemical detection of Haemophilus parasuis serovar 5 in formalin-fixed, paraffin-embedded tissues of experimentally infected swine. J. Vet. Diagn. Invest. 9, 237–243. doi: 10.1177/104063879700900303
Sevilla, E., Bes, M. T., Peleato, M. L., and Fillat, M. F. (2021). Fur-like proteins: beyond the ferric uptake regulator (Fur) paralog. Arch. Biochem. Biophys. 701:108770. doi: 10.1016/j.abb.2021.108770
Singh, A. K., Balchin, D., Imamoglu, R., Hayer-Hartl, M., and Hartl, F. U. (2020). Efficient catalysis of protein folding by GroEL/ES of the obligate chaperonin substrate MetF. J. Mol. Biol. 432, 2304–2318. doi: 10.1016/j.jmb.2020.02.031
Sperandio, V., Alfredo, G. T., and James, B. K. (2002). Quorum sensing Escherichia coli regulators B and C (QseBC): a novel two-component regulatory system involved in the regulation of flagella and motility by quorum sensing in E. coli. Mol. Microbiol. 43, 809–821. doi: 10.1046/j.1365-2958.2002.02803.x
Steingard, C. H., and Helmann, J. D. (2023). Meddling with metal sensors: Fur-family proteins as signaling hubs. J. Bacteriol. 205:e0002223. doi: 10.1128/jb.00022-23
Stock, A. M., Robinson, V. L., and Goudreau, P. N. (2000). Two-component signal transduction. Annu rev Biochem. Annu. Rev. Biochem. 69, 183–215. doi: 10.1146/annurev.biochem.69.1.183
Talà, A., Guerra, F., Calcagnile, M., Romano, R., Resta, S. C., Paiano, A., et al. (2022). HrpA anchors meningococci to the dynein motor and affects the balance between apoptosis and pyroptosis. J. Biomed. Sci. 29:45. doi: 10.1186/s12929-022-00829-8
To, P., Xia, Y., Lee, S. O., Devlin, T., Fleming, K. G., and Fried, S. D. (2022). A proteome-wide map of chaperone-assisted protein refolding in a cytosol-like milieu. Proc. Natl. Acad. Sci. USA 119:e2210536119. doi: 10.1073/pnas.2210536119
Weigel, W. A., and Demuth, D. R. (2016). QseBC, a two-component bacterial adrenergic receptor and global regulator of virulence in Enterobacteriaceae and Pasteurellaceae. Mol Oral Microbiol 31, 379–397. doi: 10.1111/omi.12138
Yaman, D., and Averhoff, B. (2021). Functional dissection of structural regions of the Thermus thermophilus competence protein PilW: implication in secretin complex stability, natural transformation and pilus functions. Biochim. Biophys. Acta Biomembr. 1863:183666. doi: 10.1016/j.bbamem.2021.183666
Yan, X., Dai, K., Gu, C., Yu, Z., He, M., Xiao, W., et al. (2022). Deletion of two-component system QseBC weakened virulence of Glaesserella parasuis in a murine acute infection model and adhesion to host cells. PeerJ 10:e13648. doi: 10.7717/peerj.13648
Yan, X., Gu, C., Xiao, W., Zhou, Y., Xiang, X., Yu, Z., et al. (2024). Evaluation of immunoregulation and immunoprotective efficacy of Glaesserella parasuis histidine kinase QseC. Microb. Pathog. 192:106685. doi: 10.1016/j.micpath.2024.106685
Yan, K., Liu, T., Duan, B., Liu, F., Cao, M., Peng, W., et al. (2020). The CpxAR two-component system contributes to growth, stress resistance, and virulence of Actinobacillus pleuropneumoniae by upregulating wecA transcription. Front. Microbiol. 11:1026. doi: 10.3389/fmicb.2020.01026
Keywords: G. parasuis, two-component system, qseC, transcriptomics, metabolomics, bacterial pathogenesis
Citation: Yan X, Zhou Y, Liu S, Gu C, Xiao W, Zhao M, Yu Z and He L (2025) Combined transcriptome and metabolome analysis reveals the regulatory network of histidine kinase QseC in the two-component system of Glaesserella parasuis. Front. Microbiol. 16:1637383. doi: 10.3389/fmicb.2025.1637383
Edited by:
Santosh Pandit, Chalmers University of Technology, SwedenReviewed by:
Sébastien Bontemps-Gallo, University of Lille, FranceKendall S. Stocke, University of Louisville, United States
Copyright © 2025 Yan, Zhou, Liu, Gu, Xiao, Zhao, Yu and He. This is an open-access article distributed under the terms of the Creative Commons Attribution License (CC BY). The use, distribution or reproduction in other forums is permitted, provided the original author(s) and the copyright owner(s) are credited and that the original publication in this journal is cited, in accordance with accepted academic practice. No use, distribution or reproduction is permitted which does not comply with these terms.
*Correspondence: Lvqin He, aGVsdnFpbjYxN0AxNjMuY29t
†These authors have contributed equally to this work