 Yuki Ohara1†
 Shogo Yoshimoto
 Katsutoshi Hori
- 1Friend Microbe Inc., Nagoya, Japan
- 2Department of Biomolecular Engineering, Graduate School of Engineering, Nagoya University, Nagoya, Japan
Bacterial cell aggregation plays a fundamental role in surface colonization, stress tolerance, and interspecies metabolite exchange. Aggregation is assessed by simple tube-settling assays and also image analysis; however, approaches for quantitatively assessing the heterotypic and homotypic cell–cell interactions among more than two types of cells have been limited. In this study, we developed grid partitioning image analysis (GPIA), a simple workflow that quantifies the compositional heterogeneity of bacterial aggregates. Confocal laser scanning microscopy (CLSM) images of fluorescently labeled Acinetobacter sp. Tol 5, which exhibits a self-aggregative nature through its cell surface protein AtaA, were partitioned into 2-μm square grids. Grids containing one or no cells were classified as dispersed, whereas those containing multiple cells were classified as aggregates, and the proportion of EGFP-labeled cells within each grid was recorded. Reference images representing dispersed cells, homo-aggregates, and hetero-aggregates produced characteristic EGFP-ratio histograms that matched binomial predictions. When AtaA production in one cell type was decreased, the histogram changed from a symmetric unimodal histogram with the peak at 40–60% EGFP-ratio to a skewed distribution, indicating that GPIA can detect differences in cell-to-cell affinity. Using the same procedure, we examined six in-frame deletion variants of AtaA. The deletion of the N-terminal head domain alone prevented co-aggregation with full-length AtaA, suggesting that homophilic recognition by this domain mediated self-aggregation, whereas deletions in all other regions had no measurable effect. GPIA, therefore, offers a simple and rapid approach for quantitative studies on bacterial cell aggregation, bridging the gap between qualitative microscopy and quantitative but technically demanding single-cell analysis. GPIA will accelerate research on cell–cell interactions, which are the foundational processes that drive biofilm formation and the assembly of microbial consortia.
1 Introduction
Bacterial cell aggregation, which includes homotypic aggregation of identical cells and heterotypic aggregation among different types of cells, plays a fundamental role in microbial ecology and pathogenesis (Nwoko and Okeke, 2021; Kragh et al., 2023). By facilitating close cell-to-cell contacts, aggregation promotes initial surface colonization and biofilm formation, shields communities from shear stress, desiccation, and antimicrobials, and accelerates interspecies signaling and metabolite exchange (Kruse et al., 2021; Liu et al., 2024). These cell–cell interactions are mediated by cell-surface adhesins, such as extracellular polysaccharides and protein fibers (Formosa-Dague et al., 2016; Trunk et al., 2018). In the medical field, bacterial cell aggregation is treated as a nuisance (Nwoko and Okeke, 2021; Liu et al., 2024). On the other hand, it is recognized as beneficial in wastewater treatment and bioprocesses for chemical production to concentrate biomass and stabilize the systems (Sethi et al., 2023; Najim et al., 2024; Hammond et al., 2025). Therefore, understanding the characteristics and mechanisms of bacterial cell aggregation is important in various research fields.
Acinetobacter sp. Tol 5 shows remarkable nonspecific adhesiveness to various material surfaces and a self-aggregative nature through its cell surface nanofiber protein AtaA (Acinetobacter trimeric autotransporter adhesin) (Ishikawa et al., 2012). AtaA is a member of trimeric autotransporter adhesins (TAAs), which are outer membrane proteins widely distributed in gram-negative bacteria (Leo et al., 2012; Meuskens et al., 2019). The polypeptide chains of TAAs form a homo-trimeric structure with an N-terminal passenger domain corresponding to its adhesive functions and a C-terminal transmembrane domain that transports and anchors the passenger domain onto the outer membrane (Lyskowski et al., 2011; Bassler et al., 2015). Acinetobacter baumannii, a pathogenic species that has attracted attention as a multidrug-resistant bacterium, also has a TAA called Ata (Acinetobacter trimeric autotransporter) (Bentancor et al., 2012; Li et al., 2025). Ata from A. baumannii is involved in adhesion to the extracellular matrix, invasion to host cells, and protection against the host (Bentancor et al., 2012; Weidensdorfer et al., 2019; Tram et al., 2021), but there are no reports of Ata being involved in self-aggregation, indicating that there is diversity in the functions of TAAs even within the genus Acinetobacter. The adhesive and aggregation features of AtaA can be conferred to other non-adhesive gram-negative bacteria by transformation with the ataA gene (Ishikawa et al., 2012; Yoshimoto et al., 2023). Previously, we invented a new method for immobilizing bacterial cells utilizing AtaA (Ishikawa et al., 2014). Large numbers of bacterial cells expressing AtaA can be quickly immobilized onto various material supports and the immobilized cells can be efficiently used for bioproduction (Ishikawa et al., 2014; Yoshimoto et al., 2023). AtaA-mediated self-aggregation plays an important role in the initial attachment of bacterial cells to material surfaces and in increasing the number of immobilized cells by stacking and flocculation (Furuichi et al., 2020). Nevertheless, the details of aggregation remain unclear because bacterial cell aggregation is commonly assessed by simple qualitative tube-settling assays that monitor turbidity (Trunk et al., 2018; Nwoko and Okeke, 2021; Rooke et al., 2021).
Microscopic image analysis is a powerful tool for understanding various characteristics of bacteria and their cell aggregates, including biofilms (Costa et al., 2013; Jeckel and Drescher, 2021). Optical microscopy enables the observation of features such as morphology, size, motility, and other phenotypic traits of individual bacteria and their aggregate structures. Fluorescence in situ hybridization (FISH) and fluorescent protein-based reporter systems allow for the spatial visualization and quantification of the proportion and distribution of specific bacterial species (Prudent and Raoult, 2019; Shields et al., 2019; Barbosa et al., 2023). Recently, more quantitative approaches have been developed, including single-cell segmentation, analysis of temporal fluorescence dynamics, and in situ cytometry within biofilms (Paula et al., 2020; Gómez-de-Mariscal et al., 2021; Hartmann et al., 2021). On the other hand, approaches for quantitatively assessing the heterotypic and homotypic cell–cell interactions among more than two species have been limited. Some studies computed, for each cell, the frequency of neighboring cell types to estimate aggregation-pair proportions in mixed-species aggregates (Glass and Riedel-Kruse, 2018; Khalil et al., 2020), but these analyses were complicated and computationally intensive. In contrast, interactions among eukaryotic cells have been assessed with simpler image analyses that calculate the composition of four-cell clusters and sum these values to identify the predominant interaction mode (Sieber and Roseman, 1981). Transferring such simple quantitative imaging strategies to bacteria is beneficial for rapid and intuitive analysis; however, it requires extensive modifications and optimization because bacterial cells are much smaller than eukaryotic cells and form densely packed clusters that obscure individual cell boundaries and confound automated segmentation.
In this study, we developed a new method of grid partitioning image analysis (GPIA) that quantifies the compositional heterogeneity of bacterial aggregates. Using Tol 5 derivatives that display AtaA and distinct fluorescent reporters, we demonstrate that GPIA (i) distinguishes between aggregated and dispersed cells, (ii) evaluates the heterogeneity of cell aggregates, and (iii) detects the changes in interaction affinity caused by modulating the production level of AtaA and the in-frame deletion of AtaA.
2 Materials and methods
2.1 Bacterial strains and culture conditions
Escherichia coli XL10-Gold and DH5α were used for plasmid construction. E. coli S-17 strain was used for plasmid conjugation (Simon et al., 1983). E. coli cells were grown in lysogeny broth (LB) medium at 37°C with shaking at 150 rpm. Acinetobacter sp. Tol 5 and its ΔataA mutant strain 4,140 (Tol 5 ΔataA) (Yoshimoto et al., 2023) were grown in LB medium at 28°C with shaking at 115 rpm. Antibiotics were added at the following concentrations as needed: ampicillin (100 μg/mL), kanamycin (50 μg/mL), gentamicin (10 μg/mL). L-arabinose was added to the culture medium to induce the expression of ataA gene on pAXG or pAXR plasmids. The concentration of arabinose varied from 0.01% to 0.5% (w/v) to control the production levels of AtaA.
2.2 DNA manipulation
Plasmids used in this study are listed in Table 1. The DNA fragment encoding the enhanced green fluorescent protein (egfp) gene was amplified by PCR from pEGFP-C3 (GenBank: U57607.1) using primers EGFPtoC007-Fw/EGFPtoC007-Rv (Fw: CAATTAAGCTTATGGTGAGCAAGGGCGAGG, Rv: GTATTCCATGGTTACTTGTACAGCTCGTCCATGC). The plasmid backbone including the PLtetO1 promoter for constitutive gene expression was amplified by PCR from pC007 (Abudayyeh et al., 2016) using primers C007inv-Fw/C007inv-Rv (Fw: GTATTCCATGGTAAGGATCTCCAGGCATCAAATAAAAC, Rv: CATTAAAGCTTTTTCTCCTCTTTCAGATCCGTGC). These DNA fragments were digested with HindIII and NcoI and ligated, generating pC007G. To construct pAXG and pAXR, which encode egfp or mrfp under the PLtetO1 promoter (Lutz and Bujard, 1997), the DNA fragments encoding egfp and mrfp were amplified by PCR from pC007G or pC007 using primers RFPtoARP-Fw/RFPtoARP-Rv (Fw: CAATTAAGCTTATGGTGAGCAAGGGCGAGG, Rv: GTATTCCATGG TTACTTGTACAGCTCGTCCATGC). The amplified DNA fragments were assembled with PvuII-digested pARP3 by NEBuilder HiFi DNA Assembly master mix (New England BioLabs, Ipswich, MA, United States). To construct pAXG-ataA and pAXR-ataA, which were used for co-expression of ataA and each fluorescent protein gene, the DNA fragments encoding ataA genes excised from pAtaA by digestion with EcoRI and XbaI were ligated with pAXG or pAXR digested with the same restriction enzymes. The construction of the co-expression plasmids for the in-frame deletion mutant of ataA and fluorescent protein was conducted in the same manner using pARP3 plasmid harboring a gene encoding each in-frame deletion mutant of ataA (Yoshimoto et al., 2023). Transformation of the Tol 5ΔataA with these expression plasmids was carried out by conjugal transfer from E. coli S17-1 strain (Simon et al., 1983), as previously described (Ishikawa et al., 2012).
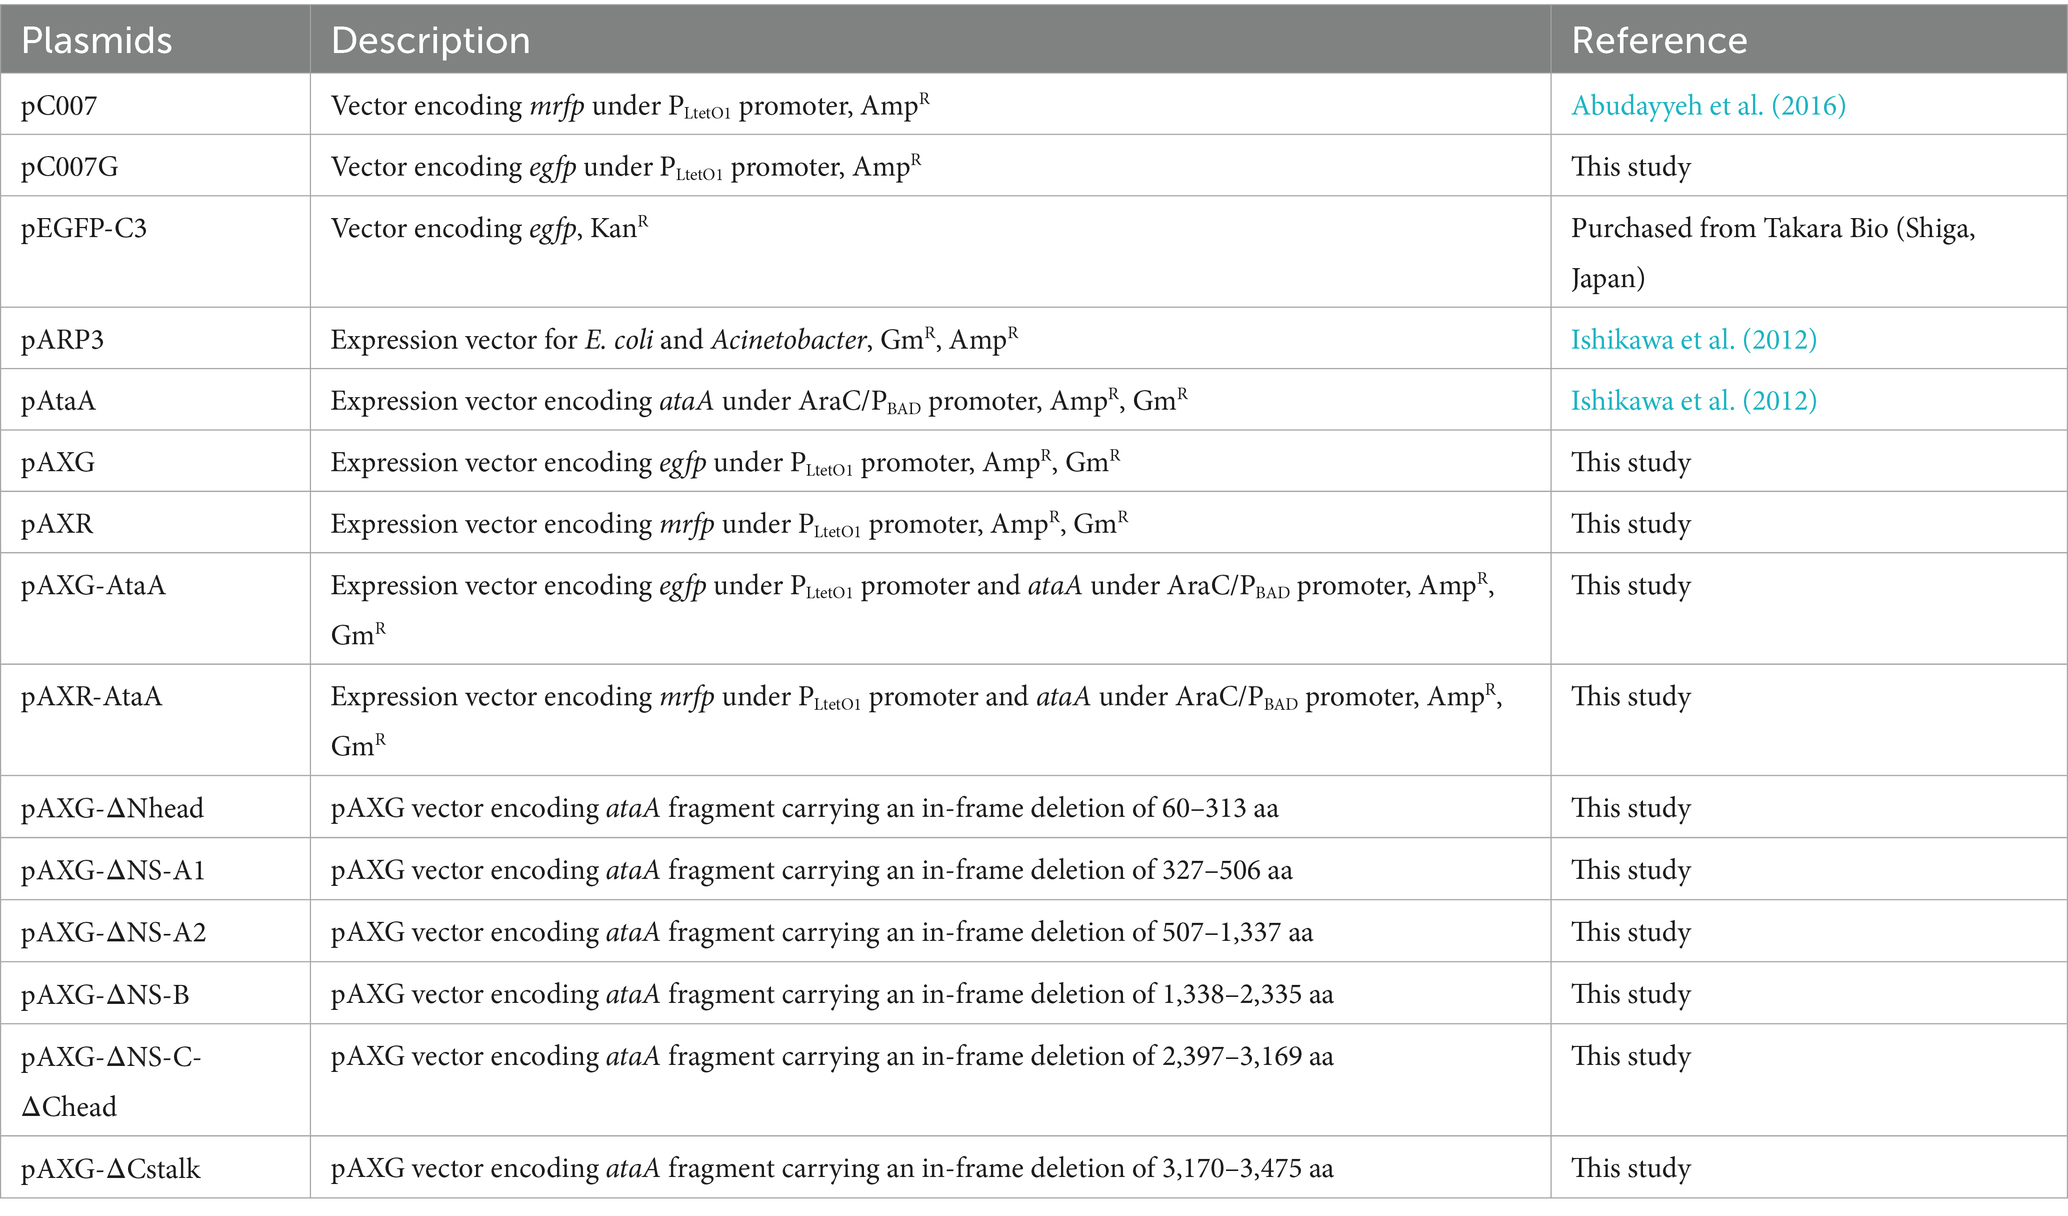
Table 1. Plasmids used in this study.
2.3 Detection of co-expression of AtaA and fluorescent protein
Protein production was examined by SDS-PAGE followed by Coomassie Brilliant Blue (CBB) staining and immunoblotting using anti-AtaA59-325 antiserum, as described previously (Ishikawa et al., 2012).
The presentation of AtaA on the cell surface and the production of fluorescent proteins were confirmed by immunofluorescence microscopy using anti-AtaA59-325 antiserum, as described previously with a slight modification (Yoshimoto et al., 2023). Alexa Fluor 647 conjugate of anti-rabbit IgG (H + L), F(ab’)2 Fragment (Cell Signaling Technology, Danvers, MA, United States) was used for the detection of the primary antiserum. These prepared samples were observed by a confocal laser scanning microscope (CLSM; FV1000D IX81-FD/NIH, Olympus Corporation, Tokyo, Japan) with 473, 559, and 635 nm lasers. Confocal images were acquired using a 100×/1.4 NA oil immersion objective lens and saved at a resolution of 1,024 × 1,024 pixels.
Tube-settling aggregation assays of bacterial cells were performed as described previously (Ishikawa et al., 2012). In brief, glass test tubes containing cell suspension with an optical density at 660 nm (OD660) of 0.5 were left to stand at 28°C. The aggregation ratio was calculated from the decrease in the OD660 of the cell suspension using the following equation:
Aggregation ratio (%) = 100 × (Initial OD660 – OD660 after standing) / Initial OD660.
2.4 Formation of cell aggregation
Grown cells were transferred to a 15-mL protein low adsorption tube (Proteosave SS; Sumitomo Bakelite, Tokyo, Japan) and diluted to OD660 = 0.5 with fresh medium. 0.5 mL of two cell suspensions containing different types of cells were mixed in a 1.5-mL protein low adsorption tube (Sumitomo Bakelite, Tokyo, Japan). For samples mixed at a 1:3 ratio, 0.25 mL and 0.75 mL of cell suspension were mixed. The mixed cell suspension was centrifuged at 5,000 × g for 5 min, and the supernatant was discarded. The cell pellet was rinsed with deionized water and centrifuged at 5,000 × g for 5 min. The cell pellet was re-suspended in equal volume of BS-N buffer (34.5 mM Na2HPO4, 14.7 mM KH2PO4, 15.5 mM K2SO4; pH 7.2). The cell suspension was slowly stirred at 8 rpm using a rotator (NRC-20D, Nissinrika, Tokyo, Japan) for 15 min to form cell aggregates. The suspension containing planktonic cells and cell aggregates was placed onto a glass slide and observed by CLSM. The lasers of 473 and 559 nm were used for exciting the fluorescent proteins EGFP and mRFP, respectively. Confocal images were acquired using a 100×/1.4 NA oil immersion objective lens and saved at a resolution of 1,024 × 1,024 pixels.
2.5 Grid partitioning image analysis
The CLSM images were imported into ImageJ (Schneider et al., 2012). EGFP and mRFP fluorescent signals were separated using the “Color Balance” function; individual fluorescent particles were detected with “Find Maxima,” and their coordinates were exported as a spreadsheet, where the field of view was subdivided into 2 μm-square grids. The pixel scale of the CLSM image was calibrated to micrometer units. Grids containing one or no cells were classified as dispersed, while those containing two or more cells were classified as aggregated. For every grid classified as aggregated, the proportion of EGFP-fluorescent cells (EGFP-ratio) was calculated by dividing the number of EGFP-fluorescent cells by the total number of fluorescent cells (EGFP + mRFP) within that region. The grids classified as aggregated were then categorized into five bins based on EGFP-ratio: 0 ≤ x < 20%, 20 ≤ x < 40%, 40 ≤ x < 60%, 60 ≤ x < 80%, and 80 ≤ x ≤ 100%. For each bin, the total number of EGFP and mRFP cells was summed across all grids classified as aggregated. These values were then normalized by the total number of fluorescent cells present in both grids classified as dispersed and aggregated, and the normalized percentages were plotted as histograms. Only the import of the data into ImageJ and the Excel template was done manually; all other calculations and classifications were automated. The template spreadsheet used for these calculations is available in the Supplementary File S1.
2.6 Control conditions for theoretical distributions
To interpret experimental histograms, theoretical EGFP-ratio distributions were generated for each of the control conditions under defined assumptions. For the dispersed control, every cell was assumed to occupy its own grid, yielding no grids assigned as aggregated and therefore a flat distribution of 0% across all EGFP-ratio bins. In the homo-aggregation control, we posited that each grid contained only a single cell type, while the overall field maintained a 1:1 mixture of EGFP- and mRFP-expressing cells; this produced a theoretical profile composed solely of the 0–20% and 80–100% bins, each contributing 50% of the total. For the hetero-aggregation control, the expected distributions were modeled with the binomial formula:
Where n is the number of cells in a grid, k is the number of EGFP-fluorescent cells, and p is the probability of selecting an EGFP-fluorescent cell. We set p = 0.5 for the equal-volume (1:1) mixture and p = 0.25 for the 1:3 mixture, calculated the EGFP-ratio (k/n × 100) for k = 0–n, and assigned each outcome to the standard five bins (0 ≤ x < 20%, 20 ≤ x < 40%, 40 ≤ x < 60%, 60 ≤ x < 80%, and 80 ≤ x ≤ 100%). This computation was repeated for n = 2–8, spanning the observed range of cells per grid. The resulting bin probabilities were combined with the weights based on the observed frequency of each grid size, generating the theoretical distributions.
2.7 Statistical analysis
Statistical differences in the distribution of EGFP-ratio categories among groups were evaluated using Pearson’s chi-square test. For each pairwise comparison between experimental groups, contingency tables were constructed using the number of fluorescent cells in each bin (0–20%, 20–40%, 40–60%, 60–80%, 80–100%, and Dispersed). Expected frequencies were calculated under the null hypothesis of independence.
The chi-square statistics were calculated using the formula:
where O is the observed count and E is the expected count for each cell.
The degrees of freedom (df) were calculated as:
Where r is the number of groups being compared (rows), and c is the number of categories (columns).
The strength of association was assessed using Cramér’s V, defined as:
Where N is the total number of observations and k is the smaller of the number of rows or columns in the contingency table.
To correct for multiple comparisons, Bonferroni-adjusted p-values were calculated by multiplying the raw p-values by the number of comparisons.
3 Results
3.1 Construction of bacterial cells co-expressing ataA and two types of fluorescent protein genes
First, we constructed ataA and fluorescent gene co-expressing Tol 5 cells to distinguish the two types of cells in the image analysis. The co-expression plasmids were designed and constructed as shown in Figure 1A and Table 1. Either egfp and mrfp genes were placed under the constitutive PLtetO1 promoter, while the ataA gene was placed under the inducible AraC/PBAD promoter.
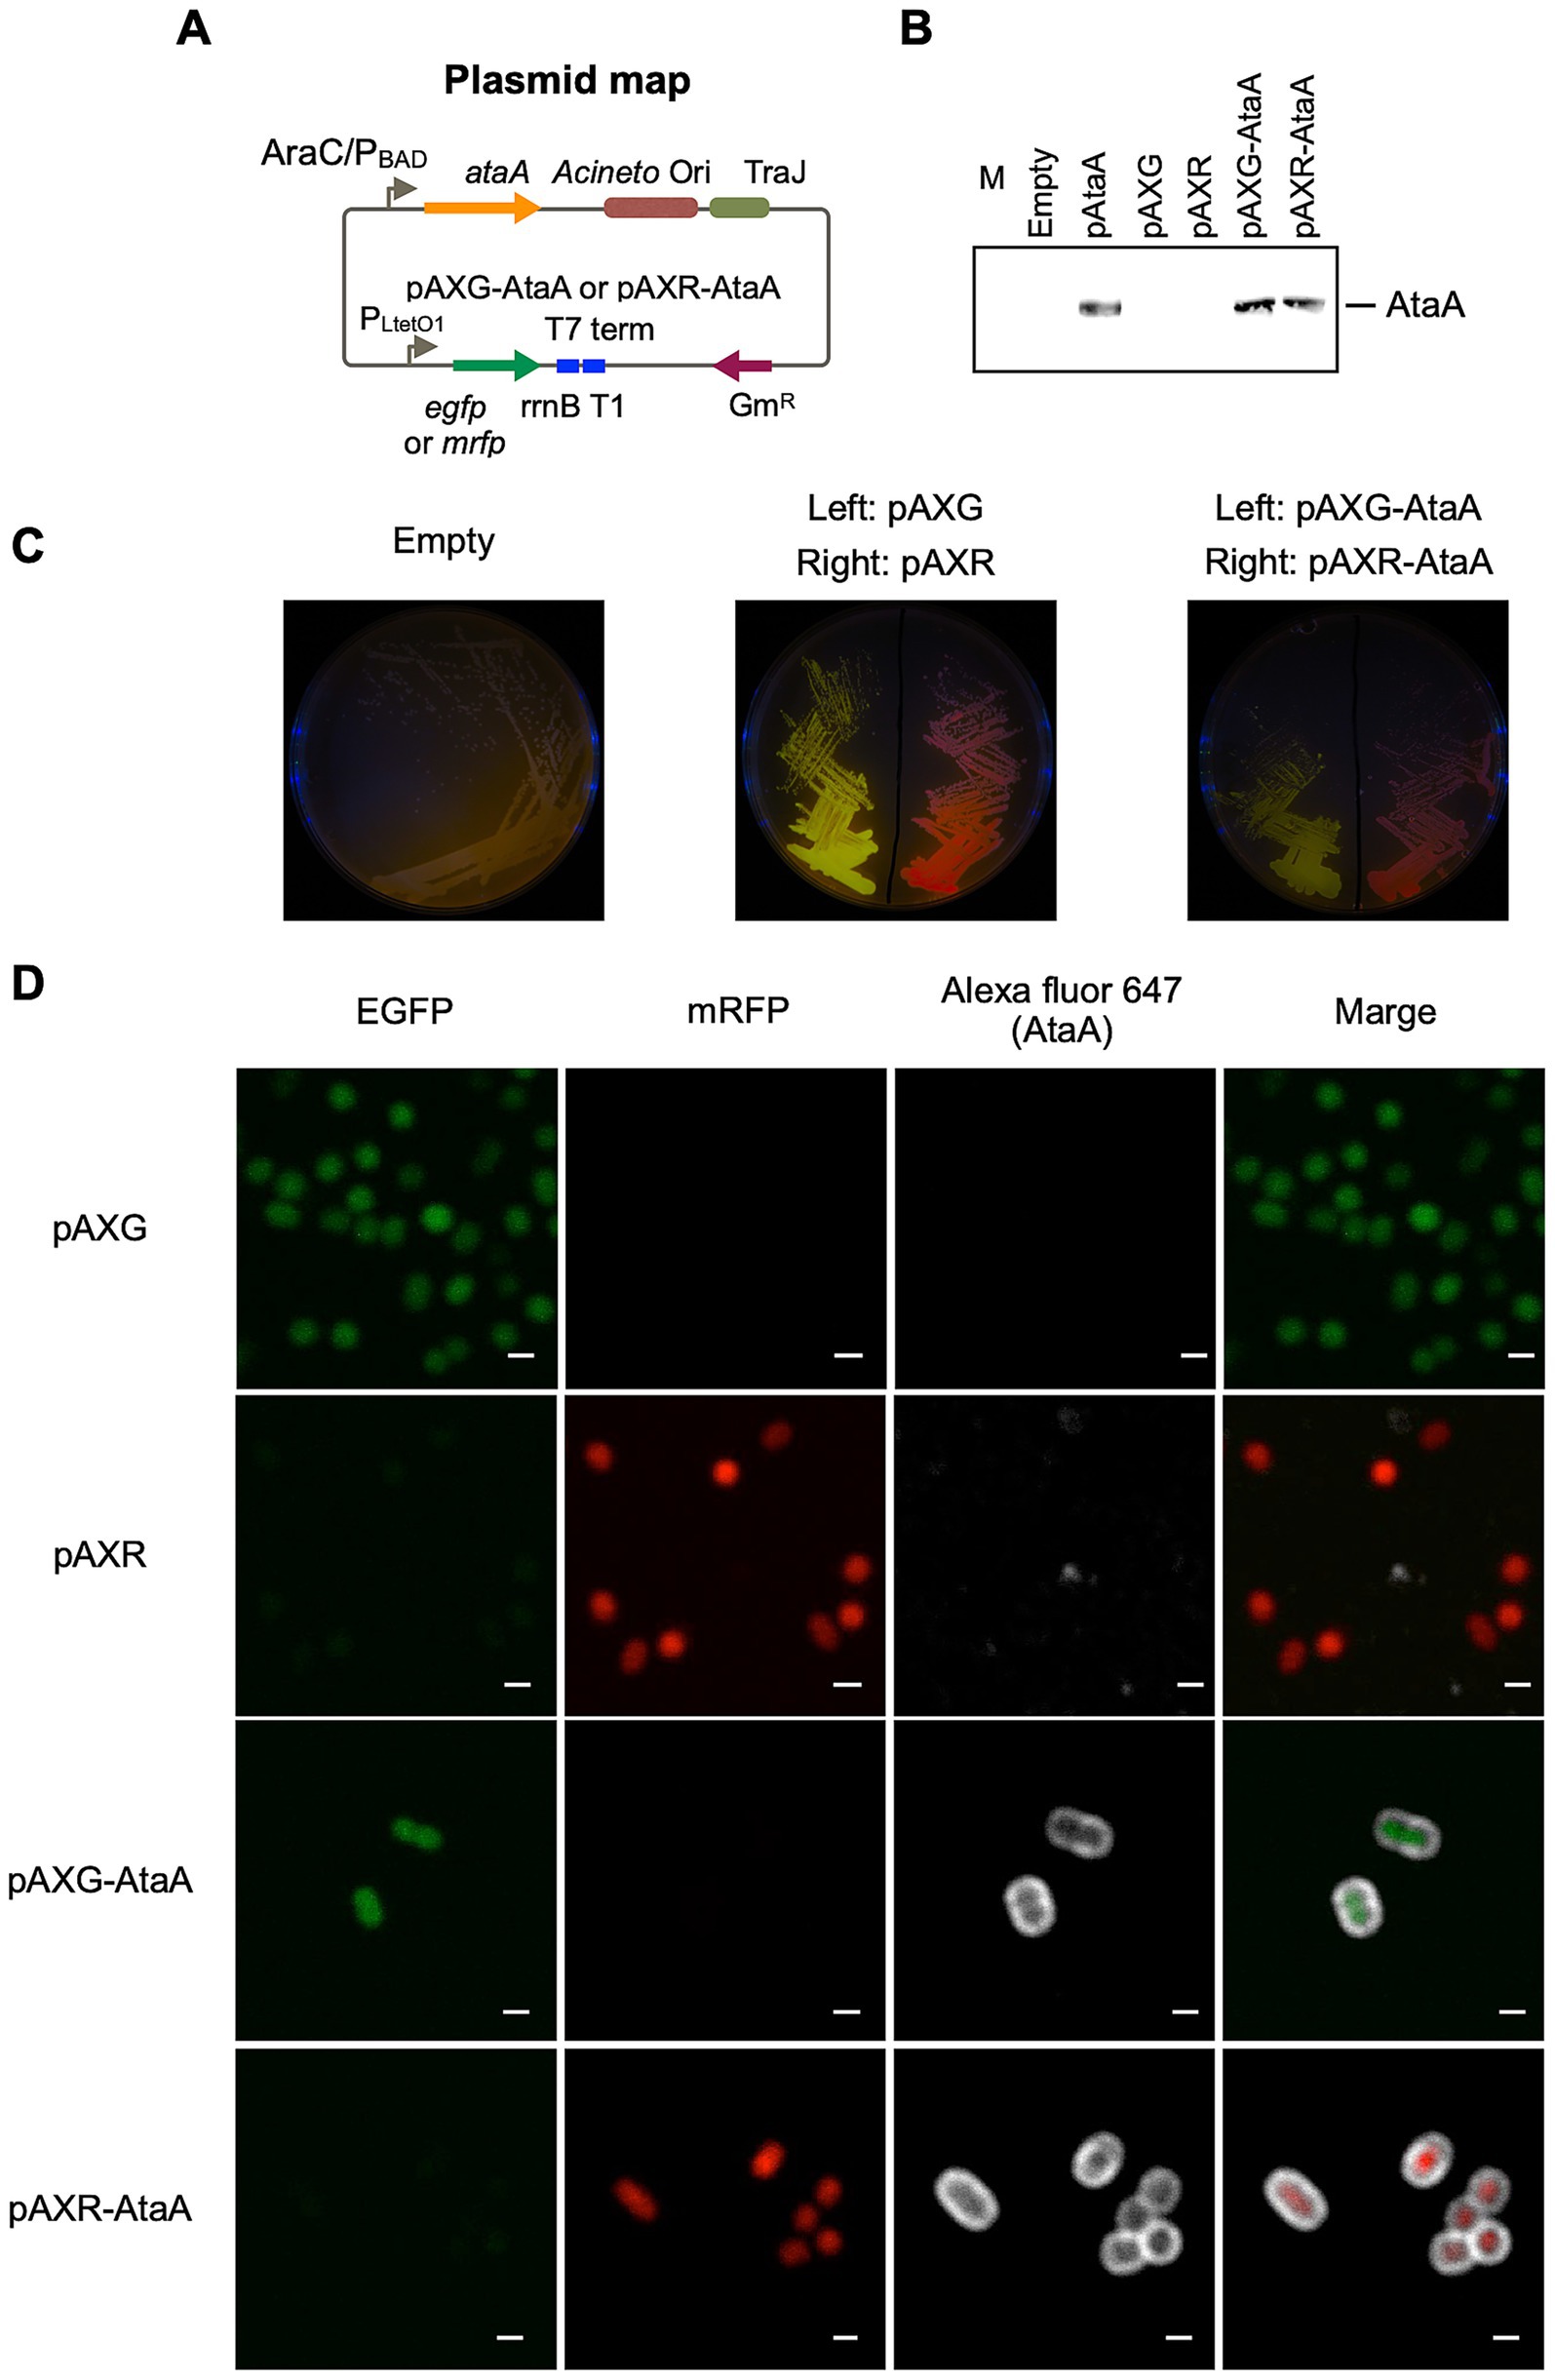
Figure 1. Construction of AtaA/EGFP or AtaA/mRFP co-expression strain. (A) Map of the co-expression plasmid for AtaA and fluorescent protein genes. The ataA gene was inserted under the AraC-PBAD inducible promoter, and egfp or mrfp were inserted under the PLtetO1 constitutive promoter. (B) Confirmation of ataA expression. The whole-cell lysates of Tol 5 ΔataA or its derivative mutants were analyzed by immunoblotting using anti-AtaA antiserum. (C) Photographs of agar plates taken under black light. Green and red are fluorescence derived from EGFP and mRFP, respectively. (D) CLSM observation of immuno-stained cells co-expressing ataA and fluorescent protein genes. Green and red are derived from EGFP and mRFP, respectively. White was derived from immuno-stained AtaA. Confocal images were acquired using a 100×/1.4 NA oil immersion objective lens with a 3 × digital zoom and saved at a resolution of 1,024 × 1,024 pixels. Scale bars: 1 μm.
The constructed plasmids were introduced into Tol 5 ΔataA, and the co-expression of each fluorescent protein gene and ataA was examined by immunoblotting and immunofluorescence microscopy. The production amount of AtaA and cell adhesiveness of Tol 5 ΔataA (pAXG-AtaA) (EGFP-AtaA(+)) and Tol 5 ΔataA (pAXR-AtaA) (mRFP-AtaA(+)) were almost the same as Tol 5 ΔataA (pAtaA) (Figure 1B). Tol 5 ΔataA (pAXG) (EGFP-AtaA(−)) and Tol 5 ΔataA (pAXR) (mRFP-AtaA(−)) exhibited intracellular fluorescence corresponding to each fluorescent protein (Figures 1C,D). Tol 5 ΔataA (pAXG-AtaA) and Tol 5 ΔataA (pAXR-AtaA) simultaneously exhibited fluorescence surrounding the cells corresponding to AtaA in addition to intracellular fluorescence corresponding to each fluorescent protein (Figure 1D). These results demonstrated that each fluorescent protein gene and ataA were co-expressed in Tol 5 ΔataA.
3.2 Evaluation of cell aggregation and heterogeneity by grid partitioning image analysis (GPIA)
For the previous analysis of eukaryotic cells by Sieber and Roseman, each four-cell aggregate was treated as a single analytical unit (Sieber and Roseman, 1981). Here, we investigated the optimal subdivision size for CLSM images to divide aggregates of the coccobacillus-shaped bacterial cells, whose diameter is approximately 0.8–1.2 μm (Figure 1D), into units of about four cells. We divided the CLSM image of well-mixed hetero-aggregated cells shown in Figure 2B into square grids of 1, 2, and 4 μm and counted the number of cells in each grid. In 1 μm square grids, over 70% of the cells were present individually within a single grid (Supplementary Figure S1, green). Because we defined “aggregated” as a grid containing two or more cells, 1 μm partitioning led to misclassification. In 4 μm square grids, many grids contained ten or more cells (Supplementary Figure S1, blue), so cells that were not in direct contact could be falsely classified as co-aggregated. In 2 μm square grids, most of the grids contained two to four cells (Supplementary Figure S1, orange), which were correctly classified as aggregated. These results indicate that the 2 μm partitioning is optimal for this bacterial cell, which is reasonable because a 2 μm square grid accommodates roughly four 1 μm-diameter cells. Therefore, all subsequent analyses used a 2 μm grid.
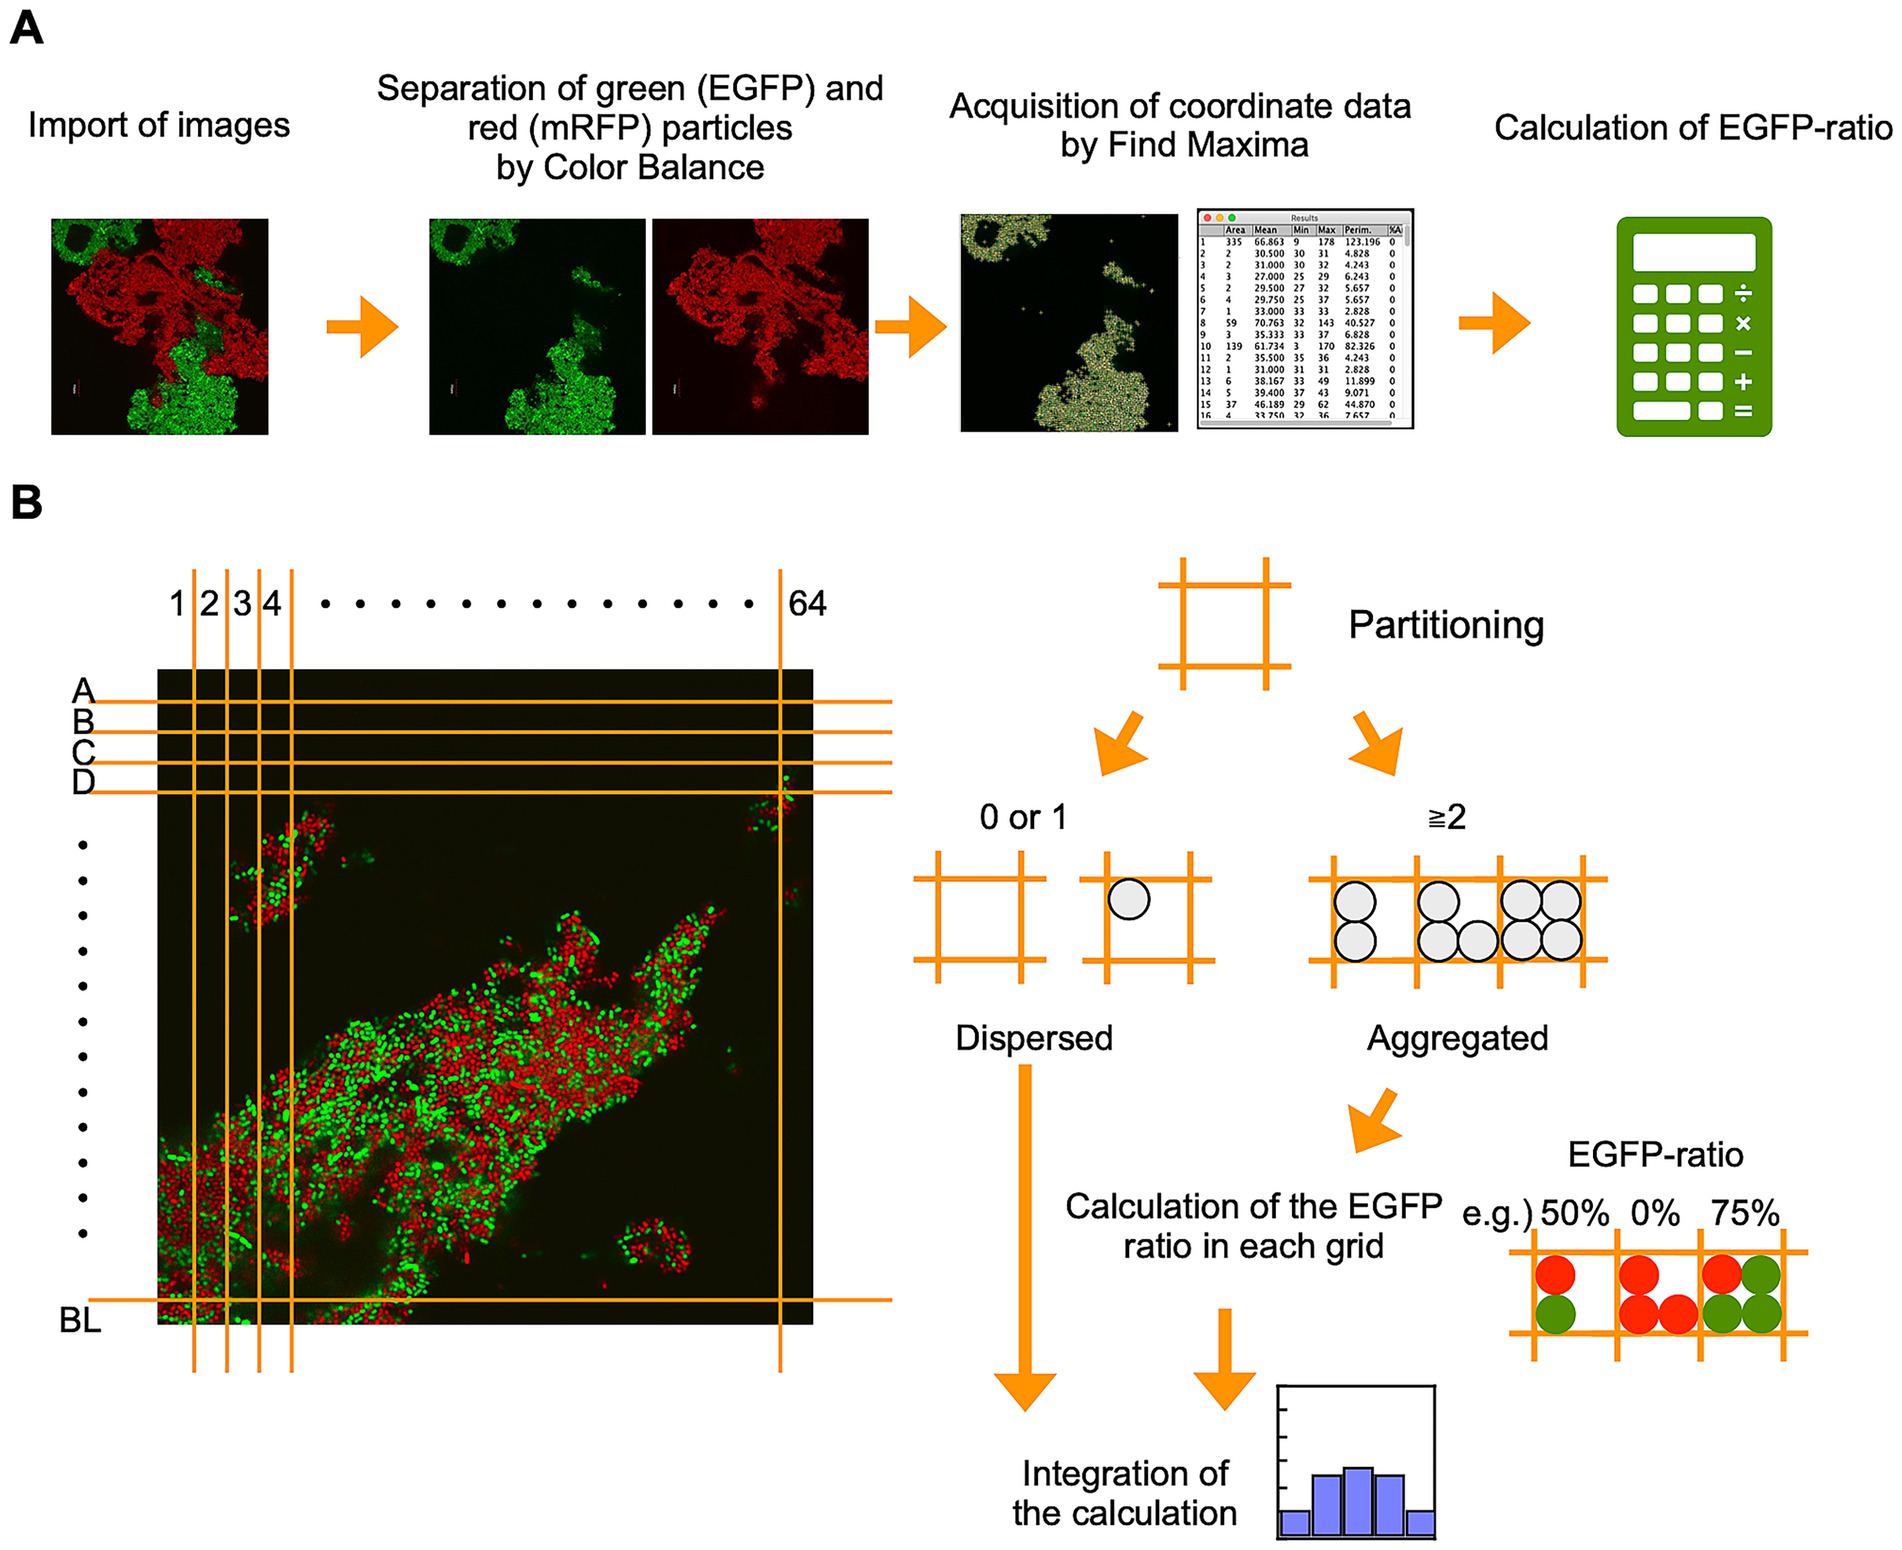
Figure 2. Overview of grid partitioning image analysis (GPIA). (A) CLSM images were imported into ImageJ and separated into EGFP and mRFP channels using the “color balance” function. Fluorescent cell coordinates were extracted independently from each channel using the “Find Maxima” function, and the resulting coordinate sets were exported as a spreadsheet for further analysis. (B) Concept of grid partitioning and cell classification. Based on the imported cell coordinates, the image was divided into 64 × 64 grids (2 μm × 2 μm). A grid containing one or no cells was classified as “dispersed,” while grids containing multiple cells were defined as “aggregated.” For each aggregated grid, the proportion of EGFP-fluorescent cells was calculated and binned into one of five EGFP-ratio ranges: 0 ≤ x < 20%, 20 ≤ x < 40%, 40 ≤ x < 60%, 60 ≤ x < 80%, and 80 ≤ x ≤ 100%. The number of EGFP and mRFP cells within each bin was summed across all aggregated grids. The total number of cells across both dispersed and aggregated grids was used as the normalization baseline (100%), and the binned values were plotted as percentage histograms.
To test the performance of GPIA, four typical images were prepared by mixing the two types of AtaA-displayed (or not displayed) fluorescent cells. The cell mixture of EGFP-AtaA(−) and mRFP-AtaA(−) was prepared as the dispersed control (Figure 3A left). The second control consisted of two cell types that can self-aggregate individually but do not interact with each other; we referred to this as the homo-aggregation control. This sample was prepared by forming homotypic cell aggregates of EGFP-AtaA(+) and mRFP-AtaA(+) cells and then mixing them (Figure 3A middle left). The third and fourth controls consisted of two cell types that interacted with one another and with themselves to a similar extent; we designated this as the hetero-aggregate control (Figure 3A middle right and right). These samples were prepared by mixing equal or 1:3 volumes of EGFP-AtaA(+) and mRFP-AtaA(+) cell suspensions, allowing simultaneous aggregation. These samples were observed by CLSM and analyzed according to the GPIA concept presented in Figure 2. In the dispersed control, over 70% of cells were classified as dispersed particles (Figure 3B, left). On the other hand, over 75% of cells were classified as aggregates in the homo- and hetero-aggregation controls (Figure 3B, middle left, middle right, and right).
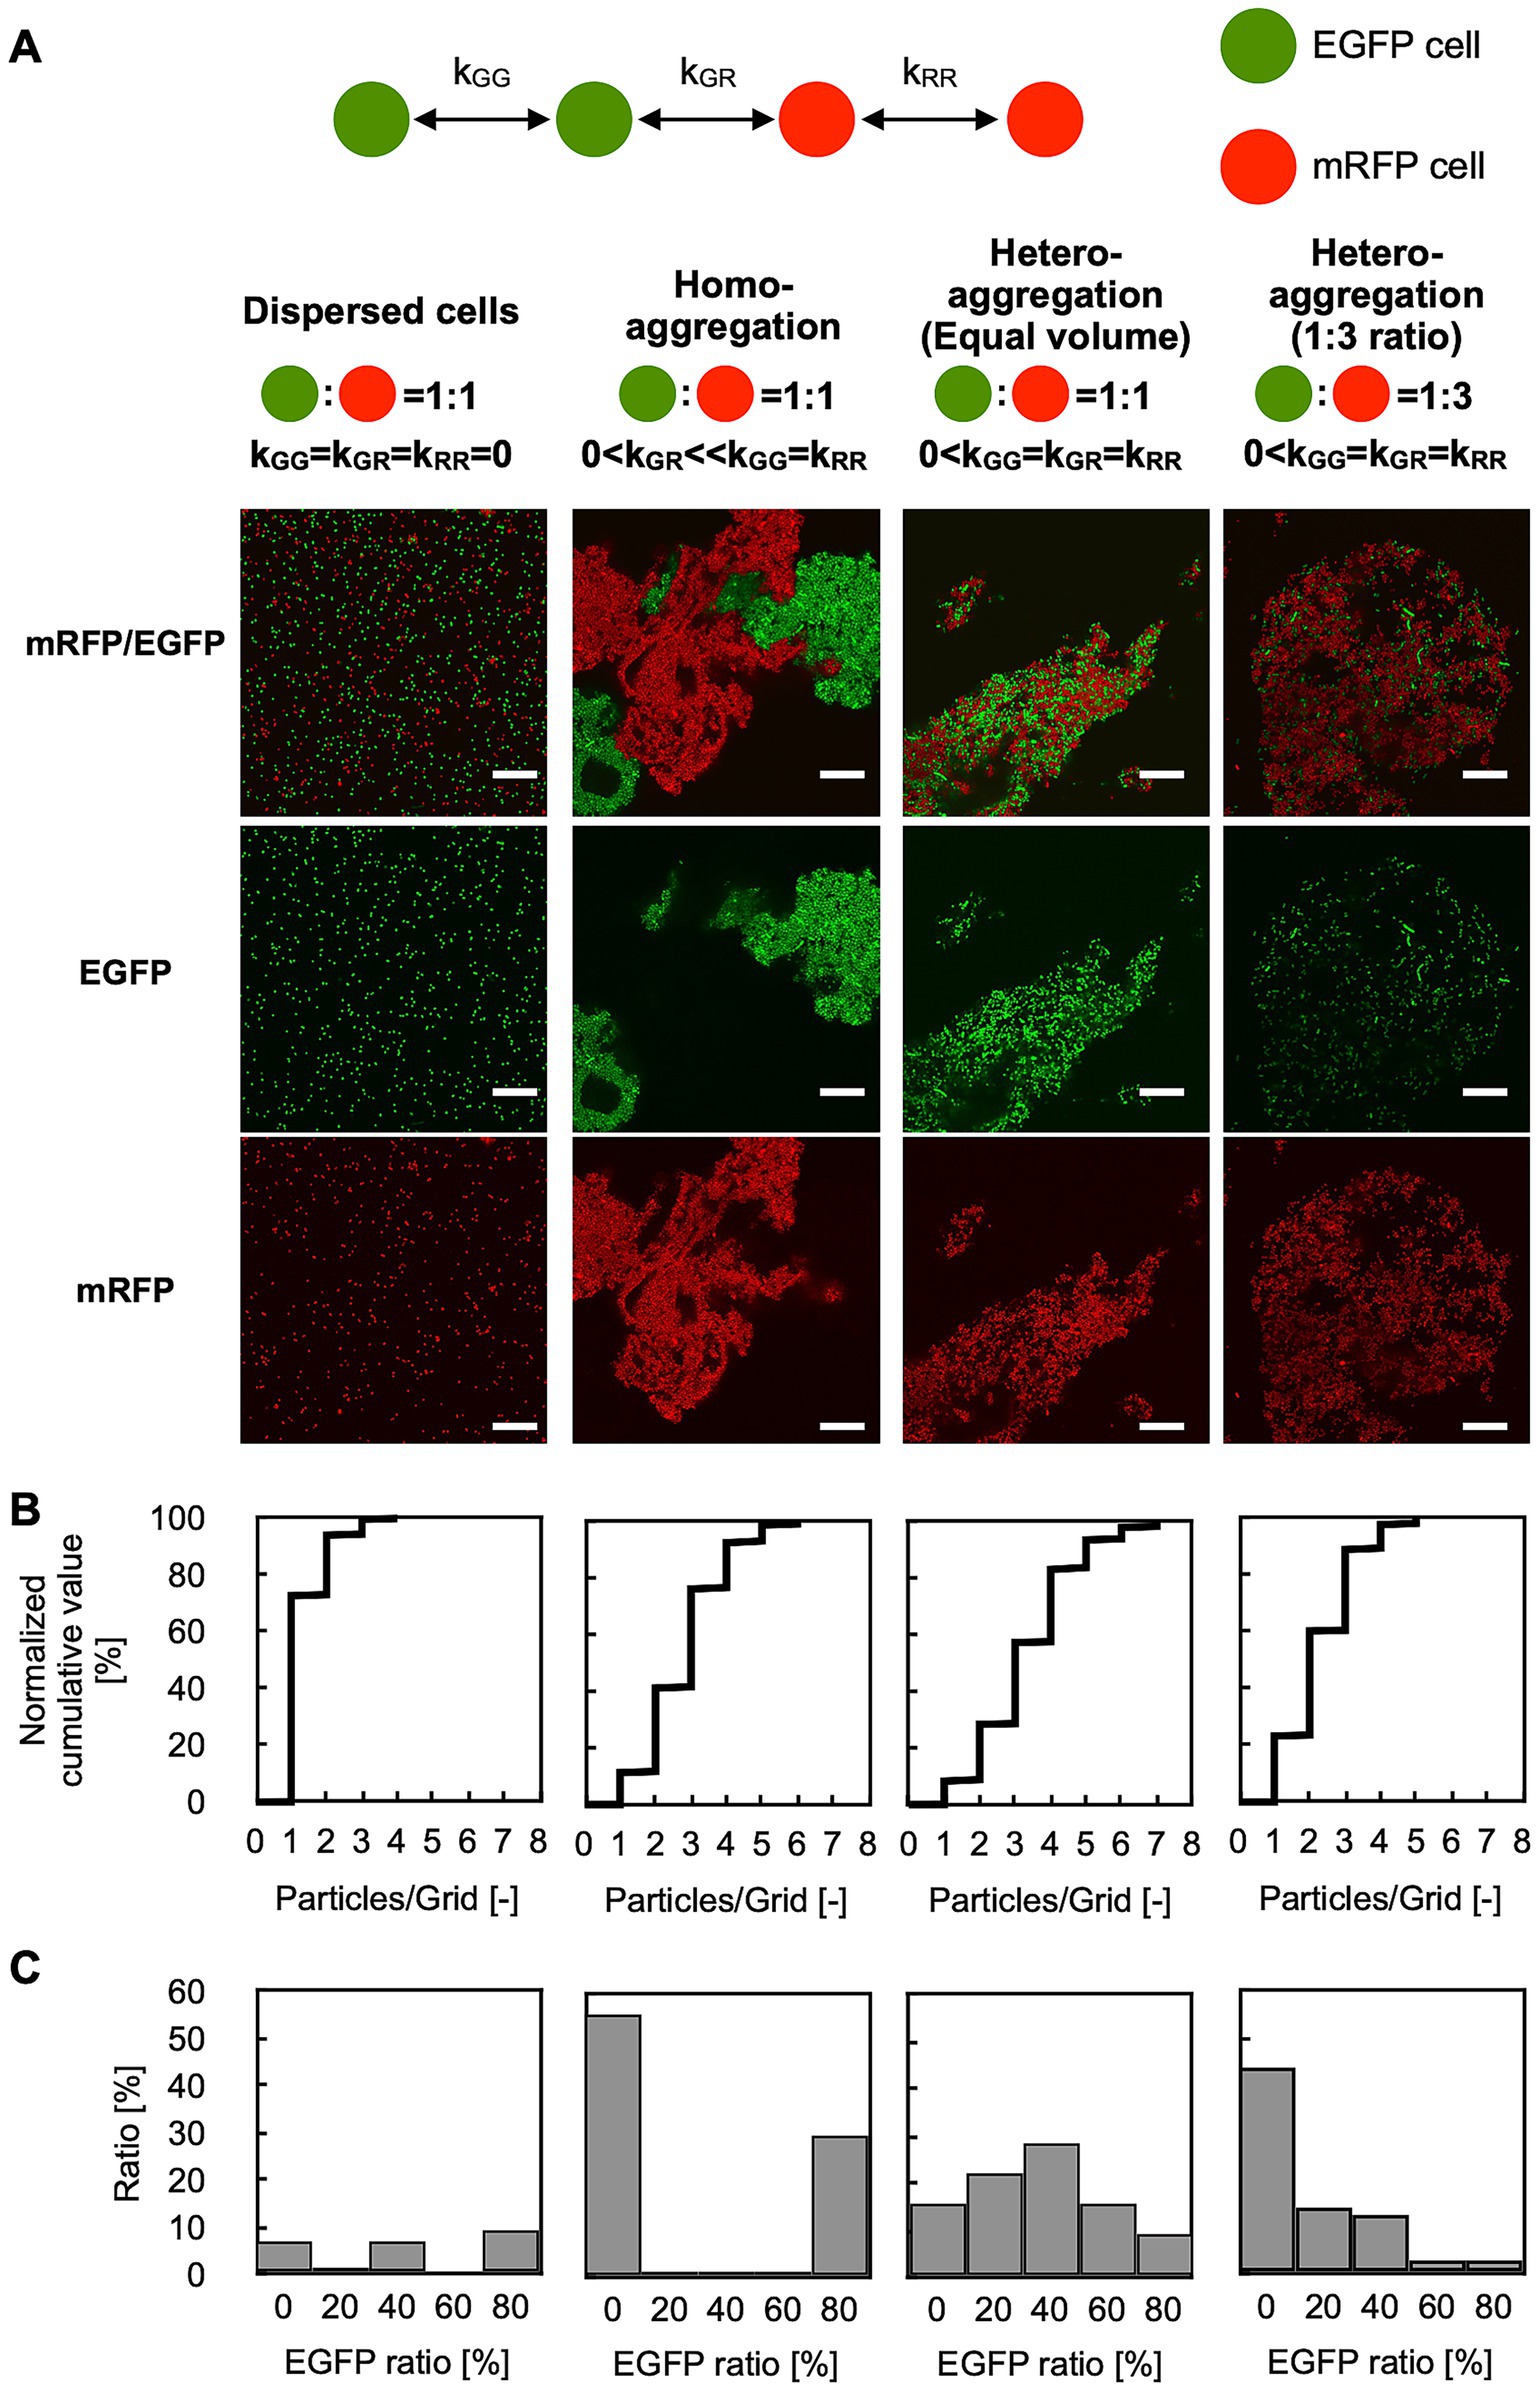
Figure 3. GPIA of dispersed or aggregated cells. (A) CLSM images and schematic cartoons of four control samples: dispersed cells composed of EGFP-AtaA(−) + mRFP-AtaA(−); homo-aggregation obtained by first forming separate EGFP-AtaA(+) and mRFP-AtaA(+) clumps and then mixing them; and hetero-aggregation generated by mixing equal (1:1) or unequal (1:3) volumes of EGFP-AtaA(+) and mRFP-AtaA(+) cells. Confocal images were acquired using a 100×/1.4 NA oil immersion objective lens and saved at a resolution of 1,024 × 1,024 pixels. Scale bars: 20 μm. (B) Frequency distribution of total cell counts in each 2 μm square grid. (C) Ratio of the EGFP-fluorescent cells in each grid containing multiple cells (≥ 1,000 cells analyzed per sample) calculated from a single field of view. Data shown are representative of at least two independent biological experiments that yielded similar results.
Next, the ratio of EGFP-fluorescent cells in each grid was calculated (Figure 3C). In this calculation, particles were integrated as over 1,000 events from several image samples because the deviation was almost saturated at over 300 events (Supplementary Figure S2). In the dispersed control, no peak was observed because most particles were classified as a single cell in Figure 3B. On the other hand, the homo-aggregation control showed a U-shaped histogram, with high frequencies in the 0–20% and 80–100%, indicating that multiple cells of one type are included in each grid. In contrast, the hetero-aggregation control with a 1:1 ratio showed a symmetric unimodal histogram with the peak at 40–60%, indicating that two types of multiple cells equally contained in each grid. The hetero-aggregation control with a 1:3 ratio showed a right-skewed histogram, indicating that grids containing one cell type and grids containing two cell types were both present. All pairwise comparisons among the four samples (dispersed cells, homo-aggregates, hetero-aggregates with equal volume, and hetero-aggregates at a 1:3 ratio) showed statistically significant differences in the distribution of the EGFP-ratio, as determined by Pearson’s chi-square test with Bonferroni correction (Supplementary Table S1). Supplementary Figure S3 presents the theoretically calculated EGFP-ratio histogram, which displays a distribution closely matching the trend observed in the GPIA-generated histogram. These results demonstrate that GPIA not only distinguishes dispersed from aggregated cell populations but also clearly resolves whether the aggregates arise from homotypic or heterotypic interactions.
3.3 Analysis of cell–cell interaction mediated by cells expressing different levels of AtaA
Next, we examined whether the GPIA could detect the difference in the interaction strength between bacterial cells. The mRFP-AtaA(+) cells were cultured in the medium containing 0–0.5% arabinose to prepare AtaA-displayed cells with different expression levels (Figure 4A). Immunoblotting showed that the expression level of ataA increased according to the arabinose concentration of over 0.05% (Figure 4B). Consistent with this, tube-settling assays showed that cells in which AtaA was detectable exhibited self-aggregation, and the aggregation rate increased with higher AtaA levels (Figure 4C).
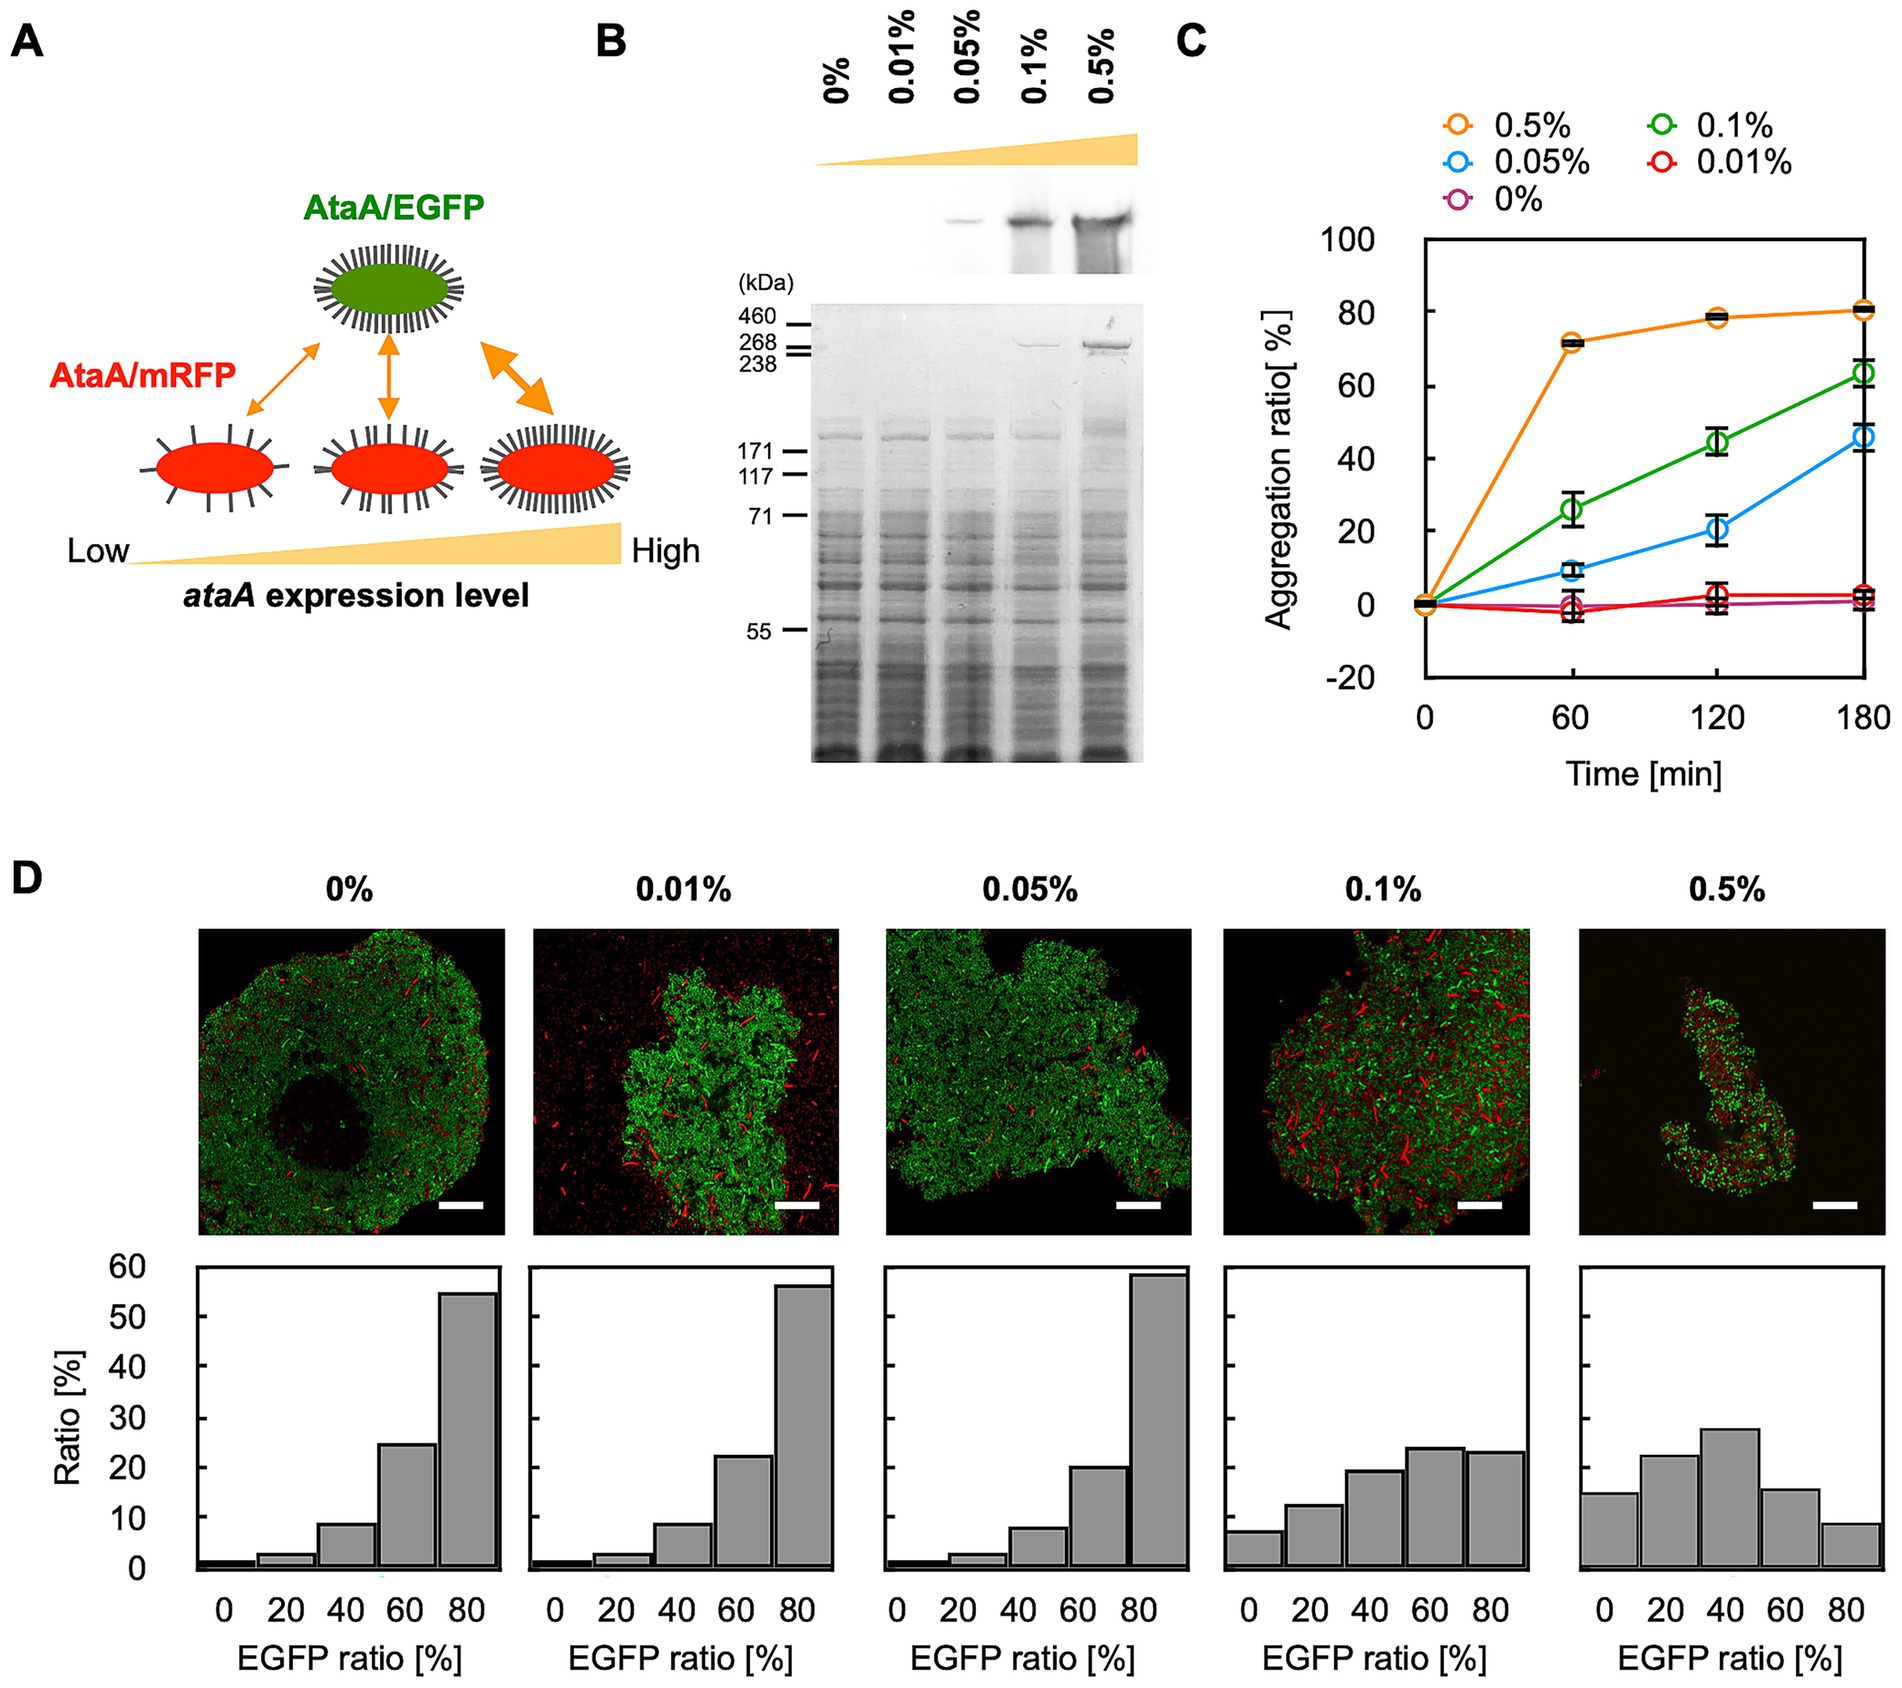
Figure 4. GPIA of co-aggregation mediated by AtaA with different levels of expression. (A) Experimental design: EGFP-AtaA(+) cells induced with 0.5% arabinose were mixed with mRFP-AtaA(+) cells induced with 0, 0.01, 0.05, 0.1, or 0.5% arabinose. (B) Immunoblotting and CBB staining of stepwise increases in AtaA production with higher arabinose concentrations. (C) Tube-settling assay of cells induced with 0, 0.01, 0.05, 0.1, or 0.5% arabinose. The data are presented as the means ± SDs (n = 3). (D) Representative merged CLSM images and corresponding EGFP-ratio histograms calculated from five fields of view by GPIA (≥ 1,000 cells per sample). Confocal images were acquired using a 100×/1.4 NA oil immersion objective lens and saved at a resolution of 1,024 × 1,024 pixels. Data shown are representative of at least two independent biological experiments that yielded similar results. Scale bars: 20 μm.
We then mixed EGFP-AtaA(+) cells grown in 0.5% arabinose with each mRFP-AtaA(+) grown in 0–0.5% arabinose and prepared cell aggregates. GPIA revealed that the proportion of hetero-aggregated grids decreased progressively as the AtaA content of the mRFP cells declined (Figure 4D; Supplementary Table S2). Notably, cells induced with only 0.05% arabinose, which expressed little AtaA and aggregated slowly, were scarcely incorporated into the rapidly forming EGFP-AtaA cell aggregates. These results demonstrate that GPIA can detect expression-dependent differences in cell–cell interaction affinity.
3.4 Analysis of cell–cell interaction mediated by in-frame deletion mutants of AtaA
Previously, we showed that removing the N-terminal head domain (Nhead) significantly decreased cell adhesion to material surfaces, whereas deleting other parts did not. However, the domain responsible for self-aggregation was still unknown. To identify it, we built cells expressing EGFP and in-frame deletion mutants of AtaA that lack each domain (Figure 5A) and mixed them with cells expressing mRFP and full-length AtaA (FL-AtaA). We then observed aggregates with CLSM and analyzed them by GPIA (Figures 5B,C). The cells expressing ΔNS-A1, ΔNS-A2, ΔNS-B, ΔNS-CΔChead, and ΔCstalk formed mixed clumps with cells expressing FL-AtaA and the EGFP-ratio histograms showed a peak at 40–60%, indicating that aggregates comprised the two types of cells in a 1:1 ratio. In contrast, the ΔNhead mutant failed to co-aggregate—only the cells expressing FL-AtaA aggregated, while the ΔNhead cells stayed dispersed. The EGFP-ratio histogram of ΔNhead showed a peak at 0–20%, indicating that aggregates were made almost exclusively of mRFP-AtaA(+) cells. A chi-square test showed a significant difference between ΔNhead and the others in the distribution of EGFP-ratio (Supplementary Figure S3). These results suggest that cell–cell interaction mediated by AtaA is driven mainly by homophilic interactions between Nhead of two different cells.
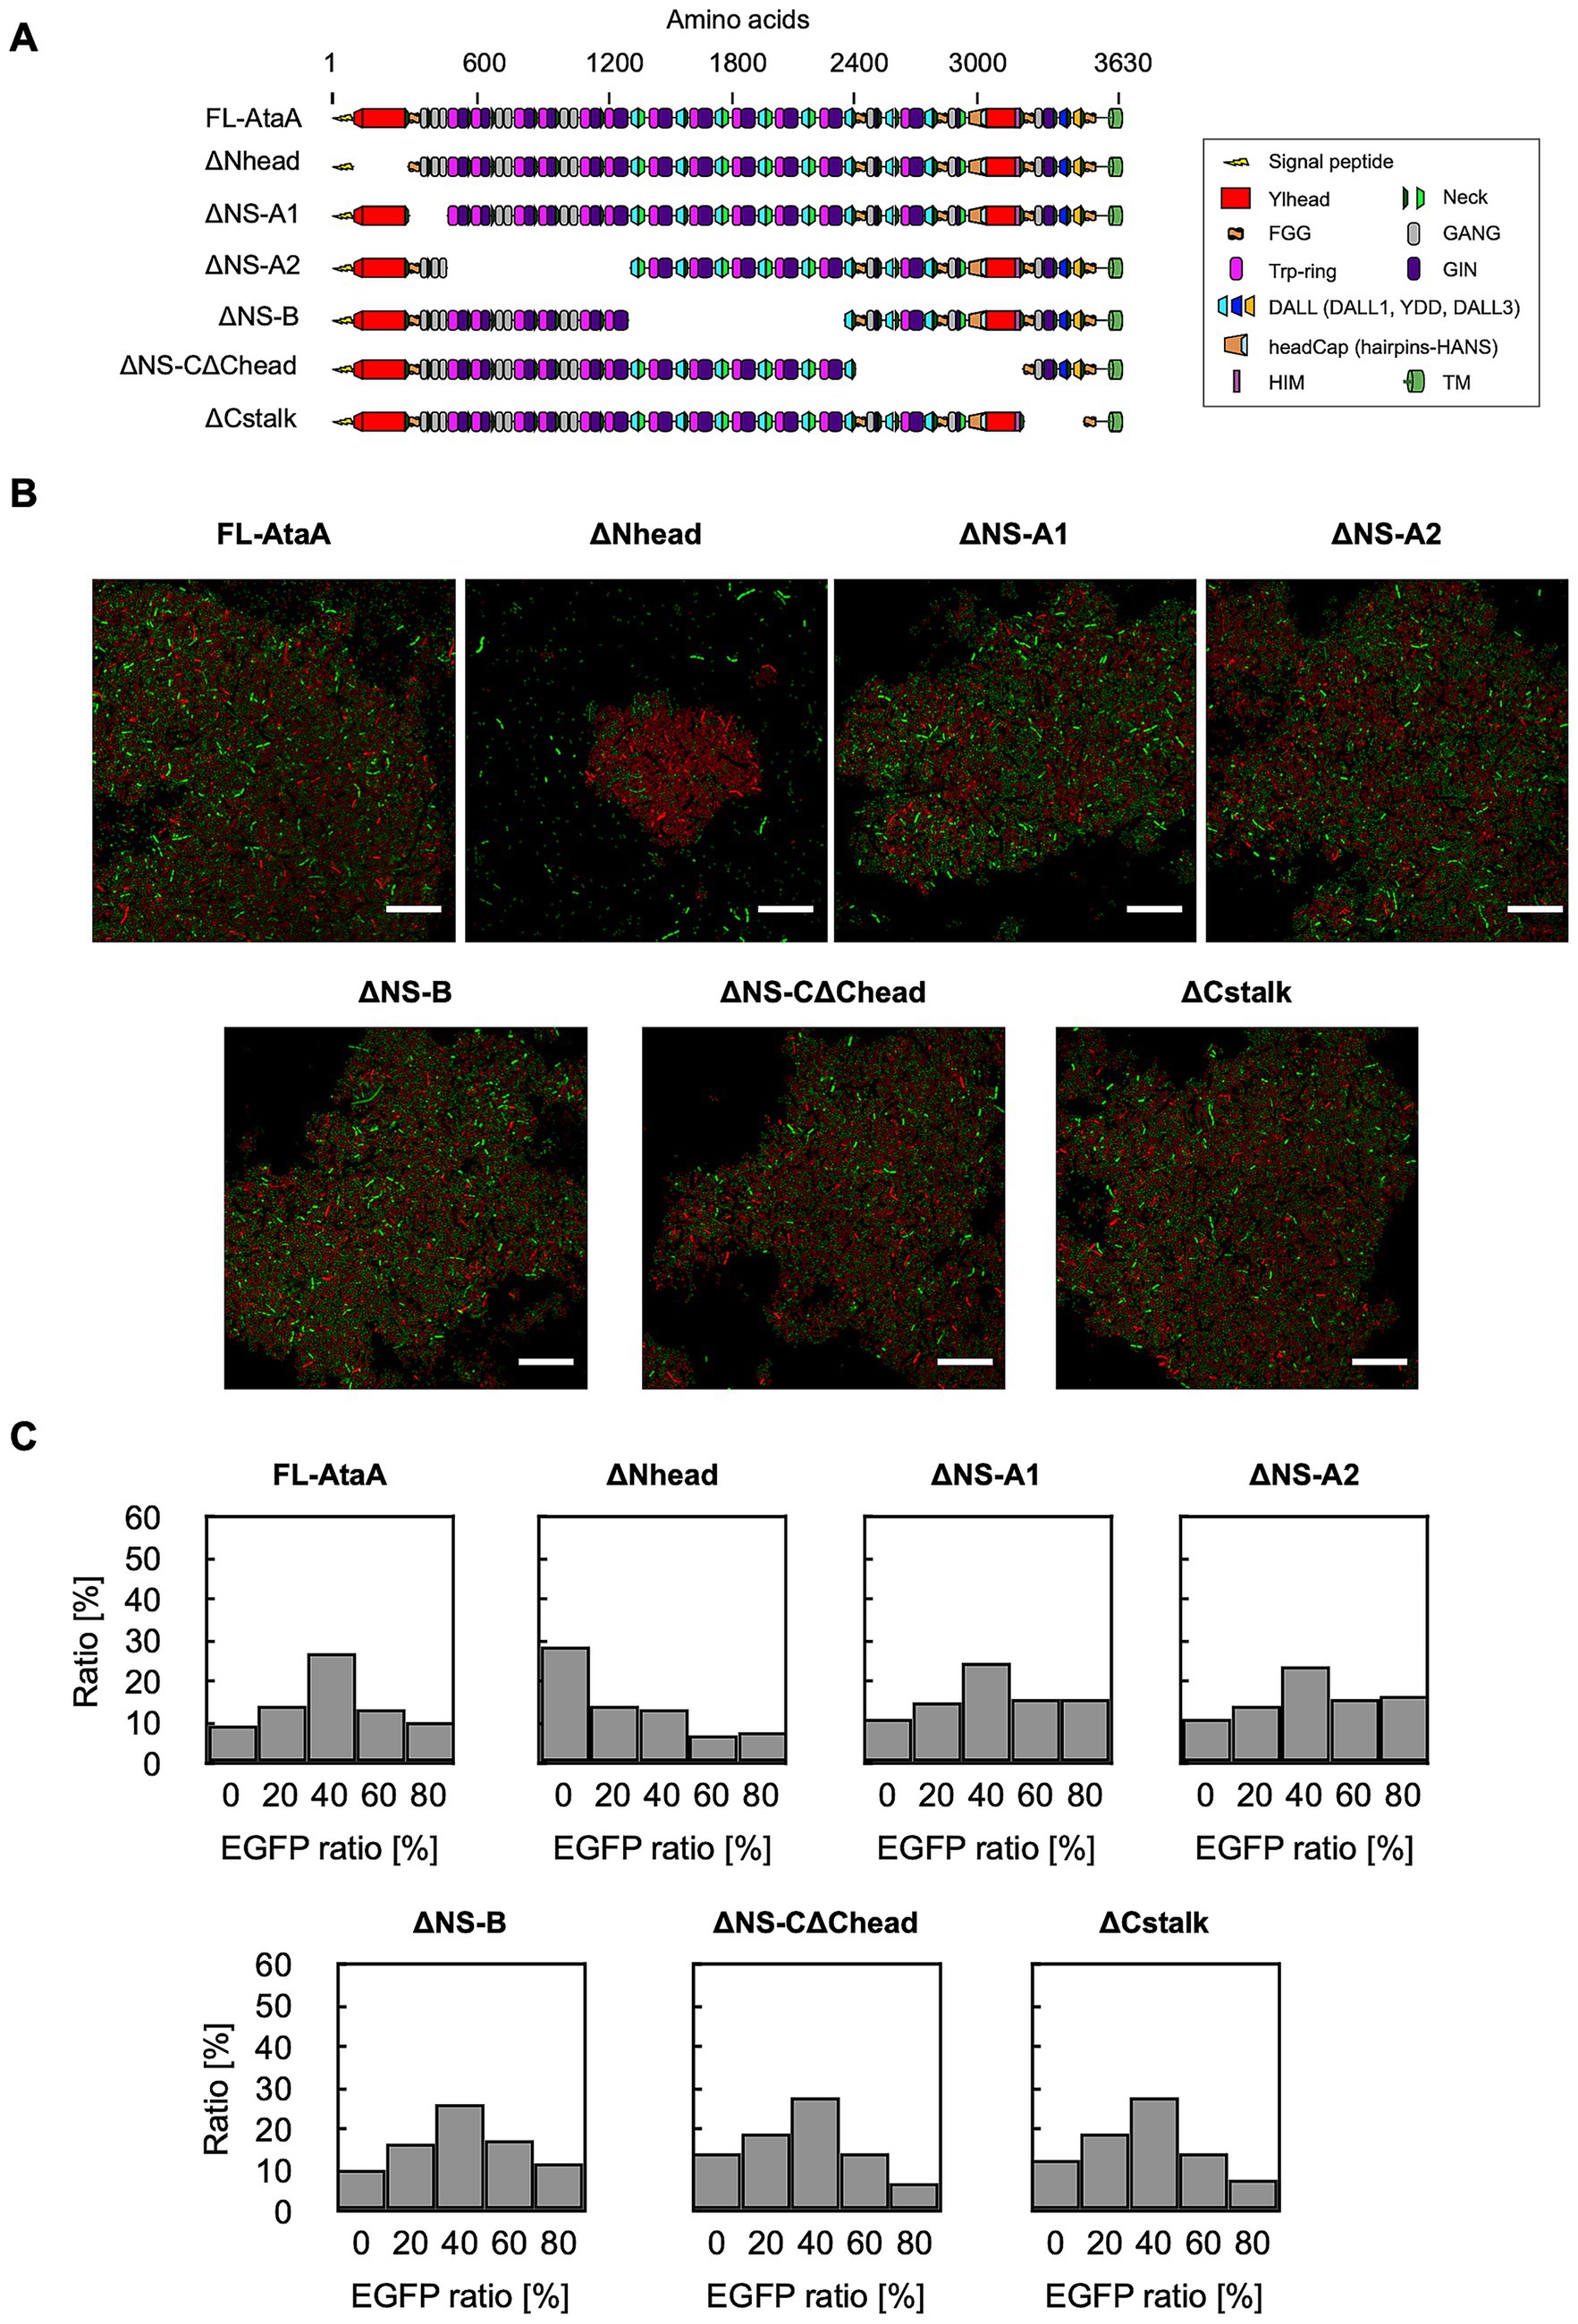
Figure 5. GPIA of cell–cell interaction mediated by in-frame deletion mutants of AtaA. (A) Schematic illustration of full-length AtaA (FL-AtaA) and the in-frame deletion mutants. (B) CLSM images of mixtures containing cells expressing EGFP and AtaA-mutants and cells expressing mRFP and FL-AtaA. Confocal images were acquired using a 100×/1.4 NA oil immersion objective lens and saved at a resolution of 1,024 × 1,024 pixels. Scale bars: 20 μm. (C) EGFP-ratio histograms calculated from five fields of view by GPIA (≥ 1,000 cells per sample). A chi-square test confirmed a significant difference between the ΔNhead and the other mutants (see Supplementary Table S3). Data shown are representative of at least two independent biological experiments that yielded similar results.
4 Discussion
In this study, we developed grid partitioning image analysis (GPIA) that transforms confocal micrographs into quantitative data and resolves both the presence of bacterial aggregates and the composition of the aggregates. The method correctly separated four reference conditions: fully dispersed suspensions, homo aggregates, and two hetero aggregate mixtures (Figure 1). Because GPIA relies only on standard ImageJ functions and a spreadsheet template, the workflow can be completed in minutes without custom code, making it an easy and accessible method. Compared with classical tube-settling assays that monitor turbidity, GPIA overcomes a key limitation: it can measure interactions among strains that are self-aggregative. GPIA enabled detailed analysis of the changes in cell aggregation resulting from variations in AtaA expression levels and from mutations (Figures 4, 5). These results suggest that GPIA is useful for analyzing adhesin mutants, environmental cues, or inhibitory compounds that produce modest phenotypic changes.
In Figure 4, we showed that GPIA detects changes in cell–cell affinity when AtaA expression is modulated with arabinose. A previous proteomic study of Tol 5 ranked AtaA as the second most abundant protein among the 1,977 proteins detected (Inoue et al., 2025). Other TAAs that promote aggregation have likewise been observed in large copy numbers on the cell surface (Hoiczyk et al., 2000; Kaiser et al., 2012), suggesting that TAA-mediated aggregation depends on a high surface density of the adhesin and likely involves cooperative interactions among multiple molecules. Our further analysis using the in-frame deletion mutants suggests that interactions between Nhead domains cause the cell aggregation (Figure 5). Comparable N-terminal head-mediated, zipper-like interactions have been reported for some well-characterized TAAs, Yersinia enterocolitica YadA and Bartonella henselae BadA (Hoiczyk et al., 2000; Kaiser et al., 2012). Because Nhead of AtaA also mediates adhesion to abiotic surfaces (Yoshimoto et al., 2023), this domain can be regarded as a multifunctional domain that mediates both cell–cell aggregation and initial surface adhesion.
By adjusting the grid size, GPIA can be readily applied to aggregation analyses of bacteria with different sizes. For instance, a 4-μm grid is likely appropriate for cells with a diameter of about 2 μm (e.g., some species of Deinococcus, Sarcina, and Aquisphaera) (Bondoso et al., 2011; Floc'h et al., 2019; Marcelino et al., 2021). When examining mixed populations of markedly different sizes, such as bacteria and yeast, it may be necessary to re-optimize both the grid size and the classification thresholds. Cell shape and orientation can also influence the analysis. In this study, local fluorescence intensity peaks were detected with the ImageJ “Find Maxima” function and converted to coordinates. As a result, cell orientation was not considered, and each peak was automatically regarded as the cell centroid. Under our culture conditions (stationary phase), Tol 5 exhibited a nearly spherical coccobacillary morphology (Figure 2D). Consequently, in the observation fields of aggregated cells, as shown in Figure 1B and Supplementary Figure S1, roughly 2 to 8 cells fell within each 2-μm square grid, enabling us to distinguish between hetero- and homo-aggregation. Thus, for a coccobacillus such as Tol 5, cell orientation is unlikely to affect the analysis substantially. In more elongated cells, however, the gap between the actual area occupied by the cell and the centroid derived from the fluorescence peak is expected to widen, lowering analytical accuracy. Therefore, GPIA is considered suitable for cocci and short, nearly spherical rods (coccobacilli).
In GPIA, a small proportion of physically proximate but non-interacting cells may sometimes be counted as aggregates. This can be minimized by diluting the cell suspension before CLSM observation and analyzing a sufficiently large number of fields. When increasing sample size, it is better to increase the number of observed fields rather than increase cell density because high-concentration samples cause misclassification simply due to spatial crowding. Further statistical analysis of the histogram of EGFP-ratio between samples using Pearson’s chi-square test would help to consider the significant differences.
In conclusion, we developed the GPIA, a rapid, simple, and sensitive method for quantitative analysis of bacterial cell aggregation. By converting confocal images into robust numerical data, GPIA bridges the gap between qualitative microscopy and quantitative, yet technically demanding, single-cell analysis. GPIA will accelerate research on cell–cell interactions, which are the basis of important bacterial functions such as surface colonization, tolerance to environmental stress, and interspecies metabolite exchange.
Data availability statement
The original contributions presented in the study are included in the article/Supplementary material, further inquiries can be directed to the corresponding author.
Author contributions
YO: Conceptualization, Methodology, Formal analysis, Writing – original draft, Investigation, Software. SY: Investigation, Writing – review & editing, Writing – original draft. KH: Supervision, Writing – review & editing.
Funding
The author(s) declare that financial support was received for the research and/or publication of this article. This work was supported by the Japan Society for the Promotion of Science (JSPS) KAKENHI (grant numbers JP21H05227 and JP24H00043).
Acknowledgments
The authors thank Tomoya Karakama for his technical assistance.
Conflict of interest
YO was employed by Friend Microbe Inc.
The remaining authors declare that the research was conducted in the absence of any commercial or financial relationships that could be construed as a potential conflict of interest.
The author(s) declared that they were an editorial board member of Frontiers, at the time of submission. This had no impact on the peer review process and the final decision.
Generative AI statement
The author(s) declare that no Gen AI was used in the creation of this manuscript.
Any alternative text (alt text) provided alongside figures in this article has been generated by Frontiers with the support of artificial intelligence and reasonable efforts have been made to ensure accuracy, including review by the authors wherever possible. If you identify any issues, please contact us.
Publisher’s note
All claims expressed in this article are solely those of the authors and do not necessarily represent those of their affiliated organizations, or those of the publisher, the editors and the reviewers. Any product that may be evaluated in this article, or claim that may be made by its manufacturer, is not guaranteed or endorsed by the publisher.
Supplementary material
The Supplementary material for this article can be found online at: https://www.frontiersin.org/articles/10.3389/fmicb.2025.1637462/full#supplementary-material
References
Abudayyeh, O. O., Gootenberg, J. S., Konermann, S., Joung, J., Slaymaker, I. M., Cox, D. B. T., et al. (2016). C2c2 is a single-component programmable RNA-guided RNA-targeting CRISPR effector. Science 353:aaf5573. doi: 10.1126/science.aaf5573
Barbosa, A., Miranda, S., Azevedo, N. F., Cerqueira, L., and Azevedo, A. S. (2023). Imaging biofilms using fluorescence in situ hybridization: seeing is believing. Front Cell Infect Micobiol 13:1195803. doi: 10.3389/fcimb.2023.1195803
Bassler, J., Alvarez, B. H., Hartmann, M. D., and Lupas, A. N. (2015). A domain dictionary of trimeric autotransporter adhesins. Int. J. Med. Microbiol. 305, 265–275. doi: 10.1016/j.ijmm.2014.12.010
Bentancor, L. V., Camacho-Peiro, A., Bozkurt-Guzel, C., Pier, G. B., and Maira-Litrán, T. (2012). Identification of Ata, a multifunctional trimeric autotransporter of Acinetobacter baumannii. J. Bacteriol. 194, 3950–3960. doi: 10.1128/JB.06769-11
Bondoso, J., Albuquerque, L., Nobre, M. F., Lobo-da-Cunha, A., da Costa, M. S., and Lage, O. M. (2011). Aquisphaera giovannonii gen. Nov., sp nov., a planctomycete isolated from a freshwater aquarium. Int. J. Syst. Evol. Microbiol. 61, 2844–2850. doi: 10.1099/ijs.0.027474-0
Costa, J. C., Mesquita, D. P., Amaral, A. L., Alves, M. M., and Ferreira, E. C. (2013). Quantitative image analysis for the characterization of microbial aggregates in biological wastewater treatment: a review. Environ. Sci. Pollut. R. 20, 5887–5912. doi: 10.1007/s11356-013-1824-5
Floc'h, K., Lacroix, F., Servant, P., Wong, Y. S., Kleman, J. P., Bourgeois, D., et al. (2019). Cell morphology and nucleoid dynamics in dividing Deinococcus radiodurans. Nat. Commun. 10:3815. doi: 10.1038/s41467-019-11725-5
Formosa-Dague, C., Feuillie, C., Beaussart, A., Derclaye, S., Kucharíková, S., Lasa, I., et al. (2016). Sticky matrix: adhesion mechanism of the staphylococcal polysaccharide intercellular adhesin. ACS Nano 10, 3443–3452. doi: 10.1021/acsnano.5b07515
Furuichi, Y., Yoshimoto, S., Inaba, T., Nomura, N., and Hori, K. (2020). Process description of an unconventional biofilm formation by bacterial cells autoagglutinating through sticky, long, and peritrichate nanofibers. Environ. Sci. Technol. 54, 2520–2529. doi: 10.1021/acs.est.9b06577
Glass, D. S., and Riedel-Kruse, I. H. (2018). A synthetic bacterial cell-cell adhesion toolbox for programming multicellular morphologies and patterns. Cell 174, 649–658.e16. doi: 10.1016/j.cell.2018.06.041
Gómez-de-Mariscal, E., García-López-de-Haro, C., Ouyang, W., Donati, L., Lundberg, E., Unser, M., et al. (2021). DeepImageJ: a user-friendly environment to run deep learning models in ImageJ. Nat. Methods 18, 1192–1195. doi: 10.1038/s41592-021-01262-9
Hammond, C. R., Hernández, M. S. G., and Loge, F. J. (2025). Microalgal-bacterial aggregates for wastewater treatment: origins, challenges, and future directions. Water Environ. Res. 97:e70018. doi: 10.1002/wer.70018
Hartmann, R., Jeckel, H., Jelli, E., Singh, P. K., Vaidya, S., Bayer, M., et al. (2021). Quantitative image analysis of microbial communities with BiofilmQ. Nat. Microbiol. 6, 151–156. doi: 10.1038/s41564-020-00817-4
Hoiczyk, E., Roggenkamp, A., Reichenbecher, M., Lupas, A., and Heesemann, J. (2000). Structure and sequence analysis of Yersinia YadA and Moraxella UspAs reveal a novel class of adhesins. EMBO J. 19, 5989–5999. doi: 10.1093/emboj/19.22.5989
Inoue, S., Yoshimoto, S., and Hori, K. (2025). A new target of multiple lysine methylation in bacteria. J. Bacteriol. 207, e00325–e00324. doi: 10.1128/jb.00325-24
Ishikawa, M., Nakatani, H., and Hori, K. (2012). AtaA, a new member of the trimeric autotransporter adhesins from Acinetobacter sp. Tol 5 mediating high adhesiveness to various abiotic surfaces. PLoS One 7:e48830. doi: 10.1371/journal.pone.0048830
Ishikawa, M., Shigemori, K., and Hori, K. (2014). Application of the adhesive bacterionanofiber AtaA to a novel microbial immobilization method for the production of indigo as a model chemical. Biotechnol. Bioeng. 111, 16–24. doi: 10.1002/bit.25012
Jeckel, H., and Drescher, K. (2021). Advances and opportunities in image analysis of bacterial cells and communities. FEMS Microbiol. Rev. 45, 1–14. doi: 10.1093/femsre/fuaa062
Kaiser, P. O., Linke, D., Schwarz, H., Leo, J. C., and Kempf, V. A. J. (2012). Analysis of the BadA stalk from Bartonella henselae reveals domain-specific and domain-overlapping functions in the host cell infection process. Cell. Microbiol. 14, 198–209. doi: 10.1111/j.1462-5822.2011.01711.x
Khalil, H. S., Ogaard, J., and Leo, J. C. (2020). Coaggregation properties of trimeric autotransporter adhesins. Microbiology 9:e1109. doi: 10.1002/mbo3.1109
Kragh, K. N., Tolker-Nielsen, T., and Lichtenberg, M. (2023). The non-attached biofilm aggregate. Commun. Biol. 6:898. doi: 10.1038/s42003-023-05281-4
Kruse, S., Turkowsky, D., Birkigt, J., Matturro, B., Franke, S., Jehmlich, N., et al. (2021). Interspecies metabolite transfer and aggregate formation in a co-culture of Dehalococcoides and Sulfurospirillum dehalogenating tetrachloroethene to ethene. ISME J. 15, 1794–1809. doi: 10.1038/s41396-020-00887-6
Leo, J. C., Grin, I., and Linke, D. (2012). Type V secretion: mechanism(s) of autotransport through the bacterial outer membrane. Philos. Trans. R. Soc. Lond. Ser. B Biol. Sci. 367, 1088–1101. doi: 10.1098/rstb.2011.0208
Li, S. K., Jiang, G. L., Wang, S. K., Wang, M., Wu, Y. L., Zhang, J. Z., et al. (2025). Emergence and global spread of a dominant multidrug-resistant clade within Acinetobacter baumannii. Nat. Commun. 16:2787. doi: 10.1038/s41467-025-58106-9
Liu, H. Y., Prentice, E. L., and Webber, M. A. (2024). Mechanisms of antimicrobial resistance in biofilms. NPJ Antimicrob Resist 2:27. doi: 10.1038/s44259-024-00046-3
Lutz, R., and Bujard, H. (1997). Independent and tight regulation of transcriptional units in Escherichia coli via the LacR/O, the TetR/O and AraC/I-1-I-2 regulatory elements. Nucleic Acids Res. 25, 1203–1210. doi: 10.1093/nar/25.6.1203
Lyskowski, A., Leo, J. C., and Goldman, A. (2011). “Structure and biology of trimeric autotransporter adhesins” in Bacterial adhesion. ed. D. G. Linke (Dordrecht: Springer), 143–158.
Marcelino, L. P., Valentini, D. F., Machado, S., Schaefer, P. G., Rivero, R. C., and Osvaldt, A. B. (2021). Sarcina ventriculi a rare pathogen. Autops. Case Rep. 11:e2021337. doi: 10.4322/acr.2021.337
Meuskens, I., Saragliadis, A., Leo, J. C., and Linke, D. (2019). Type V secretion systems: an overview of passenger domain functions. Front. Microbiol. 10:1163. doi: 10.3389/fmicb.2019.01163
Najim, A. A., Radeef, A. Y., al-Doori, I., and Jabbar, Z. H. (2024). Immobilization: the promising technique to protect and increase the efficiency of microorganisms to remove contaminants. J. Chem. Technol. Biotechnol. 99, 1707–1733. doi: 10.1002/jctb.7638
Nwoko, E. S. Q. A., and Okeke, I. N. (2021). Bacteria autoaggregation: how and why bacteria stick together. Biochem. Soc. Trans. 49, 1147–1157. doi: 10.1042/BST20200718
Paula, A. J., Hwang, G., and Koo, H. (2020). Dynamics of bacterial population growth in biofilms resemble spatial and structural aspects of urbanization. Nat. Commun. 11:1354. doi: 10.1038/s41467-020-15165-4
Prudent, E., and Raoult, D. (2019). Fluorescence in situ hybridization, a complementary molecular tool for the clinical diagnosis of infectious diseases by intracellular and fastidious bacteria. FEMS Microbiol. Rev. 43, 88–107. doi: 10.1093/femsre/fuy040
Rooke, J. L., Icke, C., Wells, T. J., Rossiter, A. E., Browning, D. F., Morris, F. C., et al. (2021). BamA and BamD are essential for the secretion of trimeric autotransporter adhesins. Front. Microbiol. 12:628879. doi: 10.3389/fmicb.2021.628879
Schneider, C. A., Rasband, W. S., and Eliceiri, K. W. (2012). NIH image to ImageJ: 25 years of image analysis. Nat. Methods 9, 671–675. doi: 10.1038/nmeth.2089
Sethi, S., Gupta, R., Bharshankh, A., Sahu, R., and Biswas, R. (2023). Celebrating 50 years of microbial granulation technologies: from canonical wastewater management to bio-product recovery. Sci. Total Environ. 872:162213. doi: 10.1016/j.scitotenv.2023.162213
Shields, R. C., Kaspar, J. R., Lee, K., Underhill, S. A. M., and Burne, R. A. (2019). Fluorescence tools adapted for real-time monitoring of the behaviors of Streptococcus species. Appl Environ Microb 85, e00620–e00619. doi: 10.1128/AEM.00620-19
Sieber, F., and Roseman, S. (1981). Quantitative analysis of intercellular adhesive specificity in freshly explanted and cultured cells. J. Cell Biol. 90, 55–62. doi: 10.1083/jcb.90.1.55
Simon, R., Priefer, U., and Puhler, A. (1983). A broad host range mobilization system for in vivo genetic engineering: transposon mutagenesis in gram-negative bacteria. Nat. Biotechnol. 1, 784–791. doi: 10.1038/nbt1183-784
Tram, G., Poole, J., Adams, F. G., Jennings, M. P., Eijkelkamp, B. A., and Atack, J. M. (2021). The Acinetobacter baumannii autotransporter adhesin Ata recognizes host glycans as high-affinity receptors. Acs Infect Dis 7, 2352–2361. doi: 10.1021/acsinfecdis.1c00021
Trunk, T., Khalil, H. S., and Leo, J. C. (2018). Bacterial autoaggregation. AIMS Microbiol. 4, 140–164. doi: 10.3934/microbiol.2018.1.140
Weidensdorfer, M., Ishikawa, M., Hori, K., Linke, D., Djahanschiri, B., Iruegas, R., et al. (2019). The Acinetobacter trimeric autotransporter adhesin Ata controls key virulence traits of Acinetobacter baumannii. Virulence 10, 68–81. doi: 10.1080/21505594.2018.1558693
Keywords: microscopy, image analysis, trimeric autotransporter adhesin, cell aggregation, Acinetobacter
Citation: Ohara Y, Yoshimoto S and Hori K (2025) Grid partitioning image analysis of highly aggregative bacterium Acinetobacter sp. Tol 5. Front. Microbiol. 16:1637462. doi: 10.3389/fmicb.2025.1637462
Edited by:
Tsutomu Tanaka, Kobe University, JapanReviewed by:
Joana Vilas Boas, University of Porto, PortugalYannick Rossez, UMR8576 Unité de Glycobiologie Structurale et Fonctionnelle (UGSF), France
Copyright © 2025 Ohara, Yoshimoto and Hori. This is an open-access article distributed under the terms of the Creative Commons Attribution License (CC BY). The use, distribution or reproduction in other forums is permitted, provided the original author(s) and the copyright owner(s) are credited and that the original publication in this journal is cited, in accordance with accepted academic practice. No use, distribution or reproduction is permitted which does not comply with these terms.
*Correspondence: Katsutoshi Hori, a2hvcmlAY2hlbWJpby5uYWdveWEtdS5hYy5qcA==
†These authors have contributed equally to this work and share first authorship