 Vladimir Panteleev
 Andrey Kulbachinskiy
 Daria Gelfenbein
- 1Laboratory of Antimicrobial Agents, Institute of Gene Biology, Russian Academy of Sciences, Moscow, Russia
- 2Laboratory of Prokaryotic Immune Systems, Institute of Gene Biology, Russian Academy of Sciences, Moscow, Russia
Bacteriophages are the most abundant biological entities on Earth, playing critical roles in microbial ecology, evolution, and horizontal gene transfer. Since the discovery of bacteriophages in the early 20th century, a wide range of techniques has been developed to study their lytic activity. This review provides a perspective on the wide range of methods for studying phage-bacteria interactions, spanning classical bulk-culture techniques and modern single-cell and high-throughput approaches. The first section covers solid culture methods relying on plaque formation phenomenon, which allow for quantification of infectious viruses, phage host-range establishment, and analysis of certain phage traits, now augmented by robotic high-throughput screening. The second section focuses on liquid culture approaches, utilizing optical density measurements, quantitative PCR, metabolic assays and cell damage assays to measure the infection dynamics. The third section details single-cell techniques, which help to dissect the heterogeneity of infection within cell populations, using microscopy, microfluidics, next-generation sequencing, and Hi-C methods. The integration of these diverse methods has greatly advanced our understanding of the molecular mechanisms of phage infection, bacterial immunity, and facilitated phage therapy development. This review is dedicated to the 110th anniversary of phage discovery and is aimed to guide researchers in selecting optimal techniques in the fast-growing field of phage biology, phage-host interactions, bacterial immunity, and phage therapy.
Introduction
Bacteriophages (or phages) are viruses that infect bacteria and use cell machinery for own replication. Phages were independently discovered by Twort (1915) and de Herelle (1917), who later pioneered therapeutic applications of phages for treating bacterial diseases. Twort worked with bacteria contaminating smallpox vaccines and noticed destruction areas in the bacterial colonies caused by an unknown agent, while d’Herelle observed that filtered stool extracts from dysentery patients could lyse pathogenic bacterial cultures. He identified the lytic agent as an invisible entity, naming it “bacteriophage” (from “bacterium” and Greek “phagein,” meaning “to eat”).
Phages consist of a nucleic acid genome (DNA or RNA) encapsulated in a protein coat, sometimes with a lipid envelope (Keen, 2015). Phages are the most abundant biological entities on Earth, with an estimated global population of ~10 (Strathdee et al., 2023) outnumbering bacteria by an order of magnitude (Strange et al., 2021; Batinovic et al., 2019; Mushegian, 2020). They can be found in all environments where their bacterial hosts can exist, including soil, water, and living organisms (Batinovic et al., 2019; Weinbauer, 2004). Furthermore, they can infect bacteria that live in extreme conditions such as hot springs, acid and alkaline environments, high-salinity media, and polar ice (Gil et al., 2021; Heinrichs et al., 2024; Goordial et al., 2017). Currently, the diversity and roles of bacteriophages in the microbiomes of living organisms, including humans, is actively being studied (Zhang and Wang, 2023; Townsend et al., 2021). The modern taxonomy of bacteriophages can be found on the International Committee on Taxonomy of Viruses (ICTV) website and is continuously updated (Lefkowitz et al., 2018).
Phages can be classified as virulent or temperate based on their life cycles. Virulent phages synthesize progeny and induce cell lysis shortly after infecting the host (Clokie et al., 2011), whereas temperate phages can either enter a dormant prophage state (lysogeny), coexisting with the bacterial host, or switch to the lytic cycle, producing virions and lysing the cell (Clokie et al., 2011). The choice between lytic and lysogenic cycles is tightly regulated (Clokie et al., 2011; Bruce et al., 2021; Erez et al., 2017). Some phages establish chronic infections, during which host cells continuously release viral particles without lysis (Hay and Lithgow, 2019).
Phages drove research in the “golden era” of molecular biology serving as model systems to uncover fundamental biological mechanisms (Serwer, 2025). Recent years have seen the resurgence of phages in the studies of bacterial immunity. Bacteriophages exert evolutionary pressure on susceptible bacterial strains, stimulating the development of strategies to evade or suppress infection. Through co-evolution, bacteria have evolved a diverse array of immune systems to combat viruses. These protective mechanisms include restriction-modification systems, the CRISPR-Cas system, BREX systems, Argonaute proteins, and many other known and unknown systems (Bernheim and Sorek, 2020). Infected bacteria can initiate a process known as abortive infection to protect the population from further viral replication through altruistic suicide (Lopatina et al., 2020). In turn, viruses have evolved a diverse array of anti-immune systems to counteract bacterial defenses (Georjon and Bernheim, 2023; Mayo-Muñoz et al., 2023; Gao and Feng, 2023). This host-phage arms race not only has driven the evolution of prokaryotic immune systems, but also gave rise to eukaryotic innate immunity (Georjon and Bernheim, 2023; Mayo-Muñoz et al., 2023; Gao and Feng, 2023).
Phages play diverse ecological roles. Bacterial viruses mediate horizontal gene transfer among prokaryotes, disseminating antibiotic resistance and virulence genes through the transduction process, with major medical implications (Wagner and Waldor, 2002; Fortier and Sekulovic, 2013; Chiang et al., 2019). They regulate bacterial population abundance, with estimated 15–40% of marine bacteria lysed daily by phages, impacting global nutrient availability and carbon geocycles (Keen, 2015; Wilhelm and Suttle, 1999). Phages shape the microbial community structure in various ecological niches by increasing viral pressure on dominant species, thereby promoting biodiversity (Weinbauer, 2004; Naureen et al., 2020). Notably, phage-mediated modulation of animal microbiota can influence the health of the host organism, including humans (Cryan and Dinan, 2012). Today, phage therapy is re-emerging as a promising solution to the rising threat of antibiotic resistance (Skurnik et al., 2025; Strathdee et al., 2023; Lin et al., 2017). The outcome of phage therapy critically depends on dynamic interactions between replicating phages, target bacteria, and the host immune system, and its successful development will require evaluation of detailed pharmacokinetic/pharmacodynamic parameters for phages used in treatment of specific infections (Nang et al., 2023; Hamdi et al., 2025).
The study of bacteriophages has evolved significantly over the past century, driven by advances in research methodologies. The authors recommend the review by Letarov (2020) for a detailed history of early phage research. Initial phage studies relied on basic microscopy and plaque assays to observe phage behavior and quantify their activity. The development of electron microscopy in the mid-20th century allowed scientists to visualize phage structures in detail, revealing their complex morphology. Molecular biology techniques enabled researchers to analyze phage genomes and understand their replication mechanisms.
Modern phage research spans multiple disciplines. High-throughput sequencing and bioinformatics have revolutionized this field, allowing for large-scale genomic analysis and the discovery of novel phages. Advanced imaging techniques, like cryo-electron microscopy, have provided unprecedented insights into phage structure and phage-host interactions at the molecular level. Beyond classical virology and phage molecular biology, now accelerated by cutting-edge tools, multiple studies focus on single-cell analysis of phage-host interactions.
We now witness a renaissance in phage research, with highly exciting strategies of phage infection and bacterial antiphage immunity discovered in recent years. Here, we systematically evaluate methods for studying the phage lytic activity, including classical and modern approaches. In particular, we cover the methods based on phage plaque formation, detection of phage lytic activities in liquid cultures, and cutting-edge approaches for studying viral infections at the single-cell level. The aim of this review is to track the evolution of phage research and assist scientists working in this field in selecting proper techniques in various fields of phage research. A short graphical introduction to the history of phage research and methodologies is shown in Figure 1. The key virological and microbiological terms used in phage research are defined in the Glossary.
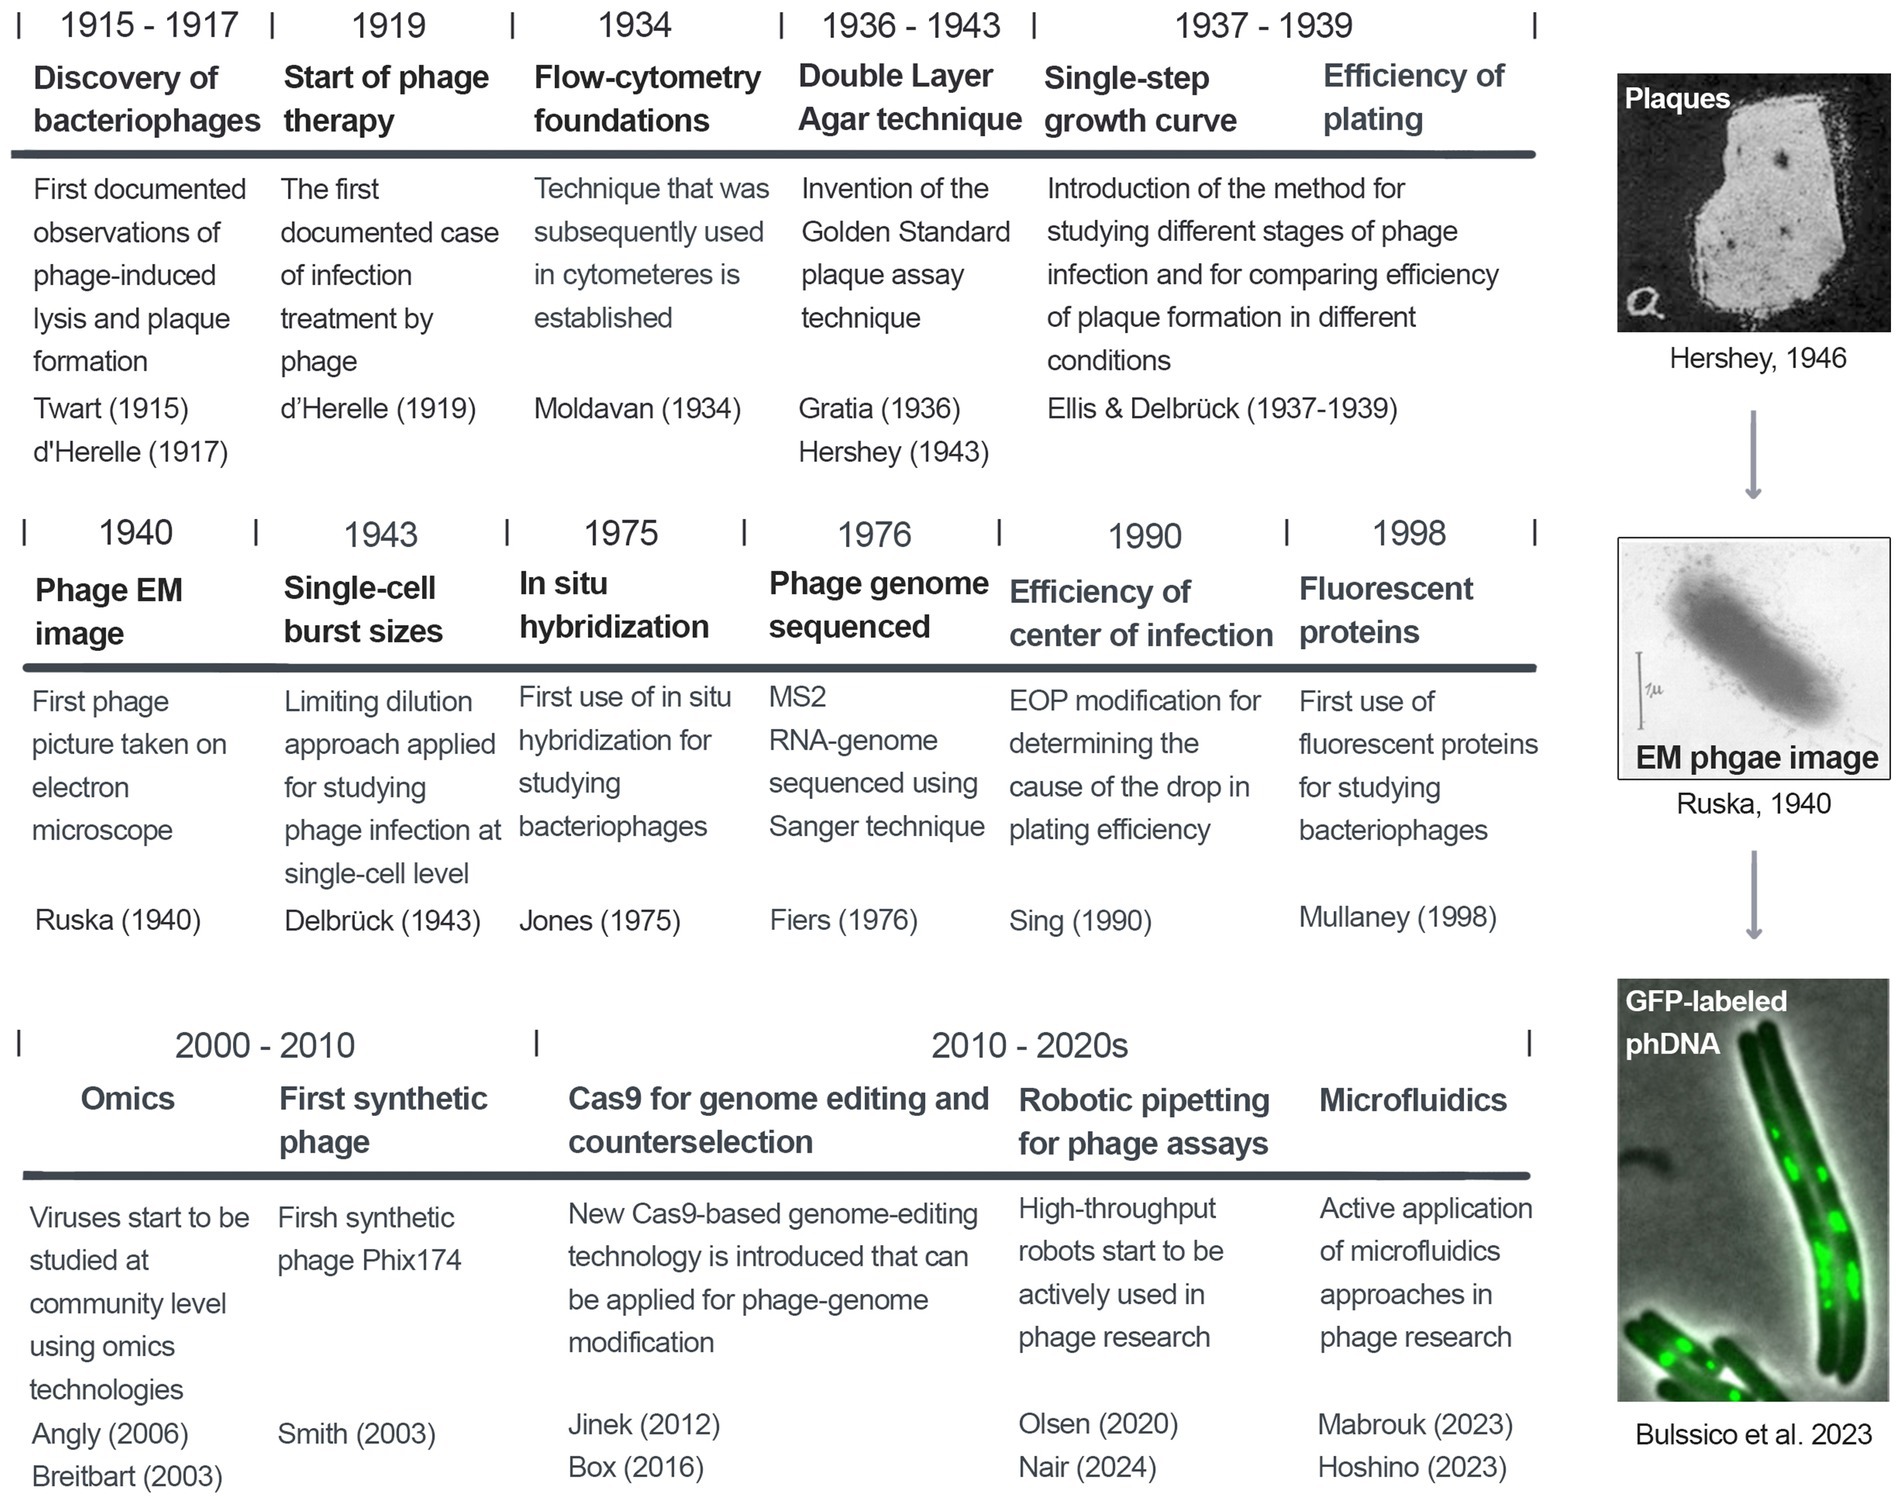
Figure 1. A chronological view of milestones in phage research.
Methods to study bacteriophages in solid culture
The analysis of viral infections can be performed using either solid or liquid media, with distinct characteristics of aeration, nutrient diffusion rates, microbial distribution, and system homogeneity (Sinha et al., 2018; Somerville and Proctor, 2013). The cultures in solid (usually agar-based) media exhibit spatial heterogeneity, since viral particles diffuse more slowly through the semi-solid matrix, resulting in localized infection patterns. When a single virion infects a cell embedded in agar, its progeny can only infect nearby bacteria, leading to the formation of distinct circular zones of growth inhibition – plaques – around each initial infection site (Abedon and Yin, 2009) (Figure 2A). The groundbreaking observation was made in de Herelle (1917), who established the basis for plaque-based phage research.
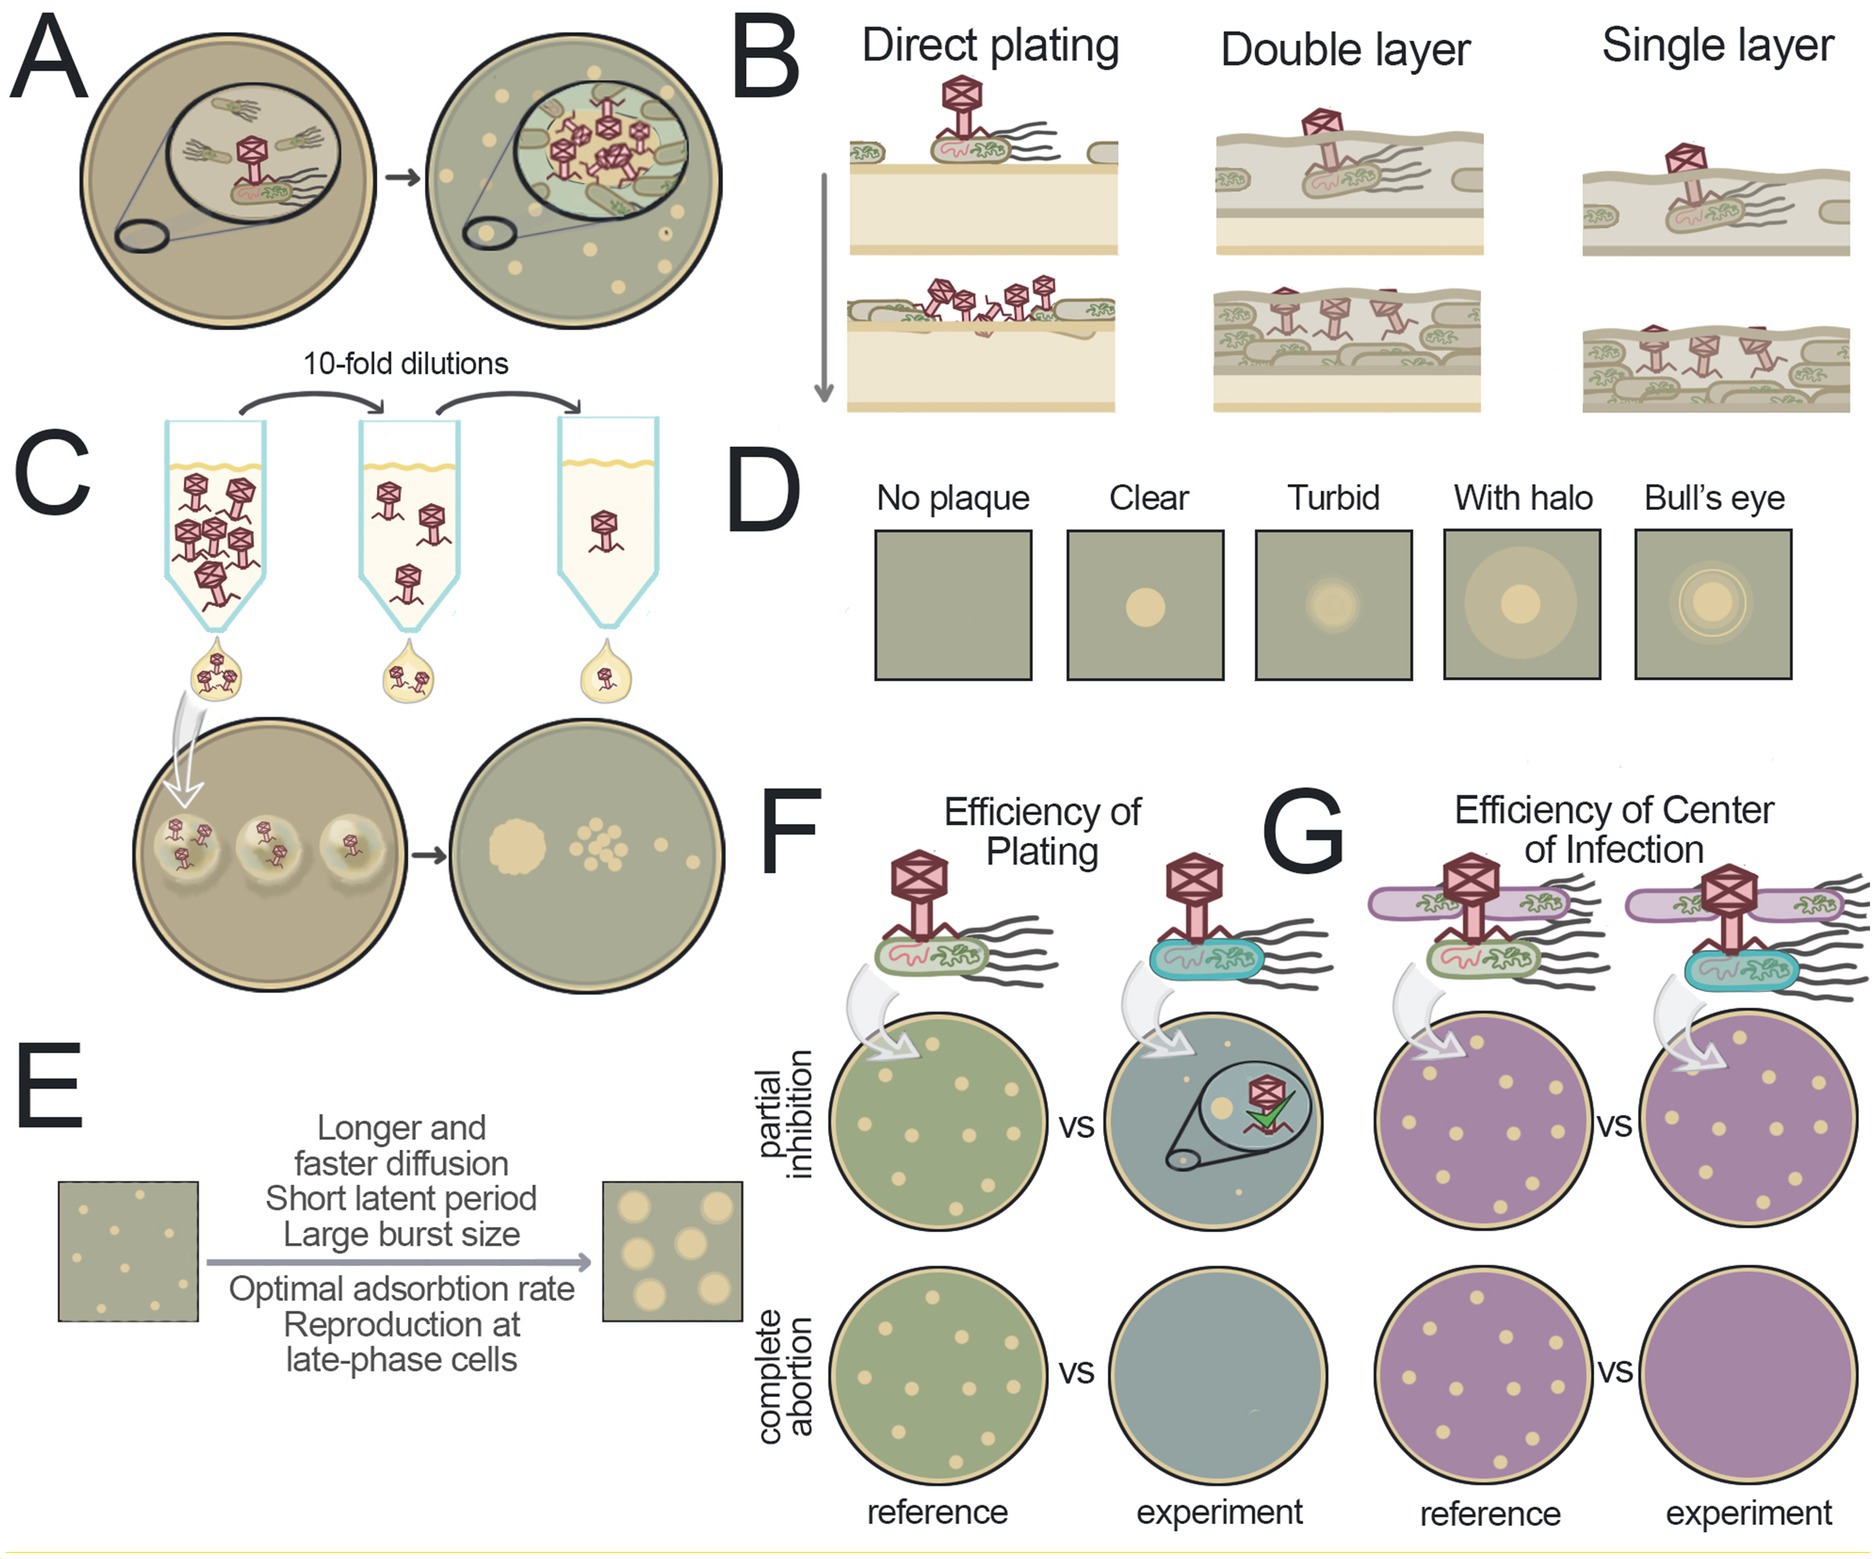
Figure 2. Studying phages in solid media. (A) Scheme of plaque formation. A zone of high phage concentration forms around the initially infected bacterium. The diffusion of virions leads to the infection of nearby bacteria, resulting in the appearance of a clear area on the agar lawn compared to the surrounding area with confluent lawn of bacteria. (B) Schematic representation of the positioning of bacteria and viruses in agar during plaque formation for various plaque assay methods. Yellow media represent solid agar, green media represent soft agar. (C) Spot test approach. Virus dilutions are applied in small volumes to the surface of solid media containing bacteria. After incubation, plaques are visible at the spots where droplets were applied, indicating successful infection. (D) Examples of different plaque morphologies. (E) Factors that contribute to the increased plaque size. (F) Efficiency of plating. This method measures the ability of a virus to form plaques under different conditions. In the example shown, the variable condition is the bacterial strain, green or blue. The use of the blue strain results in a reduced plaque-forming ability of the virus, which may manifest as faint plaques or the absence of plaques. (G) Efficiency of the center of infection. This method distinguishes between complete ineffectiveness of the viral infection and partial suppression. The strain of interest is incubated with a virus, unadsorbed particles are removed, and the cells are plated on a lawn formed by phage-sensitive bacteria (shown in purple). In the case of partial inhibition in blue bacteria, a small amount of virus will be produced, which will successfully form plaques on the purple sensitive bacteria (top). In the case of complete suppression of infection in blue bacteria, the initial viral particles will be lost and will not produce progeny, with no plaques formed (bottom).
This section details plaque assay methodologies, their significance in phage research, and explains how plaque characteristics can provide insights into viral behavior under varying conditions. These methods are summarized in Table 1 and Figure 2.
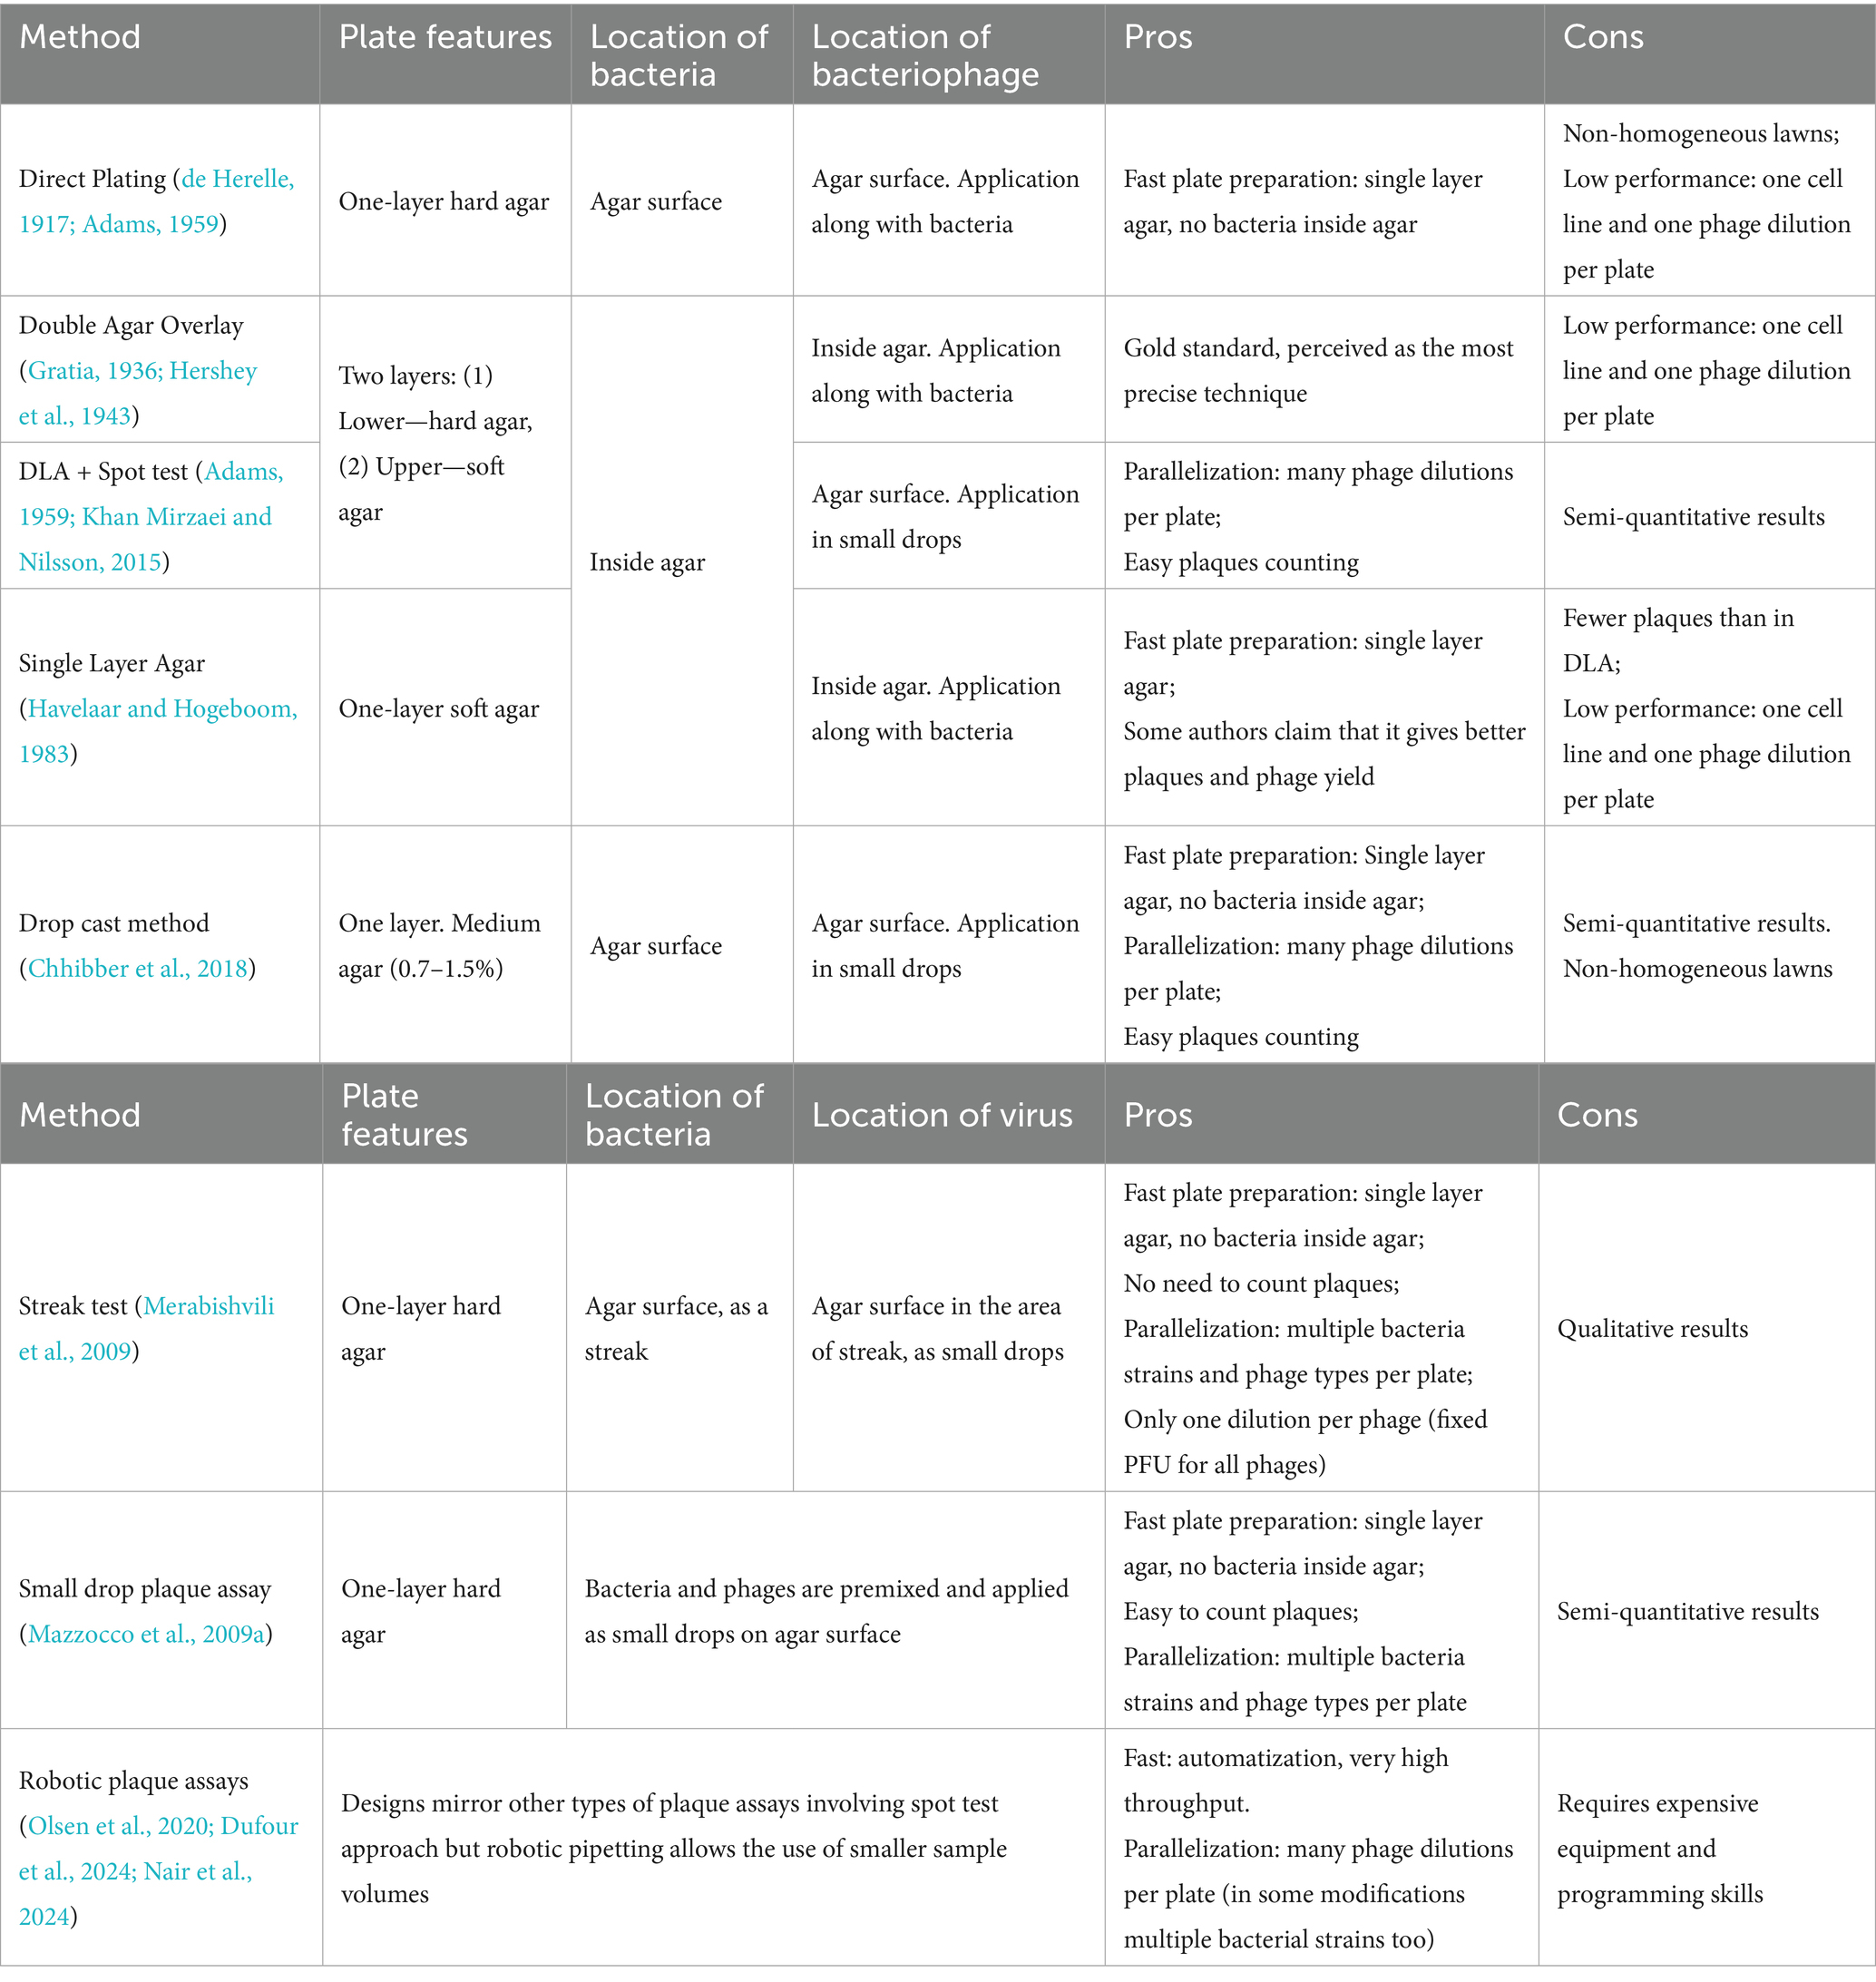
Table 1. Different plaque assay approaches.
Different approaches for getting phage plaques
Standard plaque assays require three key components: (1) the virus, (2) a susceptible bacterial strain, and (3) a solid growth medium. For plaques to form, bacteria must form a confluent lawn around infectious viral particles. Two primary methods exist for preparing a bacterial lawn: (1) surface spreading of bacteria on solid agar, or (2) mixing of bacteria with molten soft agar before pouring into plates. Viruses can be introduced to the bacterial culture via: (1) pre-adsorption to bacterial cells before plating, (2) direct addition of phage to the medium, or Keen (2015) surface application of phage post-solidification.
The methods discussed in this section represent adaptations of the d’Herelle plaque assay, also known as the Spreading Method (Adams, 1959) or Direct Plating Plaque Assay (Mazzocco et al., 2009a). The Direct Plating method involves preparing an agar Petri dish, applying a mixture of bacteria and virus to its surface, and incubating the plate until plaques become visible (Figure 2B).
The most widely adopted technique, which has become the gold standard for plaque formation experiments, was independently developed by two groups of researchers in the 1940s (Gratia, 1936; Hershey et al., 1943) and is known as the Double Layer Agar (DLA) method (also called the Agar Layer method or Soft Agar Overlay) (Figure 2B). The method utilizes a two-layer agar system with the lower supporting agar serving as a source of nutrients for bacteria residing in the top soft agar. Bacteria with pre-adsorbed viruses are added to the melted soft agar and poured onto the plate with solidified lower agar. The low percentage of agar in the top layer promotes faster virion diffusion. Compared to direct plating on solid agar, DLA yields more homogeneous lawns, clearer plaques, and higher efficiency of plaque formation (Adams, 1959; Hershey et al., 1943). However, in this system bacterial physiology varies with depth – surface layers are oxygen-rich, while deeper regions become anaerobic due to limited gas exchange (Somerville and Proctor, 2013). As a result, some bacteria may switch to anaerobic metabolism. These oxygen gradients can alter phage behavior and plaque morphology.
A simplified variant of the DLA method is the Single Layer Agar (SLA) method that omits the bottom agar layer (Figure 2B). Although some studies report slightly reduced plaque counts with this approach – which can be corrected using calibration factors – SLA may enhance virion production and offers practical advantages such as faster setup, reduced resource consumption, and comparable or even superior results under certain conditions (Manikantha et al., 2022; Paranos et al., 2024; Havelaar and Hogeboom, 1983). Like DLA, SLA is widely used for environmental phage detection (Pascual-Benito et al., 2022; Fanaei et al., 2021; Korajkic et al., 2021; Cho et al., 2018; McMinn et al., 2018; Rodríguez et al., 2012).
To make the plaque assay faster, small volumes of viral suspensions can be applied to the surface of a plate as droplets. This approach, known as the Spot Test, allows for parallel testing of multiple phages stocks and phage dilutions on a single plate (Figure 2C) (Khan Mirzaei and Nilsson, 2015).
The Drop Cast method combines elements of the Direct Plating plaque assay and the Spot Test approach. Similar to Direct Plating, bacteria are not inoculated into agar but are applied to a single-layer hard-agar plate using a flooding technique (Chhibber et al., 2018). Phage dilutions are then added to the surface as droplets. A related technique, called the Small-Drop plaque assay (Mazzocco et al., 2009b) uses small volumes of both virus and bacteria, which are mixed together and applied to the surface of solid agar in droplets. After incubation, small circular lawns with plaques appear on the agar surface. A major advantage of the Small-Drop assay is that it allows testing multiple bacterial strains and different viruses on a single plate.
The use of robots can significantly accelerate the experiments relying on plaque formation but the need for expensive equipment makes robotic methods rarely used compared to manual techniques. Such methods are generally similar to the Spot Test approach but allow for smaller volumes and larger number of samples as robotic dispensing is much more precise. Published methods differ in the protocol specifics and the level of miniaturization. In the study by Olsen et al. (2020), a classic combination of DLA and Spot Test is used: small volumes of virus are applied to the surface of soft agar with bacteria on a square plate, with volumes not exceeding 1 μL, totaling 96 phage dilutions per plate. The method of Dufour et al. (2024) resembles a high-throughput Drop Cast technique: bacteria are applied to the surface of a square agar plate using flooding, and robot applies 5 μL virus samples on the surface. This also allows for the application of up to 96 samples per plate. In comparison, a high-throughput Micro-Plaque Assay employs robotic pinning platform with a capacity of 1,536 samples per plate (Nair et al., 2024). In this method, 100 nL bacterial samples are applied to a plate with nutrient agar, followed by an equal volume of viral samples deposited by a robot. Similar to the Small-Drop plaque assay, small circular lawns are formed (though much smaller in size) after a short incubation period. Currently, this is the fastest version of the plaque assay for large-scale studies.
Phage DisCo (Phage Discovery by Co-Culture) (Rand et al., 2025) is an advanced adaptation of classical solid-medium techniques. It employs multiple bacterial strains, each labeled with distinct fluorescent markers, within a single sample to investigate receptors, phage defense systems, and other cellular components critical to infection dynamics. Formation of a clear plaque indicates that all co-cultured strains are susceptible to lysis by the studied phages. Conversely, colored plaques indicate resistance of the corresponding fluorescently tagged strain to infection. This approach enables rapid, parallel screening of host-range specificity in mixed samples.
Factors affecting plaque morphology
Analysis of the plaque morphology can be used to evaluate the lytic activity of phages. Distinct clear plaques reflect potent lytic activity, while turbid plaques reflect incomplete bacterial lysis and may indicate suboptimal virus infectivity (van Charante et al., 2019; Yin, 2008).
Historically, researchers described morphological characteristics of plaques using tools like rulers and micrometers (Reddy et al., 1982). Today, the standard approach involves high-resolution plate imaging followed by digital analysis. Software like Fiji (Schindelin et al., 2012) enables manual plaque measurements but the results remain subjective, especially for small turbid plaques. Programs like Plaque Size Tool (Trofimova and Jaschke, 2021), Viral Plaque (Cacciabue et al., 2019) automate plaque counting, sizing, and titer calculations. However, automatic tools still exhibit lower precision with turbid plaques and require manual image preprocessing.
Figure 2D illustrates several common plaque types:
1. The absence of plaques signifies very low phage activity.
2. Clear, large plaques with sharp edges signify robust lytic activity.
3. Turbid plaques reflect compromised lytic efficiency.
4. Plaques with halos (bacterial growth inhibition zones) often imply exopolysaccharide depolymerase activity, which some phages use to expose cell-surface receptors (Knecht et al., 2020).
5. “Bull’s eye” plaques with clear center and turbid periphery suggest more efficient replication during early stages of lawn development.
Even closely related phages can produce plaques with striking morphological diversity, influenced by the biology of both viruses and bacteria, as well as the growth conditions. The limiting factor in the growth of plaques is the inability of most viruses to replicate productively in bacteria during the later stages of lawn development in nutrient-depleted environments (Pires et al., 2021; Łoś et al., 2007). At this point, bacteria typically enter the stationary growth phase, their most common state in natural habitats (Koskella et al., 2022). Plaque formation process can therefore be viewed as a race between bacteria and phages, where the virus must form a plaque before the cells lose their sensitivity (Abedon, 2021). However, some phages can exploit stationary-phase bacteria, hijacking cellular metabolism despite resource limitations (Woods, 1976; Silva et al., 2024). For example, T7 bacteriophage forms unusually large plaques mainly because it can productively replicate on host cells at late stages of lawn development (Xu et al., 2021; Yin, 1991).
The size variations of plaques produced by different phages or by the same virus under varying conditions depend on several interrelated factors (Figure 2E): (1) latent period duration, (2) burst size, (3) virion diffusion rate, and (4) adsorption efficiency (Abedon and Yin, 2009). While shorter latent periods allow more time for diffusion, they typically reduce burst size. Conversely, longer latency increases burst size but leaves less time for virion spread. Although a larger burst size contributes to increased plaque size, its impact is less significant than that of a shortened latent period (Abedon and Yin, 2009; Abedon and Culler, 2007). Diffusion dynamics also plays a critical role: jumbo phages (>200 kb genomes) move more slowly through agar, often forming only tiny plaques (Yuan and Gao, 2017). Lowering agar concentration enhances diffusion, making giant phage plaques more readily detectable (Saad et al., 2019; Kwon et al., 2020) and generally increasing plaque size for other viruses. Adsorption rates also affect plaque expansion by modulating viral diffusion. Moderate or low adsorption allows wider virion spread, while high adsorption confines infection to nearby cells (Abedon and Yin, 2009).
Several additional factors can affect the clarity, size and other morphological characteristics of plaques, even leading to their complete disappearance. These factors include: (1) composition of growth media (Ramesh et al., 2019; Anderson, 1948a), (2) supplements such as glycerol (Türe et al., 2022; Santos et al., 2009; Jamasbi and Paulissen, 1978) or bile acids (Jamasbi and Paulissen, 1978), (3) the presence of adsorption-promoting cofactors like bivalent metal salts (Cvirkaitė-Krupovič et al., 2010; Harada et al., 2013; Mikolajcik, 1964) or L-tryptophan (Anderson, 1948b), and (4) temperature (Anderson, 1948a). Additionally, oxygen availability significantly affects bacterial physiology and may influence viral infection (Hernández Villamizar et al., 2023). Anaerobic conditions can both enlarge plaques or induce edge turbidity, depending on the phage and bacteria type (Hernández Villamizar et al., 2023; McConnell and Wright, 1975).
Under certain conditions, zones of bacterial growth inhibition or partial lysis can be observed at low phage dilutions (high phage titers) with no plaque formation at higher dilutions. This phenotype may result from failure of individual viral infections and inability of single viral particles to form progeny, despite their ability to infect cells. At low phage dilutions, unproductive infections of bacterial cells by numerous viral particles may result in zones of bacterial growth suppression. This phenomenon is known as Lysis From Without, or Non-Productive Lysis – premature cell lysis caused by massive phage adsorption and cell death through fatal membrane damage and/or metabolism alterations without productive infection (Abedon, 2011).
Temperate viruses often fail to form plaques or produce only turbid ones under standard conditions because the majority of phages may enter a prophage state without lysis of the infected cells (Makky et al., 2021; Brady et al., 2021; Oppenheim et al., 2005). Stress conditions can force temperate phages to enter the lytic cycle, resulting in clear, well-defined plaques (Islam et al., 2012). Thus, prophage inducers like mitomycin, which triggers the SOS response via DNA damage, are employed to enhance the visibility of plaques (Islam et al., 2012). Some temperate phages naturally exhibit sufficient lytic-cycle entry and form plaques even without induction (Bertani, 1951). Notably, subinhibitory concentrations of antibiotics can sharpen plaques for both temperate and virulent phages by modulating bacterial physiology (Santos et al., 2009; Loś et al., 2008; Kaur et al., 2012). Table 2 provides a summary of tips for working with various types of phages in solid media.
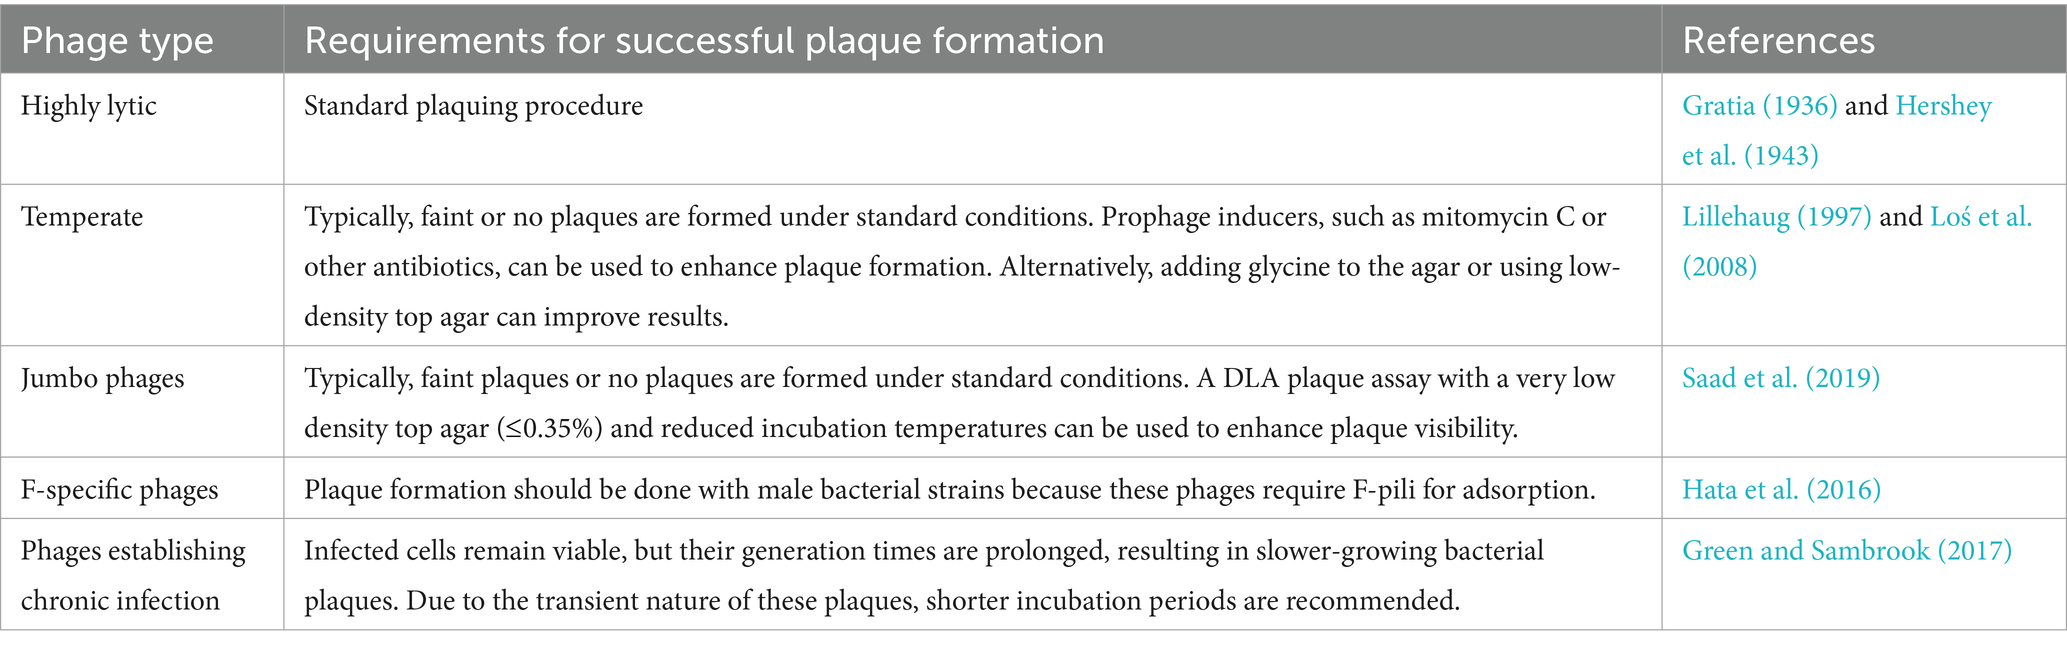
Table 2. Plaque assay recommendations for several common phage types.
Real-time monitoring of plaque formation can help to reveal dynamic changes in the plaque morphology. It can be achieved by manually photographing the plates (Koch, 1964) or using automated photographing systems (Perlemoine et al., 2021; Lee and Yin, 1996). Real-time monitoring is especially useful for phages with temporary plaques (e.g., filamentous phages) that become overgrown with bacterial lawn over time.
In summary, the plaque morphology is highly dynamic and depends on the biological properties of the virus, the physiological traits of the bacteria, and external factors, and can therefore serve only as a rough indicator when describing the biology and behavior of the virus.
Using plaques to estimate the efficiency of phage infection
Plaque assays enable qualitative and quantitative cross-condition comparisons of phage activity. Qualitative methods are used for preliminary characterization of the virus infectivity. Spot Test (see above) is often used for initial qualitative testing, with a few or just a single phage dilution (Khan Mirzaei and Nilsson, 2015). Streak Test is another qualitative method, in which bacteria are applied onto the surface of solid agar as narrow streaks and phages, taken at a fixed titer, are applied as small drops at equal intervals along the streak. Following incubation, bacterial streaks appear on the plate with plaques or lysis areas at the spots of phage application (Merabishvili et al., 2009). This allows to test different bacterial strains and phages on a single plate (Merabishvili et al., 2009; Cooper et al., 2011). However, qualitative tests provide only rough estimate of the phage infectivity (Yes or No) and cannot distinguish productive and unproductive infections (see above).
The golden standard for quantitative assessment of the viral replication efficiency and infectivity is the method of relative Efficiency Of Plating (EOP), first introduced in 1939 (Figure 2F) (Ellis and Delbrück, 1939). The relative EOP is a ratio of the number of plaques (Plaque Forming Units, PFU/ml) in the experimental sample under specific conditions to the number of plaques measured in reference conditions (e.g., using a reference phage-sensitive bacterial strain). When calculating the relative EOP, the spot test approach is often used for scalability, allowing for quick assessment of the host range and various conditions (Khan Mirzaei and Nilsson, 2015). In comparison, the absolute EOP corresponds to the number of infectious viruses determined in the plaque assay under given conditions relative to the absolute number of viral particles (Kinnunen, 1978). However, calculation of the absolute EOP is resource-intensive, requires using of sophisticated techniques like electron microscopy, and is rarely applied.
Importantly, changes in the PFU numbers in the relative EOP assay under specific experimental conditions may be due to either reduced viral replication efficiency (decreased burst size) or complete inhibition of virion production in infected cells in these conditions. In the first case, some plaques may still form but may not be visible due to their small size, while in the second case no plaques form at all. A method called the Efficiency of Center Of Infection (ECOI) was developed to distinguish between these scenarios (Figure 2G) (Sing and Klaenhammer, 1990). In the first step of the experiment, the cells of interest and control cells are infected with the bacteriophage, forming “infection centers.” The infected cells are then washed to remove free virus and a standard plaque assay is carried out with the cell lawn formed by phage-sensitive bacteria. This ensures that if even a small amount of virus is produced in the initially infected cell, a plaque will form on the lawn formed by virus-sensitive bacteria. On the other hand, the absence of plaques will indicate that the phage does not produce progeny in the initially infected bacteria.
In summary, methods relying on plaque formation are relatively simple and accessible, require minimal specialized equipment, and allow to explore different aspects of phage biology and perform quantitative analysis of phage titers and infectivity. These assays also make possible the isolation of individual phage clones from complex mixtures, a classic approach that can hardly be replaced even by modern techniques. However, these methods can be labor-intensive and time-consuming due to long lawn formation times, the need for plaque quantification and morphological analysis, and cannot be readily applied to all bacteria and bacteriophages since not all bacteria form lawns and not all phages form clear plaques. Notably, plaque counts only approximate viral particle numbers, as various factors may reduce or increase the viral replication and infectivity. Nevertheless, the plaque formation phenomenon remains one of the most important parts of phage research.
Methods to study bacteriophages in liquid culture
Bacteriophages are capable of infecting bacteria in liquid environments, resulting in either complete or partial lysis of the bacterial culture. In contrast to plate-based assays, bacteria and viruses are uniformly distributed in liquid cultures, allowing the entire volume to be treated as a single homogeneous system. Under these conditions, successful phage replication typically leads to complete bacterial lysis as all cells become infected. Visualizing infection and collecting samples in liquid cultures is generally easier than in solid media. Liquid culture assays are an effective alternative to solid-media methods for determination of the phage host range, replication efficiency, and lytic activity (Doss et al., 2022). This section covers the methods used to study phage infections in liquid media, summarized in Figure 3 and Table 3.
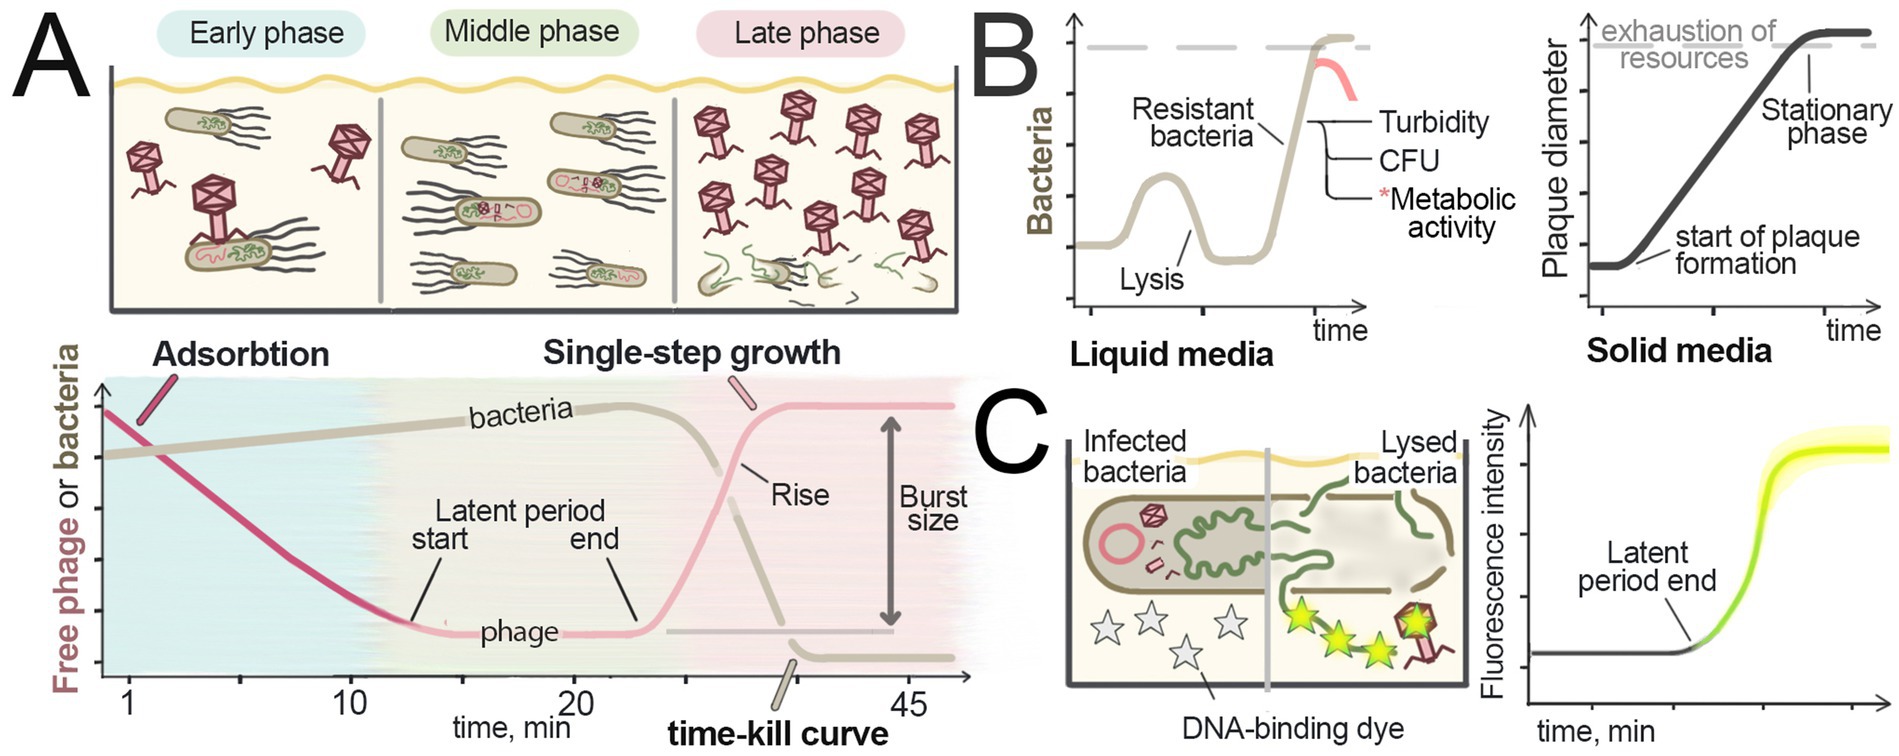
Figure 3. Studying phages in liquid culture. (A) Measurement of the adsorption rate, latent period, and burst size by assessing free virus in liquid culture. The amounts of free virus and bacteria in the culture at different steps of infection are schematically shown at the top. An example of the single-step growth curve is shown at the bottom. To determine the amount of free virus in the culture during different steps of infection, bacteria are removed from samples and the viral quantity is measured (e.g., using the plaque assay). To establish the rate constant of adsorption, the viral quantity is measured immediately after the virus is added, and the rate of viral titer decline over time is recorded. For assessing the latent period and burst size, samples are taken from the culture after the adsorption period in synchronously infected cultures. The increase of free virus amounts indicates the end of the latent period. The difference in the amount of free virus during the latent period and after its release from infected cells corresponds to the burst size. The end of the latent period and the appearance of new viral particles leads to bacterial lysis, which is manifested in a OD decrease. (B) Comparison of the virus activity in solid and liquid media. In solid media (left), plaque formation is a linear process that continues until nutrients are depleted [adapted from Abedon, 2021]. In liquid media (right), the progression of viral infection is nonlinear; after lysis, the remaining resistant bacteria can repopulate the culture. The pink line at the end of the graph represents the decline in the metabolic activity of bacteria in the stationary phase. (C) Detection of bacterial lysis using DNA-binding fluorescent dyes that cannot penetrate intact cell membranes (grey stars). DNA and viral particles are released from the cells during lysis, resulting in an increase in fluorescence, showed in yellow stars. The graph corresponds to fluorescence intensity measured over the time.
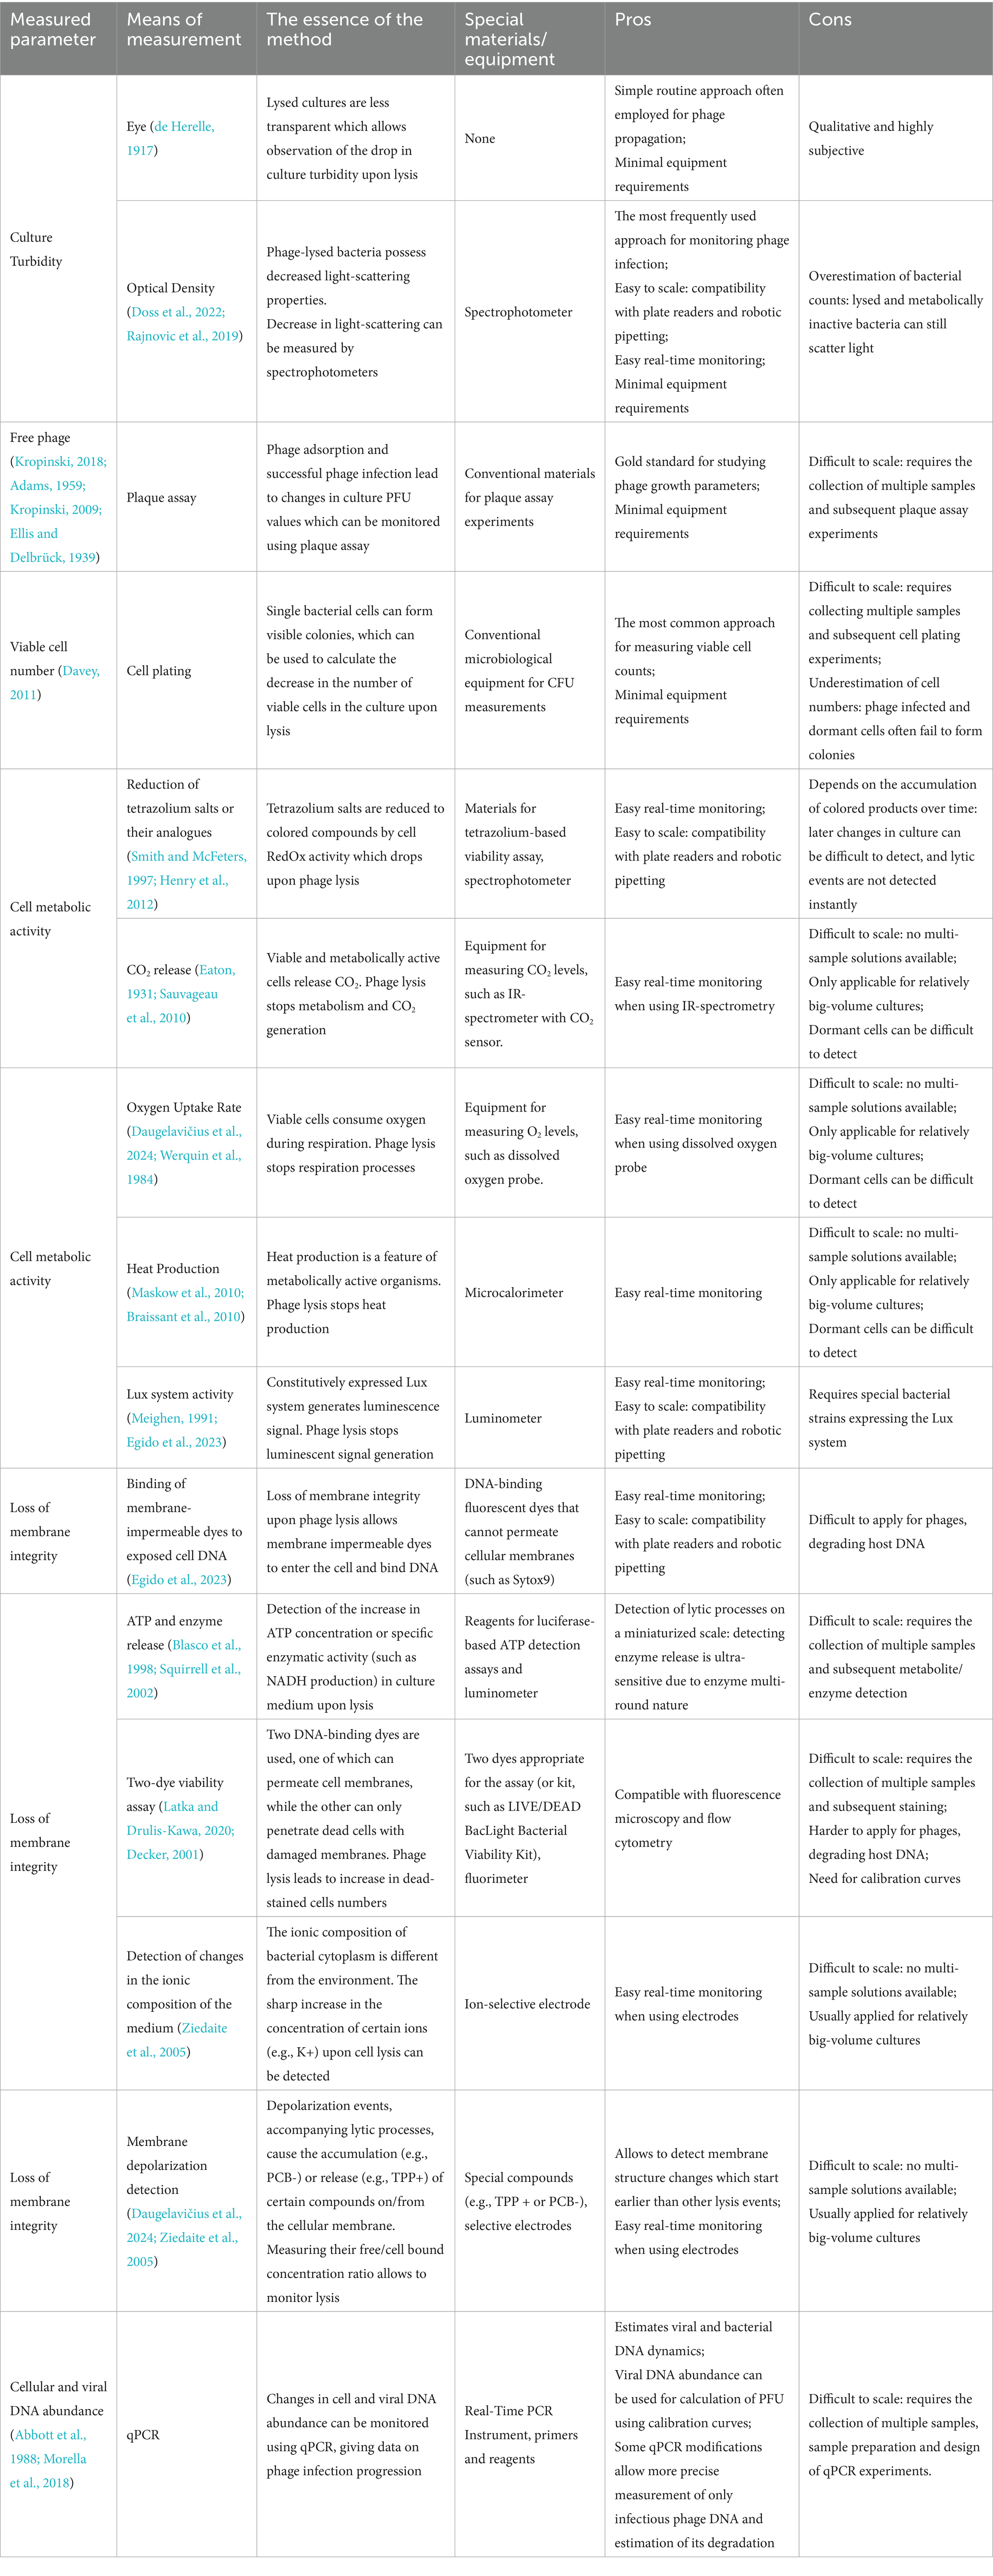
Table 3. Methods for measuring phage lytic activity in liquid culture.
Kinetic assays of phage infection
Changes in the cell density during infection are the most evident manifestation of phage activity in liquid culture, which can be detected by either end-point or kinetic measurements. Early researchers relied on visual assessment of culture densities for monitoring the progression of phage infection (de Herelle, 1917), a method still in use for qualitative analysis (Bonilla et al., 2016). Quantitative culture turbidity (or optical density, OD) measurements, usually performed by spectrophotometers, are now widely used to study viral infection and cell lysis in liquid media (Figure 3A). Plate readers can be employed for high-throughput sample processing, making possible parallel analysis of multiple samples. A recent study employed a 384-well plate high-throughput turbidimetric assay for determination of the host range of newly isolated bacteriophages. This approach enabled simultaneous testing of four phages against 22 bacterial strains with technical triplicates in a single assay (Martinez-Soto et al., 2021).
Kinetic assays of cell growth are generally preferred over endpoint OD measurements since they allow to record different stages of phage infection and build growth curves showing lysis kinetics and culture collapse (“time-kill curves”) (Figure 3A, bottom) (Doss et al., 2022). Since the outcome of phage infection in a liquid culture greatly depends on the ratio of phage particles to host bacteria, the multiplicity of infection (MOI) parameter is usually controlled and recorded to describe infection conditions. At low MOI, when initial virus titers are much lower than the number of cells in the population, multiple infection cycles can occur, with newly produced virions initiating secondary infections before the final culture lysis. At high viral loads, complete culture lysis and virus release occur rapidly and often before nutrient depletion allowing subsequent re-growth of resistant bacteria (Figure 3B, left graph; compare with cell growth in solid media, right graph). Recent work (Geng et al., 2024) showed that the lysis timepoint changes linearly with logarithm of phage concentration, enabling calibration curve-based titer determination under standardized conditions.
Notably, viruses and antibiotics produce similar growth curve patterns. The Minimal Inhibitory Concentration (MIC) concept, representing the lowest antibiotic concentration inhibiting bacterial growth, can be applied to bacteriophages by defining the minimal MOI required to inhibit bacterial proliferation (Kowalska-Krochmal and Dudek-Wicher, 2021; Phillips et al., 1998).
Comparative bacterial growth curve analysis enables assessment of the viral activity through: (1) visual evaluation of the lysis timing/degree, which is subjective and prone to biases, (2) by using computational growth curve metrics. In the second approach each curve is assigned a lysis efficiency score based on its lysis pattern, enabling quantitative comparison between curves. Multiple mathematical methods exist for computational curve analysis, differing in their method of calculation of lysis efficiency. These methods use such metrics as Lysis Score (Bourdin et al., 2014), Virulence Index (Storms et al., 2020), Phage Score (Konopacki et al., 2020), and Centroid of the Bacterial Growth Curves (Hosseini et al., 2024).
Phage adsorption rate, latent period, and burst size
Typical phage infection features three phases: (1) Early phase – viral adsorption and initiation of infection, (2) Middle phase – bacterial growth with intracellular phage replication, and (3) Late phase – culture collapse through lysis (Figure 3A, upper scheme). These phases are accompanied by changes in the free phage concentration in the medium: (1) Early phase – free phage concentration decreases due to adsorption; (2) Middle phase—stable free phage concentration; (3) Late phase—phage progeny release and increase in free phage concentration. Tracking free virus concentration can thus be used to reveal transitions between these stages, and calculate the adsorption rate, latent period duration, and the burst size (the number of virions produced per infected bacterium) (Figure 3A, lower graph).
Outside the cell, the virus exists in an inactive state termed ‘extracellular search” (Hyman and Abedon, 2009), during which it diffuses randomly until encountering a susceptible bacterium. The ability of a virus to attach to the target cell is a crucial factor determining its host range (Adams, 1959), which can be expanded or restricted by altering the virus specificity to cell surface epitopes (Zhang et al., 2022).
The adsorption rate constant can be determined by monitoring virion concentration decline in the medium during early phases of infection. In this approach (Adams, 1959), bacteria and phage are mixed, and free virions are quantified at short intervals via plaque assay. To halt viral replication in sampled bacteria, the cells may be removed by chloroform treatment or centrifugation (Sechaud and Kellenberger, 1956). Adsorption kinetics is derived by plotting normalized viral titers against time (Figure 3A, lower graph). Viral adsorption can be described as a bimolecular reaction between viral and bacterial components, characterized by standard isothermal adsorption equations (Krueger, 1931). Viral adsorption is accelerated at high concentrations of both the phages and bacteria (Ellis and Delbrück, 1939; Krueger, 1931; Schlesinger, 1932). Elevated phage concentrations also increase the probability of superinfection of a single bacterium with multiple phages (Krueger, 1931; Burnet et al., 1938), which in some systems triggers “lysis from without” (Abedon, 2011). Importantly, bacterial cell size also influences phage adsorption, with the adsorption rate increasing as the cell surface becomes bigger (Schlesinger, 1932; Abedon, 2023).
The latent period and burst size can be determined in a Single-Step Growth assay, first described in 1939 (Ellis and Delbrück, 1939). A known amount of phage is added to a log-phase bacterial culture, at MOI < 1 to avoid superinfection, followed by viral titer measurements at regularly spaced intervals. Plotting the resulting titers versus time reveals a steep increase corresponding to synchronous release of virions from lysed cells. This single-step growth curve (Figure 3A, lower graph) captures one infection cycle. The time between the end of viral adsorption and the onset of viral release from cells corresponds to the population average latent period (Abedon et al., 2003).
The burst size can be calculated from free virus titration at the following points: (1) initial virus added; (2) virus remaining after adsorption; (3) virus immediately preceding lysis; (4) virus after lysis completion. The burst size is determined as the ratio of the progeny viral particles [PFU after lysis (4) minus PFU before lysis (3)] to the adsorbed viral particles [PFU added (1) minus PFU after adsorption (2)].
To obtain accurate calculation of these parameters, synchronized infection is required to ensure nearly simultaneous initiation of infection and virion release across the bacterial population (Adams, 1959; Eisenstark, 1967). Highlighting the importance of synchronized conditions, Eisenstark (1967) compared single-step growth experiment to a horse race, where phages must be aligned at the starting line in order to get reliable measurements. Uniform initiation of infection can be achieved by viral adsorption in nutrient-depleted medium with subsequent transfer to nutrient-rich medium that initiates synchronized viral replication (Eisenstark, 1967). However, when using high-density bacterial culture, >90% viral adsorption occurs within minutes, making timing variations negligible in many cases (Krueger, 1931).
Non-synchronized and secondary infections can also be prevented by: (1) culture dilution (50-100-fold) to reduce phage-bacterium encounter probability, (2) removal of free phages after adsorption step by centrifugation, and (3) replacement of the growth medium to deplete cofactors required for phage adsorption (Adams, 1959; Kropinski, 2009; Ellis and Delbrück, 1939).
Some microbiological techniques allow to measure phage burst size and its variation among individual cells, by diluting and placing infected cells into separate test tubes until there is only one or fewer bacteria per tube (Delbrück, 1945). This approach allows to calculate the variation in the number of viruses per cell by measuring phage titer in each tube after lysis (Delbrück, 1945), and can be used to find differences among cell subpopulations (Kannoly et al., 2022).
Detection of live bacteria and metabolic activity
The number of live bacterial cells during infection changes dramatically and can be directly determined by measuring the number of colony-forming units (CFU) in the culture. In comparison with the turbidity (OD) measurements, which also detect non-dividing and dead cells and cell debris, CFU counting allows accurate detection of only viable cells that can divide and form single colonies on solid media (Pla et al., 2015; Davey, 2011). CFU counting can be used either in an endpoint format to assess the effectiveness of viral elimination of bacteria (Roger, 1977; Latka and Drulis-Kawa, 2020) or in a kinetic format to construct cell lysis curves (Eaton, 1931; Melo et al., 2018). CFU measurements can be used for bacterial cell counting not only in liquid cultures but also in biofilms, for example to evaluate the efficiency of bacterial elimination phage depolymerases and antibiotics (Latka and Drulis-Kawa, 2020). It should be noted that direct CFU measurements in the infected culture may result in underestimation of the true bacteria count at the time of sampling due to the ongoing phage activity and progressive infection after plating (Verthé and Verstraete, 2006). To overcome this complication, the OD values of the infected bacterial culture, measured in real-time, can be converted to CFU using calibration curves (Hernández Villamizar et al., 2023; Sezonov et al., 2007).
CFU measurement is a cheap and straightforward method that requires only basic microbiological equipment and reagents, but the procedure is time-consuming, involving sampling, plating, and waiting period for colonies to form. It also does not allow to identify bacteria that are in a dormant state and retain metabolic activity but are unable to form colonies (Davey, 2011).
As an alternative, direct measurements of the bacterial metabolic activity can be used to detect the phage lytic activity. It is important to note that the level of metabolic activity does not always correlate with bacterial biomass. For example, in the stationary phase, high bacterial numbers correlate with high OD and CFU, but their metabolic activity may be low (Braissant et al., 2020). However, phage-induced cell lysis usually results in a sharp decrease in the metabolic activity (Figure 3B, left graph). The metabolic activity can be estimated by measuring the concentrations of ATP and cellular metabolites, redox activity, or monitoring other physiological changes in infected cells in real time (Ralston and Baer, 1963). For detailed protocols and interpretation, see reviews by Braissant et al. (2020) and Davey (2011).
Intracellular ATP concentration varies depending on environmental conditions (Deng et al., 2021) and reflects bacterial viability (Schneider and Gourse, 2004). The ATP level is generally proportional to the number of live bacteria and can thus be used to detect the phage lytic activity (Daugelavičius et al., 2024; Santos et al., 2024; Ziedaite et al., 2005). To quantify intracellular ATP, the cells are lysed and released ATP is measured by firefly luciferase (Thorne et al., 2010) or horseradish peroxidase (Veitch, 2004). Importantly, extracellular ATP released during phage-induced cell lysis must be removed for accurate biomass estimates.
The RedOx activity also reflects cell viability and can be assessed using tetrazolium salts. In the oxidized form, these salts are colorless but can be reduced to colored formazan derivatives by the enzymes of bacterial respiratory chain (Smith and McFeters, 1997). Phage-induced cell lysis can thus be detected as a drop in this activity. In addition to the ability to detect the elimination of bacteria by viruses in individual experiments (Dalmasso et al., 2015; Sanchez et al., 2022; Lin et al., 1977), high-throughput Phage Susceptibility Testing (PSA) using the same principle has been developed for robotic platforms like OmniLog™ for analysis of phage replication, phage host range, and (Henry et al., 2012; Cunningham et al., 2022). In one of the studies, the OmniLog™ platform allowed testing of 19 E. coli phages against 18 bacterial isolates, and 21 Staphylococcus aureus phages against 11 bacterial isolates (Cunningham et al., 2022). A similar principle is applied in resazurin-based viability assays, which were successfully employed to detect the lytic activity of bacteriophages and increased cell survival conferred by defense systems (Meeske et al., 2019).
During respiration, bacteria release carbon dioxide, which can serve as an indicator of their metabolism during phage infection. Early phage studies relied on KOH for absorption of CO2 from cell cultures (Eaton, 1931; Warburg, 1926). Modern infrared spectroscopy enables real-time CO2 monitoring in infected cultures (Sauvageau et al., 2010). For example, this method was applied to study T4 phage infection, allowing not only the observation of phage-induced lysis but also the detection of specific events during the infection process (growth rate, rate or respiration and its derivatives) (Sauvageau et al., 2010). On the other hand, an increase in bacterial oxygen uptake rate (OUR) can indicate both an increase in bacterial mass and ongoing lysis. OUR can be measured in real time using soluble oxygen probes (Daugelavičius et al., 2024; Werquin et al., 1984; Maskow et al., 2010). For example, measurements of dissolved oxygen were used to assess the efficiency of phage production in fermenter cultures of Rhizobium meliloti (Werquin et al., 1984). Heat production can also be measured as a proxy of bacterial metabolism, using isothermal microcalorimetry that allows highly sensitive detection of heat changes during culture growth and phage-induced lysis (Maskow et al., 2010; Tkhilaishvili et al., 2018; Guosheng et al., 2003; Braissant et al., 2010). For instance, calorimetry allows real-time monitoring of lambda prophage induction (Maskow et al., 2010) as well as noninvasive assessment of bacterial eradication efficiency in biofilms (Kunisch et al., 2024).
Bacterial luciferase (the luxCDABE system from the bioluminescent bacterium Photorhabdus luminescens) can be used as a reporter system for detecting the phage lytic activity, which can be adapted to high-throughput plate readers. Metabolically active cells that constitutively express the luciferase operon produce a luminescent signal detectable by luminometry, while phage-induced cell lysis is manifested as a drop in luminescence (Meighen, 1991; Damron et al., 2013; Egido et al., 2023). In a recent study, the drop in luminescence was used to detect cell lysis for four different Pseudomonas phages (Egido et al., 2023).
Detection of cell damage
An alternative approach to monitor cell lysis involves detecting damaged rather than intact metabolically active cells. These methods are primarily based on the disruption of bacterial membrane integrity during phage infection and the subsequent release of DNA, proteins, ATP, and ions into the medium.
The first method utilizes fluorescent dyes that stain nucleic acids but cannot penetrate intact membranes. Upon membrane damage, nucleic acids become accessible for dyes, resulting in fluorescence increase (Figure 3C). Initially developed to study enzyme- or antibiotic-induced cell degradation, this principle was recently adapted for phage infection tracking (Egido et al., 2023).
Two-Color viability assays use two fluorescent dyes that bind DNA but have different membrane permeability properties. One dye can penetrate cell membranes and stains all cells (e.g., Syto9, green fluorescence), while another dye cannot penetrate membranes and stains only cells with compromised membranes (e.g., propidium iodide, red fluorescence) (Emerson et al., 2017; Jassim and Griffiths, 2007). This allows to assess the relative numbers of dead and live bacteria in the sample (Decker, 2001; Tawakoli et al., 2013). These assays can be performed in bulk cell culture using fluorimetry (Latka and Drulis-Kawa, 2020; Jassim and Griffiths, 2007) and at the single-cell level using fluorescent microscopy or flow cytometry. For example, in a recent study a Live/Dead bacterial viability kit was used to explore the antibiofilm activity of Klebsiella phage KP34. The study determined the live-to-dead cell ratio of multidrug-resistant K. pneumoniae biofilms with and without phage treatment (Latka and Drulis-Kawa, 2020).
Tracking of the concentrations of small molecules and ions, released in the medium during cell lysis, provides another way to monitor lytic processes in cell culture. The increase in the extracellular ATP level (measured in enzymatic reactions) or the concentration of potassium ions (detected in real time using a K+-selective electrode) was successfully used to detect ongoing culture lysis (Daugelavičius et al., 2024; Ziedaite et al., 2005; Blasco et al., 1998; Liu et al., 2016; Dibrova et al., 2015). In a recent study on chemical antiphage defense, researchers ruled out the hypothesis that bacterial metabolites interfere with phage adsorption and DNA injection by demonstrating equivalent K+ release levels with and without this defense system (Kronheim et al., 2018). A recent study employed ATP quantification to assess the phage activity, by measuring the efficiency of phage-induced lysis in complex cultures alongside OD and H2S measurements (Santos et al., 2024).
Membrane potential changes is another indicator of cell lysis that can be tracked with lipophilic probes. Tetraphenylphosphonium (TPP+) is a small lipophilic cation that accumulates in membranes proportionally to the negative membrane potential maintained by live bacterial cells (Ziedaite et al., 2005). Membrane depolarization due to phage-induced lysis increases the extracellular concentration of TPP+, which can be monitored by selective electrodes. On the contrary, Phenyldicarbaundecaborane (PCB−) is an anion probe that binds to the membranes of metabolically inactive or damaged cells, serving as an early indicator of changes in the membrane permeability due to cell lysis (Daugelavičius et al., 2024).
The activity of enzymes released into the extracellular environment can also be used to detect cell lysis. It has been shown that detection of the adenylate kinase release is 10–100 times more sensitive than ATP detection, due to the enzymatic nature of the reaction (Blasco et al., 1998; Squirrell et al., 2002). Commercial kits for detecting the adenylate kinase activity have been adapted for high-throughput screening applications (Jacobs et al., 2013). For example, testing of the activity of leaked adenylate kinase was adapted for sensitive and precise identification of bacteria using a method that involves selective lysis of bacterial cells using phages (Blasco et al., 1998). Detection of other enzymes released from cells, such as lactate dehydrogenase or glucose-6-phosphate dehydrogenase, can also be used to detect cell damage, by measuring NADH production (Batchelor and Zhou, 2004; Kumar et al., 2018). Finally, release of reporter fluorescent proteins from infected cells also provides a proportional, sensitive lysis measure adaptable for high-throughput assays (Sharma et al., 2019).
Measuring DNA amount and integrity
Analysis of phage and bacterial nucleic acids, involving DNA amplification and detection with sequence-specific probes, provides a powerful approach to study the dynamics of viral infection. Quantitative PCR (qPCR) employs fluorescent dyes that enhance emission upon binding to double-stranded DNA, enabling precise quantification of viral DNA titers (Abbott et al., 1988). The qPCR data can be directly used to calculate phage titers (PFU) using calibration curves (Luo et al., 2022; Projahn et al., 2020; Duyvejonck et al., 2019; Peng et al., 2018). Several qPCR variants are commonly used in phage research, as detailed below.
During infection, viral DNA replication can be tracked by qPCR sampling at multiple time points (Luo et al., 2022; Projahn et al., 2020; Šuster and Cör, 2023; Lisitskaya et al., 2023). However, standard qPCR cannot distinguish between DNA from infectious particles, damaged virions, or lysed infected cells (Duyvejonck et al., 2019; Girones et al., 2010). To address this, modified qPCR approaches that target only viable phages were developed.
To selectively detect live bacteria/infectious particles, sample pre-treatment can be used to eliminate non-viable DNA templates. Propidium monoazide (PMA) (Nocker et al., 2006) and its more efficient derivatives like ethidium monoazide (Chang et al., 2010) form covalent crosslinks with DNA upon light exposure and block polymerase reaction. PMA penetrates only damaged membranes or capsids and selectively neutralizes free nucleic acids and DNA from dead cells and damaged virions, while preserving signals from intact particles (Liu et al., 2014). This approach provides more accurate quantification of live bacteria and infectious viruses compared to conventional qPCR (Liu et al., 2014; Fittipaldi et al., 2010; Kim and Ko, 2012). By comparing PMA-treated samples with untreated controls, the method can also estimate the proportion of live versus dead cells or viruses in the population (Rudi et al., 2005). Alternative methods involve the use of DNA/RNA-degrading enzymes to eliminate extracellular nucleic acids prior to qPCR (Nuanualsuwan and Cliver, 2002; Otawa et al., 2008; Refardt, 2012). However, these methods can still overestimate the numbers of phages/bacteria by not accounting for objects with intact membranes/capsids but with damaged DNA.
The second approach is used to eliminate signals from damaged templates during qPCR. Long-amplicon qPCR (LA-qPCR) uses target DNA amplicons exceeding 400 base pairs, which reduces the detection of damaged DNA (Pecson et al., 2011; Ho et al., 2016). A combined approach utilizing both PMA and LA-qPCR (PMA-LA-qPCR) involves pre-treatement of the sample with PMA before amplification of long amplicons (Mclellan et al., 2016). This dual-filter methodology provides superior sensitivity for detecting viable pathogens, as it requires both membrane integrity (PMA exclusion) and DNA integrity (long amplicon amplification) (Mclellan et al., 2016; Banihashemi et al., 2012).
Droplet Digital Polymerase Chain Reaction (ddPCR) is a modification of qPCR that partitions the sample into thousands of nanoliter-sized droplets for amplification (Hindson et al., 2011). ddPCR provides superior sensitivity and accuracy compared to traditional qPCR, allowing for the calculation of the absolute number of template copies without the need for standard curves (Hindson et al., 2011; Hindson et al., 2013). This method has been used for monitoring the dynamics of virus and bacteria within infected population and analyzing the competition between two different viruses (Morella et al., 2018). The problem of background DNA signal from damaged cells and viruses can be addressed using the same methods as in the case of qPCR (Morella et al., 2018).
Southern blotting remains a valuable classic technique for detecting phage and host DNA during infection. This well-established method assesses phage DNA quantity and integrity using labeled DNA probes (Southern, 1975). Radioactive probes offer the highest sensitivity but fluorescent and chromogenic alternatives are also available. The method can be used to track phage replication dynamics and characterize host immune responses at the DNA level, in particular, by revealing which infection stages are inhibited and detecting large-scale DNA degradation (Rostøl et al., 2024; He et al., 2024; Patel et al., 2024).
To summarize, liquid culture approaches enable real-time monitoring of phage infection at the population level, often with superior throughput, scalability, and experimental flexibility in comparison with solid culture techniques. They remain indispensable for understanding population dynamics, phage growth parameters, and the evolution of phage-host interactions.
Methods to study bacteriophages at single-cell level
The main limitation of the population-based methods discussed so far is that the data obtained represent an average across many cells, while bacterial population can be highly heterogeneous (Eisenstark, 1967; Lidstrom and Konopka, 2010; Kümmerli and Frank, 2023). The 21st century brought us to a new era of single-cell analyses, including high-resolution microscopy, flow cytometry, microfluidics and high-throughput sequencing techniques, and allowed researchers to investigate cell-phage interactions both under laboratory conditions and in natural populations (Martínez Martínez et al., 2020; Putzeys et al., 2024). These methods made possible visualization of all infection steps, showing how individual viruses adsorb host bacteria, enter the cells, shift between life cycle stages, and eventually exit the host. Moreover, they enabled the study of interactions between uncultivated bacteria and their phages in bacterial communities in natural habitats, greatly expanding our understanding of microbial ecology beyond laboratory model systems. This section explores techniques that can yield detailed mechanistic insights into the infection process at the single-cell/single-phage level, summarized in Figure 4.
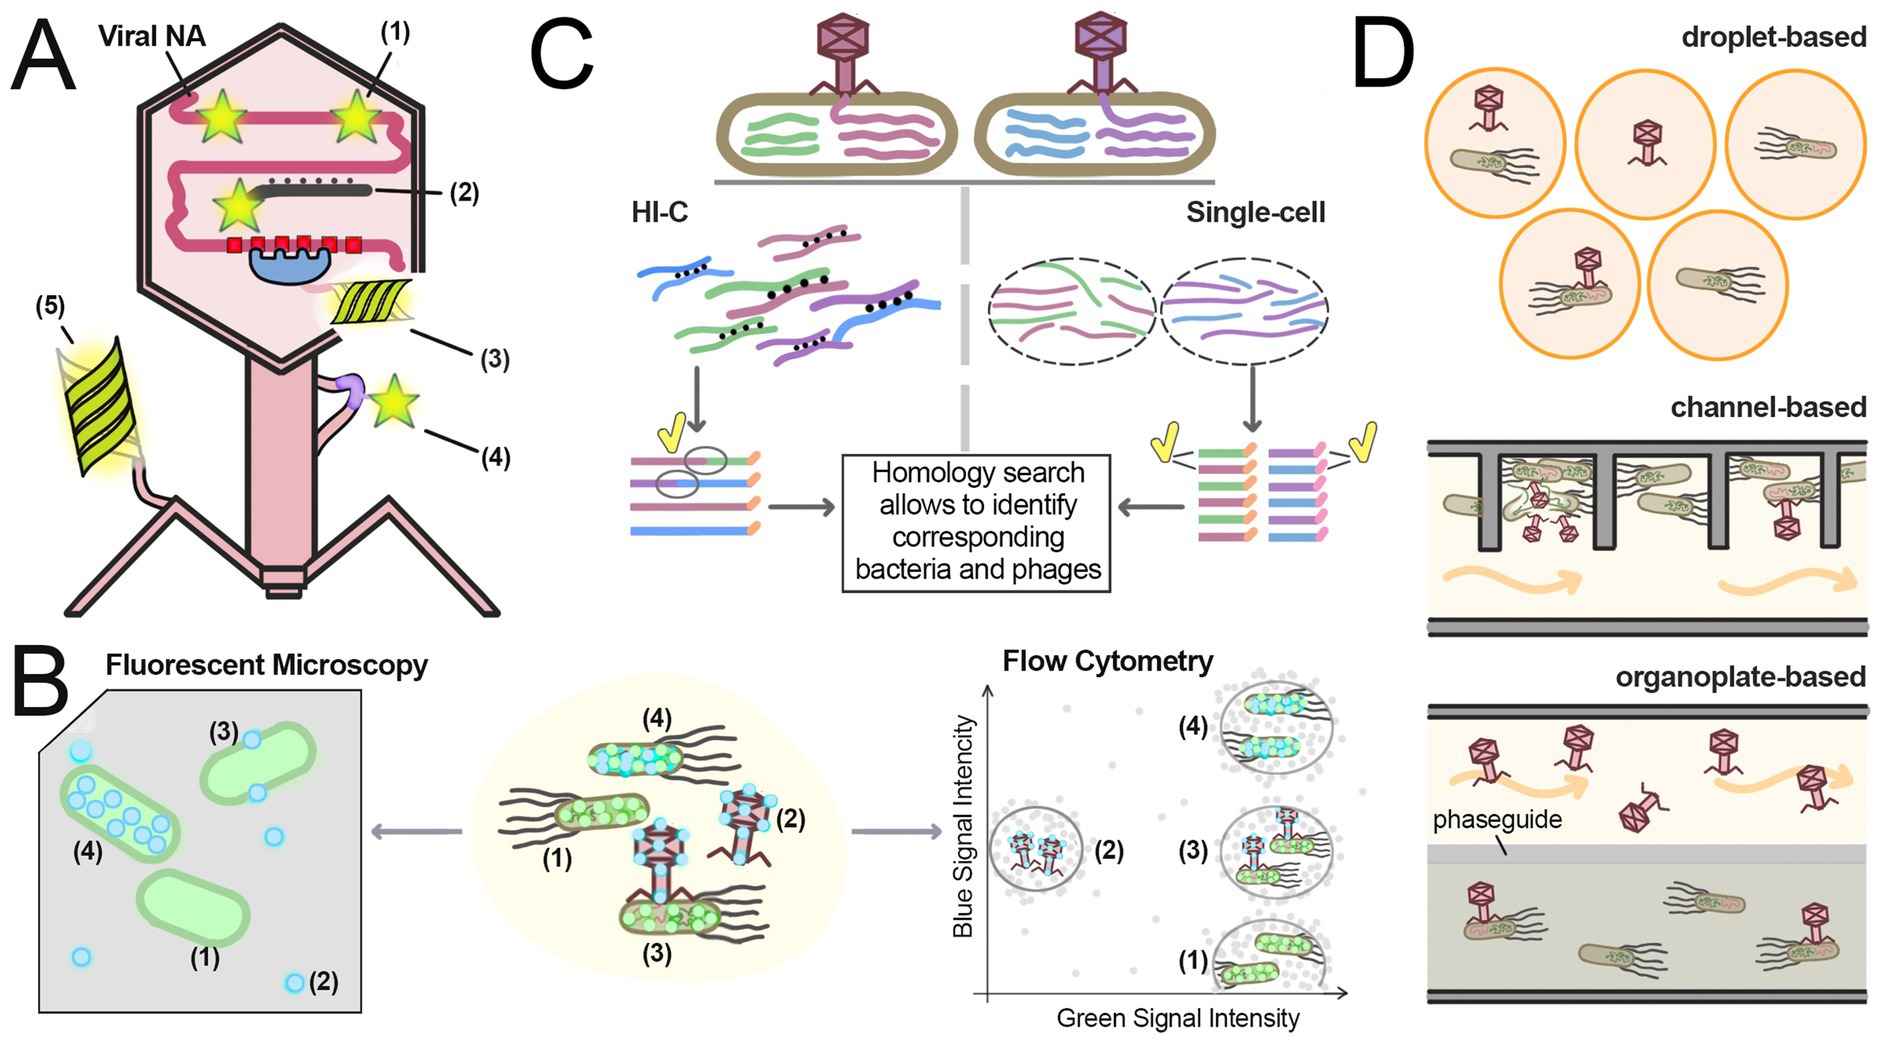
Figure 4. Single-cell techniques for studying phage infection. (A) Methods for labeling virions and phage molecules: (1) DNA-binding intercalating dyes; (2) Labeled nucleic acid probes targeting the phage genome; (3) Fluorescent proteins fused with DNA-binding proteins targeting specific sequences in phage DNA; (4) AHA-tags conjugated with fluorescent dyes; (5) Fluorescent proteins fused with phage capsid proteins. (B) Fluorescent microscopy and flow cytometry techniques. The sample shown in the center consists of labeled bacteria expressing fluorescent proteins (green) and capsid-labeled phage particles (light blue). Four cell sub-populations can be observed: (1) Free bacteria not infected with phages; (2) Free phage particles; (3) Bacteria in the early stages of infection, with phage capsids attached to their cell walls; (4) Bacteria in the late infection stages, actively producing fluorescent capsid proteins. Fluorescent microscopy (left) provides direct observation of sample entities, offering more detailed but slower analysis compared to flow cytometry. Flow cytometry (right) quickly measures parameters of individual cells in the sample, presenting the data as charts showing the intensity of different signals for each entity in the sample. The graph contains four regions corresponding to each sub-population. Notably, most fluorescent microscopes and flow cytometers cannot effectively analyze free phage particles due to the low intensity of their signals. (C) Hi-C and single-cell sequencing approaches for identifying phage-host linkages. These protocols analyze samples containing mixtures of phage-infected bacteria. Two different bacteria infected with two different viruses, distinguished by the coloring of their DNA, are shown on the top. In the Hi-C protocol (left), the samples are treated with crosslinking agents before phage extraction. Crosslinks (black dots) connect nucleic acid molecules, allowing linkage of different DNA fragments within the same cell, including host and phage DNA. All DNA fragments from the same cell share the same barcode (orange extensions in reads). Sequencing of these linked fragments reveals host-phage associations, as fraction of reads contains both phage and bacterial DNA (ovals with a yellow tick). In single-cell sequencing protocol (right), individual bacteria are separated, and DNA fragment from each one is uniquely labeled with different barcodes (orange and pink extensions in reads). Homology searches then assign phage and bacteria to taxonomic groups. Phage-host linkages are established by detecting either phage and bacterial sequences in the same read (Hi-C) or shared barcodes (single-cell sequencing). (D) Different microfluidics designs. In droplet-based microfluidics bacteria and phages are sequestered in small droplets. In channel-based microfluidics liquid media constantly flows (orange arrows) through channels, replenishing nutrients; bacteria and phages reside in chambers connected to the main stream. In organoplate-based microfluidics bacteria reside in semi-solid media while phages diffuse from liquid media through the phaseguide.
Light and electron microscopy in phage research
The first device for observing microscopic objects, the microscope (from Greek micros, small, and skopeo, to look at), was invented in 1590 by Hans and Zacharias Janssen and consisted of several lenses placed in a tube (Knight, 2015). However, the true exploration of the microscopic world began with the efforts of Robert Hooke and Antonie van Leeuwenhoek, whose observations of microscopic objects were widely published, leading to the widespread adoption of microscopy (Hooke, 1665; van Leeuwenhoek, 1798). Since the first half of the 20th century, microscopy has been widely used to study viral infections. The challenge is that many bacteria are transparent and refract light in a manner similar to their surrounding medium, which complicates their visualization. Contrast-enhancing techniques allow researchers to observe living cells in real time, whereas dyes often require cell fixation (Barer, 1974).
Phase-contrast microscopy, one of the most widely used contrast enhancement techniques in phage research, was invented by Zernike (1935). This method converts small differences in the phase of light waves into changes in intensity, allowing the visualization of unstained, transparent samples, including bacterial cells, in real time without staining (Rohde, 2011). It made possible to visualize phage-induced lysis of individual bacterial cells in real-time for the first time (Rice et al., 1954) and continues to be actively used in phage research (Wu et al., 2021; Dennehy and Wang, 2011). Modern equipment allows the combination of phase-contrast microscopy with fluorescence microscopy. However, it is still a less informative method compared to other microscopic techniques.
Electron microscopy is another powerful tool for studying unlabeled objects. The key advantage of this method is its far greater resolution and magnification than light microscopy. In 1933, Ernst Ruska developed the first prototype of an electron microscope (Lambert and Mulvey, 1996). The first electron microscopy images of bacteriophages were obtained by 1940 (Ackermann, 2011). Ruska’s images depicted a bacterium surrounded by bacteriophages, while Pfankuch and Kausche captured images of individual virions. Further advances in electron microscopy made it possible to visualize all stages of the infection cycle from viral entry to progeny release. High-quality electron micrographs can reveal viral adsorption, injection of viral DNA accompanied by virion emptying and its conformational changes, virions assembly, and cell lysis (Simon and Anderson, 1967; Böhm et al., 2001; Marling, 1949). However, the main disadvantages of electron microscopy include the need for expensive equipment and the invasive nature of sample preparation. For a comprehensive review of the use of electron microscopy in phage research, see Ackermann (2012).
Phage and bacteria labeling and fluorescence microscopy
Labeling of viral and bacterial components can be used to explore physical interactions between cells and viruses, identify specific cell types, visualize phage replication, cell division and other physiological changes. These methods usually rely on fluorescent proteins, membrane dyes or tags/probes to nucleic acids for visualization of specific cellular and viral structures (Figure 4A). Fluorescence microscopy has become a vital technique in bacterial cell biology, allowing highly specific and sensitive visualization of labeled bacterial and viral components, analysis of their spatial distribution and dynamics (Figure 4B) (Yao and Carballido-López, 2014). Furthermore, super-resolution techniques have provided unprecedented details of phage-bacteria interactions and are one of the most prominent direction in modern virus studies (Kiss et al., 2020; Robb, 2022).
Intercalating dyes that alter their fluorescence upon binding to nucleic acids are one of the simplest methods of labeling. Some dyes can integrate into viral nucleic acids without disrupting the virion integrity or infectivity (Eriksson et al., 2007; Mosier-Boss et al., 2003; Brussaard, 2009). Early studies demonstrated that intercalating dyes can be used for detection of viral particles without electron microscopy (Hennes and Suttle, 1995; Hennes et al., 1995). For instance, Oxazole Yellow staining revealed far higher phage concentration in environmental water samples than previously estimated and enabled visualization of bacteria with adsorbed phage (Hennes and Suttle, 1995). The discovery of more sensitive dyes, like SYBR Gold (Tuma et al., 1999), which can stain RNA, ssDNA, and dsDNA phages, further advanced this approach. For example, SYBR Gold-labeled phage P22 was used for identification of its host S. typhimurium in mixed cultures (Mosier-Boss et al., 2003). Dye-labeled viruses were also used as probes for quantification of bacterial hosts in water samples (Hennes et al., 1995) and for flow-cytometry sorting of phage-tagged bacteria (Deng et al., 2012). In a landmark 2012 study, researchers used direct staining of phage DNA with a cyanine dye to track DNA ejection from phage virion and its entry inside bacterial cells by fluorescent microscopy (Van Valen et al., 2012).
As discussed above, staining of cellular DNA with intercalating dyes can also be used for distinguishing live and dead cells during infection, since the permeability of the membrane to different dyes varies (Yoon et al., 2021). Combining fluorescence microscopy with two-color cell viability staining allows real-time analysis of phage infection. Phage-induced lysis results in an increase in dead-cell fluorescence, which can be detected by bulk fluorescence measurements or by microscopy (Liu et al., 2016; O’Flaherty et al., 2005; O’Flynn et al., 2007). This assay can also be adapted for staining entire colonies in solid cultures, revealing dead-cells and irregular morphology in virus-infected colonies (O’Flynn et al., 2007).
A key limitation of the majority of dye-based methods is the lack of selectivity since these dyes stain all nucleic acids in the sample nonspecifically. Hybridization in situ allows for the spatial localization of specific nucleic acid sequences within a sample using complementary labeled nucleic acid probes (Langer-Safer et al., 1982). In FISH (Fluorescence In Situ Hybridization), the fluorescent molecule can either be directly fused to the probe, or the probe can be conjugated with biotin for avidin-based detection (Langer-Safer et al., 1982). Unlike nonspecific dyes, FISH labels nucleic acids selectively, but requires sample fixation, permeabilization, and hybridization, complicating kinetic analysis (Huber et al., 2018). Nevertheless, FISH was used to track MS2 phage infection in samples prepared at different times of infection (Harb et al., 2020). Despite their high specificity, FISH-based methods for phage research have limitations including complex sample preparation with potential artifacts, low quantitative accuracy, and challenges in detecting low-abundance targets.
Variations of FISH methods allow linking phages to their hosts by detecting co-localization of phage and bacterial DNA. GeneFISH combines probes that target rRNA and genes of interest to analyze the distribution of specific genes within natural microbial populations without cultivation (Moraru et al., 2010). PhageFISH is an adaptation of this method for phage research that relies on simultaneous labeling of bacterial 16S rRNA and phage DNA and can be used for: (1) detection of intracellular and extracellular viral DNA, (2) quantification of the ratio of infected to noninfected cells, (3) semi-quantitative predictions of the phage number per cell, and (4) establishment of phage-host linkages in mixed cultures (Allers et al., 2013). The development of single-cell transcriptomic methods has led to the development Single Molecule FISH (smFISH), which was applied to study viral infection in phytoplankton Emiliania huxleyi using dozens short fluorescent probes specific to mRNA of single algae or viral genes (Vincent et al., 2021).
Viral and cellular DNA can also be visualized using fluorescent proteins fused to sequence-specific DNA binding domains, expressed in the host bacteria and recognizing engineered binding sites in the phage or host genome (e.g., ParB-mCherry targeting parS sites or other; Figure 4A). This allows labeling of viral DNA and visualization of phage entry and replication during infection (Bulssico et al., 2023; Trinh et al., 2020; Tal et al., 2014; Zhang et al., 2021). Selective labeling of DNA with fluorescent proteins can be used to detect active viral DNA replication within infected cells (Dang et al., 2015), as well as to measure the number of bacteriophage copies per cell (Harb et al., 2020).
Bacteriophages can also be visualized using fluorescent tags fused to various viral components. The most common approach involves using of host bacterial strains with plasmids encoding a viral capsid protein fused to a fluorescent protein (Bulssico et al., 2023; Trinh et al., 2020; Zhang et al., 2021). Induction of the chimeric protein expression during viral replication leads to incorporation of fluorescent proteins into the viral capsid alongside the normal capsid proteins. Using of labeled bacteriophage virions allows direct identification of infected cells, analysis of viral adsorption, and measurement of MOI for individual cells. The assembly and release of virions during infection can also be directly observed in cells expressing fluorescently tagged viral capsid proteins (Bulssico et al., 2023; Trinh et al., 2020; Zhang et al., 2021; Zeng et al., 2010). However, modification of capsid proteins can disrupt virion structure and affect phage infection, requiring careful design of fluorescence reporters.
Another common approach is the creation of reporter viruses producing fluorescent proteins upon invading the cell, thereby allowing identification of infected cells (Bulssico et al., 2023). The disadvantages are the need to obtain modified viruses and long maturation periods for many fluorescent proteins, unsuitable for rapidly replicating lytic viruses. Fluorescent proteins can also be cloned under the control of native viral or bacterial promoters to detect various physiological states of the infected cell, such as SOS response, or track various stages of the lytic cycle in individual cells (Bulssico et al., 2023; Zeng et al., 2010; Amir et al., 2007; Bednarz et al., 2014; Baek et al., 2003).
Bioorthogonal labeling (BioOrthogonal Non-Canonical Amino acid Tagging, BONCAT) allows to incorporate non-canonical amino acids, such as 4-azido-L-homoalanine (AHA), into phage proteins during virion assembly in vivo, which can then be conjugated with fluorophores or biotin by click chemistry (Hellwig et al., 2024). Subsequent fluorescence microscopy, flow cytometry or avidin agarose pull-down enable to visualize and sort host cells with viral particles (Hellwig et al., 2024). Recently, a similar technique with improved labeling efficiency, employing a threonine analog (THReOnine-derived Non-Canonical Amino acid Tagging, THRONCAT), was introduced but it remains untested in phages (Ignacio et al., 2023). The limitations of these methods include potential interference of such modifications with virion assembly and variable labeling efficiencies across phage species.
Flow cytometry
The Flow Cytometry (FC) technique traces its origins to the Moldavan’s (1934) approach for cell counting, which aligned cells in a fluid stream for detection via a microscope-photoelectric apparatus. Modern instruments rely on fluorescence detection, allowing quantification of cells labeled with antibodies, DNA- and RNA-specific dyes, viability markers, or fluorescent proteins (McKinnon, 2018). One of the key strengths of flow cytometry is its ability to rapidly analyze large numbers of cells while simultaneously measuring multiple parameters (McKinnon, 2018). Instead of producing images, FC provides numerical data on the prevalence of cell subpopulations. This allows for rapid and precise determination of the proportions of bacteria in different states (Lindström, 2012; O’Connor, 1996) (Figure 4B).
FC is a powerful alternative to traditional methods for quantifying bacterial populations in endpoint infection assays. Cell staining with intercalating dyes allows direct cell quantification after viral infection, bypassing the need for CFU counting but potentially including non-viable cells (Verthé and Verstraete, 2006). When combined with two-dye viability staining, this approach provides quantitative assessment of phage-mediated killing across populations (Verthé and Verstraete, 2006; Pires and Melo, 2018). Synchronized infection experiments with timed sampling make it possible to track the accumulation of dead cells and detect the point of culture collapse (Melo et al., 2018; Melo et al., 2022; Silva and Melo, 2024; Ameh et al., 2020; Ameh et al., 2018).
FC can be used to count phages when no cultivable host is available for plaque counting (Brussaard, 2009; Oliveira et al., 2017). Pre-staining of virions with intercalating dyes or fluorescent proteins allows for the measurement of the total number of viral particles in the sample using FC. However, it requires ultra-sensitive detection instruments as viral DNA is small compared to the genomes of most bacteria, resulting in low fluorescence intensity (Brussaard, 2009; Oliveira et al., 2017). Unlabeled bacteriophages can be counted by measurements of light scattering, available in most cytometers (Ma et al., 2016). A flow cytometry-based method for measuring the phage adsorption rate has also been proposed (Zemb et al., 2013).
While flow cytometers typically discard individual cells during analysis, fluorescence-activated cell sorting (FACS) separates cells into fractions based on predefined parameters and can be used for isolation of virus-targeted bacteria (Telford, 2023). For example, cell sorting can be applied for isolation of uncultured host bacteria and their phages from environmental samples. In Phage Receptor-binding proteins-Activated Cell Sorting (PhRACS), environmental bacteria are tagged with fluorescently labeled phage receptor-binding proteins, allowing their extraction from mixed populations by FACS. A similar technique employs fluorescently-labeled cell wall-binding domains of viral endolysin proteins for isolation of specific bacterial hosts using FACS, followed by His-tag based separation of bacteria on magnetic beads (Hosokawa et al., 2023). Since phage proteins can potentially bind to non-host cells, identified phage-bacteria pairs need to be verified using other methods. Cell sorting has also been employed for the selective isolation of virus-infected bacteria, using fluorescently tagged phages to distinguish infected and uninfected cells (Deng et al., 2012; Unterer et al., 2023).
In comparison with fluorescence microscopy, FC provides high-throughput quantitative data on subpopulation distributions and allows faster sample processing (Lindström, 2012; O’Connor, 1996). At the same time, conventional flow cytometry cannot track individual cells over time or provide spatial information about intracellular organization. Combinations of fluorescence microscopy and flow cytometry can help to overcome the limitations of both techniques (Godfrey et al., 2005). For example, recently developed Imaging Flow Cytometry method allows to rapidly take images of individual cells while they are passing through the detector (Rees et al., 2022). In summary, diverse labeling techniques for nucleic acids and proteins enable single-molecule and single-cell tracking of phages and bacteria through advanced imaging and sorting technologies.
Microfluidics-based techniques
Microfluidics is a relatively new field that encompasses a wide range of devices and techniques designed to perform experiments on a miniaturized scale, using small volumes of liquids and particles. For an introduction to microfluidics and its applications in bacterial research, we recommend the reviews by Whitesides (2006) and Pérez-Rodríguez et al. (2022). There are several microfluidics designs often employed in phage research. Droplet microfluidics enables analysis of individual phages and bacteria by encapsulating them in picoliter- to nanoliter-scale droplets. Channel microfluidics uses devices consisting of microscale channels with dimensions in submillimeter range with controlled fluid flow, where bacteria can be grown (Whitesides, 2006). Compared to traditional techniques, microfluidic devices enable fine-tuned manipulation of environmental parameters, including chemical gradients, temperature, oxygen levels, and fluid flow (Pérez-Rodríguez et al., 2022). Microfluidic systems are usually integrated with fluorescence microscopy to observe bacteria and phages in real time using the labeling techniques described above. Several microfluidic techniques that have been used to analyze phage infection dynamics are described below (Figure 4D).
One channel-based microfluidic system employs a microfluidic culture plate (“Organoplate”) with 96 small chambers with thin glass bottom for direct microscopic observation. Each of the chambers contains two parallel channels separated by a thin ridge called a phaseguide which allows partial diffusion between chambers (Mabrouk et al., 2023). Bacteria expressing fluorescent proteins are grown on semi-solid agar medium in one of the channels, while the bacteriophage sample is passed in liquid medium through the second channel. Designed to isolate and characterize new phages, this platform monitors bacteria-phage interactions in real time and can capture bacterial lysis, phage resistance, and morphological changes during infection (Mabrouk et al., 2023). With its high-throughput capabilities, it allows simultaneous study of multiple combinations of bacteria and phages, but requires specific materials and equipment.
Droplet-based microfluidics has also been successfully used to isolate and detect phages (Hoshino et al., 2023). In this approach, a droplet generator produces miniature droplets, each acting as an isolated microenvironment for phage-host co-cultivation. Each droplet harbors labeled host bacteria infected with phages and a fluorescent dye that binds to newly synthesized phage DNA. An increase in the fluorescence signal identifies droplets with successful phage propagation. Such droplets can then be sorted into a 96-well plate for subsequent phage isolation. By analyzing thousands of droplets in parallel, this method achieves high-throughput phage screening and phage detection in environmental samples (Hoshino et al., 2023). A related droplet-based method allows prolonged imaging of phage-bacteria interactions, by immobilizing droplets in miniature wells for time-lapse fluorescence microscopy (Nikolic et al., 2023). The use of GFP-labeled bacteria allows quantification of population dynamics, including growth rates, doubling times, and lysis events, providing high-resolution, kinetic data on phage-mediated bacterial killing. Droplet-based microfluidics has potential disadvantages including droplet coalescence, biased encapsulation efficiency favoring certain phage-host pairs, and limited scalability due to the technical complexity of droplet generation and analysis.
A recently described droplet-based microfluidic technique allows to estimate phage concentration using a ‘digital phage SlipChip’ device and principles analogous to ddPCR (Li et al., 2023). Here, nanoliter droplets are used to compartmentalize phages and bacteria, and bacterial growth is monitored by light microscopy. Droplets devoid of growth indicate phage-mediated lysis, while growing cultures suggest phage absence. Applying Poisson statistics to these outcomes yields an accurate phage count. Analogous to ddPCR, each droplet functions as an independent assay, detecting only infectious phages. A recent preprint by Givelet et al. (2025) also highlights the advantages of using droplet-based microfluidics for phage quantification. This method allows for precise control of MOI and exposure time, which is essential for accurate determination of lysis events.
Tadmor et al. (2011) developed a microfluidic ddPCR approach to identify virus-host pairs directly from environmental samples. Diluted samples are loaded into a device designed to isolate single bacterial cells per chamber. Amplification of bacterial and viral gene markers using ddPCR reveals phage-host pairs when both signals are detected in the same chamber. The Emulsion Paired Isolation-Concatenation PCR (epicPCR) can also be used for phage-host pair identification, by creating chimeric bacterial-viral amplicons if both target genes are present in the same droplet, which can then be sequenced (Sakowski et al., 2021). Both ddPCR-microfluidics and EpicPCR can process thousands of individual droplets simultaneously, allowing researchers to capture and analyze numerous interactions in a single experiment without the need for cultivation. The limitation of this approach is the lack of universal phage genes for amplification, but the method works well for specific phage groups.
In summary, microfluidics enables single-cell analysis of phage-bacteria interactions and can be applied for analysis of uncultivated bacteria from environmental samples, but demands specialized equipment and expertise. It is typically coupled with imaging or sequencing platforms for visualization and identification of interacting bacteria and phages.
NGS methods in phage research
The use of next generation sequencing (NGS) methods has dramatically expanded our understanding of bacteriophage diversity in the environment, including uncultivated phages and host bacteria. The main disadvantage of these approaches is the destruction of cells during library preparation. But they are widely used in modern biology, including phage research. For example, a large-scale human microbiota study identified over 100,000 bacteriophages through database mapping (Camarillo-Guerrero et al., 2021). Metagenomic analysis of viromes is performed using several available tools including vRhyme (Kieft et al., 2022), PHAMB (Johansen et al., 2022), COBRA (Chen and Banfield, 2024) and ViromeFlowX (Wang R. H. et al., 2024). PhageScope, a curated database, integrates diverse phage sequences with functional annotations (Wang R. H. et al., 2024).
The ability to extract viromes from metagenomic data has uncovered links between microbiota, phages and human health, with disease prevalence often correlated with specific microbiome profiles (Hou et al., 2022). It was shown that viral diversity varies with age (Zeng et al., 2024) and declines in disease state (Zhang and Wang, 2023; Kirk et al., 2024). For instance, a recently described phage order Ca. Heliusvirales has been linked to urban-associated conditions like metabolic syndrome, diabetes, and inflammatory bowel disease (de Jonge et al., 2024; de Jonge et al., 2022). Mouse models have confirmed inflammatory bowel disease (IBD)-virome associations (Tian et al., 2024), and gut virome alterations have been implicated in type 2 diabetes (Fan et al., 2023) and asthma (Leal Rodríguez et al., 2024).
Despite huge progress in microbiome and virome sequencing, phage-bacteria interactions in vivo remain poorly understood and phage-host correlations are challenging to establish. Analysis of the spacer content of CRISPR cassettes can be used to link phages to hosts; for example, such approach revealed striking contrasts between rumen and human gut viromes (Yan et al., 2023). However, its throughput is limited and many phages cannot be matched to any CRISPR sequences. A comprehensive review of bioinformatics tools used for phage host prediction was recently published by Clément Coclet and Simon Roux (Coclet and Roux, 2021).
Recently developed NGS approaches can provide data on virus-host interactions at the single-cell level (Figure 4C). A high-throughput chromosome conformation capture (Hi-C) method, which uses formaldehyde crosslinks prior to sequencing, significantly enhances metagenome analysis. Crosslinking bacterial and phage DNA within cells enables phage-host pairing during library preparation, a feat impossible with conventional NGS. For example, combining long-read sequencing with Hi-C analysis identified nearly 200 novel virus-host pairs in the rumen microbiome (Leal Rodríguez et al., 2024). Similar approach uncovered hosts of crass-like phage in the human gut microbiome (Marbouty et al., 2021). In soil, Hi-C coupled with metagenomic DNA/RNA sequencing identified some virus-host pairs and showed that drying induces lysogeny and reduces viral transcription (Wu et al., 2023). It was shown that Hi-C-based bioinformatics tools, such as ViralCC, outperform other phage binning methods in efficiency (Du et al., 2023). However, Hi-C-based NGS methods exhibit decreased sensitivity in low-biomass or complex microbiomes due to insufficient crosslinking events between rare phage-host pairs and elevated noise-to-signal ratios due to nonspecific DNA ligation.
Single-cell RNA sequencing (scRNA-seq) can elucidate phage-bacteria connections without the crosslinking step, by analyzing the transcriptomes of single cells. In this approach, the presence of bacterial and phage transcripts in the same cell is interpreted as a sign of successful infection. However, these methods lose some information during sample preparation, and miss phages that may remain in an inactive form. SmRNA-seq was successfully applied for testing bacterial susceptibility to phage infection (Wang B. et al., 2023), uncovering phage-host pairs in the human microbiome (Shen et al., 2024), and studying mixed bacterial communities and prophage induction (Wang B. et al., 2023).
In summary, single-cell approaches make possible high-resolution observation of cell-phage interactions, allowing to reveal population heterogeneity and extending these studies to uncultivated microbes.
Conclusion
In the 20th century, phage research relied mainly on cultivated bacteria and population-level assays. While traditional bulk solid/liquid culture methods remain widespread due to their simplicity and scalability, they ignore cellular heterogeneity by averaging data across populations. The 21st century has introduced single-cell and high-throughput techniques, revealing phage-bacteria interactions in unprecedented detail in both laboratory and environmental samples, including for uncultivated hosts. Modern phage biology thrives at the intersection of population-scale and single-cell methods, and brings together fundamental and applied research. Classical methods are convenient to use in routine experiments, due to low financial cost and no need in bioinformatic data processing. Solid media methods allow for quick identification and calculation of phage particles. In liquid culture, additional modifications can be made and lysis can be detected more efficiently. Working with single cells requires specialized skills and equipment, but provides high-resolution data unavailable from classic approaches. Most modern studies on molecular mechanisms of infection, analysis of microbial communities and optimization of phage cocktail therapies rely on single-cell techniques. Today, fluorescence microscopy, flow cytometry, microfluidics and NGS, often used in combinations, are indispensable for high-throughput, quantitative phage research. Combining multiple approaches can elucidate the molecular mechanisms of the infection processes and expand our understanding of phage-bacteria interactions across ecosystems.
A promising direction in future phage research is the application of CRISPR-Cas tools for manipulating phage genomes, allowing researchers to study the infection mechanisms (Mahler et al., 2023) and control phage gene expression (Bergmiller, 2025). CRISPR-Cas cassettes with spacers targeting bacterial genomes can be integrated into phages to effectively eliminate bacterial cells, even in biofilms, in phage therapy (Gencay et al., 2024). The CRISPR-dCas13 systems targeting specific RNA transcripts have emerged as a powerful tool for studying the phage gene function (Adler et al., 2025). The SEC-MS method reveals dynamic changes in the proteome during infection (Fossati et al., 2023).
The future of phage research also lies in integrating AI and machine learning (ML) algorithms with experimental data. AI is currently being used for image analysis and prediction of host-phage pairs, optimizing phage therapy cocktail compositions, and facilitating the design of synthetic phages with enhanced therapeutic properties (Boeckaerts et al., 2024; Gaborieau et al., 2024; Doud et al., 2025). A large number of open-source software tools are available for phage research. For example, Serratus accelerates identification of phages in large datasets (Edgar et al., 2022). ML models improve host prediction (Boeckaerts et al., 2024; Shang and Sun, 2021) and the viral lifecycle (Zhang et al., 2024), simplifying experimental design. In the future, AI-driven phage engineering may help to fight bacterial infections and overcome antibiotic resistance.
Undoubtedly, the use of modern technologies in the field of phage biology, together with classical approaches, will significantly enrich this field.
Author contributions
VP: Conceptualization, Data curation, Visualization, Writing – original draft, Writing – review & editing. AK: Conceptualization, Funding acquisition, Supervision, Writing – review & editing. DG: Conceptualization, Data curation, Funding acquisition, Project administration, Supervision, Writing – original draft, Writing – review & editing.
Funding
The author(s) declare that financial support was received for the research and/or publication of this article. The work was funded by the Ministry of Science and Higher Education of the Russian Federation (topic no. FFEW-2024-0009, analysis of phage infection) and the Russian Science Foundation (grant no. 22-14-00182-P, analysis of phage immunity in bacteria). The funders had no role in study design, data collection and interpretation, or the decision to submit the work for publication.
Conflict of interest
The authors declare that the research was conducted in the absence of any commercial or financial relationships that could be construed as a potential conflict of interest.
Generative AI statement
The author(s) declare that Gen AI was used in the creation of this manuscript. AI was used to optimize text, check grammar and spelling.
Any alternative text (alt text) provided alongside figures in this article has been generated by Frontiers with the support of artificial intelligence and reasonable efforts have been made to ensure accuracy, including review by the authors wherever possible. If you identify any issues, please contact us.
Publisher’s note
All claims expressed in this article are solely those of the authors and do not necessarily represent those of their affiliated organizations, or those of the publisher, the editors and the reviewers. Any product that may be evaluated in this article, or claim that may be made by its manufacturer, is not guaranteed or endorsed by the publisher.
References
Abbott, M. A., Poiesz, B. J., Byrne, B. C., Kwok, S., Sninsky, J. J., and Ehrlich, G. D. (1988). Enzymatic gene amplification: qualitative and quantitative methods for detecting proviral DNA amplified in vitro. J. Infect. Dis. 158, 1158–1169. doi: 10.1093/infdis/158.6.1158
Abedon, S. T. (2016). Phage therapy dosing: the problem(s) with multiplicity of infection (MOI). Bacteriophage 6:e1220348. doi: 10.1080/21597081.2016.1220348
Abedon, S. T. (2021). “Detection of bacteriophages: phage plaques BT—Bacteriophages: biology, technology, therapy” in eds. D. R. Harper, S. T. Abedon, B. H. Burrowes, and M. L. McConville (Cham, Switzerland: Springer International Publishing), 507–538.
Abedon, S. T. (2023). Schlesinger nailed it! Assessing a key primary pharmacodynamic property of phages for phage therapy: virion encounter rates with motionless bacterial targets. Drugs Drug Candidates 2, 673–688. doi: 10.3390/ddc2030034
Abedon, S. T., and Culler, R. R. (2007). Optimizing bacteriophage plaque fecundity. J. Theor. Biol. 249, 582–592. doi: 10.1016/j.jtbi.2007.08.006
Abedon, S. T., Hyman, P., and Thomas, C. (2003). Experimental examination of bacteriophage latent-period evolution as a response to bacterial availability. Appl. Environ. Microbiol. 69, 7499–7506. doi: 10.1128/AEM.69.12.7499-7506.2003
Abedon, S. T., and Yin, J. (2009). Bacteriophage plaques: theory and analysis. Methods Mol. Biol. 501, 161–174. doi: 10.1007/978-1-60327-164-6_17
Ackermann, H. W. (2011). The first phage electron micrographs. Bacteriophage 1, 225–227. doi: 10.4161/bact.1.4.17280
Ackermann, H.-W. (2012). Bacteriophage electron microscopy. Adv. Virus Res. 82, 1–32. doi: 10.1016/B978-0-12-394621-8.00017-0
Adler, B. A., al-Shimary, M. J., Patel, J. R., Armbruster, E. G., Colognori, D., Charles, E. J., et al. (2025). CRISPRi-ART enables functional genomics of diverse bacteriophages using RNA-binding dCas13d. Nat. Microbiol. 10, 694–709. doi: 10.1038/s41564-025-01935-7
Allers, E., Moraru, C., Duhaime, M. B., Beneze, E., Solonenko, N., Barrero-Canosa, J., et al. (2013). Single-cell and population level viral infection dynamics revealed by phageFISH, a method to visualize intracellular and free viruses. Environ. Microbiol. 15, 2306–2318. doi: 10.1111/1462-2920.12100
Ameh, E. M., Tyrrel, S., Harris, J., Ignatiou, A., Orlova, E., and Nocker, A. (2018). The absence or presence of a lytic coliphage affects the response of Escherichia coli to heat, chlorine, or UV exposure. Folia Microbiol. (Praha) 63, 599–606. doi: 10.1007/s12223-018-0600-9
Ameh, E. M., Tyrrel, S., Harris, J. A., Pawlett, M., Orlova, E. V., Ignatiou, A., et al. (2020). Lysis performance of bacteriophages with different plaque sizes and comparison of lysis kinetics after simultaneous and sequential phage addition. PHAGE (New Rochelle, N.Y.) 1, 149–157. doi: 10.1089/phage.2020.0005
Amir, A., Kobiler, O., Rokney, A., Oppenheim, A. B., and Stavans, J. (2007). Noise in timing and precision of gene activities in a genetic cascade. Mol. Syst. Biol. 3:71. doi: 10.1038/msb4100113
Anderson, T. F. (1948a). The influence of temperature and nutrients on plaque formation by bacteriophages active on Escherichia coli strain B. J. Bacteriol. 55, 659–665. doi: 10.1128/jb.55.5.659-665.1948
Anderson, T. F. (1948b). The activation of the bacterial virus T4 by l-tryptophan. J. Bacteriol. 55, 637–649. doi: 10.1128/jb.55.5.637-649.1948
Baek, K., Svenningsen, S., Eisen, H., Sneppen, K., and Brown, S. (2003). Single-cell analysis of lambda immunity regulation. J. Mol. Biol. 334, 363–372. doi: 10.1016/j.jmb.2003.09.037
Banihashemi, A., Van Dyke, M. I., and Huck, P. M. (2012). Long-amplicon propidium monoazide-PCR enumeration assay to detect viable Campylobacter and Salmonella. J. Appl. Microbiol. 113, 863–873. doi: 10.1111/j.1365-2672.2012.05382.x
Barer, R. (1974). Microscopes, microscopy, and microbiology. Ann. Rev. Microbiol. 28, 371–390. doi: 10.1146/annurev.mi.28.100174.002103
Batchelor, R. H., and Zhou, M. (2004). Use of cellular glucose-6-phosphate dehydrogenase for cell quantitation: applications in cytotoxicity and apoptosis assays. Anal. Biochem. 329, 35–42. doi: 10.1016/j.ab.2004.02.007
Batinovic, S., Wassef, F., Knowler, S. A., Rice, D. T. F., Stanton, C. R., Rose, J., et al. (2019). Bacteriophages in natural and artificial environments. Pathogens 8:100. doi: 10.3390/pathogens8030100
Bednarz, M., Halliday, J. A., Herman, C., and Golding, I. (2014). Revisiting bistability in the lysis/lysogeny circuit of bacteriophage lambda. PLoS One 9, 1–9. doi: 10.1371/journal.pone.0100876
Bergmiller, T. (2025). Programming CRISPRi to control the lifecycle of bacteriophage T7. Front. Microbiol. 16. doi: 10.3389/fmicb.2025.1497650
Bernheim, A., and Sorek, R. (2020). The pan-immune system of bacteria: antiviral defence as a community resource. Nat. Rev. Microbiol. 18, 113–119. doi: 10.1038/s41579-019-0278-2
Bertani, G. (1951). Studies on lysogenesis. I. The mode of phage liberation by lysogenic Escherichia coli. J. Bacteriol. 62, 293–300. doi: 10.1128/jb.62.3.293-300.1951
Blasco, R., Murphy, M. J., Sanders, M. F., and Squirrell, D. J. (1998). Specific assays for bacteria using phage mediated release of adenylate kinase. J. Appl. Microbiol. 84, 661–666. doi: 10.1046/j.1365-2672.1998.00393.x
Boeckaerts, D., Stock, M., Ferriol-González, C., Oteo-Iglesias, J., Sanjuán, R., Domingo-Calap, P., et al. (2024). Prediction of Klebsiella phage-host specificity at the strain level. Nat. Commun. 15:4355. doi: 10.1038/s41467-024-48675-6
Böhm, J., Lambert, O., Frangakis, A. S., Letellier, L., Baumeister, W., and Rigaud, J. L. (2001). FhuA-mediated phage genome transfer into liposomes: a cryo-electron tomography study. Curr. Biol. 11, 1168–1175. doi: 10.1016/S0960-9822(01)00349-9
Bonilla, N., Rojas, M. I., Netto Flores Cruz, G., Hung, S. H., Rohwer, F., and Barr, J. J. (2016). Phage on tap-a quick and efficient protocol for the preparation of bacteriophage laboratory stocks. PeerJ 4:e2261. doi: 10.7717/peerj.2261
Bourdin, G., Navarro, A., Sarker, S. A., Pittet, A. C., Qadri, F., Sultana, S., et al. (2014). Coverage of diarrhoea-associated Escherichia coli isolates from different origins with two types of phage cocktails. Microb. Biotechnol. 7, 165–176. doi: 10.1111/1751-7915.12113
Brady, A., Felipe-Ruiz, A., Gallego del Sol, F., Marina, A., Quiles-Puchalt, N., and Penadés, J. R. (2021). Molecular basis of lysis–lysogeny decisions in gram-positive phages. Ann. Rev. Microbiol. 75, 563–581. doi: 10.1146/annurev-micro-033121-020757
Braissant, O., Astasov-Frauenhoffer, M., Waltimo, T., and Bonkat, G. (2020). A review of methods to determine viability, vitality, and metabolic rates in microbiology. Front. Microbiol. 11, 1–25. doi: 10.3389/fmicb.2020.547458
Braissant, O., Wirz, D., Göpfert, B., and Daniels, A. U. (2010). Use of isothermal microcalorimetry to monitor microbial activities. FEMS Microbiol. Lett. 303, 1–8. doi: 10.1111/j.1574-6968.2009.01819.x
Bruce, J. B., Lion, S., Buckling, A., Westra, E. R., and Gandon, S. (2021). Regulation of prophage induction and lysogenization by phage communication systems. Curr. Biol. 31, 5046–5051.e7. doi: 10.1016/j.cub.2021.08.073
Brussaard, C. P. D. (2009). Enumeration of bacteriophages using flow cytometry. Methods Mol. Biol. 501, 97–111. doi: 10.1007/978-1-60327-164-6_11
Bulssico, J., PapukashvilI, I., Espinosa, L., Gandon, S., and Ansaldi, M. (2023). Phage-antibiotic synergy: cell filamentation is a key driver of successful phage predation. PLoS Pathog. 19:e1011602. doi: 10.1371/journal.ppat.1011602
Burnet, F. M., Keogh, E. V., and Lush, D. (1938). Immunological reactions of the filterable viruses. Nature 141:983. doi: 10.1038/141983b0
Cacciabue, M., Currá, A., and Gismondi, M. I. (2019). ViralPlaque: a Fiji macro for automated assessment of viral plaque statistics. PeerJ 7:e7729. doi: 10.7717/peerj.7729
Camarillo-Guerrero, L. F., Almeida, A., Rangel-Pineros, G., Finn, R. D., and Lawley, T. D. (2021). Massive expansion of human gut bacteriophage diversity. Cell 184, 1098–1109.e9. doi: 10.1016/j.cell.2021.01.029
Chang, B., Taguri, T., Sugiyama, K., Amemura-Maekawa, J., Kura, F., and Watanabe, H. (2010). Comparison of ethidium monoazide and propidium monoazide for the selective detection of viable Legionella cells. Jpn. J. Infect. Dis. 63, 119–123. doi: 10.7883/yoken.63.119
Chen, L., and Banfield, J. F. (2024). COBRA improves the completeness and contiguity of viral genomes assembled from metagenomes. Nat. Microbiol. 9, 737–750. doi: 10.1038/s41564-023-01598-2
Chhibber, S., Kaur, P., and Gondil, V. S. (2018). Simple drop cast method for enumeration of bacteriophages. J. Virol. Methods 262, 1–5. doi: 10.1016/j.jviromet.2018.09.001
Chiang, Y. N., Penadés, J. R., and Chen, J. (2019). Genetic transduction by phages and chromosomal islands: the new and noncanonical. PLoS Pathog. 15:e1007878. doi: 10.1371/journal.ppat.1007878
Cho, K., Lee, C., Park, S. J., Kim, J. H., Choi, Y. S., Kim, M. S., et al. (2018). Use of coliphages to investigate norovirus contamination in a shellfish growing area in Republic of Korea. Environ. Sci. Pollut. Res. Int. 25, 30044–30055. doi: 10.1007/s11356-018-2857-6
Clokie, M. R., Millard, A. D., Letarov, A. V., and Heaphy, S. (2011). Phages in nature. Bacteriophage 1, 31–45. doi: 10.4161/bact.1.1.14942
Coclet, C., and Roux, S. (2021). Global overview and major challenges of host prediction methods for uncultivated phages. Curr. Opin. Virol. 49, 117–126. doi: 10.1016/j.coviro.2021.05.003
Cooper, C. J., Denyer, S. P., and Maillard, J. -Y. (2011). Rapid and quantitative automated measurement of bacteriophage activity against cystic fibrosis isolates of Pseudomonas aeruginosa. J. Appl. Microbiol. 110, 631–640. doi: 10.1111/j.1365-2672.2010.04928.x
Cryan, J. F., and Dinan, T. G. (2012). Mind-altering microorganisms: the impact of the gut microbiota on brain and behaviour. Nat. Rev. Neurosci. 13, 701–712. doi: 10.1038/nrn3346
Cunningham, S. A., Mandrekar, J. N., Suh, G., and Patel, R. (2022). Preliminary reproducibility evaluation of a phage susceptibility testing method using a collection of Escherichia coli and Staphylococcus aureus phages. J. Appl. Lab. Med. 7, 1468–1475. doi: 10.1093/jalm/jfac051
Cvirkaitė-Krupovič, V., Krupovič, M., Daugelavičius, R., and Bamford, D. H. (2010). Calcium ion-dependent entry of the membrane-containing bacteriophage PM2 into its Pseudoalteromonas host. Virology 405, 120–128. doi: 10.1016/j.virol.2010.05.021
Dalmasso, M., de Haas, E., Neve, H., Strain, R., Cousin, F. J., Stockdale, S. R., et al. (2015). Isolation of a novel phage with activity against Streptococcus mutans biofilms. PLoS One 10, 1–18. doi: 10.1371/journal.pone.0138651
Damron, F. H., McKenney, E. S., Barbier, M., Liechti, G. W., Schweizer, H. P., and Goldberg, J. B. (2013). Construction of mobilizable mini-Tn7 vectors for bioluminescent detection of gram-negative bacteria and single-copy promoter lux reporter analysis. Appl. Environ. Microbiol. 79, 4149–4153. doi: 10.1128/AEM.00640-13
Dang, V. T., Howard-Varona, C., Schwenck, S., and Sullivan, M. B. (2015). Variably lytic infection dynamics of large Bacteroidetes podovirus phi38:1 against two Cellulophaga baltica host strains. Environ. Microbiol. 17, 4659–4671. doi: 10.1111/1462-2920.13009
Daugelavičius, R., Daujotaitė, G., and Bamford, D. H. (2024). Lysis physiology of Pseudomonas aeruginosa infected with ssRNA phage PRR1. Viruses 16:645. doi: 10.3390/v16040645
Davey, H. M. (2011). Life, death, and in-between: meanings and methods in microbiology. Appl. Environ. Microbiol. 77, 5571–5576. doi: 10.1128/AEM.00744-11
Deng, L., Gregory, A., Yilmaz, S., Poulos, B. T., Hugenholtz, P., and Sullivan, M. B. (2012). Contrasting life strategies of viruses that infect photo- and heterotrophic bacteria, as revealed by viral tagging. MBio 3:e00373-12. doi: 10.1128/mBio.00373-12
Herelle, F.de. (1917). Sur un microbe invisible antagoniste des bacilles dysentériques. C. R. Acad. Sci. 165, 373–375.
de Jonge, P. A., van den Born, B. J. H., Zwinderman, A. H., Nieuwdorp, M., Dutilh, B. E., and Herrema, H. (2024). Phylogeny and disease associations of a widespread and ancient intestinal bacteriophage lineage. Nat. Commun. 15:6346. doi: 10.1038/s41467-024-50777-0
de Jonge, P. A., Wortelboer, K., Scheithauer, T. P. M., van den Born, B. J. H., Zwinderman, A. H., Nobrega, F. L., et al. (2022). Gut virome profiling identifies a widespread bacteriophage family associated with metabolic syndrome. Nat. Commun. 13:3594. doi: 10.1038/s41467-022-31390-5
Decker, E.-M. (2001). The ability of direct fluorescence-based, two-colour assays to detect different physiological states of oral streptococci. Lett. Appl. Microbiol. 33, 188–192. doi: 10.1046/j.1472-765x.2001.00971.x
Delbrück, M. (1945). The burst size distribution in the growth of bacterial viruses (Bacteriophages). J. Bacteriol. 50, 131–135. doi: 10.1128/jb.50.2.131-135.1945
Deng, Y., Beahm, D. R., Ionov, S., and Sarpeshkar, R. (2021). Measuring and modeling energy and power consumption in living microbial cells with a synthetic ATP reporter. BMC Biol. 19:101. doi: 10.1186/s12915-021-01023-2
Dennehy, J. J., and Wang, I.-N. (2011). Factors influencing lysis time stochasticity in bacteriophage λ. BMC Microbiol. 11:174. doi: 10.1186/1471-2180-11-174
Dibrova, D. V., Galperin, M. Y., Koonin, E. V., and Mulkidjanian, A. Y. (2015). Ancient systems of sodium/potassium homeostasis as predecessors of membrane bioenergetics. Biochemistry (Mosc) 80, 495–516. doi: 10.1134/S0006297915050016
Doss, J. H., Barekzi, N., and Gauthier, D. T. (2022). Improving high-throughput techniques for bacteriophage discovery in multi-well plates. J. Microbiol. Methods 200:106542. doi: 10.1016/j.mimet.2022.106542
Doud, M. B., Robertson, J. M., and Strathdee, S. A. (2025). Optimizing phage therapy with artificial intelligence: a perspective. Front. Cell. Infect. Microbiol. 15. doi: 10.3389/fcimb.2025.1611857
Du, Y., Fuhrman, J. A., and Sun, F. (2023). ViralCC retrieves complete viral genomes and virus-host pairs from metagenomic hi-C data. Nat. Commun. 14:502. doi: 10.1038/s41467-023-35945-y
Dufour, N., Delattre, R., and Debarbieux, L. (2024). High-throughput bacteriophage testing with potency determination: validation of an automated pipetting and phage drop-off method. Biomedicine 12:466. doi: 10.3390/biomedicines12020466
Duyvejonck, H., Merabishvili, M., Pirnay, J. P., de Vos, D., Verbeken, G., van Belleghem, J., et al. (2019). Development of a qPCR platform for quantification of the five bacteriophages within bacteriophage cocktail 2 (BFC2). Sci. Rep. 9:13893. doi: 10.1038/s41598-019-50461-0
Eaton, M. D. (1931). A quantitative study of the respiration of Staphylococcus cultures lysed by bacteriophage. J. Bacteriol. 21, 143–156. doi: 10.1128/jb.21.3.143-156.1931
Edgar, R. C., Taylor, B., Lin, V., Altman, T., Barbera, P., Meleshko, D., et al. (2022). Petabase-scale sequence alignment catalyses viral discovery. Nature 602, 142–147. doi: 10.1038/s41586-021-04332-2
Egido, J. E., Toner-Bartelds, C., Costa, A. R., Brouns, S. J. J., Rooijakkers, S. H. M., Bardoel, B. W., et al. (2023). Monitoring phage-induced lysis of gram-negatives in real time using a fluorescent DNA dye. Sci. Rep. 13:856. doi: 10.1038/s41598-023-27734-w
Ellis, E. L., and Delbrück, M. (1939). The growth of bacteriophage. J. Gen. Physiol. 22, 365–384. doi: 10.1085/jgp.22.3.365
Emerson, J. B., Adams, R. I., Román, C. M. B., Brooks, B., Coil, D. A., Dahlhausen, K., et al. (2017). Schrödinger’s microbes: tools for distinguishing the living from the dead in microbial ecosystems. Microbiome 5:86. doi: 10.1186/s40168-017-0285-3
Erez, Z., Steinberger-Levy, I., Shamir, M., Doron, S., Stokar-Avihail, A., Peleg, Y., et al. (2017). Communication between viruses guides lysis-lysogeny decisions. Nature 541, 488–493. doi: 10.1038/nature21049
Eriksson, M., Härdelin, M., Larsson, A., Bergenholtz, J., and Akerman, B. (2007). Binding of intercalating and groove-binding cyanine dyes to bacteriophage T5. J. Phys. Chem. B 111, 1139–1148. doi: 10.1021/jp064322m
Fan, G., Cao, F., Kuang, T., Yi, H., Zhao, C., Wang, L., et al. (2023). Alterations in the gut virome are associated with type 2 diabetes and diabetic nephropathy. Gut Microbes 15:2226925. doi: 10.1080/19490976.2023.2226925
Fanaei, V., Validi, M., Zamanzad, B., and Karimi, A. (2021). Isolation and identification of specific bacteriophages against methicillin-resistant Staphylococcus aureus, extended-spectrum beta-lactamases-producing Escherichia coli, extended-spectrum beta-lactamases-producing Klebsiella pneumoniae, and multidrug-res. FEMS Microbiol. Lett. 368:fnab139. doi: 10.1093/femsle/fnab139
Fittipaldi, M., Rodriguez, N. J. P., Codony, F., Adrados, B., Peñuela, G. A., and Morató, J. (2010). Discrimination of infectious bacteriophage T4 virus by propidium monoazide real-time PCR. J. Virol. Methods 168, 228–232. doi: 10.1016/j.jviromet.2010.06.011
Fortier, L.-C., and Sekulovic, O. (2013). Importance of prophages to evolution and virulence of bacterial pathogens. Virulence 4, 354–365. doi: 10.4161/viru.24498
Fossati, A., Mozumdar, D., Kokontis, C., Mèndez-Moran, M., Nieweglowska, E., Pelin, A., et al. (2023). Next-generation proteomics for quantitative Jumbophage-bacteria interaction mapping. Nat. Commun. 14:5156. doi: 10.1038/s41467-023-40724-w
Gaborieau, B., Vaysset, H., Tesson, F., Charachon, I., Dib, N., Bernier, J., et al. (2024). Prediction of strain level phage–host interactions across the Escherichia genus using only genomic information. Nat. Microbiol. 9, 2847–2861. doi: 10.1038/s41564-024-01832-5
Gandon, S. (2016). Why be temperate: lessons from bacteriophage λ. Trends Microbiol. 24, 356–365. doi: 10.1016/j.tim.2016.02.008
Gao, Z., and Feng, Y. (2023). Bacteriophage strategies for overcoming host antiviral immunity. Front. Microbiol. 14:1211793. doi: 10.3389/fmicb.2023.1211793
Gencay, Y. E., Jasinskytė, D., Robert, C., Semsey, S., Martínez, V., Petersen, A. Ø., et al. (2024). Engineered phage with antibacterial CRISPR–Cas selectively reduce E. coli burden in mice. Nat. Biotechnol. 42, 265–274. doi: 10.1038/s41587-023-01759-y
Geng, Y., Nguyen, T. V. P., Homaee, E., and Golding, I. (2024). Using bacterial population dynamics to count phages and their lysogens. Nat. Commun. 15:7814. doi: 10.1038/s41467-024-51913-6
Georjon, H., and Bernheim, A. (2023). The highly diverse antiphage defence systems of bacteria. Nat. Rev. Microbiol. 21, 686–700. doi: 10.1038/s41579-023-00934-x
Gil, J. F., Mesa, V., Estrada-Ortiz, N., Lopez-Obando, M., Gómez, A., and Plácido, J. (2021). Viruses in extreme environments, current overview, and biotechnological potential. Viruses 13:81. doi: 10.3390/v13010081
Girones, R., Ferrús, M. A., Alonso, J. L., Rodriguez-Manzano, J., Calgua, B., de Abreu Corrêa, A., et al. (2010). Molecular detection of pathogens in water—the pros and cons of molecular techniques. Water Res. 44, 4325–4339. doi: 10.1016/j.watres.2010.06.030
Givelet, L., von Schönberg, S., Katzmeier, F., and Simmel, F. C. (2025). Digital phage biology in droplets. bioRxiv. doi: 10.1101/2025.01.14.632946
Godfrey, W. L., Hill, D. M., Kilgore, J. A., Buller, G. M., Bradford, J. A., Gray, D. R., et al. (2005). Complementarity of flow cytometry and fluorescence microscopy. Microsc. Microanal. 11, 246–247. doi: 10.1017/S1431927605510316
Goordial, J., Davila, A., Greer, C. W., Cannam, R., DiRuggiero, J., McKay, C. P., et al. (2017). Comparative activity and functional ecology of permafrost soils and lithic niches in a hyper-arid polar desert. Environ. Microbiol. 19, 443–458. doi: 10.1111/1462-2920.13353
Gratia, A. (1936). Des relations numériques entre bactéries lysogènes et particules de bactériophage. Ann. Inst. Pasteur (Paris) 57, 652–676.
Green, M. R., and Sambrook, J. (2017). Plating bacteriophage M13. Cold Spring Harb. Protoc. 2017:pdb.prot093427. doi: 10.1101/pdb.prot093427
Guosheng, L., Yi, L., Xiangdong, C., Peng, L., Ping, S., and Songsheng, Q. (2003). Study on interaction between T4 phage and Escherichia coli B by microcalorimetric method. J. Virol. Methods 112, 137–143. doi: 10.1016/S0166-0934(03)00214-3
Hamdi, M. F., Alsaedi, A. A., Hayder, A. Q., Bougafa, F. H. E., and Al-Bofkane, N. M. (2025). Invasive bacteriophages between a bell and a hammer: a comprehensive review of pharmacokinetics and bacterial defense systems. Discov. Life 55. doi: 10.1007/s11084-025-09686-5
Harada, K., Yamashita, E., Nakagawa, A., Miyafusa, T., Tsumoto, K., Ueno, T., et al. (2013). Crystal structure of the C-terminal domain of Mu phage central spike and functions of bound calcium ion. Biochimica et Biophysica Acta (BBA) 1834, 284–291. doi: 10.1016/j.bbapap.2012.08.015
Harb, L., Chamakura, K., Khara, P., Christie, P. J., Young, R., and Zeng, L. (2020). ssRNA phage penetration triggers detachment of the F-pilus. Proc. Natl. Acad. Sci. 117, 25751–25758. doi: 10.1073/pnas.2011901117
Hata, A., Hanamoto, S., Shirasaka, Y., Yamashita, N., and Tanaka, H. (2016). Quantitative distribution of infectious F-specific RNA phage genotypes in surface waters. Appl. Environ. Microbiol. 82, 4244–4252. doi: 10.1128/AEM.00621-16
Havelaar, A. H., and Hogeboom, W. M. (1983). Factors affecting the enumeration of coliphages in sewage and sewage-polluted waters. Antonie Van Leeuwenhoek 49, 387–397. doi: 10.1007/BF00399318
Hay, I. D., and Lithgow, T. (2019). Filamentous phages: masters of a microbial sharing economy. EMBO Rep. 20:e47427. doi: 10.15252/embr.201847427
He, L., Miguel-Romero, L., Patkowski, J. B., Alqurainy, N., Rocha, E. P. C., Costa, T. R. D., et al. (2024). Tail assembly interference is a common strategy in bacterial antiviral defenses. Nat. Commun. 15:7539. doi: 10.1038/s41467-024-51915-4
Heinrichs, M. E., Piedade, G. J., Popa, O., Sommers, P., Trubl, G., Weissenbach, J., et al. (2024). Breaking the ice: a review of phages in polar ecosystems. Methods Mol. Biol. 2738, 31–71. doi: 10.1007/978-1-0716-3549-0_3
Hellwig, P., Dittrich, A., Heyer, R., Reichl, U., and Benndorf, D. (2024). Detection, isolation and characterization of phage-host complexes using BONCAT and click chemistry. Front. Microbiol. 15:1434301. doi: 10.3389/fmicb.2024.1434301
Hennes, K. P., and Suttle, C. A. (1995). Direct counts of viruses in natural waters and laboratory cultures by epifluorescence microscopy. Limnol. Oceanogr. 40, 1050–1055. doi: 10.4319/lo.1995.40.6.1050
Hennes, K. P., Suttle, C. A., and Chan, A. M. (1995). Fluorescently labeled virus probes show that natural virus populations can control the structure of marine microbial communities. Appl. Environ. Microbiol. 61, 3623–3627. doi: 10.1128/aem.61.10.3623-3627.1995
Henry, M., Biswas, B., Vincent, L., Mokashi, V., Schuch, R., Bishop-Lilly, K. A., et al. (2012). Development of a high throughput assay for indirectly measuring phage growth using the OmniLog TM system. Bacteriophage 2, 159–167. doi: 10.4161/bact.21440
Hernández Villamizar, S., Chica Cárdenas, L. A., Morales Mancera, L. T., and Vives Florez, M. J. (2023). Anaerobiosis, a neglected factor in phage-bacteria interactions. Appl. Environ. Microbiol. 89:e0149123. doi: 10.1128/aem.01491-23
Hershey, A. D., Kalmanson, G., and Bronfenbrenner, J. (1943). Quantitative methods in the study of the phage-antiphage reaction. J. Immunol. 46, 267–279. doi: 10.4049/jimmunol.46.5.267
Hindson, C. M., Chevillet, J. R., Briggs, H. A., Gallichotte, E. N., Ruf, I. K., Hindson, B. J., et al. (2013). Absolute quantification by droplet digital PCR versus analog real-time PCR. Nat. Methods 10, 1003–1005. doi: 10.1038/nmeth.2633
Hindson, B. J., Ness, K. D., Masquelier, D. A., Belgrader, P., Heredia, N. J., Makarewicz, A. J., et al. (2011). High-throughput droplet digital PCR system for absolute quantitation of DNA copy number. Anal. Chem. 83, 8604–8610. doi: 10.1021/ac202028g
Ho, J., Seidel, M., Niessner, R., Eggers, J., and Tiehm, A. (2016). Long amplicon (LA)-qPCR for the discrimination of infectious and noninfectious phix174 bacteriophages after UV inactivation. Water Res. 103, 141–148. doi: 10.1016/j.watres.2016.07.032
Hooke, R. (1665). Micrographia: Or, some physiological descriptions of minute bodies made by magnifying glasses. With observations and inquiries thereupon. LondonPrint. by J. Martyn J. Allestry.
Hoshino, M., Ota, Y., Suyama, T., Morishita, Y., Tsuneda, S., and Noda, N. (2023). Water-in-oil droplet-mediated method for detecting and isolating infectious bacteriophage particles via fluorescent staining. Front. Microbiol. 14. doi: 10.3389/fmicb.2023.1282372
Hosokawa, M., Iwai, N., Arikawa, K., Saeki, T., Endoh, T., Kamata, K., et al. (2023). Target enrichment of uncultured human oral bacteria with phage-derived molecules found by single-cell genomics. J. Biosci. Bioeng. 136, 58–66. doi: 10.1016/j.jbiosc.2023.04.005
Hosseini, N., Chehreghani, M., Moineau, S., and Charette, S. J. (2024). Centroid of the bacterial growth curves: a metric to assess phage efficiency. Commun. Biol. 7:673. doi: 10.1038/s42003-024-06379-z
Hou, K., Wu, Z. X., Chen, X. Y., Wang, J. Q., Zhang, D., Xiao, C., et al. (2022). Microbiota in health and diseases. Signal Transduct. Target. Ther. 7:135. doi: 10.1038/s41392-022-00974-4
Huber, D., von Voith Voithenberg, L., and Kaigala, G. V. (2018). Fluorescence in situ hybridization (FISH): history, limitations and what to expect from micro-scale FISH? Micro Nano Eng. 1, 15–24. doi: 10.1016/j.mne.2018.10.006
Hyman, P., and Abedon, S. T. (2009). Practical methods for determining phage growth parameters. Methods Mol. Biol. 501, 175–202. doi: 10.1007/978-1-60327-164-6_18
Ignacio, B. J., Dijkstra, J., Mora, N., Slot, E. F. J., van Weijsten, M. J., Storkebaum, E., et al. (2023). THRONCAT: metabolic labeling of newly synthesized proteins using a bioorthogonal threonine analog. Nat. Commun. 14:3367. doi: 10.1038/s41467-023-39063-7
Islam, M. R., Ogura, Y., Asadulghani, M., Ooka, T., Murase, K., Gotoh, Y., et al. (2012). A sensitive and simple plaque formation method for the Stx2 phage of Escherichia coli O157:H7, which does not form plaques in the standard plating procedure. Plasmid 67, 227–235. doi: 10.1016/j.plasmid.2011.12.001
Jacobs, A. C., DiDone, L., Jobson, J., Sofia, M. K., Krysan, D., and Dunman, P. M. (2013). Adenylate kinase release as a high-throughput-screening-compatible reporter of bacterial lysis for identification of antibacterial agents. Antimicrob. Agents Chemother. 57, 26–36. doi: 10.1128/AAC.01640-12
Jamasbi, R. J., and Paulissen, L. J. (1978). Influence of bacteriological media constituents on the reproduction of Salmonella enteritidis bacteriophages. Antonie Van Leeuwenhoek 44, 49–57. doi: 10.1007/BF00400076
Jassim, S. A. A., and Griffiths, M. W. (2007). Evaluation of a rapid microbial detection method via phage lytic amplification assay coupled with live/dead fluorochromic stains. Lett. Appl. Microbiol. 44, 673–678. doi: 10.1111/j.1472-765X.2007.02115.x
Johansen, J., Plichta, D. R., Nissen, J. N., Jespersen, M. L., Shah, S. A., Deng, L., et al. (2022). Genome binning of viral entities from bulk metagenomics data. Nat. Commun. 13:965. doi: 10.1038/s41467-022-28581-5
Kannoly, S., Oken, G., Shadan, J., Musheyev, D., Singh, K., Singh, A., et al. (2022). Single-cell approach reveals intercellular heterogeneity in phage-producing capacities. Microbiol. Spectr. 11:e0266321. doi: 10.1128/spectrum.02663-21
Kaur, S., Harjai, K., and Chhibber, S. (2012). Methicillin-resistant Staphylococcus aureus phage plaque size enhancement using sublethal concentrations of antibiotics. Appl. Environ. Microbiol. 78, 8227–8233. doi: 10.1128/AEM.02371-12
Keen, E. C. (2015). A century of phage research: bacteriophages and the shaping of modern biology. BioEssays 37, 6–9. doi: 10.1002/bies.201400152
Khan Mirzaei, M., and Nilsson, A. S. (2015). Isolation of phages for phage therapy: a comparison of spot tests and efficiency of plating analyses for determination of host range and efficacy. PLoS One 10:e0118557. doi: 10.1371/journal.pone.0118557
Kieft, K., Adams, A., Salamzade, R., Kalan, L., and Anantharaman, K. (2022). vRhyme enables binning of viral genomes from metagenomes. Nucleic Acids Res. 50:e83. doi: 10.1093/nar/gkac341
Kim, S. Y., and Ko, G. (2012). Using propidium monoazide to distinguish between viable and nonviable bacteria, MS2 and murine norovirus. Lett. Appl. Microbiol. 55, 182–188. doi: 10.1111/j.1472-765X.2012.03276.x
Kinnunen, K. (1978). Tracing water movement by means of. Escherichia coli Bacteriophages. Finland: Vesihallitus—National Board of Waters.
Kirk, D., Costeira, R., Visconti, A., Khan Mirzaei, M., Deng, L., Valdes, A. M., et al. (2024). Bacteriophages, gut bacteria, and microbial pathways interplay in cardiometabolic health. Cell Rep. 43:113728. doi: 10.1016/j.celrep.2024.113728
Kiss, B., Mudra, D., Török, G., Mártonfalvi, Z., Csík, G., Herényi, L., et al. (2020). Single-particle virology. Biophys. Rev. 12, 1141–1154. doi: 10.1007/s12551-020-00747-9
Knecht, L. E., Veljkovic, M., and Fieseler, L. (2020). Diversity and function of phage encoded depolymerases. Front. Microbiol. 10. doi: 10.3389/fmicb.2019.02949
Knight, G. (2015). “Introduction to microscopy” in Cell structure & function. eds. G. Orchard and B. Nation (USA: Oxford University Press), 47–60.
Koch, A. L. (1964). The growth of viral plaques during the enlargement phase. J. Theor. Biol. 6, 413–431. doi: 10.1016/0022-5193(64)90056-6
Konopacki, M., Grygorcewicz, B., Dołęgowska, B., Kordas, M., and Rakoczy, R. (2020). Phagescore: a simple method for comparative evaluation of bacteriophages lytic activity. Biochem. Eng. J. 161:107652. doi: 10.1016/j.bej.2020.107652
Korajkic, A., McMinn, B. R., Herrmann, M. P., Pemberton, A. C., Kelleher, J., Oshima, K., et al. (2021). Performance evaluation of a dead-end hollowfiber ultrafiltration method for enumeration of somatic and F+ coliphage from recreational waters. J. Virol. Methods 296:114245. doi: 10.1016/j.jviromet.2021.114245
Koskella, B., Hernandez, C. A., and Wheatley, R. M. (2022). Understanding the impacts of bacteriophage viruses: from laboratory evolution to natural ecosystems. Annu. Rev. Virol. 9, 57–78. doi: 10.1146/annurev-virology-091919-075914
Kowalska-Krochmal, B., and Dudek-Wicher, R. (2021). The minimum inhibitory concentration of antibiotics: methods, interpretation, clinical relevance. Pathog. (Basel, Switzerland) 10:165. doi: 10.3390/pathogens10020165
Kronheim, S., Daniel-Ivad, M., Duan, Z., Hwang, S., Wong, A. I., Mantel, I., et al. (2018). A chemical defence against phage infection. Nature 564, 283–286. doi: 10.1038/s41586-018-0767-x
Kropinski, A. M. (2009). Measurement of the rate of attachment of bacteriophage to cells. Methods Mol. Biol. 501, 151–155. doi: 10.1007/978-1-60327-164-6_15
Kropinski, A. M. (2018). Practical advice on the one-step growth curve. Methods Mol. Biol. 1681, 41–47. doi: 10.1007/978-1-4939-7343-9_3
Krueger, A. P. (1931). The sorption of bacteriophage by living and dead susceptible bacteria: I. Equilibrium conditions. J. Gen. Physiol. 14, 493–516. doi: 10.1085/jgp.14.4.493
Kumar, P., Nagarajan, A., and Uchil, P. D. (2018). Analysis of cell viability by the lactate dehydrogenase assay. Cold Spring Harb. Protoc. 2018:e095497. doi: 10.1101/pdb.prot095497
Kümmerli, R., and Frank, S. A. (2023). Evolutionary explanations for heterogeneous behavior in clonal bacterial populations. Trends Microbiol. 31, 665–667. doi: 10.1016/j.tim.2023.04.003
Kunisch, F., Campobasso, C., Wagemans, J., Yildirim, S., Chan, B. K., Schaudinn, C., et al. (2024). Targeting Pseudomonas aeruginosa biofilm with an evolutionary trained bacteriophage cocktail exploiting phage resistance trade-offs. Nat. Commun. 15:8572. doi: 10.1038/s41467-024-52595-w
Kwon, J., Kim, S. G., Kim, H. J., Giri, S. S., Kim, S. W., Lee, S. B., et al. (2020). Isolation and characterization of Salmonella jumbo-phage pSal-SNUABM-04. Viruses 13:27. doi: 10.3390/v13010027
Lambert, L., and Mulvey, T. (1996). Ernst Ruska (1906–1988), designer extraordinaire of the electron microscope: a memoir. Adv. Imaging Electron Phys. 95, 2–62. doi: 10.1016/S1076-5670(08)70155-1
Langer-Safer, P. R., Levine, M., and Ward, D. C. (1982). Immunological method for mapping genes on Drosophila polytene chromosomes. Proc. Natl. Acad. Sci. 79, 4381–4385. doi: 10.1073/pnas.79.14.4381
Latka, A., and Drulis-Kawa, Z. (2020). Advantages and limitations of microtiter biofilm assays in the model of antibiofilm activity of Klebsiella phage KP34 and its depolymerase. Sci. Rep. 10:20338. doi: 10.1038/s41598-020-77198-5
Leal Rodríguez, C., Shah, S. A., Rasmussen, M. A., Thorsen, J., Boulund, U., Pedersen, C. E. T., et al. (2024). The infant gut virome is associated with preschool asthma risk independently of bacteria. Nat. Med. 30, 138–148. doi: 10.1038/s41591-023-02685-x
Lee, Y., and Yin, J. (1996). Detection of evolving viruses. Nat. Biotechnol. 14, 491–493. doi: 10.1038/nbt0496-491
Lefkowitz, E. J., Dempsey, D. M., Hendrickson, R. C., Orton, R. J., Siddell, S. G., Smith, D. B., et al. (2018). Virus taxonomy: the database of the international committee on taxonomy of viruses (ICTV). Nucleic Acids Res. 46, 708–717. doi: 10.1093/nar/gkx932
Letarov, A. V. (2020). History of early bacteriophage research and emergence of key concepts in virology. Biochemistry (Mosc) 85, 1093–1112. doi: 10.1134/S0006297920090096
Li, X., Hu, Q., Liu, X., Liu, J., Wu, N., and Shen, F. (2023). Rapid bacteriophage quantification by digital biosensing on a SlipChip microfluidic device. Anal. Chem. 95, 8632–8639. doi: 10.1021/acs.analchem.3c01066
Lidstrom, M. E., and Konopka, M. C. (2010). The role of physiological heterogeneity in microbial population behavior. Nat. Chem. Biol. 6, 705–712. doi: 10.1038/nchembio.436
Lillehaug, D. (1997). An improved plaque assay for poor plaque-producing temperate lactococcal bacteriophages. J. Appl. Microbiol. 83, 85–90. doi: 10.1046/j.1365-2672.1997.00193.x
Lin, L., Bitner, R., and Edlin, G. (1977). Increased reproductive fitness of Escherichia coli lambda lysogens. J. Virol. 21, 554–559. doi: 10.1128/jvi.21.2.554-559.1977
Lin, D. M., Koskella, B., and Lin, H. C. (2017). Phage therapy: an alternative to antibiotics in the age of multi-drug resistance. World J. Gastrointest. Pharmacol. Ther. 8, 162–173. doi: 10.4292/wjgpt.v8.i3.162
Lindström, S. (2012). Flow cytometry and microscopy as means of studying single cells: a short introductional overview. Methods Mol. Biol. 853, 13–15. doi: 10.1007/978-1-61779-567-1_2
Lisitskaya, L., Kropocheva, E., Agapov, A., Prostova, M., Panteleev, V., Yudin, D., et al. (2023). Bacterial Argonaute nucleases reveal different modes of DNA targeting in vitro and in vivo. Nucleic Acids Res. 51, 5106–5124. doi: 10.1093/nar/gkad290
Liu, Y., Mi, Z., Niu, W., An, X., Yuan, X., Liu, H., et al. (2016). Potential of a lytic bacteriophage to disrupt Acinetobacter baumannii biofilms in vitro. Future Microbiol. 11, 1383–1393. doi: 10.2217/fmb-2016-0104
Liu, H., Niu, Y. D., Li, J., Stanford, K., and McAllister, T. A. (2014). Rapid and accurate detection of bacteriophage activity against Escherichia coli O157:H7 by propidium monoazide real-time PCR. Biomed. Res. Int. 2014:319351. doi: 10.1155/2014/319351
Lopatina, A., Tal, N., and Sorek, R. (2020). Abortive infection: bacterial suicide as an antiviral immune strategy. Annu. Rev. Virol. 7, 371–384. doi: 10.1146/annurev-virology-011620-040628
Loś, J. M., Golec, P., Wegrzyn, G., Wegrzyn, A., and Loś, M. (2008). Simple method for plating Escherichia coli bacteriophages forming very small plaques or no plaques under standard conditions. Appl. Environ. Microbiol. 74, 5113–5120. doi: 10.1128/AEM.00306-08
Łoś, M., Golec, P., Łoś, J. M., Węglewska-Jurkiewicz, A., Czyż, A., Węgrzyn, A., et al. (2007). Effective inhibition of lytic development of bacteriophages lambda, P1 and T4 by starvation of their host, Escherichia coli. BMC Biotechnol. 7:13. doi: 10.1186/1472-6750-7-13
Luo, J., Liu, M., Wang, P., Li, Q., Luo, C., Wei, H., et al. (2022). Evaluation of a direct phage DNA detection-based Taqman qPCR methodology for quantification of phage and its application in rapid ultrasensitive identification of Acinetobacter baumannii. BMC Infect. Dis. 22:523. doi: 10.1186/s12879-022-07493-1
Ma, L., Zhu, S., Tian, Y., Zhang, W., Wang, S., Chen, C., et al. (2016). Label-free analysis of single viruses with a resolution comparable to that of electron microscopy and the throughput of flow cytometry. Angew. Chem. Int. Ed. Engl. 55, 10239–10243. doi: 10.1002/anie.201603007
Mabrouk, A. S., Ongenae, V., Claessen, D., Brenzinger, S., and Briegel, A. (2023). A flexible and efficient microfluidics platform for the characterization and isolation of novel bacteriophages. Appl. Environ. Microbiol. 89, e01596–e01522. doi: 10.1128/aem.01596-22
Mahler, M., Costa, A. R., van Beljouw, S. P. B., Fineran, P. C., and Brouns, S. J. J. (2023). Approaches for bacteriophage genome engineering. Trends Biotechnol. 41, 669–685. doi: 10.1016/j.tibtech.2022.08.008
Makky, S., Dawoud, A., Safwat, A., Abdelsattar, A. S., Rezk, N., and el-Shibiny, A. (2021). The bacteriophage decides own tracks: when they are with or against the bacteria. Curr. Res. Microb. Sci. 2:100050. doi: 10.1016/j.crmicr.2021.100050
Manikantha, B., Karthika, R., Murugadas, V., Visnuvinayagam, S., and Madhusudana Rao, B. (2022). Comparison of the single agar and double agar layer methods for enumeration of bacteriophages. Fish. Technol. 59, 60–63.
Marbouty, M., Thierry, A., Millot, G. A., and Koszul, R. (2021). MetaHiC phage-bacteria infection network reveals active cycling phages of the healthy human gut. eLife 10:e60608. doi: 10.7554/eLife.60608
Marling, K. B. E. (1949). Electron-microscopical studies on the mechanism of lysis and the multiplication of bacteriophage of Bact. Coli. Br. J. Exp. Pathol. 30, 139–150.
Martínez Martínez, J., Martinez-Hernandez, F., and Martinez-Garcia, M. (2020). Single-virus genomics and beyond. Nat. Rev. Microbiol. 18, 705–716. doi: 10.1038/s41579-020-00444-0
Martinez-Soto, C. E., Cucić, S., Lin, J. T., Kirst, S., Mahmoud, E. S., Khursigara, C. M., et al. (2021). PHIDA: a high throughput turbidimetric data analytic tool to compare host range profiles of bacteriophages isolated using different enrichment methods. Viruses 13:2120. doi: 10.3390/v13112120
Maskow, T., Kiesel, B., Schubert, T., Yong, Z., Harms, H., and Yao, J. (2010). Calorimetric real time monitoring of lambda prophage induction. J. Virol. Methods 168, 126–132. doi: 10.1016/j.jviromet.2010.05.002
Mayo-Muñoz, D., Pinilla-Redondo, R., Birkholz, N., and Fineran, P. C. (2023). A host of armor: prokaryotic immune strategies against mobile genetic elements. Cell Rep. 42:112672. doi: 10.1016/j.celrep.2023.112672
Mazzocco, A., Waddell, T. E., Lingohr, E., and Johnson, R. P. (2009a). Enumeration of bacteriophages by the direct plating plaque assay. Methods Mol. Biol. 501, 77–80. doi: 10.1007/978-1-60327-164-6_8
Mazzocco, A., Waddell, T. E., Lingohr, E., and Johnson, R. P. (2009b). Enumeration of bacteriophages using the small drop plaque assay system. Methods Mol. Biol. 501, 81–85. doi: 10.1007/978-1-60327-164-6_9
McConnell, M., and Wright, A. (1975). An anaerobic technique for increasing bacteriophage plaque size. Virology 65, 588–590. doi: 10.1016/0042-6822(75)90065-3
McKinnon, K. M. (2018). Flow cytometry: an overview. Curr. Protoc. Immunol. 120:5.1.1-5.1.11. doi: 10.1002/cpim.40
Mclellan, N. L., Lee, H., and Associate, M. B. H. (2016). Evaluation of propidium monoazide and long-amplicon qPCR as an infectivity assay for coliphage. J. Virol. Methods 238, 48–55. doi: 10.1016/j.jviromet.2016.10.004
McMinn, B. R., Rhodes, E. R., Huff, E. M., Wanjugi, P., Ware, M. M., Nappier, S. P., et al. (2018). Comparison of somatic and F+ coliphage enumeration methods with large volume surface water samples. J. Virol. Methods 261, 63–66. doi: 10.1016/j.jviromet.2018.08.007
Meeske, A. J., Nakandakari-Higa, S., and Marraffini, L. A. (2019). Cas13-induced cellular dormancy prevents the rise of CRISPR-resistant bacteriophage. Nature 570, 241–245. doi: 10.1038/s41586-019-1257-5
Meighen, E. A. (1991). Molecular biology of bacterial bioluminescence. Microbiol. Rev. 55, 123–142. doi: 10.1128/mr.55.1.123-142.1991
Melo, L. D. R., França, A., Brandão, A., Sillankorva, S., Cerca, N., and Azeredo, J. (2018). Assessment of Sep1virus interaction with stationary cultures by transcriptional and flow cytometry studies. FEMS Microbiol. Ecol. 94, 1–8. doi: 10.1093/femsec/fiy143
Melo, L. D. R., Monteiro, R., Pires, D. P., and Azeredo, J. (2022). Phage-host interaction analysis by flow cytometry allows for rapid and efficient screening of phages. Antibiotics (Basel) 11:164. doi: 10.3390/antibiotics11020164
Merabishvili, M., Pirnay, J. P., Verbeken, G., Chanishvili, N., Tediashvili, M., Lashkhi, N., et al. (2009). Quality-controlled small-scale production of a well-defined bacteriophage cocktail for use in human clinical trials. PLoS One 4, 1–10. doi: 10.1371/journal.pone.0004944
Mikolajcik, E. M. (1964). Some factors which govern plaque formation by lactic streptococcal bacteriophage.: I. Seed layer requirements. J. Food Prot. 27, 210–214. doi: 10.4315/0022-2747-27.7.210
Moldavan, A. (1934). Photo-electric technique for the counting of microscopical cells. Science 80, 188–189. doi: 10.1126/science.80.2069.188
Moraru, C., Lam, P., Fuchs, B. M., Kuypers, M. M. M., and Amann, R. (2010). GeneFISH—an in situ technique for linking gene presence and cell identity in environmental microorganisms. Environ. Microbiol. 12, 3057–3073. doi: 10.1111/j.1462-2920.2010.02281.x
Morella, N. M., Yang, S. C., Hernandez, C. A., and Koskella, B. (2018). Rapid quantification of bacteriophages and their bacterial hosts in vitro and in vivo using droplet digital PCR. J. Virol. Methods 259, 18–24. doi: 10.1016/j.jviromet.2018.05.007
Mosier-Boss, P. A., Lieberman, S. H., Andrews, J. M., Rohwer, F. L., Wegley, L. E., and Breitbart, M. (2003). Use of fluorescently labeled phage in the detection and identification of bacterial species. Appl. Spectrosc. 57, 1138–1144. doi: 10.1366/00037020360696008
Mushegian, A. R. (2020). Are there 10(31) virus particles on earth, or more, or fewer? J. Bacteriol. 202, e00052–e00020. doi: 10.1128/jb.00052-20
Nair, G., Chavez-Carbajal, A., Di Tullio, R., French, S., Maddiboina, D., Harvey, H., et al. (2024). Micro-plaque assays: a high-throughput method to detect, isolate, and characterize bacteriophages. bioRxiv. doi: 10.1101/2024.06.20.599855
Nang, S. C., Lin, Y. W., Petrovic Fabijan, A., Chang, R. Y. K., Rao, G. G., Iredell, J., et al. (2023). Pharmacokinetics/pharmacodynamics of phage therapy: a major hurdle to clinical translation. Clin. Microbiol. Infect. 29, 702–709. doi: 10.1016/j.cmi.2023.01.021
Naureen, Z., Dautaj, A., Anpilogov, K., Camilleri, G., Dhuli, K., Tanzi, B., et al. (2020). Bacteriophages presence in nature and their role in the natural selection of bacterial populations. Acta Biomed 91:e2020024. doi: 10.23750/abm.v91i13-S.10819
Nikolic, N., Anagnostidis, V., Tiwari, A., Chait, R., and Gielen, F. (2023). Droplet-based methodology for investigating bacterial population dynamics in response to phage exposure. Front. Microbiol. 14:1260196. doi: 10.3389/fmicb.2023.1260196
Nocker, A., Cheung, C.-Y., and Camper, A. K. (2006). Comparison of propidium monoazide with ethidium monoazide for differentiation of live vs. dead bacteria by selective removal of DNA from dead cells. J. Microbiol. Methods 67, 310–320. doi: 10.1016/j.mimet.2006.04.015
Nuanualsuwan, S., and Cliver, D. O. (2002). Pretreatment to avoid positive RT-PCR results with inactivated viruses. J. Virol. Methods 104, 217–225. doi: 10.1016/S0166-0934(02)00089-7
O’Connor, J.-E. (1996). “Flow cytometry versus fluorescence microscopy” in BT—Fluorescence microscopy and fluorescent probes. ed. J. Slavík (Boston, USA: Springer US), 61–66. doi: 10.1007/978-1-4899-1866-6_6
O’Flaherty, S., Coffey, A., Meaney, W. J., Fitzgerald, G. F., and Ross, R. P. (2005). Inhibition of bacteriophage K proliferation on Staphylococcus aureus in raw bovine milk. Lett. Appl. Microbiol. 41, 274–279. doi: 10.1111/j.1472-765X.2005.01762.x
O’Flynn, G., Coffey, A., Fitzgerald, G., and Paul Ross, R. (2007). Salmonella enterica phage-resistant mutant colonies display an unusual phenotype in the presence of phage Felix 01. Lett. Appl. Microbiol. 45, 581–585. doi: 10.1111/j.1472-765X.2007.02242.x
Oliveira, J., Mahony, J., Hanemaaijer, L., Kouwen, T. R. H. M., Neve, H., MacSharry, J., et al. (2017). Detecting Lactococcus lactis prophages by mitomycin C-mediated induction coupled to flow cytometry analysis. Front. Microbiol. 8:1343. doi: 10.3389/fmicb.2017.01343
Olsen, N. S., Hendriksen, N. B., Hansen, L. H., and Kot, W. (2020). A new high-throughput screening method for phages: enabling crude isolation and fast identification of diverse phages with therapeutic potential. PHAGE (New Rochelle, N.Y.) 1, 137–148. doi: 10.1089/phage.2020.0016
Oppenheim, A. B., Kobiler, O., Stavans, J., Court, D. L., and Adhya, S. (2005). Switches in bacteriophage lambda development. Annu. Rev. Genet. 39, 409–429. doi: 10.1146/annurev.genet.39.073003.113656
Otawa, K., Satoh, H., Kanai, Y., Onuki, M., and Mino, T. (2008). Rapid quantification of total viral DNA in the supernatants of activated sludge samples with the fluorescent dye PicoGreen®. Lett. Appl. Microbiol. 46, 434–438. doi: 10.1111/j.1472-765X.2008.02335.x
Paranos, P., Pournaras, S., and Meletiadis, J. (2024). A single-layer spot assay for easy, fast, and high-throughput quantitation of phages against multidrug-resistant Gram-negative pathogens. J. Clin. Microbiol. 62:e0074324. doi: 10.1128/jcm.00743-24
Pascual-Benito, M., Jorba-Plassa, A., Casas-Mangas, R., Blanch, A. R., and Martín-Díaz, J. (2022). Comparison of methods for the enumeration of coliphages in 100 mL water samples. Sci. Total Environ. 838:156381. doi: 10.1016/j.scitotenv.2022.156381
Patel, P. H., Taylor, V. L., Zhang, C., Getz, L. J., Fitzpatrick, A. D., Davidson, A. R., et al. (2024). Anti-phage defence through inhibition of virion assembly. Nat. Commun. 15:1644. doi: 10.1038/s41467-024-45892-x
Pecson, B. M., Ackermann, M., and Kohn, T. (2011). Framework for using quantitative PCR as a nonculture based method to estimate virus infectivity. Environ. Sci. Technol. 45, 2257–2263. doi: 10.1021/es103488e
Peng, X., Nguyen, A., and Ghosh, D. (2018). Quantification of M13 and T7 bacteriophages by TaqMan and SYBR green qPCR. J. Virol. Methods 252, 100–107. doi: 10.1016/j.jviromet.2017.11.012
Pérez-Rodríguez, S., García-Aznar, J. M., and Gonzalo-Asensio, J. (2022). Microfluidic devices for studying bacterial taxis, drug testing and biofilm formation. Microb. Biotechnol. 15, 395–414. doi: 10.1111/1751-7915.13775
Perlemoine, P., Marcoux, P. R., Picard, E., Hadji, E., Zelsmann, M., Mugnier, G., et al. (2021). Phage susceptibility testing and infectious titer determination through wide-field lensless monitoring of phage plaque growth. PLoS One 16:e0248917. doi: 10.1371/journal.pone.0248917
Phillips, I., Acar, J., Bergan, T., Degener, J., Baquero, F., and Forsgren, A. (1998). Methods for the determination of susceptibility of bacteria to antimicrobial agents. Terminology. Clin. Microbiol. Infect. 4, 291–296.
Pires, D. P., and Melo, L. D. R. (2018). In vitro activity of bacteriophages against planktonic and biofilm populations assessed by flow cytometry. Methods Mol. Biol. 1693, 33–41. doi: 10.1007/978-1-4939-7395-8_4
Pires, D. P., Melo, L. D. R., and Azeredo, J. (2021). Understanding the complex phage-host interactions in biofilm communities. Annu. Rev. Virol. 8, 73–94. doi: 10.1146/annurev-virology-091919-074222
Pla, M.-L., Oltra, S., Esteban, M.-D., Andreu, S., and Palop, A. (2015). Comparison of primary models to predict microbial growth by the plate count and absorbance methods. Biomed. Res. Int. 2015:365025. doi: 10.1155/2015/365025
Projahn, M., Hammerl, J. A., Dieckmann, R., and Dahouk, S. A. (2020). A proof of principle for the detection of viable brucella spp. in raw milk by qpcr targeting bacteriophages. Microorganisms 8, 1–11. doi: 10.3390/microorganisms8091326
Putzeys, L., Wicke, L., Brandão, A., Boon, M., Pires, D. P., Azeredo, J., et al. (2024). Exploring the transcriptional landscape of phage–host interactions using novel high-throughput approaches. Curr. Opin. Microbiol. 77:102419. doi: 10.1016/j.mib.2023.102419
Rajnovic, D., Muñoz-Berbel, X., and Mas, J. (2019). Fast phage detection and quantification: An optical density-based approach. PLoS One 14:e0216292. doi: 10.1371/journal.pone.0216292
Ralston, D. J., and Baer, B. S. (1963). Inhibitory action of phage K on staphylococcal dehydrogenases. I. Effect on various strains of Staphylococcus aureus, including members of the phage-typing series. J. Bacteriol. 86, 666–672. doi: 10.1128/jb.86.4.666-672.1963
Ramesh, N., Archana, L., Madurantakam Royam, M., Manohar, P., and Eniyan, K. (2019). Effect of various bacteriological media on the plaque morphology of Staphylococcus and Vibrio phages. Access Microbiol. 1:e000036.
Rand, E. A., Quinones-Olvera, N., Jean, K. D. C., Hernandez-Perez, C., Owen, S. V., and Baym, M. (2025). Phage disco: targeted discovery of bacteriophages by co-culture. mSystems 10:e0164424. doi: 10.1128/msystems.01644-24
Reddy, M. S., Reinbold, G. W., and Hammond, E. G. (1982). Simplified, rapid method to measure diameter of bacteriophage plaques. J. Food Prot. 45, 143–144. doi: 10.4315/0362-028X-45.2.143
Rees, P., Summers, H. D., Filby, A., Carpenter, A. E., and Doan, M. (2022). Imaging flow cytometry. Nat. Rev. Methods Primers 2:86. doi: 10.1038/s43586-022-00167-x
Refardt, D. (2012). Real-time quantitative PCR to discriminate and quantify lambdoid bacteriophages of Escherichia coli K-12. Bacteriophage 2, 98–104. doi: 10.4161/bact.20092
Rice, M. M., McCoy, E., and Knight, S. G. (1954). Bacteriophagy of Streptomyces griseus as revealed by phase microscope. Proc. Soc. Exp. Biol. Med. 86, 344–345. doi: 10.3181/00379727-86-21093
Robb, N. C. (2022). Virus morphology: insights from super-resolution fluorescence microscopy. Biochim. Biophys. Acta Mol. basis Dis. 1868:166347. doi: 10.1016/j.bbadis.2022.166347
Rodríguez, R. A., Love, D. C., Stewart, J. R., Tajuba, J., Knee, J., Dickerson, J. W., et al. (2012). Comparison of methods for the detection of coliphages in recreational water at two California, United States beaches. J. Virol. Methods 181, 73–79. doi: 10.1016/j.jviromet.2012.01.013
Roger, A. (1977). Study of the initial parasitic relationship between a virus of the Gourlay group L 1 and the cellular population of Acholeplasma laidlawii. Can. J. Microbiol. 23, 224–229.
Rohde, M. (2011). “Microscopy” in Taxonomy of prokaryotes. eds. F. Rainey and A. Oren, vol. 38 (USA: Academic Press), 61–100.
Rostøl, J. T., Quiles-Puchalt, N., Iturbe-Sanz, P., Lasa, Í., and Penadés, J. R. (2024). Bacteriophages avoid autoimmunity from cognate immune systems as an intrinsic part of their life cycles. Nat. Microbiol. 9, 1312–1324. doi: 10.1038/s41564-024-01661-6
Rudi, K., Moen, B., Drømtorp, S. M., and Holck, A. L. (2005). Use of ethidium monoazide and PCR in combination for quantification of viable and dead cells in complex samples. Appl. Environ. Microbiol. 71, 1018–1024. doi: 10.1128/AEM.71.2.1018-1024.2005
Saad, A. M., Soliman, A. M., Kawasaki, T., Fujie, M., Nariya, H., Shimamoto, T., et al. (2019). Systemic method to isolate large bacteriophages for use in biocontrol of a wide-range of pathogenic bacteria. J. Biosci. Bioeng. 127, 73–78. doi: 10.1016/j.jbiosc.2018.07.001
Sakowski, E. G., Arora-Williams, K., Tian, F., Zayed, A. A., Zablocki, O., Sullivan, M. B., et al. (2021). Interaction dynamics and virus–host range for estuarine actinophages captured by epicPCR. Nat. Microbiol. 6, 630–642. doi: 10.1038/s41564-021-00873-4
Sanchez, B. C., Heckmann, E. R., Green, S. I., Clark, J. R., Kaplan, H. B., Ramig, R. F., et al. (2022). Development of phage cocktails to treat E. coli catheter-associated urinary tract infection and associated biofilms. Front. Microbiol. 13:796132. doi: 10.3389/fmicb.2022.796132
Santos, S. B., Carvalho, C. M., Sillankorva, S., Nicolau, A., Ferreira, E. C., and Azeredo, J. (2009). The use of antibiotics to improve phage detection and enumeration by the double-layer agar technique. BMC Microbiol. 9:148. doi: 10.1186/1471-2180-9-148
Santos, A. J. d. C., Dias, R. S., Silva, J. D., Sousa, M. P., Clarindo, W. R., Silva, C. C. D., et al. (2024). Two marine sulfur-reducing bacteria co-culture is essential for productive infection by a T4-like Escherichia coli-infecting phage. Heliyon 10:e37934. doi: 10.1016/j.heliyon.2024.e37934
Sauvageau, D., Allain, B., and Cooper, D. G. (2010). Using the rate of respiration to monitor events in the infection of Escherichia coli cultures by bacteriophage T4. Biotechnol. Prog. 26, 865–871. doi: 10.1002/btpr.365
Schindelin, J., Arganda-Carreras, I., Frise, E., Kaynig, V., Longair, M., Pietzsch, T., et al. (2012). Fiji: an open-source platform for biological-image analysis. Nat. Methods 9, 676–682. doi: 10.1038/nmeth.2019
Schlesinger, M. (1932). Adsorption of bacteriophages to homologous bacteria. II. Quantitative investigation of adsorption velocity and saturation. Estimation of the particle size of the bacteriophage. Zeitschrift fur Hygenie und Immunitaetsforsch 114, 149–160. doi: 10.1007/BF02176515
Schneider, D. A., and Gourse, R. L. (2004). Relationship between growth rate and ATP concentration in Escherichia coli: a bioassay for available cellular ATP. J. Biol. Chem. 279, 8262–8268. doi: 10.1074/jbc.M311996200
Sechaud, J., and Kellenberger, E. (1956). Early lysis produced by chloroform in bacteria infected by bacteriophage. Ann. Inst. Pasteur (Paris) 90, 102–106.
Serwer, P. (2025). Role of phages in past molecular biology and potentially in future biomedicine. Encyclopedia 5:e5020058. doi: 10.3390/encyclopedia5020058
Sezonov, G., Joseleau-Petit, D., and D’Ari, R. (2007). Escherichia coli physiology in Luria-Bertani broth. J. Bacteriol. 189, 8746–8749. doi: 10.1128/JB.01368-07
Shang, J., and Sun, Y. (2021). Predicting the hosts of prokaryotic viruses using GCN-based semi-supervised learning. BMC Biol. 19:250. doi: 10.1186/s12915-021-01180-4
Sharma, M., Tyagi, J. L., and Poluri, K. M. (2019). Quantifying bacterial cell lysis using GFP based fluorimetric assay. Int. J. Biol. Macromol. 138, 881–889. doi: 10.1016/j.ijbiomac.2019.07.172
Shen, Y., Qian, Q., Ding, L., Qu, W., Zhang, T., Song, M., et al. (2024). High-throughput single-microbe RNA sequencing reveals adaptive state heterogeneity and host-phage activity associations in human gut microbiome. Protein Cell 16, 211–226. doi: 10.1093/procel/pwae027
Silva, M. D., and Melo, L. D. R. (2024). Phage-host interaction analysis using flow cytometry. Methods Mol. Biol. 2734, 133–140. doi: 10.1007/978-1-0716-3523-0_8
Silva, M., Pinto, G., França, A., Azeredo, J., and Melo, L. (2024). Phage SEP1 hijacks Staphylococcus epidermidis stationary cells’ metabolism to replicate. mSystems 9:e00263-24. doi: 10.1128/msystems.00263-24
Simon, L. D., and Anderson, T. F. (1967). The infection of Escherichia coli by T2 and T4 bacteriophages as seen in the electron microscope i. attachment and penetration. Virology 32, 279–297. doi: 10.1016/0042-6822(67)90277-2
Sing, W. D., and Klaenhammer, T. R. (1990). Characteristics of phage abortion conferred in lactococci by the conjugal plasmid pTR2030. Microbiology 136, 1807–1815. doi: 10.1099/00221287-136-9-1807
Sinha, S., Grewal, R. K., and Roy, S. (2018). Modeling bacteria–phage interactions and its implications for phage therapy. Adv. Appl. Microbiol. 103, 103–141. doi: 10.1016/bs.aambs.2018.01.005
Skurnik, M., Alkalay-Oren, S., Boon, M., Clokie, M., Sicheritz-Pontén, T., Dąbrowska, K., et al. (2025). Phage therapy. Nat. Rev. Methods Prim. 5. doi: 10.1038/s43586-024-00377-5
Smith, J. J., and McFeters, G. A. (1997). Mechanisms of INT (2-(4-iodophenyl)-3-(4-nitrophenyl)-5-phenyl tetrazolium chloride), and CTC (5-cyano-2,3-ditolyl tetrazolium chloride) reduction in Escherichia coli K-12. J. Microbiol. Methods 29, 161–175. doi: 10.1016/S0167-7012(97)00036-5
Somerville, G. A., and Proctor, R. A. (2013). Cultivation conditions and the diffusion of oxygen into culture media: the rationale for the flask-to-medium ratio in microbiology. BMC Microbiol. 13:9. doi: 10.1186/1471-2180-13-9
Southern, E. M. (1975). Detection of specific sequences among DNA fragments separated by gel electrophoresis. J. Mol. Biol. 98, 503–517. doi: 10.1016/S0022-2836(75)80083-0
Squirrell, D. J., Price, R. L., and Murphy, M. J. (2002). Rapid and specific detection of bacteria using bioluminescence. Anal. Chim. Acta 457, 109–114. doi: 10.1016/S0003-2670(01)01495-7
Storms, Z. J., Teel, M. R., Mercurio, K., and Sauvageau, D. (2020). The virulence index: a metric for quantitative analysis of phage virulence. PHAGE (New Rochelle, N.Y.) 1, 27–36. doi: 10.1089/phage.2019.0001
Strange, J. E. S., Leekitcharoenphon, P., Møller, F. D., and Aarestrup, F. M. (2021). Metagenomics analysis of bacteriophages and antimicrobial resistance from global urban sewage. Sci. Rep. 11:1600. doi: 10.1038/s41598-021-80990-6
Strathdee, S. A., Hatfull, G. F., Mutalik, V. K., and Schooley, R. T. (2023). Phage therapy: from biological mechanisms to future directions. Cell 186, 17–31. doi: 10.1016/j.cell.2022.11.017
Šuster, K., and Cör, A. (2023). Induction of viable but non-culturable state in clinically relevant staphylococci and their detection with bacteriophage K. Antibiotics 12:311. doi: 10.3390/antibiotics12020311
Tadmor, A. D., Ottesen, E. A., Leadbetter, J. R., and Phillips, R. (2011). Probing individual environmental bacteria for viruses by using microfluidic digital PCR. Science 333, 58–62. doi: 10.1126/science.1200758
Tal, A., Arbel-Goren, R., Costantino, N., Court, D. L., and Stavans, J. (2014). Location of the unique integration site on an Escherichia coli chromosome by bacteriophage lambda DNA in vivo. Proc. Natl. Acad. Sci. USA 111, 7308–7312. doi: 10.1073/pnas.1324066111
Tawakoli, P. N., Al-Ahmad, A., Hoth-Hannig, W., Hannig, M., and Hannig, C. (2013). Comparison of different live/dead stainings for detection and quantification of adherent microorganisms in the initial oral biofilm. Clin. Oral Investig. 17, 841–850. doi: 10.1007/s00784-012-0792-3
Telford, W. G. (2023). Flow cytometry and cell sorting. Front. Med. 10, 1–6. doi: 10.3389/fmed.2023.1287884
Thorne, N., Inglese, J., and Auld, D. S. (2010). Illuminating insights into firefly luciferase and other bioluminescent reporters used in chemical biology. Chem. Biol. 17, 646–657. doi: 10.1016/j.chembiol.2010.05.012
Tian, X., Li, S., Wang, C., Zhang, Y., Feng, X., Yan, Q., et al. (2024). Gut virome-wide association analysis identifies cross-population viral signatures for inflammatory bowel disease. Microbiome 12:130. doi: 10.1186/s40168-024-01832-x
Tkhilaishvili, T., di Luca, M., Abbandonato, G., Maiolo, E. M., Klatt, A. B., Reuter, M., et al. (2018). Real-time assessment of bacteriophage T3-derived antimicrobial activity against planktonic and biofilm-embedded Escherichia coli by isothermal microcalorimetry. Res. Microbiol. 169, 515–521. doi: 10.1016/j.resmic.2018.05.010
Townsend, E. M., Kelly, L., Muscatt, G., Box, J. D., Hargraves, N., Lilley, D., et al. (2021). The human gut phageome: origins and roles in the human gut microbiome. Front. Cell. Infect. Microbiol. 11:643214. doi: 10.3389/fcimb.2021.643214
Trinh, J. T., Shao, Q., Guan, J., and Zeng, L. (2020). Emerging heterogeneous compartments by viruses in single bacterial cells. Nat. Commun. 11:3813. doi: 10.1038/s41467-020-17515-8
Trofimova, E., and Jaschke, P. R. (2021). Plaque size tool: An automated plaque analysis tool for simplifying and standardising bacteriophage plaque morphology measurements. Virology 561, 1–5. doi: 10.1016/j.virol.2021.05.011
Tuma, R. S., Beaudet, M. P., Jin, X., Jones, L. J., Cheung, C. Y., Yue, S., et al. (1999). Characterization of SYBR gold nucleic acid gel stain: a dye optimized for use with 300-nm ultraviolet transilluminators. Anal. Biochem. 268, 278–288. doi: 10.1006/abio.1998.3067
Türe, M., Cebeci, A., Aygür, E., Balcı, F., Çalışkan, N., and Polat, E. K. (2022). Effect of antibiotics and glycerol on improving bacteriophage detection and enumeration. Bull. Eur. Assoc. Fish Pathol. 41:37068. doi: 10.48045/001c.37068
Twort, F. W. (1915). An investigation on the nature of ultra-microscopic viruses. Lancet 186, 1241–1243. doi: 10.1016/S0140-6736(01)20383-3
Unterer, M., Khan Mirzaei, M., and Deng, L. (2023). Targeted single-phage isolation reveals phage-dependent heterogeneous infection dynamics. Microbiol. Spectr. 11:e0514922. doi: 10.1128/spectrum.05149-22
van Charante, F., Holtappels, D., Blasdel, B., and Burrowes, B. (2019). “Isolation of Bacteriophages” in Bacteriophages: Biology, technology, therapy. eds. D. R. Harper, S. T. Abedon, B. H. Burrowes, and M. L. McConville (Cham, Switzerland: Springer International Publishing), 1–32.
van Leeuwenhoek, A. (1798). The Select Works of Antony Van Leeuwenhoek, Containing His Microscopical Discoveries in Many of the Works of Nature. Translated from the Dutch and Latin Editions Published by the Author, by Samuel Hoole. (Henry Fry).
Van Valen, D., Wu, D., Chen, Y.-J., Tuson, H., Wiggins, P., and Phillips, R. (2012). A single-molecule Hershey-chase experiment. Curr. Biol. 22, 1339–1343. doi: 10.1016/j.cub.2012.05.023
Veitch, N. C. (2004). Horseradish peroxidase: a modern view of a classic enzyme. Phytochemistry 65, 249–259. doi: 10.1016/j.phytochem.2003.10.022
Verthé, K., and Verstraete, W. (2006). Use of flow cytometry for analysis of phage-mediated killing of Enterobacter aerogenes. Res. Microbiol. 157, 613–618. doi: 10.1016/j.resmic.2006.02.007
Vincent, F., Sheyn, U., Porat, Z., Schatz, D., and Vardi, A. (2021). Visualizing active viral infection reveals diverse cell fates in synchronized algal bloom demise. Proc. Natl. Acad. Sci. 118:e2021586118. doi: 10.1073/pnas.2021586118
Wagner, P. L., and Waldor, M. K. (2002). Bacteriophage control of bacterial virulence. Infect. Immun. 70, 3985–3993. doi: 10.1128/IAI.70.8.3985-3993.2002
Wang, X., Ding, Z., Yang, Y., Liang, L., Sun, Y., Hou, C., et al. (2024). Viromeflowx: a comprehensive nextflow-based automated workflow for mining viral genomes from metagenomic sequencing data. Microb. Genom. 10:001202. doi: 10.1099/mgen.0.001202
Wang, B., Lin, A. E., Yuan, J., Novak, K. E., Koch, M. D., Wingreen, N. S., et al. (2023). Single-cell massively-parallel multiplexed microbial sequencing (M3-seq) identifies rare bacterial populations and profiles phage infection. Nat. Microbiol. 8, 1846–1862. doi: 10.1038/s41564-023-01462-3
Wang, R. H., Yang, S., Liu, Z., Zhang, Y., Wang, X., Xu, Z., et al. (2024). Phagescope: a well-annotated bacteriophage database with automatic analyses and visualizations. Nucleic Acids Res. 52, 756–761. doi: 10.1093/nar/gkad979
Weinbauer, M. G. (2004). Ecology of prokaryotic viruses. FEMS Microbiol. Rev. 28, 127–181. doi: 10.1016/j.femsre.2003.08.001
Werquin, M., Defives, C., Hassani, L., and Andriantsimiavona-Otonia, M. (1984). Large scale preparation of Rhizobium meliloti bacteriophages by fermenter culture. J. Virol. Methods 8, 155–160. doi: 10.1016/0166-0934(84)90049-1
Whitesides, G. M. (2006). The origins and the future of microfluidics. Nature 442, 368–373. doi: 10.1038/nature05058
Wilhelm, S. W., and Suttle, C. A. (1999). Viruses and nutrient cycles in the sea: viruses play critical roles in the structure and function of aquatic food webs. Bioscience 49, 781–788. doi: 10.2307/1313569
Woods, D. R. (1976). Bacteriophage growth on stationary phase Achromobacter cells. J. Gen. Virol. 32, 45–50. doi: 10.1099/0022-1317-32-1-45
Wu, R., Davison, M. R., Nelson, W. C., Smith, M. L., Lipton, M. S., Jansson, J. K., et al. (2023). Hi-C metagenome sequencing reveals soil phage–host interactions. Nat. Commun. 14:7666. doi: 10.1038/s41467-023-42967-z
Wu, M., Li, W., Christie, G., Setlow, P., and Li, Y. (2021). Characterization of heterogeneity and dynamics of lysis of single Bacillus subtilis cells upon prophage induction during spore germination, outgrowth, and vegetative growth using Raman tweezers and live-cell phase-contrast microscopy. Anal. Chem. 93, 1443–1450. doi: 10.1021/acs.analchem.0c03341
Xu, H., Bao, X., Hong, W., Wang, A., Wang, K., Dong, H., et al. (2021). Biological characterization and evolution of bacteriophage T7-△holin during the serial passage process. Front. Microbiol. 12:705310. doi: 10.3389/fmicb.2021.705310
Yan, M., Pratama, A. A., Somasundaram, S., Li, Z., Jiang, Y., Sullivan, M. B., et al. (2023). Interrogating the viral dark matter of the rumen ecosystem with a global virome database. Nat. Commun. 14:5254. doi: 10.1038/s41467-023-41075-2
Yao, Z., and Carballido-López, R. (2014). Fluorescence imaging for bacterial cell biology: from localization to dynamics, from ensembles to single molecules. Ann. Rev. Microbiol. 68, 459–476. doi: 10.1146/annurev-micro-091213-113034
Yin, J. (1991). A quantifiable phenotype of viral propagation. Biochem. Biophys. Res. Commun. 174, 1009–1014. doi: 10.1016/0006-291X(91)91519-I
Yin, J. (2008). “Impact of spatial structure on phage population growth” in Bacteriophage ecology: Population growth, evolution, and impact of bacterial viruses. ed. S. T. E. Abedon (Cambridge, UK: Cambridge University Press), 94–113.
Yoon, S. A., Park, S. Y., Cha, Y., Gopala, L., and Lee, M. H. (2021). Strategies of detecting bacteria using fluorescence-based dyes. Front. Chem. 9:743923. doi: 10.3389/fchem.2021.743923
Young, R., and Wang, I. (2005). “Phage lysis” in The Bacteriophages: Second edition. eds. R. Calendar and S. T. Abedon (Oxford, UK: Oxford University Press).
Yuan, Y., and Gao, M. (2017). Jumbo bacteriophages: an overview. Front. Microbiol. 8:403. doi: 10.3389/fmicb.2017.00403
Zemb, O., Manefield, M., Thomas, F., and Jacquet, S. (2013). Phage adsorption to bacteria in the light of the electrostatics: a case study using E. coli, T2 and flow cytometry. J. Virol. Methods 189, 283–289. doi: 10.1016/j.jviromet.2013.02.007
Zeng, S., Almeida, A., Li, S., Ying, J., Wang, H., Qu, Y., et al. (2024). A metagenomic catalog of the early-life human gut virome. Nat. Commun. 15:1864. doi: 10.1038/s41467-024-45793-z
Zeng, L., Skinner, S. O., Zong, C., Sippy, J., Feiss, M., and Golding, I. (2010). Decision making at a subcellular level determines the outcome of bacteriophage infection. Cell 141, 682–691. doi: 10.1016/j.cell.2010.03.034
Zernike, F. (1935). Das Phasenkontrastverfahren bei der mikroskopischen Beobachtung. Z. Tech. Phys. 16, 454–457. doi: 10.1007/BF01476460
Zhang, Y., Mao, M., Zhang, R., Liao, Y.-T., and Wu, V. C. H. (2024). DeepPL: a deep-learning-based tool for the prediction of bacteriophage lifecycle. PLoS Comput. Biol. 20:e1012525. doi: 10.1371/journal.pcbi.1012525
Zhang, J., Ning, H., Lin, H., She, J., Wang, L., Jing, Y., et al. (2022). Expansion of the plaquing host range and improvement of the absorption rate of a T5-like salmonella phage by altering the long tail fibers. Appl. Environ. Microbiol. 88:e0089522. doi: 10.1128/aem.00895-22
Zhang, K., Pankratz, K., Duong, H., Theodore, M., Guan, J., Jiang, A., et al. (2021). Interactions between viral regulatory proteins ensure an MOI-independent probability of lysogeny during infection by bacteriophage P1. MBio 12:e0101321. doi: 10.1128/mBio.01013-21
Zhang, Y., and Wang, R. (2023). The human gut phageome: composition, development, and alterations in disease. Front. Microbiol. 14:1213625. doi: 10.3389/fmicb.2023.1213625
Ziedaite, G., Daugelavicius, R., Bamford, J. K. H., and Bamford, D. H. (2005). The Holin protein of bacteriophage PRD1 forms a pore for small-molecule and endolysin translocation. J. Bacteriol. 187, 5397–5405. doi: 10.1128/JB.187.15.5397-5405.2005
Glossary
Bacterial lawn - A confluent, homogeneous layer of bacteria on agar.
Burst size (Kropinski, 2018) - The number of infectious viral particles synthesized by a single infected cell.
Colony-Forming Units (CFU) - A quantitative measure of viable, culturable bacteria in a sample.
Latent period (Kropinski, 2018) - Time from phage adsorption to host lysis.
Lysogenic Cycle (Weinbauer, 2004) - A viral reproductive cycle in which the phage genome integrates into the host cell’s chromosome as a prophage and replicates passively along with the host DNA.
Lytic Cycle (Weinbauer, 2004) - Active phage propagation state ending by cell lysis and the release of new viral particles.
Nonhost (resistant) bacteria - Strains insensitive to infection by a specific phage.
Multiplicity of Infection (MOI) (Abedon, 2016) - The ratio of infecting phage particles to susceptible bacteria.
Phage-mediated bacterial lysis (Young and Wang, 2005) - Bacterial cell rupture followed by the release of phage progeny.
Plaque-Forming Unit (PFU) (Kropinski, 2018) - A quantitative measure of viable, plaque-forming phages in a sample; corresponds to an infectious phage particle that can form a plaque on bacterial lawn.
Prophage (Bruce et al., 2021) - Phage DNA present within the infected host in the state of lysogeny. Prophages can exist either integrated into the host genome or as plasmids.
Susceptible or indicator bacteria (Abedon and Yin, 2009) - Bacterial strains permitting productive phage replication.
Soft agar (Adams, 1959) - A semi-solid agar medium (agar percentage: 0.3–0.7%) that facilitates phage diffusion and plaque formation.
Temperate Phages (Gandon, 2016) - Bacteriophages that can alternate between the lytic and lysogenic life cycles.
Viral adsorption (Kropinski, 2009) - Phage attachment to bacterial receptors, followed by the injection of viral DNA into the bacterium.
Viral infectivity (Black, 1993) - The ability of a virus to enter cells and replicate productively.
Viral plaques (Abedon and Yin, 2009) - Visible, clear zones in a bacterial lawn caused by phage-mediated lysis. Each plaque typically arises from a single infectious particle.
Virion (Adams, 1959) - A viral particle consisting of genetic material (either DNA or RNA) and a protein coat.
Keywords: bacteriophages, viral infection, bacteriophage plaques, lytic cycle, single cell methods
Citation: Panteleev V, Kulbachinskiy A and Gelfenbein D (2025) Evaluating phage lytic activity: from plaque assays to single-cell technologies. Front. Microbiol. 16:1659093. doi: 10.3389/fmicb.2025.1659093
Edited by:
Gary Antonio Toranzos, University of Puerto Rico, Puerto RicoReviewed by:
Mariana Alves Elois, University of Burgos, SpainMohammed F. Hamdi, Al Maaref University College, Iraq
Copyright © 2025 Panteleev, Kulbachinskiy and Gelfenbein. This is an open-access article distributed under the terms of the Creative Commons Attribution License (CC BY). The use, distribution or reproduction in other forums is permitted, provided the original author(s) and the copyright owner(s) are credited and that the original publication in this journal is cited, in accordance with accepted academic practice. No use, distribution or reproduction is permitted which does not comply with these terms.
*Correspondence: Daria Gelfenbein, ZXNfZGFyQGluYm94LnJ1