 Pelumi M. Oladipo1*
 Robert J. Tibbetts2
 Audun Sivertsen3Justin M. Barger2Torbjørn S. Bruvold3Alemu Fite4Matthew Sims5Marcus Zervos6Ali Jomaa7
 Jeffrey L. Ram1,7
- 1Department of Biochemistry, Microbiology, and Immunology, Wayne State University, Detroit, MI, United States
- 2Department of Microbiology, Henry Ford Health System, Detroit, MI, United States
- 3Department of Microbiology, Haukeland Hospital, Bergen, Norway
- 4Microbiology Laboratory, Corewell Health, Royal Oak, MI, United States
- 5William Beaumont University Hospital, Corewell Health, Royal Oak, MI, United States
- 6Department of Infectious Diseases, Henry Ford Health System, Detroit, MI, United States
- 7Department of Physiology, Wayne State University, Detroit, MI, United States
Background: Genomic sequences of E. marmotae and E. coli differ by 10%. Discovered as an environmental “cryptic clade” of Escherichia, E. marmotae also occurs in human infections. Microbiological and MALDI-TOF-MS methods frequently misidentify E. marmotae as E.coli. Our goal was to develop methods that reliably distinguish E. marmotae from E. coli to improve therapeutic decisions and treatments.
Methods: A Taqman PCR method was developed to distinguish E. marmotae from E. coli based on genomic sequences of uidA, uidB, and a positive control targeting adk in E. marmotae and E. coli. MALDI-TOF-MS spectra were obtained for environmental and clinical isolates using a bioMérieux VITEK MALDI-TOF-MS system.
Results: UidA- and uidB species-specific PCR amplified DNA from E. marmotae with 100% specificity, and not from E. coli or other Escherichia species. The Biomérieux VITEK MALDI-TOF-MS consistently misidentified E. marmotae as E. coli, with median IVD confidence scores for both E. marmotae and E. coli of 99.9%; however, RUO scores for E. marmotae (median 0%) were significantly lower (P < 0.0001) than for E. coli (median = 87.4%). The spectral peak between m/z 7,250 to 7,280 consistently occurred between 7,260 and 7,268 in E. marmotae and only between 7,268 and 7,280 in E. coli, with no overlap (p < 0.001). Application of these spectral criteria to 176 clinical isolates revealed the first identification of a E. marmotae isolate from a human infection in North America. The isolate had originally been diagnosed as E. coli based on a 99.1% IVD confidence score. This first North American clinical isolate was confirmed as E. marmotae by Taqman-PCR and whole genome sequencing. This isolate had numerous antibiotic resistance gene markers and unlike most clinical E. coli, this E. marmotae isolate lacked motility at 37°C.
Conclusion: Clinical tests based on these methods of differentiating E. marmotae and E. coli may assist in determining the prevalence of this emerging pathogen and making therapeutic decisions.
Introduction
Escherichia marmotae was originally discovered as a “cryptic clade” of Escherichia, having identical metabolic and colony morphology profiles on standard microbiological tests but having an average pairwise difference from E. coli over its whole genome of about 10% (Walk, 2015; Walk et al., 2009). Although originally discovered in animal feces (e.g., marmots, Liu et al., 2015), raccoons (Ram et al., 2007), and birds (Walk et al., 2009) and environmental samples (Walk et al., 2009), E. marmotae has now been identified in clinical cases as serious as those caused by E. coli. Clinical isolates of E. marmotae have been identified from human cases of septicemia (Clermont et al., 2011), urinary tract infection (Sinha et al., 2024), and thoracic spondylodiscitis, pyelonephritis, acute sepsis of unknown origin, and postoperative sepsis (Sivertsen et al., 2022). However, within these reports, E. marmotae were always initially misclassified as E. coli by routine clinical tests. Techniques that distinguish these two species are often not applied to clinical isolates once the tentative diagnosis as E. coli has been made. Therefore, we have only limited knowledge about the prevalence of E. marmotae in human infections, its relative risk of causing serious disease, and whether different treatments than are currently used for E. coli infections may be more effectively used on E. marmotae infections. Rapid, convenient methods of distinguishing E. marmotae from E. coli clinically are needed to determine its prevalence and to guide its treatment.
The identification of E. marmotae by routine clinical methods has proven challenging. One previous approach to identifying E. marmotae has been to use a set of PCR amplifications followed by agarose gel electrophoresis to identify PCR product sizes (Clermont et al., 2011). Application of this method to 1,081 strains from septicemic patients that were originally classified as E. coli during the COLIBAFI study in France (Lefort et al., 2011) discovered that two were actually E. marmotae (Clermont et al., 2011).
Matrix-Assisted Laser Desorption Ionization-Time of Flight Mass Spectrometry (MALDI-TOF MS) has become a frequently used tool for identifying bacterial isolates (Florio et al., 2018); however, its use for identification of E. marmotae has been problematic as the software for a long time contained no E. marmotae spectra. The first E. marmotae spectrum in the Bruker database was included in 2021 (database version L2020 9607MSP), but did not reliably distinguish E. marmotae from E. coli, rarely achieving an identity score >2.0, as required for the most confident identification in the Bruker system. Later versions have included additional spectra that align better with typical E. marmotae, often achieving identity scores >2.2 (Sivertsen et al., 2022). In another laboratory (Sinha et al., 2024), an isolate that was finally identified as E. marmotae by 16S RNA gene sequencing was initially classified as E. coli with 99% probability by the colorimetric and substrate-specific tests with the VITEK 2 XL GNI ID card system (bioMérieux, Australia). A subsequent test on a Bruker MALDI-TOF-MS using a database that included E. marmotae reported a confidence score of 2.39 for E. marmotae (Sinha et al., 2024).
In this paper, we describe two methods, potentially applicable in a clinical laboratory, for reliably distinguishing E. marmotae from E. coli. The first is a Taqman PCR method based on sequence differences between E. marmotae and E. coli. In the second method, we identify reliable spectral differences between E. marmotae and E. coli on a bioMérieux VITEK MALDI-TOF-MS system, as all previous studies have reported analysis of E. marmotae using the Bruker system. In preliminary studies to the results shown in this paper, we found that these VITEK systems classify most isolates of E. marmotae as E. coli (i.e., they report In Vitro Diagnostic (IVD) confidence scores for E. coli >99%) or, for a minority of E. marmotae isolates, fail to identify them at all. In this paper, we identify a specific peak in the MALDI-TOF-MS spectra that is exclusively and reliably associated with E. marmotae that enabled the discovery of the first E. marmotae strain isolated in North America.
Materials and methods
Bacterial isolates
The Ram laboratory previously isolated six strains of E. marmotae from aquatic environments and raccoons (Ram et al., 2007) that were subsequently confirmed as E. marmotae by whole genome sequencing (Oladipo et al., 2024). These isolates were archived at −80 ± 2 °C in glycerol stocks (in Colilert 18 (IDEXX US) media with 15% glycerol) and have reliably yielded viable subcultures. Seventeen additional E. marmotae isolates, designated with the “TW” prefix, were retrieved from the Thomas Whittam strain collection at Michigan State University. Five of the TW strains were originally derived from the same E. marmotae isolates produced by the Ram lab and other environmental sources (Walk et al., 2009). Therefore, comparisons between Ram lab and TW strains serve as internal replicates, enabling assessment of reproducibility in measurements from independently maintained stocks of the same strain.
In addition to these isolates, the present study also investigated other strains (i) E. marmotae isolated by others from human clinical sources (Sivertsen et al., 2022), and additional isolates of E. marmotae; (ii) representative isolates of other cryptic clades and Escherichia species from the microbial archives of Michigan State University, described originally by Mire et al. (2022) and Walk et al. (2009); and (iii) 176 strains of putative E. coli that were originally identified as such by MALDI-TOF-MS (bioMérieux, France) at Henry Ford Health.
Table 1 shows the metadata of the strains of E. marmotae and E.coli that are analyzed in the present study, except for the putative E. coli strains from Henry Ford Health, which are described in further detail in the methods section on MALDI-TOF-MS.
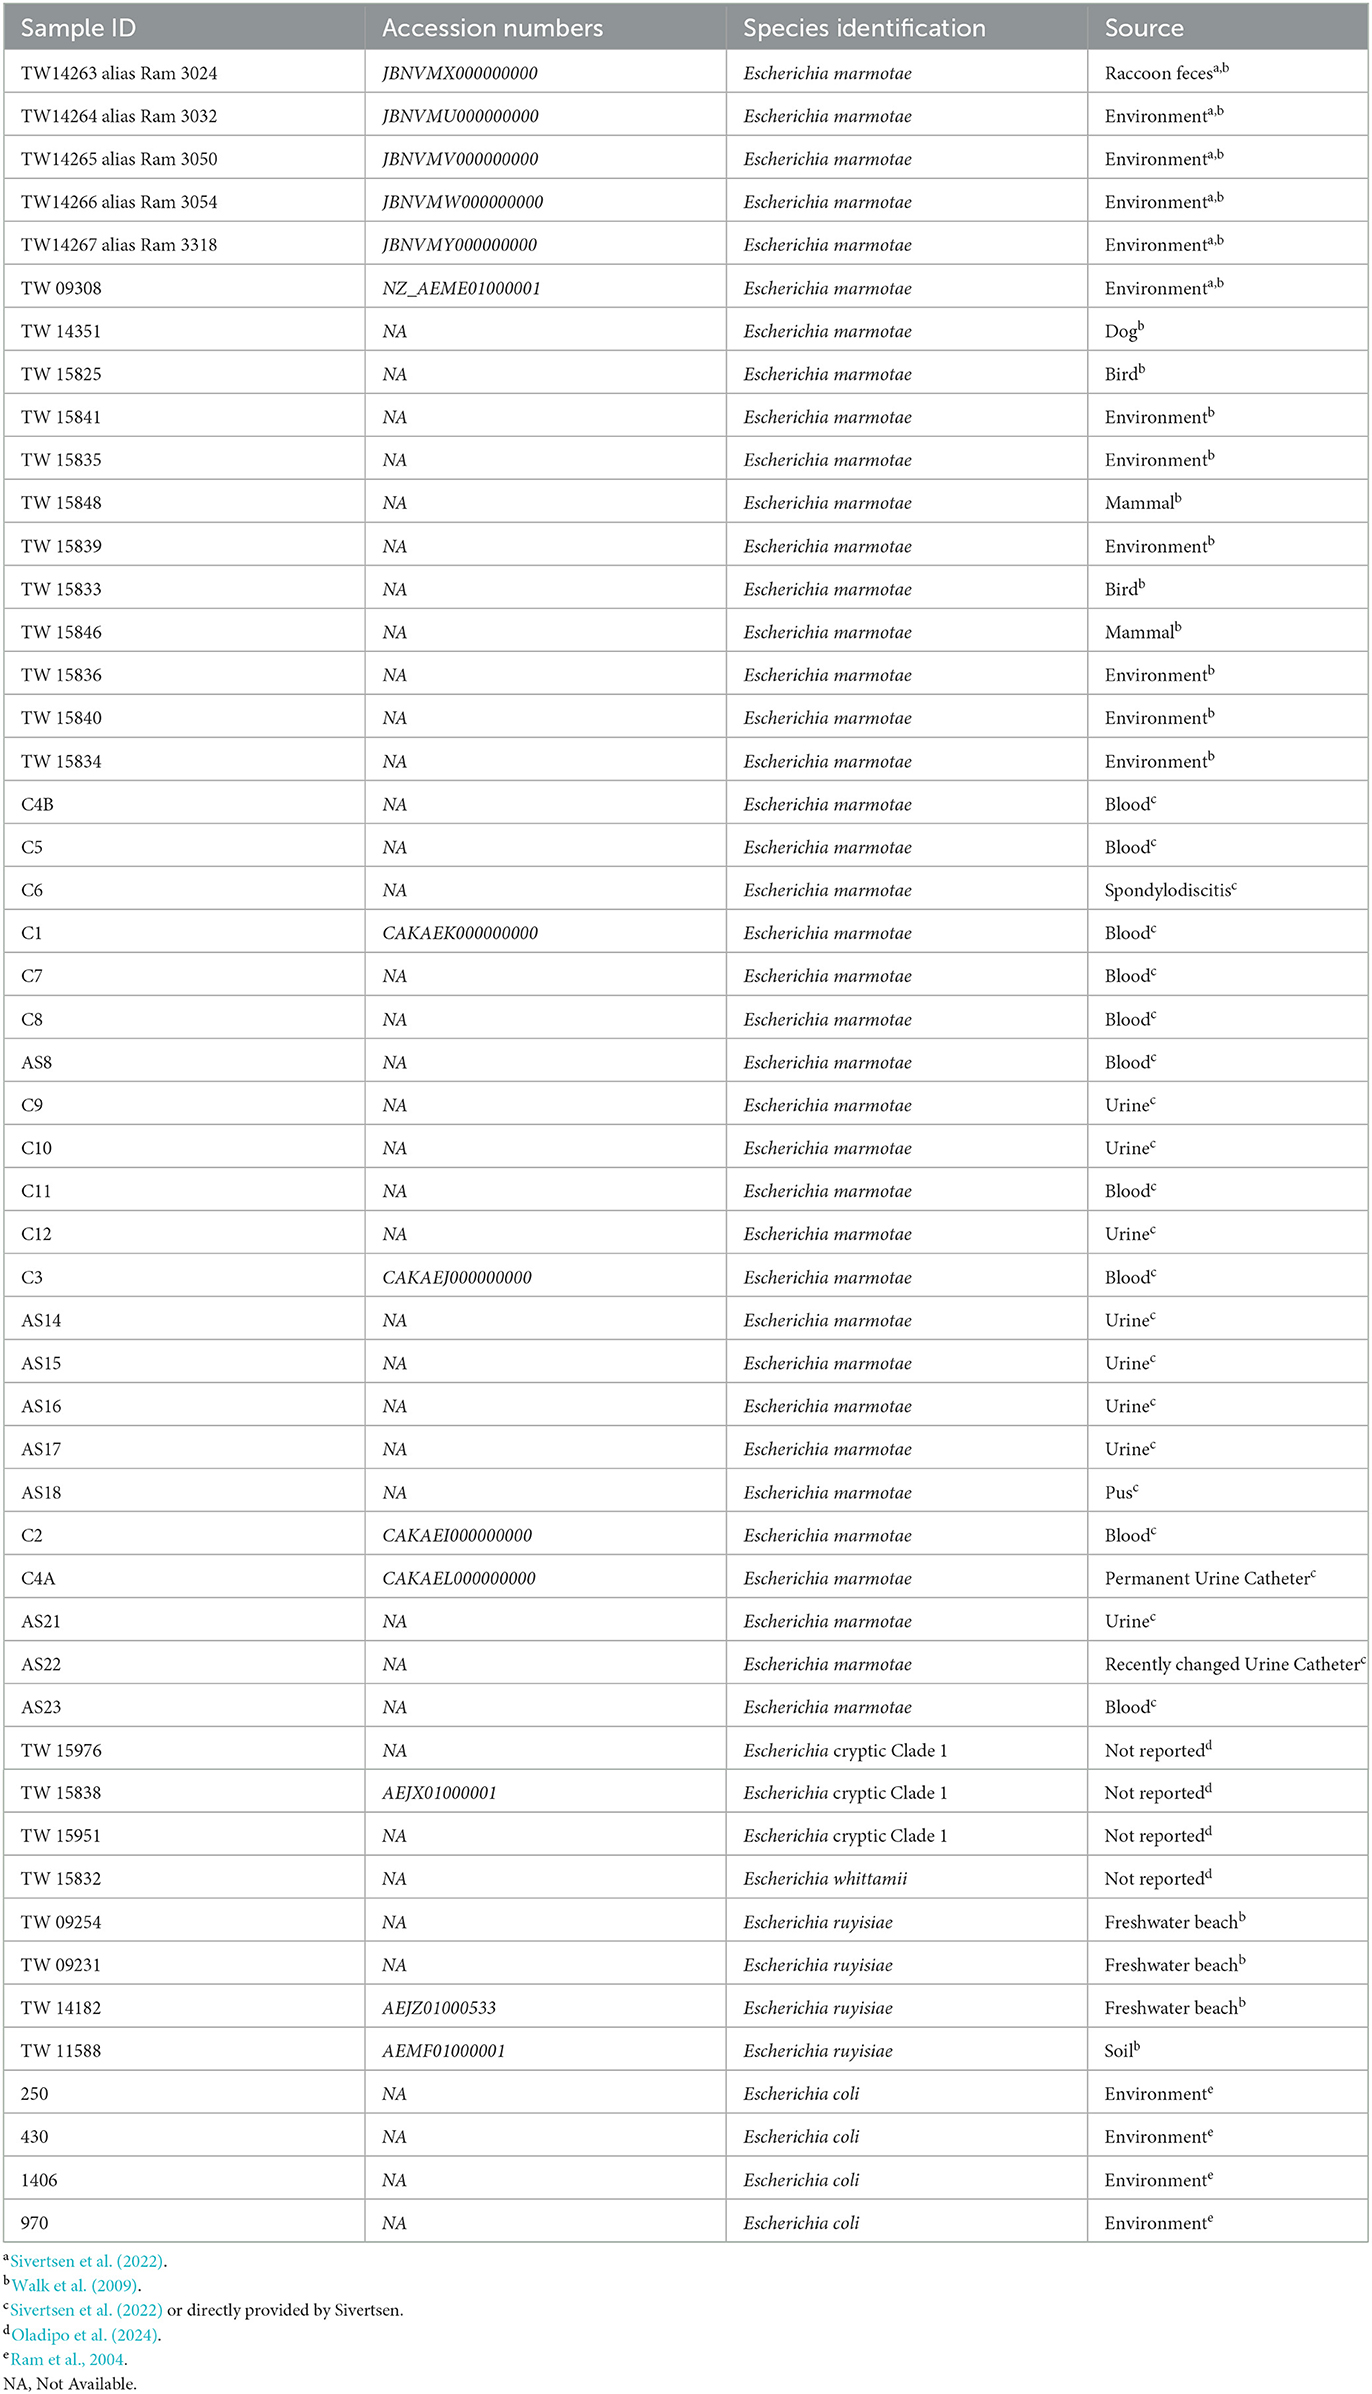
Table 1. Sample labels (Sample ID), species, sources of isolates, and previous publications (if any) in which the isolate was previously reported or used.
Primers and Taqman probe design
Ram lab strains (Ram et al., 2007) whose whole genome sequences were reported by Oladipo et al. (2024) were used to find suitable assay targets. The genes uidA and uidB, which encode for beta-glucuronidase and the glucuronide carrier protein, respectively, and have both conserved and variable regions among various Escherichia species, were chosen for designing primers and Taqman probes for detecting E. marmotae and E. coli. Studies of the variability of sequences of uidA among environmental and fecal isolates (Ram et al., 2004, 2007) had previously led to the discovery of phenotypically similar strains of E. coli and the strain subsequently identified as E. marmotae. The genes exhibit >8% mismatches in nucleotide identity between E. marmotae and E.coli. Geneious Prime software (version 2024.0, Dotmatics) was used to design forward and reverse primers, and a Taqman probe targeting the mismatch region specific to E. marmotae, following best practices for specificity and efficiency in amplification (Untergasser et al., 2012; Ye et al., 2012).
We also tested E.coli specific lipB primers, as previously described by Moinet et al. (2024) across all 176 Henry Ford Health clinical isolates (Supplementary Table S3) and 35 representative strains from environmental and clinical E. marmotae, and other Escherichia strains. In addition, we used universal primers targeting the adenylate kinase (adk) gene (Walk et al., 2009) and designed a probe conserved in all Escherichia species as a normalization standard, enabling amplification of both E. marmotae and E.coli. Sequences of the primers and probes are provided in Table 2. Specificity of the E. marmotae-primers and probes in Table 2 was studied by in silico analysis using PubMLST, to compare them against E. coli strains and other Escherichia genomes available in GenBank. A list of strains used for the in silico analysis are provided in Supplementary Table S4. Primers and probes were synthesized by Integrated DNA Technologies (IDT).
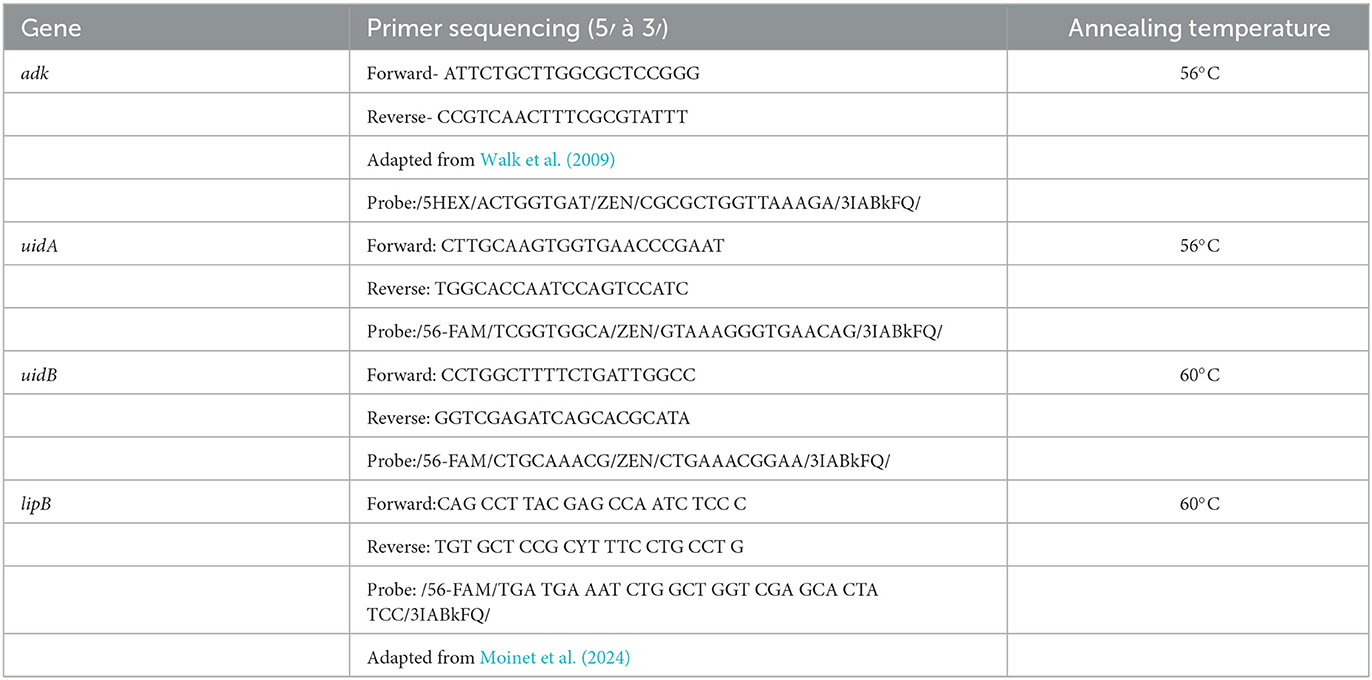
Table 2. Primers and probes used in the analysis.
Quantitative PCR procedure
Single colonies were picked using 200 μL pipet tips and suspended in 300 μL of nuclease-free water. The qPCR was performed on a Bio-Rad CFX 96 Touch Real-time PCR detection system with Bio-Rad CFX manager software version 3.1. The optimal annealing temperature was determined by performing a temperature gradient (55 °−65 °C) within a single run using DNA samples of E. marmotae and E.coli. The optimized cycling parameters were 95 °C for 5 min; 40 cycles of 95 °C for 30 s, annealing temperature as described in Table 2, and 72 °C for 40 s; then hold at 4 °C. The amplification was performed in duplicate in 22 μL, containing 5.5 μL of SsoAdvanced Universal Probes Supermix (Bio-Rad), 3.3 μL each of uidA, uidB or adk probe and primers stock solution (250 nM final concentration for each probe and 900 nM final concentration for each primer), 1 μL of sample, and nuclease free water to a total volume of 22 μL. The reaction was run in duplex for adk and uidA targets, while the amplification of uidB was performed in a separate reaction.
MALDI-TOF-MS
MALDI-TOF-MS (bioMérieux, France) spectra were obtained for the 39 Strains of E. marmotae and 12 other Escherichia isolates listed in Table 1. These spectra were also compared to MALDI-TOF-MS spectra of 176 anonymized clinical isolates that had been identified as E. coli in routine tests in the microbiology laboratory at Henry Ford Health. Cultures were incubated on Trypticase Soy Agar + 5% sheep blood (Remel, USA) at 35 °C ± 2 °C for 16–24 h. Colonies were picked and placed in a single well of a barcode-labeled VITEK MS-DS target slide (bioMérieux, France) using a VITEK Pick-Me pen and nibs (bioMérieux, France). Then the colony was covered with 1 μL of VITEK MS-CHCA Alpha-cyano-4-hydroxy-cinnamic acid (bioMérieux, France) and air-dried. All of the Henry Ford Health isolates used in this study were identified as E. coli by MALDI-TOF-MS using the VITEK MS instrument (bioMérieux VITEK MS Software version 3.2.0) by the in vitro diagnostic (IVD) database with confidence scores of 99% and above (usually >99.9%); in rare instances, the IVD result for an E. marmotae strain was reported as “no identification.” We also recorded the percent confidence scores provided by VITEK Research Use Only (RUO) database. Images of the spectra, including the m/z values of several of the peaks identified by the VITEK software, were captured by photographing the screen image of the spectra for each of these isolates, as illustrated in the results, as direct downloading of the image was disabled in this version of the software.
Statistical analysis
The m/z values of the peaks of each strain of E. marmotae and E. coli were analyzed to compare the statistical significance of their median or average positions and ranges. Statistical analysis was performed using GraphPad Prism, employing descriptive statistics (medians, averages, variance, ranges), parametric and non-parametric and mixed methods comparisons where data were not normally distributed as determined by a Shapiro-Wilks test, and other statistical tests (e.g., outlier tests), as described with the results. Alpha levels for statistical significance were 0.05, except where Bonferroni-corrected alpha levels were used where indicated in Results.
Whole genome sequencing and data analyses
As will be described, one isolate among 176 clinical E. coli samples from Henry Hord Health was reclassified as a potential E. marmotae based on MALDI-TOF-MS findings, and this identification was further confirmed by qPCR and whole genome sequencing (WGS).
For WGS, E. marmotae HFH1 was streaked on LB (Luria Bertani) Agar (Fisher bioreagents) and revived overnight at 37 °C. One colony was picked and grown in LB Broth (37 °C, overnight). Genomic DNA extraction utilized a DNeasy Blood & Tissue kit (Qiagen) according to the manufacturer's instructions. Sequencing was performed on an Illumina NovaSeq 6000 Sequencer by SeqCenter in Pittsburgh, PA USA. De novo assembly of short reads was performed using Unicycler 0.5.0 (Wick et al., 2017). Assembly statistics were recorded with QUAST 5.2.0 (Gurevich et al., 2013), which measures the quality and completeness of the genome assembly. Genome annotation was performed using Prokka v1.14.6, a prokaryotic genome annotation software tool (Seemann, 2014).
Genome analysis was performed with ABRIcate version 1.01 (https://github.com/tseeman/abricate). We identified antimicrobial resistance genes using the CARD database (Alcock et al., 2019), virulence genes using the E. coli Virulence Factor Database (Chen, 2004), serotypes using SerotypeFinder (Joensen et al., 2015) and the presence of plasmids using PlasmidFinder (Carattoli et al., 2014).
Motility assay
Bacterial motility of E. marmotae HFH1 was measured in semi-solid (0.25% agar) plates containing LB broth. The strain was grown in LB broth overnight at 37 °C with shaking at 180 rpm. Cultures were adjusted to OD600 = 0.06–0.1. A sterile stab was used to inoculate the culture into the center of the semi-solid agar plate (100 mm x 15 mm). Plates were incubated at 37 °C for 18–24 h. If a bacterial spread diameter was < 0.5 cm, the strain was categorized as “non-motile”.
Results
PCR identification
In silico analysis to compare the primers and probes in Table 2 against E. coli strains and other Escherichia genomes available in GenBank (Supplementary Table S4) showed that the forward primer differed from all E.coli and other cryptic Escherichia clades by four bases, the reverse primer differed by two bases, and the probe differed by 3 bases, suggesting that the design would be completely specific to E. marmotae. Representative qPCR results illustrated in Figure 1 demonstrate the specificity of the uidA and uidB primers and probes targeting E. marmotae, and the efficacy of the adk primers and probe as a positive control amplification of all Escherichia. Supplementary Table S1 summarizes this experimental validation as tested on 27 E. marmotae strains, 4 environmental E. coli strains, and 3 strains from other cryptic clades. Amplification of uidA and uidB was also negative on all clinical E. coli isolates tested (n = 175). The uidA and uidB primers and probes amplified target DNA exclusively from E. marmotae with 100% specificity, while the adk primers and probe amplified DNA from all Escherichia strains tested. Sanger DNA sequencing of the PCR products from a subset of these amplifications confirmed the correct amplification targets. The qPCR assays were able to detect E. marmotae when isolate suspensions in 1 mL of nuclease-free water were diluted 1,000-fold.
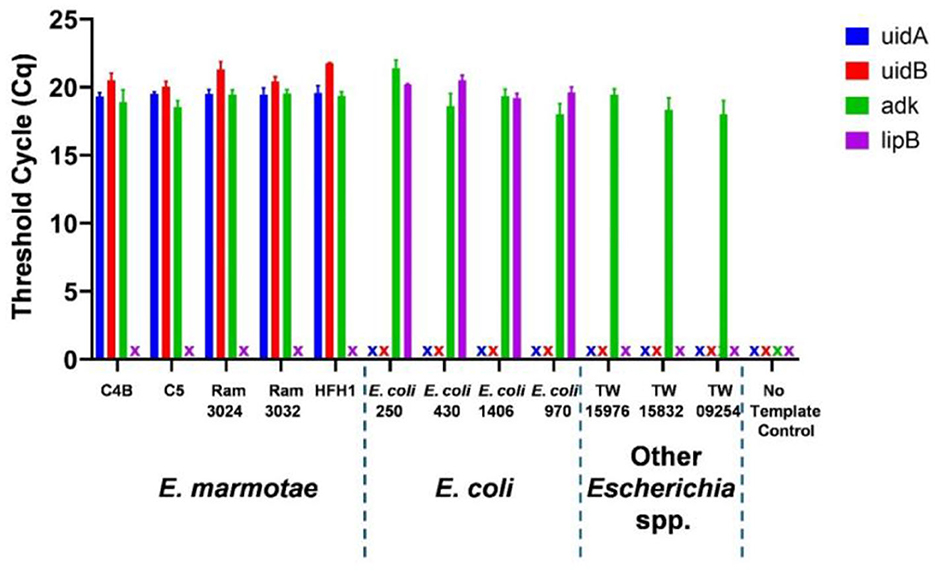
Figure 1. Taqman PCR identification of E. marmotae by species-specific primers and probes for genes uidA (blue), uidB (red), lipB (purple) and positive control amplification by an all Escherichia adk-targeted primer-probe. The “X” symbol indicates that no amplification was detected within 30 cycles. Bars show the average Cq threshold cycle number with error bars indicating the standard deviation of triplicate assays for a representative set of isolates of E. marmotae (C4B, C5, RAM 3024, RAM 3032 and HFH1), E. coli, other Escherichia clades, and a no template control.
MALDI-TOF-MS
IVD and RUO MALDI-TOF-MS scores were determined for 176 putative E. coli clinical isolates from Henry Ford Health and for isolates of E. marmotae and other Escherichia listed in Table 1 that were submitted to the Henry Ford Health microbiology laboratory. The Henry Ford Health E. coli isolates had average IVD confidence scores of 99.9% (no variation was reported) and RUO scores in the range of 0% to 99.9% (median = 87.4%). Of all those putative E. coli that were tested by our E. marmotae/E. coli qPCR test and an E. coli-specific test by Moinet et al. (2024), 175 isolates were confirmed as E. coli, but one isolate, which had an IVD Score of 99.1% and RUO = 0%, proved to be E. marmotae, as described further below. Similarly, as shown in Supplementary Table S2, four environmental E. coli isolates had IVD E. coli confidence scores of 99.9% and RUO scores ranging from 93.9% to 99.9% (median = 98.7%). By comparison, out of 39 E. marmotae strains, 36 isolates had MALDI-TOF-MS IVD scores for “E. coli” ranging from 98.3% to 99.9% (median = 99.9%) while 3 isolates were reported as “NO ID.” The RUO scores for the 39 E. marmotae ranged from 0% to 84.2% (median = 0%), significantly different from the RUO scores of E. coli (p < 0.0001; Mann-Whitney U test). Other Escherichia cryptic clades had IVD scores of 99.9% and RUO scores overlapping both the E. coli and E. marmotae scores (range 0%−99.9%; median: 82.3%, p < 0.0001, significantly higher than for E. marmotae).
Although the RUO scores of E. marmotae isolates indicate that significant differences from the spectra of E. coli exist, the RUO scores alone do not provide an absolute identification of E. marmotae since these scores overlap other Escherichia clades and even some rare variants of E. coli. However, by analyzing details of the mass spectra peaks provided by the “plus” version of the VITEK software, we determined that a peak between 7,260 and 7,268 daltons m/z was specific to E. marmotae; the comparable peak in E. coli was usually located between 7,270 and 7,285 daltons, and never in the range of 7,260–7,268. This is shown in representative spectra from E. marmotae and E. coli, illustrated in Figure 2, in which E. marmotae has a peak at m/z of 7263.837 daltons in a spectrum from a clinical sample and 7260.751 daltons in a spectrum from an environmental isolate. The comparable peak in E. coli has an m/z peak at ~7,274 daltons in both environmental and clinical isolates.
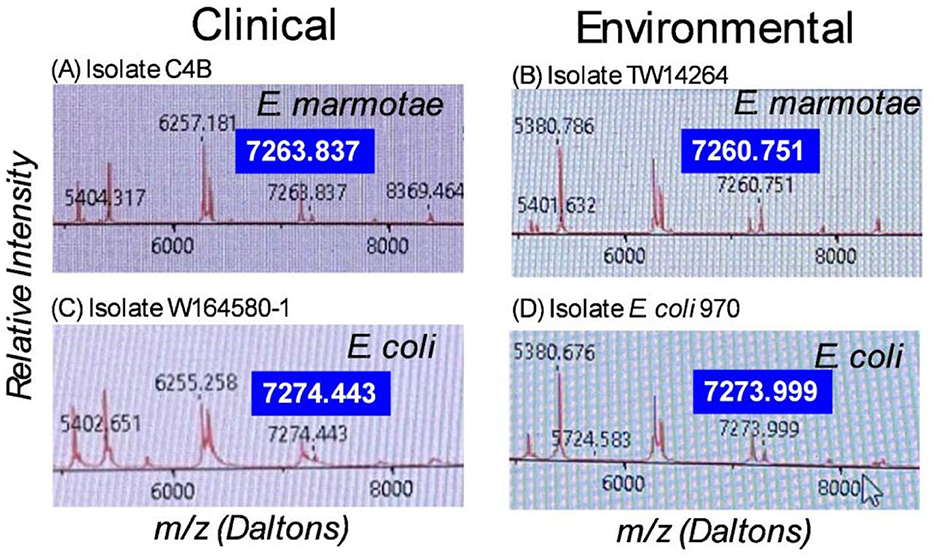
Figure 2. MALDI-TOF-MS spectra for (A). E. marmotae C4B (clinical), (B). E. marmotae TW14264 (environmental), (C). E. coli W164580-1 (clinical), and (D). E. coli 970 (environmental), in the range of 5,200 to 8,800 daltons, highlighting the species-specific peak that usually occurs in the range of 7,260-7,268 for E. marmotae and between 7,268 and 7,285 in E. coli. The specific peak is highlighted in larger font for each spectrum for clarity. These representative spectra have m/z for the species-specific peak close to the median peak locations as summarized in Figure 3, for clinical and environmental strains.
Figure 3 summarizes these data statistically, comparing the m/z values both by species (E. marmotae vs. E. coli) and by whether the isolate was from a clinical or an environmental source. Since there was no overlap between E. marmotae and E. coli in the m/z values for the peak occurring in the range of 7,250–7,280 daltons, it is not surprising that the m/z for all E. marmotae differs significantly from all E. coli (unpaired t-test, p < 0.0001). Environmental and clinical strains among each species had overlapping ranges for this peak within species but nevertheless differed significantly from each other for E. marmotae (means: environmental 7260.949; clinical 7264.137; Bonferroni-corrected unpaired t-test, p < 0.0001); the E. coli clinical vs. environmental comparison was not significant. See the supplement for additional statistical details on the comparisons in Figure 3. The statistical analysis in Figure 3 confirmed that the peak range of 7,260–7,268 m/z for E. marmotae was distinct and non-overlapping with the 7,268–7,285 m/z range observed for E. coli.
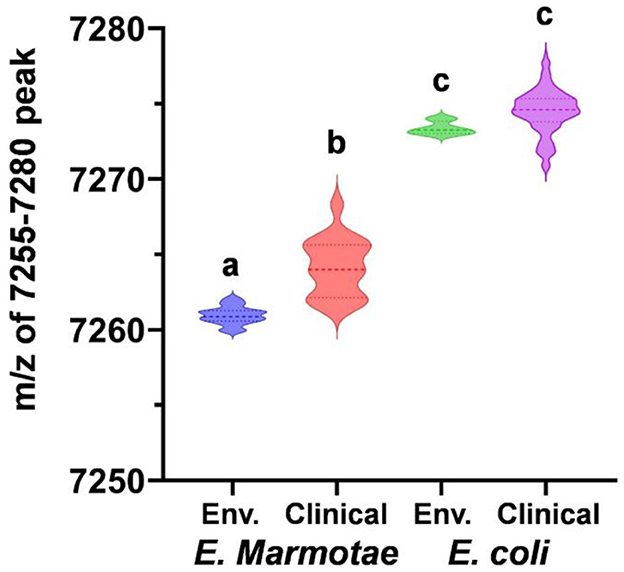
Figure 3. Comparative analysis of MALDI-TOF-MS peaks for E. marmotae and E. coli in the m/z range of 7,250–7,280. The violin plots, with a dashed line representing the median, illustrate values of the m/z peak for 17 environmental E. marmotae (blue), 18 clinical E. marmotae (red), 4 environmental E. coli (green), and 169 clinical E. coli (purple). Groups with different letters differed from one another on statistical tests at p < 0.0001 (multiple t-tests and Mann-Whitney tests, Bonferroni-corrected for 6 comparisons; data shown in Supplementary Tables S2, S3). The two groups with the same letter were not different (p = 0.034, not significant with the Bonferroni correction).
While most strains of Escherichia fit this paradigm, a small proportion of both E. marmotae and E. coli lacked the peak in the described range, but rather had a nearby lower m/z peak. Thus, 3 of 39 E. marmotae isolates had a peak at 7,221 daltons, and one isolate had a peak at 7,200 daltons. In E. coli, all of the environmental strains and all of the other Escherichia cryptic clades showed a peak in the 7,270–7,280 daltons m/z range (Supplementary Table S2); however, among the 175 verified clinical E. coli tested from Henry Ford Health, 3 isolates had their nearby peak in the range of 7,200–7,221, as listed in Supplementary Table S3 and 3 strains had a nearby peak in the range of 7,280–7,286. The idea that these low and high m/z peaks are distinctively different is supported by statistical outlier tests (GraphPad, Outlier test ROUT with Q set at 1%) on the complete data sets.
Clinical case identification and characterization of E. marmotae HFH1
Among the 176 putative E. coli clinical isolates from Henry Ford Health tested by MALDI-TOF-MS, one strain—designated HFH1—was flagged for further analysis due to its unique spectral profile. Specifically, this isolate displayed a peak at 7261.439 m/z (Figure 4), which falls within the E. marmotae-specific range (7,260–7,268 m/z) identified in our spectral analysis (Figures 2, 3). Despite being identified by the IVD MALDI-TOF-MS system as E. coli with a high confidence score of 99.1%, the RUO confidence score was 0%, consistent with other E. marmotae isolates. To further investigate, we tested the isolate with our species-specific qPCR assay, targeting E. marmotae uidA and uidB genes. The assay had a positive result, and sequencing of the amplicons and the whole genome further confirmed its identity as E. marmotae. HFH1 WGS assembly, completeness, and annotation statistics are given in Supplementary Table S5. WGS of HFH1 showed that this isolate is more than 99.0% identical to other E. marmotae genomes in GenBank and differs from E. coli by 10%. The sequence of HFH1 has been submitted to GenBank as accession ID JBOZGX000000000.
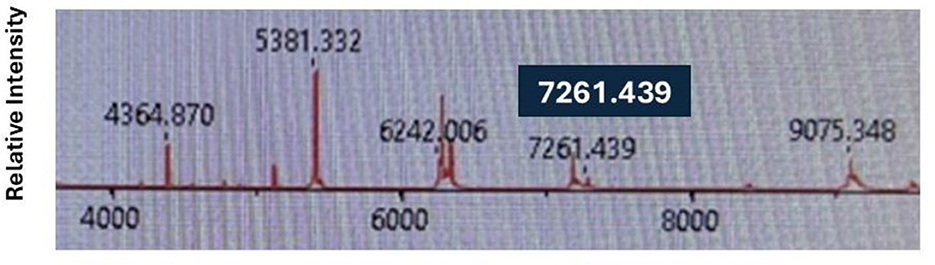
Figure 4. MALDI-TOF-MS spectra for E. marmotae HFH1, highlighting the E. marmotae-specific peak which was detected at an m/z of 7261.439.
Strain HFH1 was isolated from a blood culture of a patient with clinical signs of sepsis, indicating its pathogenic potential. Motility tests revealed that HFH1 is non-motile. The serotype of HFH1 was identified as O21:H56. Virulence factor profiling identified genes involved in adhesion and fimbrial assembly, such as fimA-I, ompA, papD-H, hofB/C/Q, sfpC/H, eaeH, nada/b, fanD-H, ppdA-D, and the curli operon csgA/B/D/E/F/G (Crabbé et al., 2014; Snyder et al., 2005). The genome of HFH1 encodes genes related to flagellar biosynthesis and chemotaxis, including flgA-N, flhA-E, fliA-Z, flk, motA/B, and cheA/B/R/W/Y/Z (Girgis et al., 2007). Toxin- and secretion-related genes included cdtABC, encoding cytolethal distending toxins that induce DNA damage in host cells (Huerta-Cantillo et al., 2025) and astA, which encodes the enteroaggregative heat-stable enterotoxin EAST1. Additional virulence elements include genes for Type II (gspC-M), and some Type VI (T6SS) secretion systems genes (hcp, pppA, clpv, and vgrG1) (Journet and Cascales, 2016), as well as invasion-associated loci such as kpsD, kpsM, and ibeB/C. The complete virulence gene profile is listed in Supplementary Table S6 and is consistent with previously reported clinical and environmental E. marmotae strains (Binsker et al., 2024; Liu et al., 2019; Sivertsen et al., 2022). The present study has only demonstrated the presence of the above genes in this isolate; future studies should examine their relevance, if any, to potential pathogenicity of E. marmotae.
Antimicrobial resistance (AMR) gene analysis revealed several genes potentially capable of conferring resistance to various antibiotic classes. Genes associated with resistance to antimicrobial peptides included eptA, bacA, ugd, yojI, and pmrF. Nitroimidazole resistance may be mediated by msbA, while emrE potentially confers resistance to macrolides. Multidrug efflux systems were represented by acrA/B/E/F, marA, gadX, mdtE/F, and tolC. Additionally, β-lactam resistance genes ampH and ampC were present, suggesting potential resistance to penams and cephalosporins. A full list of resistance genes along with sequence coverage and identity based on the CARD database in isolate HFH1 is presented in Supplementary Table S7.
Plasmid analysis using PlasmidFinder revealed the presence of three plasmid replicon types in the E. marmotae HFH1 genome: IncX4_2, IncFIB(AP001918)_1, and IncFII(pHN7A8)_1_pHN7A8. The IncX4 replicon has been frequently associated with the global dissemination of mcr-1, a plasmid-mediated colistin resistance gene among Enterobacteriaceae (Matamoros et al., 2017; Sun et al., 2017) although no mcr genes were detected in HFH1. The IncX4 plasmid has been shown to facilitate transfer of mcr-1 and other resistance genes, playing a role in the spread of colistin resistance (Binsker et al., 2023). The IncFIB(AP001918) and IncFII(pHN7A8) plasmid types are commonly found in extraintestinal pathogenic E. coli (ExPEC) and are often linked to virulence factors and antimicrobial resistance genes (Gagaletsios et al., 2025; Johnson and Nolan, 2009). These plasmids can contribute significantly to the spread of multi-drug resistance, including resistance to beta-lactams, fluoroquinolones, and other antibiotics (Yang et al., 2015).
The phenotypic and genotypic data confirm HFH1 as E. marmotae and demonstrate its potential to cause invasive human infection.
Discussion
Accuracy in identifying the organisms infecting an ill person may be a necessary pre-requisite to designing proper treatment. For an emerging pathogen, such as E. marmotae, which is frequently mistaken for E. coli because of its similar phenotype on standard tests, the lack of accurate identification by some commercial MALDI-TOF-MS systems means that until now the relative efficacy of different treatments for E. marmotae compared to E. coli infections cannot be determined. Since the genomic sequence of E. marmotae differs on average from E coli by about 10%, sequence-based tests can easily be applied; however, to our knowledge, no FDA-approved PCR test to do so is commercially available. We have demonstrated here two Taqman PCR targets that specifically identify E. marmotae and could be used in such tests.
MALDI-TOF-MS is a frequently used clinical laboratory method for fast identification of bacterial isolates; however, MALDI-TOF-MS databases do not universally include E. marmotae. The Bruker reference database includes several E. marmotae spectra, but publications reported that the confidence scores vary and with the current database some are relatively low (Sinha et al., 2024; Sivertsen et al., 2022). The bioMérieux VITEK MALDI-TOF-MS database does not include E. marmotae at all, and therefore, as reported here, either mistakenly identifies verified E. marmotae as E. coli most of the time or doesn't identify the isolate at all. The current paper describes the sample-to-sample variation of a much larger number of E. marmotae isolates than have been used in any previous publication or reference database for MALDI-TOF-MS analysis of E. marmotae isolates.
However, we report here a specific spectral peak observed on the VITEK MALDI-TOF-MS that unambiguously identifies most strains of E. marmotae, differentiating them, with no overlap, from isolates of E. coli. The species-specific spectral peak in E. marmotae occurs at m/z of 7,260–7,268, while the comparable peak in E. coli is at 7,268–7,286. A small percentage (< 10%) of both species lacks the peak at these m/z values, but seem to have a peak that is otherwise absent in the m/z range of 7,200–7,225. If the isolate has a peak in the range of 7,260–7,268, this study unambiguously identifies it as E. marmotae. Further work will investigate the molecular identity of this peak by performing MS/MS (tandem mass spectroscopy) specifically targeting the fragment ion at the 7,260–7,268 m/z range to identify the peptide or protein responsible for this species-specific feature.
Until now, the prevalence of E. marmotae in clinical cases appears to be low compared to E. coli and have been reported previously only in publications from Norway, France, and Australia (Clermont et al., 2011; Sinha et al., 2024; Sivertsen et al., 2022). This study provides the first documented clinical identification of E. marmotae in the United States, highlighting the need for updated diagnostic protocols capable of detecting this pathogen.
The prevalence of E. marmotae compared to E. coli is below 1% (0.2%) in France (Clermont et al., 2011); and 0.4% in Norway (Sivertsen et al., 2022). In the present study, in which almost 200 clinical isolates putatively identified as E. coli were tested for being E. marmotae, one strain, HFH1, proved to be E. marmotae; the rest were confirmed as E. coli. With only one isolate out of 176, we cannot calculate an accurate prevalence, but this frequency is consistent with a prevalence of < 1%, as reported elsewhere. Given the phenotypic similarities with E.coli, E. marmotae is underdiagnosed in clinical settings, which has likely led to an underestimation of its true prevalence.
The isolate was recovered from a patient with sepsis, indicating its potential to cause invasive disease. Motility analysis revealed that isolate HFH1 is not motile at 37 °C and therefore may cause a different range of infections than E. coli, which is typically motile at this temperature. The temperature dependence of motility and motility gene expression of E. marmotae, in comparison to E. coli, is the subject of another study from our laboratory (Oladipo et al., 2024). Genetic analysis of HFH1 also reveals numerous non-synonymous sequence differences from E. coli in genes that are important for extraintestinal pathogenic E. coli (ExPEC) infections, including genes for fimbrial adhesion, toxin production, and multiple secretion systems.
E. marmotae is known to occur in the environment in the USA, where it was originally identified as a “cryptic clade” of Escherichia (Walk et al., 2009). Although the identifying MALDI TOF MS peak in the environmental strains of E marmotae in the present study occurs at a lower m/z than most clinical strains we have tested, our HFH1 isolate is closer to the average environmental isolate (all of which were from Michigan) than the average clinical isolate of E. marmotae, most of which were from Norway. The significant difference may therefore be one of geographical origin and not environment vs. clinic. Future studies may investigate these differences in the identifying peak.
Clinical tests based on these observations may assist in therapeutic decisions. Moreover, discovering the identity of the structure underlying the shift in the MALDI-TOF-MS peak may help determine if it has a special role in infection; however, until now the molecule(s) that is detected by this peak are unknown. Although currently rare among clinical isolates of Escherichia, it seems likely that additional clinical isolates will be detected globally. We wonder whether E. marmotae is an emerging pathogen or whether it has always been rare and will remain so. Future research should explore phenotypic antimicrobial resistance in clinical E. marmotae strains, explore the host immune response to E. marmotae, the functional role of its unique proteomic features, and comparative infection models to elucidate how its pathogenesis diverges from that of E. coli.
Data availability statement
The raw sequencing data and genome assemblies of the Ram lab environmental and clinical isolates have been published under the BioProject PRJNA1261436 and PRJNA1268432, and accession numbers are provided in Table 1.
Ethics statement
Collection of E. coli samples from Henry Ford Health was approved by the Henry Ford Health Institutional Review Board (IRB). The E. coli and E. marmotae isolates used in this research were collected from hospital patients who signed a general consent for their use in research as required by the Henry Ford Health Institutional Review Board. All patient data were anonymized, prior to research use, as required by Henry Ford Health Institutional Review Board approval. E. marmotae cultures from Norway were collected in a study approved by the Regional Ethical Committee of Western Norway (REK 322324) (Sivertsen et al., 2022). This research adhered to the Declaration of Helsinki.
Author contributions
PO: Conceptualization, Data curation, Formal analysis, Investigation, Methodology, Software, Validation, Visualization, Writing – original draft, Writing – review & editing. RT: Investigation, Methodology, Resources, Validation, Writing – review & editing, Project administration. AS: Investigation, Validation, Writing – review & editing. JB: Formal analysis, Investigation, Methodology, Resources, Writing – review & editing. TB: Investigation, Validation, Writing – review & editing. AF: Investigation, Writing – review & editing. MS: Data curation, Methodology, Resources, Writing – review & editing. MZ: Methodology, Resources, Writing – review & editing. AJ: Data curation, Investigation, Writing – review & editing. JR: Conceptualization, Data curation, Formal analysis, Project administration, Resources, Software, Supervision, Validation, Writing – original draft, Writing – review & editing.
Funding
The author(s) declare that no financial support was received for the research and/or publication of this article.
Conflict of interest
The authors declare that the research was conducted in the absence of any commercial or financial relationships that could be construed as a potential conflict of interest.
Generative AI statement
The author(s) declare that no Gen AI was used in the creation of this manuscript.
Any alternative text (alt text) provided alongside figures in this article has been generated by Frontiers with the support of artificial intelligence and reasonable efforts have been made to ensure accuracy, including review by the authors wherever possible. If you identify any issues, please contact us.
Publisher's note
All claims expressed in this article are solely those of the authors and do not necessarily represent those of their affiliated organizations, or those of the publisher, the editors and the reviewers. Any product that may be evaluated in this article, or claim that may be made by its manufacturer, is not guaranteed or endorsed by the publisher.
Supplementary material
The Supplementary Material for this article can be found online at: https://www.frontiersin.org/articles/10.3389/fmicb.2025.1664775/full#supplementary-material
Abbreviations
MALDI-TOF-MS, Matrix-Assisted Laser Desorption Ionization-Time of Flight Mass Spectrometry; IVD, in vitro diagnostic; RUO, Research Use Only; AMR, Antimicrobial resistance; LB, Luria Bertani; WGS, Whole Genome Sequencing; CARD, Comprehensive Antibiotic Resistance Database; ExPEC, Extraintestinal Pathogenic Escherichia coli; FDA, Food and Drug Administration; qPCR, Quantitative Polymerase Chain Reaction; PCR, Polymerase Chain Reaction; m/z, Mass-to-charge ratio; T3SS, Type III Secretion System; T6SS, Type VI Secretion System; IDT, Integrated DNA Technologies.
References
Alcock, B. P., Raphenya, A. R., Lau, T. T. Y., Tsang, K. K., Bouchard, M., Edalatmand, A., et al. (2019). CARD 2020: antibiotic resistome surveillance with the comprehensive antibiotic resistance database. Nucleic Acids Res. 48:gkz935. doi: 10.1093/nar/gkz935
Binsker, U., Deneke, C., Hamid, H. M., Gadicherla, A. K., Göhler, A., Käsbohrer, A., et al. (2024). Genomic dissection of Escherichia marmotae provides insights into diversity and pathogenic potential. ISME Commun. 4:ycae126. doi: 10.1093/ismeco/ycae126
Binsker, U., Oelgeschläger, K., Neumann, B., Werner, G., Käsbohrer, A., and Hammerl, J. A. (2023). Genomic evidence of mcr-1.26 IncX4 plasmid transmission between poultry and humans. Microbiol. Spectr. 11:e01015–e01023. doi: 10.1128/spectrum.01015-23
Carattoli, A., Zankari, E., García-Fernández, A., Voldby Larsen, M., Lund, O., Villa, L., et al. (2014). In silico detection and typing of plasmids using PlasmidFinder and plasmid multilocus sequence typing. Antimicrob. Agents Chemother. 58, 3895–3903. doi: 10.1128/AAC.02412-14
Chen, L. (2004). VFDB: a reference database for bacterial virulence factors. Nucleic Acids Res. 33, D325–D328. doi: 10.1093/nar/gki008
Clermont, O., Gordon, D. M., Brisse, S., Walk, S. T., and Denamur, E. (2011). Characterization of the cryptic Escherichia lineages: rapid identification and prevalence. Environ. Microbiol. 13, 2468–2477. doi: 10.1111/j.1462-2920.2011.02519.x
Crabbé, A., Ledesma, M. A., and Nickerson, C. A. (2014). Mimicking the host and its microenvironment in vitro for studying mucosal infections by Pseudomonas aeruginosa. Pathog. Dis. 71, 1–19. doi: 10.1111/2049-632X.12180
Florio, W., Tavanti, A., Barnini, S., Ghelardi, E., and Lupetti, A. (2018). Recent advances and ongoing challenges in the diagnosis of microbial infections by MALDI-TOF mass spectrometry. Front. Microbiol. 9:1097. doi: 10.3389/fmicb.2018.01097
Gagaletsios, L. A., Kikidou, E., Galbenis, C., Bitar, I., and Papagiannitsis, C. C. (2025). Exploring virulence characteristics of clinical Escherichia coli isolates from Greece. Microorganisms 13:1488. doi: 10.3390/microorganisms13071488
Girgis, H. S., Liu, Y., Ryu, W. S., and Tavazoie, S. (2007). A comprehensive genetic characterization of bacterial motility. PLoS Genet. 3, 1644–1660. doi: 10.1371/journal.pgen.0030154
Gurevich, A., Saveliev, V., Vyahhi, N., and Tesler, G. (2013). QUAST: quality assessment tool for genome assemblies. Bioinformatics 29, 1072–1075. doi: 10.1093/bioinformatics/btt086
Huerta-Cantillo, J., Chavez-Dueñas, L., Zaidi, M. B., Estrada-García, T., and Navarro-Garcia, F. (2025). Cytolethal distending toxin-producing Escherichia coli clinical isolates from Mexican children harbor different cdt types causing CDT-induced epithelial pathological phenotypes. Med. Microbiol. Immunol. 214:7. doi: 10.1007/s00430-025-00816-4
Joensen, K. G., Tetzschner, A. M. M., Iguchi, A., Aarestrup, F. M., and Scheutz, F. (2015). Rapid and easy in silico serotyping of Escherichia coli isolates by use of whole-genome sequencing data. J. Clin. Microbiol. 53, 2410–2426. doi: 10.1128/JCM.00008-15
Johnson, T. J., and Nolan, L. K. (2009). Pathogenomics of the virulence plasmids of Escherichia coli. Microbiol. Mol. Biol. Rev. 73, 750–774. doi: 10.1128/MMBR.00015-09
Journet, L., and Cascales, E. (2016). The type VI secretion system in Escherichia coli and related species. EcoSal Plus 7:10.1128/ecosalplus.ESP-0009–2015. doi: 10.1128/ecosalplus.esp-0009-2015
Lefort, A., Panhard, X., Clermont, O., Woerther, P., Branger, C., Mentré, F., et al. (2011). Host factors and Portal of entry outweigh bacterial determinants to predict the severity of Escherichia coli bacteremia. J. Clin. Microbiol. 49, 777–783. doi: 10.1128/JCM.01902-10
Liu, S., Feng, J., Pu, J., Xu, X., Lu, S., Yang, J., et al. (2019). Genomic and molecular characterisation of Escherichia marmotae from wild rodents in Qinghai-Tibet plateau as a potential pathogen. Sci. Rep. 9:10619. doi: 10.1038/s41598-019-46831-3
Liu, S., Jin, D., Lan, R., Wang, Y., Meng, Q., Dai, H., et al. (2015). Escherichia marmotae sp. Nov., isolated from faeces of Marmota himalayana. Int. J. Syst. Evol. Microbiol. 65(Pt_7), 2130–2134. doi: 10.1099/ijs.0.000228
Matamoros, S., Van Hattem, J. M., Arcilla, M. S., Willemse, N., Melles, D. C., Penders, J., et al. (2017). Global phylogenetic analysis of Escherichia coli and plasmids carrying the mcr-1 gene indicates bacterial diversity but plasmid restriction. Sci. Rep. 7:15364. doi: 10.1038/s41598-017-15539-7
Mire, M., Kim, C., Baffaut, C., Liu, F., Wuliji, T., and Zheng, G. (2022). Escherichia cryptic clade II through clade VIII: rapid detection and prevalence in feces and surface water. Sci. Total Environ. 848:157741. doi: 10.1016/j.scitotenv.2022.157741
Moinet, M., Collis, R. M., Rogers, L., Devane, M. L., Biggs, P. J., Stott, R., et al. (2024). Development of a multiplex droplet digital PCR assay for simultaneous detection and quantification of Escherichia coli, E. marmotae, and E. ruysiae in water samples. J. Microbiol. Methods 220:106909. doi: 10.1016/j.mimet.2024.106909
Oladipo, P., Withey, J. H., and Ram, J. L. (2024). Not So Cryptic Anymore: Genetic and Functional Differences of Escherichia marmotae from E. coli [Abstract and poster]. ASM Microbe, Atlanta, GA.
Ram, J. L., Ritchie, R. P., Fang, J., Gonzales, F. S., and Selegean, J. P. (2004). Sequence-based source tracking of Escherichia coli based on genetic diversity of β-glucuronidase. J. Environ. Qual. 33, 1024–1032. doi: 10.2134/jeq2004.1024
Ram, J. L., Thompson, B., Turner, C., Nechvatal, J. M., Sheehan, H., and Bobrin, J. (2007). Identification of pets and raccoons as sources of bacterial contamination of urban storm sewers using a sequence-based bacterial source tracking method. Water Res. 41, 3605–3614. doi: 10.1016/j.watres.2007.04.013
Seemann, T. (2014). Prokka: rapid prokaryotic genome annotation. Bioinformatics 30, 2068–2069. doi: 10.1093/bioinformatics/btu153
Sinha, T., Merlino, J., Rizzo, S., Gatley, A., Siarakas, S., and Gray, T. (2024). Unrecognised: isolation of Escherichia marmotae from clinical urine sample, phenotypically similar to Escherichia coli. Pathology 56, 577–578. doi: 10.1016/j.pathol.2023.08.015
Sivertsen, A., Dyrhovden, R., Tellevik, M. G., Bruvold, T. S., Nybakken, E., Skutlaberg, D. H., et al. (2022). Escherichia marmotae—a human pathogen easily misidentified as Escherichia coli. Microbiol. Spectr. 10:e02035–e02021. doi: 10.1128/spectrum.02035-21
Snyder, J. A., Haugen, B. J., Lockatell, C. V., Maroncle, N., Hagan, E. C., Johnson, D. E., et al. (2005). Coordinate expression of fimbriae in uropathogenic Escherichia coli. Infect. Immun. 73, 7588–7596. doi: 10.1128/IAI.73.11.7588-7596.2005
Sun, J., Fang, L.-X., Wu, Z., Deng, H., Yang, R.-S., Li, X.-P., et al. (2017). Genetic analysis of the IncX4 plasmids: implications for a unique pattern in the mcr-1 acquisition. Sci. Rep. 7:424. doi: 10.1038/s41598-017-00095-x
Untergasser, A., Cutcutache, I., Koressaar, T., Ye, J., Faircloth, B. C., Remm, M., et al. (2012). Primer3—new capabilities and interfaces. Nucleic Acids Res. 40, e115–e115. doi: 10.1093/nar/gks596
Walk, S. T. (2015). The “Cryptic” Escherichia. EcoSal Plus 6:10.1128/ecosalplus.ESP-0002–2015. doi: 10.1128/ecosalplus.esp-0002-2015
Walk, S. T., Alm, E. W., Gordon, D. M., Ram, J. L., Toranzos, G. A., Tiedje, J. M., et al. (2009). Cryptic lineages of the genus Escherichia. Appl. Environ. Microbiol. 75, 6534–6544. doi: 10.1128/AEM.01262-09
Wick, R. R., Judd, L. M., Gorrie, C. L., and Holt, K. E. (2017). Unicycler: resolving bacterial genome assemblies from short and long sequencing reads. PLoS Comput. Biol. 13:e1005595. doi: 10.1371/journal.pcbi.1005595
Yang, Q.-E., Sun, J., Li, L., Deng, H., Liu, B.-T., Fang, L.-X., et al. (2015). IncF plasmid diversity in multi-drug resistant Escherichia coli strains from animals in China. Front. Microbiol. 6:964. doi: 10.3389/fmicb.2015.00964
Keywords: qPCR, Escherichia marmotae, MALDI-TOF-MS, bioMérieux, spectral peaks, bacterial identification, species-specific qPCR, VITEK MS
Citation: Oladipo PM, Tibbetts RJ, Sivertsen A, Barger JM, Bruvold TS, Fite A, Sims M, Zervos M, Jomaa A and Ram JL (2025) New diagnostic methods for Escherichia marmotae and the first report of its identification in clinical isolates in North America. Front. Microbiol. 16:1664775. doi: 10.3389/fmicb.2025.1664775
Received: 12 July 2025; Accepted: 18 August 2025;
Published: 05 September 2025.
Edited by:
Xiaoli Qin, Hunan Agricultural University, ChinaReviewed by:
Amira Awad Moawad, Friedrich Loeffler Institut, GermanyUlrike Binsker, German Federal Institute for Risk Assessment, Germany
Copyright © 2025 Oladipo, Tibbetts, Sivertsen, Barger, Bruvold, Fite, Sims, Zervos, Jomaa and Ram. This is an open-access article distributed under the terms of the Creative Commons Attribution License (CC BY). The use, distribution or reproduction in other forums is permitted, provided the original author(s) and the copyright owner(s) are credited and that the original publication in this journal is cited, in accordance with accepted academic practice. No use, distribution or reproduction is permitted which does not comply with these terms.
*Correspondence: Pelumi M. Oladipo, aGw4MDMwQHdheW5lLmVkdQ==