 Arunabh Sharma1
 Nadia Andrea Andreani2,3
 Lara Keller4,5
 Beate Herpertz-Dahlmann4Jochen Seitz4,5
 John F. Baines2,6
 Astrid Dempfle1*
- 1Institute of Medical Informatics and Statistics, Kiel University, Kiel, Germany
- 2Max Planck Institute for Evolutionary Biology, Plön, Germany
- 3Department of Biology and Biotechnology “Charles Darwin”, Sapienza University of Rome, Rome, Italy
- 4Department of Child and Adolescent Psychiatry, Psychosomatics and Psychotherapy, University Hospital, RWTH Aachen University, Aachen, Germany
- 5Department of Child and Adolescent Psychiatry, Psychosomatics and Psychotherapy, LVR-University Hospital Essen, University of Duisburg-Essen, Essen, Germany
- 6Section of Evolutionary Medicine, Institute for Experimental Medicine, Kiel University, Kiel, Germany
Introduction: Short read sequencing of the 16S ribosomal RNA (rRNA) gene targeting specific hypervariable regions is widely employed to study the human gut microbiota. In these studies, the selection of particular 16S rRNA hypervariable regions is a crucial step. However, the results of such studies exhibit significant variability depending on the targeted hypervariable region.
Methods: In this study, we systematically evaluated the performance of hypervariable regions V1V2 and V3V4 in a longitudinal gut microbiome study of adolescent patients with anorexia nervosa (AN) and matched controls.
Results: The dominant genera, such as Bacteroides H, Faecalibacterium and Phocaeicola A 858004 were consistently detected in both hypervariable regions across timepoints. The within-sample longitudinal alpha diversity measures varied between the regions with the Chao1 index values being higher in the V1V2 region. The overall microbiome profiles based on beta diversity also differed between the regions. Bland–Altman analysis revealed a general lack of strong agreement between the two sequencing methods, except for a few taxa such as Faecalibacterium, Ruminococcus, Roseburia, Turicibacter and Anaerotruncus. While some results were similar across both hypervariable regions, most of the findings were sensitive to the chosen region.
Conclusion: This study underscores the importance of primer selection in microbiome studies of AN, as it can influence taxonomic resolution and diversity estimates along with downstream statistical analyses.
1 Introduction
The taxonomic composition of complex microbial communities studied through short-read sequencing of specific hypervariable regions of the 16S rRNA gene has been the standard approach for more than a decade now. A multitude of factors favour the usage of this technique, such as high throughput, previously established computational pipelines with reference databases, and relatively low cost (Fuks et al., 2018; Mukherjee et al., 2018). Such studies employing the 16 s rRNA gene have been able to decipher the varied structure of the microbiota and have greatly contributed to our understanding of the importance of microbiota diversity in human health and disease (Grice et al., 2009; Peciña et al., 2015; Guerrero-Preston et al., 2016; Kehrmann et al., 2017; Mukherjee et al., 2018). This however, comes with a certain caveat: technical variation arising in 16S rRNA amplicon sequencing studies, such as experimental protocols, primer choice, ribosomal hypervariable regions, and selection of reference databases, may considerably influence the identification and classification of microbial taxa (Abellan-Schneyder et al., 2021). For example, previous studies have shown that the choice of amplification primers can influence results by introducing bias (Albertsen et al., 2015; Meisel et al., 2016; Graspeuntner et al., 2018). At the same time, selecting particular 16S rRNA hypervariable regions for sequencing is an important step in 16S rRNA gene sequencing studies. The 16S rRNA comprises nine hypervariable regions, named V1-V9, which are used to identify the taxa and obtain an estimate of evolutionary relationships between them. All nine hypervariable regions give an insight into the microbial taxonomy but the quality and quantity of information that is extracted shows considerable variation depending on the region for a particular studied environment (Heidrich et al., 2022). For example, to study the gut microbiota of Japanese individuals, Kameoka et al. (2021) showed that V1V2 gave more precise estimates for the genus Akkermansia than V3V4 based on real-time quantitative polymerase chain reaction (qPCR) assays. Similarly, in a study aiming to characterize the male urinary microbiota, Heidrich et al. (2022) found that V1V2 region provided higher taxonomic resolution when compared to other 16S rRNA hypervariable regions (Kameoka et al., 2021; Heidrich et al., 2022).
Anorexia nervosa (AN) is a severe psychiatric disorder and has a high prevalence in the adolescent age group. Compared to healthy controls, individuals with AN have standardized mortality rates that are 5–10 times higher (Arcelus et al., 2011; Bulik et al., 2019; Andreani et al., 2024). The main characteristics of AN include insufficient energy intake, low body weight, body image distortion, and fear of gaining weight. However, the explanation of the underlying pathophysiology is not well understood (Herpertz-Dahlmann et al., 2021). In recent times, an increasing number of studies have alluded to the role of the gut microbiome in energy extraction from food and weight regulation as well as how it impacts the brain and behavior through the gut-brain axis. Hence, there has been a growing interest in studying the relationship between the microbiome and psychiatric diseases, including AN (Hills et al., 2019; Santacroce et al., 2021; Wu et al., 2021). Additionally, in microbiome studies of AN, a longitudinal design including a post-treatment follow-up, ideally more than 6 months, is advantageous as it helps shed light on the state of the microbiome after weight gain (Andreani et al., 2024) and may help us understand which microbiome alterations may be causes or consequences of the disease.
In AN, 16S rRNA gene sequencing is the most commonly employed method to investigate the role of the microbiome in disease pathogenesis. However, no studies have so far evaluated the implications of selecting a particular hypervariable region in the interpretation of the findings arising from downstream statistical analysis. In this study, we compared the 16S rRNA gene hypervariable regions V1V2 and V3V4 in a gut microbiome study of adolescent patients with AN along with age-matched healthy controls. This work features longitudinal 16S rRNA gene sequencing data, collected during inpatient treatment and at follow-up 1-year after hospital admission.
2 Materials and methods
2.1 Cohort description and sample collection
The recruitment of study participants and data collection have been previously described (Andreani et al., 2024). Briefly, a total of sixty-four female adolescents (aged between 12 and 20 years, mean 16 years) with AN (typical or atypical) according to the DSM-5 were recruited and enrolled between December 2016 and January 2020 at the RWTH Aachen University Hospital’s Department of Child and Adolescent Psychiatry. Of these, fifty-seven patients were included in the analysis. Stool sampling was done at nine time points, based on prespecified clinical milestones with different interval lengths between patients. These included T0 (admission), T1 (a diet of 25 Kcal/kg/day), T2 (a diet of 50 Kcal/kg/day), T3 (a diet of 62.5 Kcal/kg/day), T4 (a weight gain up to the 5th age-adjusted BMI percentile), T5 (a weight gain up to the 10th age-adjusted BMI percentile), T6 (a weight gain up to the 15th age-adjusted BMI percentile), T7 (discharge), and T8 (1-year follow-up appointment, one year after admission). In addition, 34 age-matched female HCs with normal body weight (between the 20th and 80th percentile of age-adjusted body mass index [BMI-SDS]) were recruited. Faecal sample collection and DNA extraction from stool samples for patients and healthy volunteers have been previously described in detail (Schulz et al., 2021; Andreani et al., 2024).
The study was approved by the ethics committee of RWTH Aachen University Hospital and was carried out in compliance with the Declaration of Helsinki. Before enrollment in the study, written informed consent was obtained from the participants’ parents or legal guardians, and assent was obtained from the study participants themselves.
2.2 16S rRNA gene sequencing and processing
The V1V2 region of the 16S rRNA gene was amplified with primers 27F and 338 R using dual barcoding (Caporaso et al., 2011). The resulting library was sequenced on an Illumina Miseq sequencer (250PE). During demultiplexing, no mismatches were allowed in the barcode (Casava, Illumina). QIIME2 (v2019.10) was used to process and analyse the sequence data (Bolyen et al., 2018). Paired end sequences were denoised with ‘dada2’ (Callahan et al., 2016) using default parameters, unless stated: reads were truncated at the first base where the quality score dropped below Q = 3, truncation at 230 bp and the minimum length of reads after truncation was 100 bp.
The V3-V4 region of the 16S rRNA gene was amplified using 515F–806R primers, forward: GTGCCAGCMGCCGCGGTAA and reverse: GGACTACHVGGGTWTCTAAT, with a dual barcoding approach. The resulting library was sequenced on an Illumina Miseq sequencer (300PE). Processing of the reads was performed as previously reported, with the following modification: truncation at 270 bp. An abundance table of 16S rRNA amplicon sequence variants (ASVs) was generated, and the taxonomic annotation of ASVs was obtained using the greengenes2 database (McDonald et al., 2024).
2.3 Statistical analysis
All statistical analyses were performed with R (v. 4.4.2). Both datasets were combined into a phyloseq object for all downstream calculations using the phyloseq package (v. 1.46.0) (McMurdie and Holmes, 2013). Using microbial relative abundances, the within-sample alpha diversity (represented by the Shannon and Chao1 indices) was calculated at the genus level and between-sample microbial dissimilarities (beta diversity quantified by Bray-Curtis and Jaccard dissimilarity) were calculated at the genus and ASV levels. The ‘core’ microbiome was defined as those taxa that had a relative abundance greater than 0.01% in more than 50% of the samples. The threshold of 0.01% relative abundance was chosen to ensure that the taxa are present at levels that are likely to have biological significance and not just technical (sequencing) artefacts. This retains the low-abundance taxa and avoids the very rare taxa (near-zero detections). Similarly, the prevalence threshold of 50% maintains that the taxa are sufficiently prevalent and consistently present among the samples. Such a priori chosen abundance-occurrence thresholds, although commonly used in microbiome studies, often vary between studies and are study-specific (Neu et al., 2021). We used the R package vegan (v. 2.6.4) (Oksanen et al., 2022) for these calculations. Wherever applicable, the microbial raw counts were transformed into compositional abundances and statistical methods suitable for compositional data were used for analysis. This was done to avoid data loss often associated with rarefaction leading to reduced statistical power (McMurdie and Holmes, 2014). To obtain the summaries of sequencing data, the biomeUtils package (v. 0.022) (Shetty, 2023) was used. Other R packages used for analysis, visualisation and graphics include packages tidyverse (v. 2.0.0) (Wickham et al., 2019), microViz (v. 0.12.1) (Barnett et al., 2021), VennDiagram (v. 1.7.3) (Chen and Boutros, 2011) and ggpubr (v. 0.6.0) (Kassambara, 2023). We used ANCOM-BC2 (Lin and Peddada, 2024) to analyse the microbiota composition for differential abundance testing. We adjusted the p-values for multiple testing using the Benjamini–Hochberg (BH) procedure and the taxa that had BH-adjusted p-values less than 0.05 were identified as significantly differentially abundant.
2.3.1 Agreement between V1V2 and V3V4 abundance data
The Bland Altman (BA) method (Martin Bland and Altman, 1986) was used as an exploratory analysis to assess the agreement between microbiome relative abundances from the V1V2 (method 1) and V3V4 (method 2) regions for patients at admission. We looked at (a) all common core genera from both methods, (b) alpha diversity indices namely Shannon and Chao1, respectively, and (c) all gut microbial taxa reported in the systematic review by Di Lodovico et al. (2021) that exhibited significant differences in their relative abundances compared to healthy controls. Briefly, in BA analysis, the mean relative abundance and differences were calculated for the methods 1 and 2. Then the mean of the differences (known as ‘bias’) was calculated along with their corresponding standard deviations (SD). Bias quantifies the average difference between the two methods and a low bias is representative of good agreement. Subsequently, the limits of agreement (LOA) were calculated, which provided the range where 95% of the differences are expected to lie. A narrow LOA indicates better precision and less variability between the methods.
We also looked at the agreement between microbiome relative abundances from the V1V2 and V3V4 regions based on the overall microbiome profiles in contrast to BA analysis where individual taxa were considered. For each patient, pairwise Jaccard and Bray-Curtis distances were calculated for the microbiome profiles from both methods to quantify the similarity and dissimilarity between the overall microbiome composition. A Jaccard distance of 0 and 1 represents the maximum similarity (identical microbiome profiles) and dissimilarity (no common microbial taxa) respectively.
3 Results
Our cohort consisted of fifty-seven patients who were diagnosed with AN or atypical AN (one patient) according to DSM-5 and aged between 12 and 20 years, as described in detail elsewhere (Andreani et al., 2024). The longitudinal data, including stool samples and clinical data, were collected at nine timepoints, with the first eight (T0-T7) taking place during the treatment at the hospital stay and the last timepoint (T8) at the follow-up appointment 1 year after the hospital admission. Additionally, our study also included a healthy control (HC) group of similar-aged individuals (between 14 and 19 years) whose data were collected at a subset of six time points. A description of the clinical characteristics of the patients and HC groups has been previously detailed (Andreani et al., 2024).
3.1 Summary of sequencing data
We compared the sequencing data across the two methods (V1V2 and V3V4) for both the control and the patient groups to gain a better understanding of the characteristics of each method (Supplementary Table S1).
Among patients, the V1V2 dataset had a higher number of total reads (10,575,880) compared to V3V4 (7,164,406) and a higher number of detected taxa (4,593 for V1V2 and 2,104 for V3V4). Meanwhile, V1V2 showed moderately higher sparsity (0.9539098) compared to V3V4 (0.9328799) indicating a greater percentage of undetected taxa among many samples when using V1V2 primers. Similarly, for controls, the V1V2 dataset had a higher number of total reads (3,771,093) in contrast to V3V4 (2,905,102) along with a greater number of detected taxa (3,252) compared to V3V4 (1,518). Like in patients, the V1V2 dataset is more sparse (0.9357342) than V3V4 (0.8964646).
3.2 Microbiota composition at important timepoints
To examine the composition of gut microbiome based on relative abundances from regions V1V2 and V3V4 dataset over time, we evaluated taxa composition plots at the genus level for both patients and controls at three different timepoints: admission (T0), discharge (T7), and one-year follow-up (T8) (Figure 1; Supplementary Figure S1).
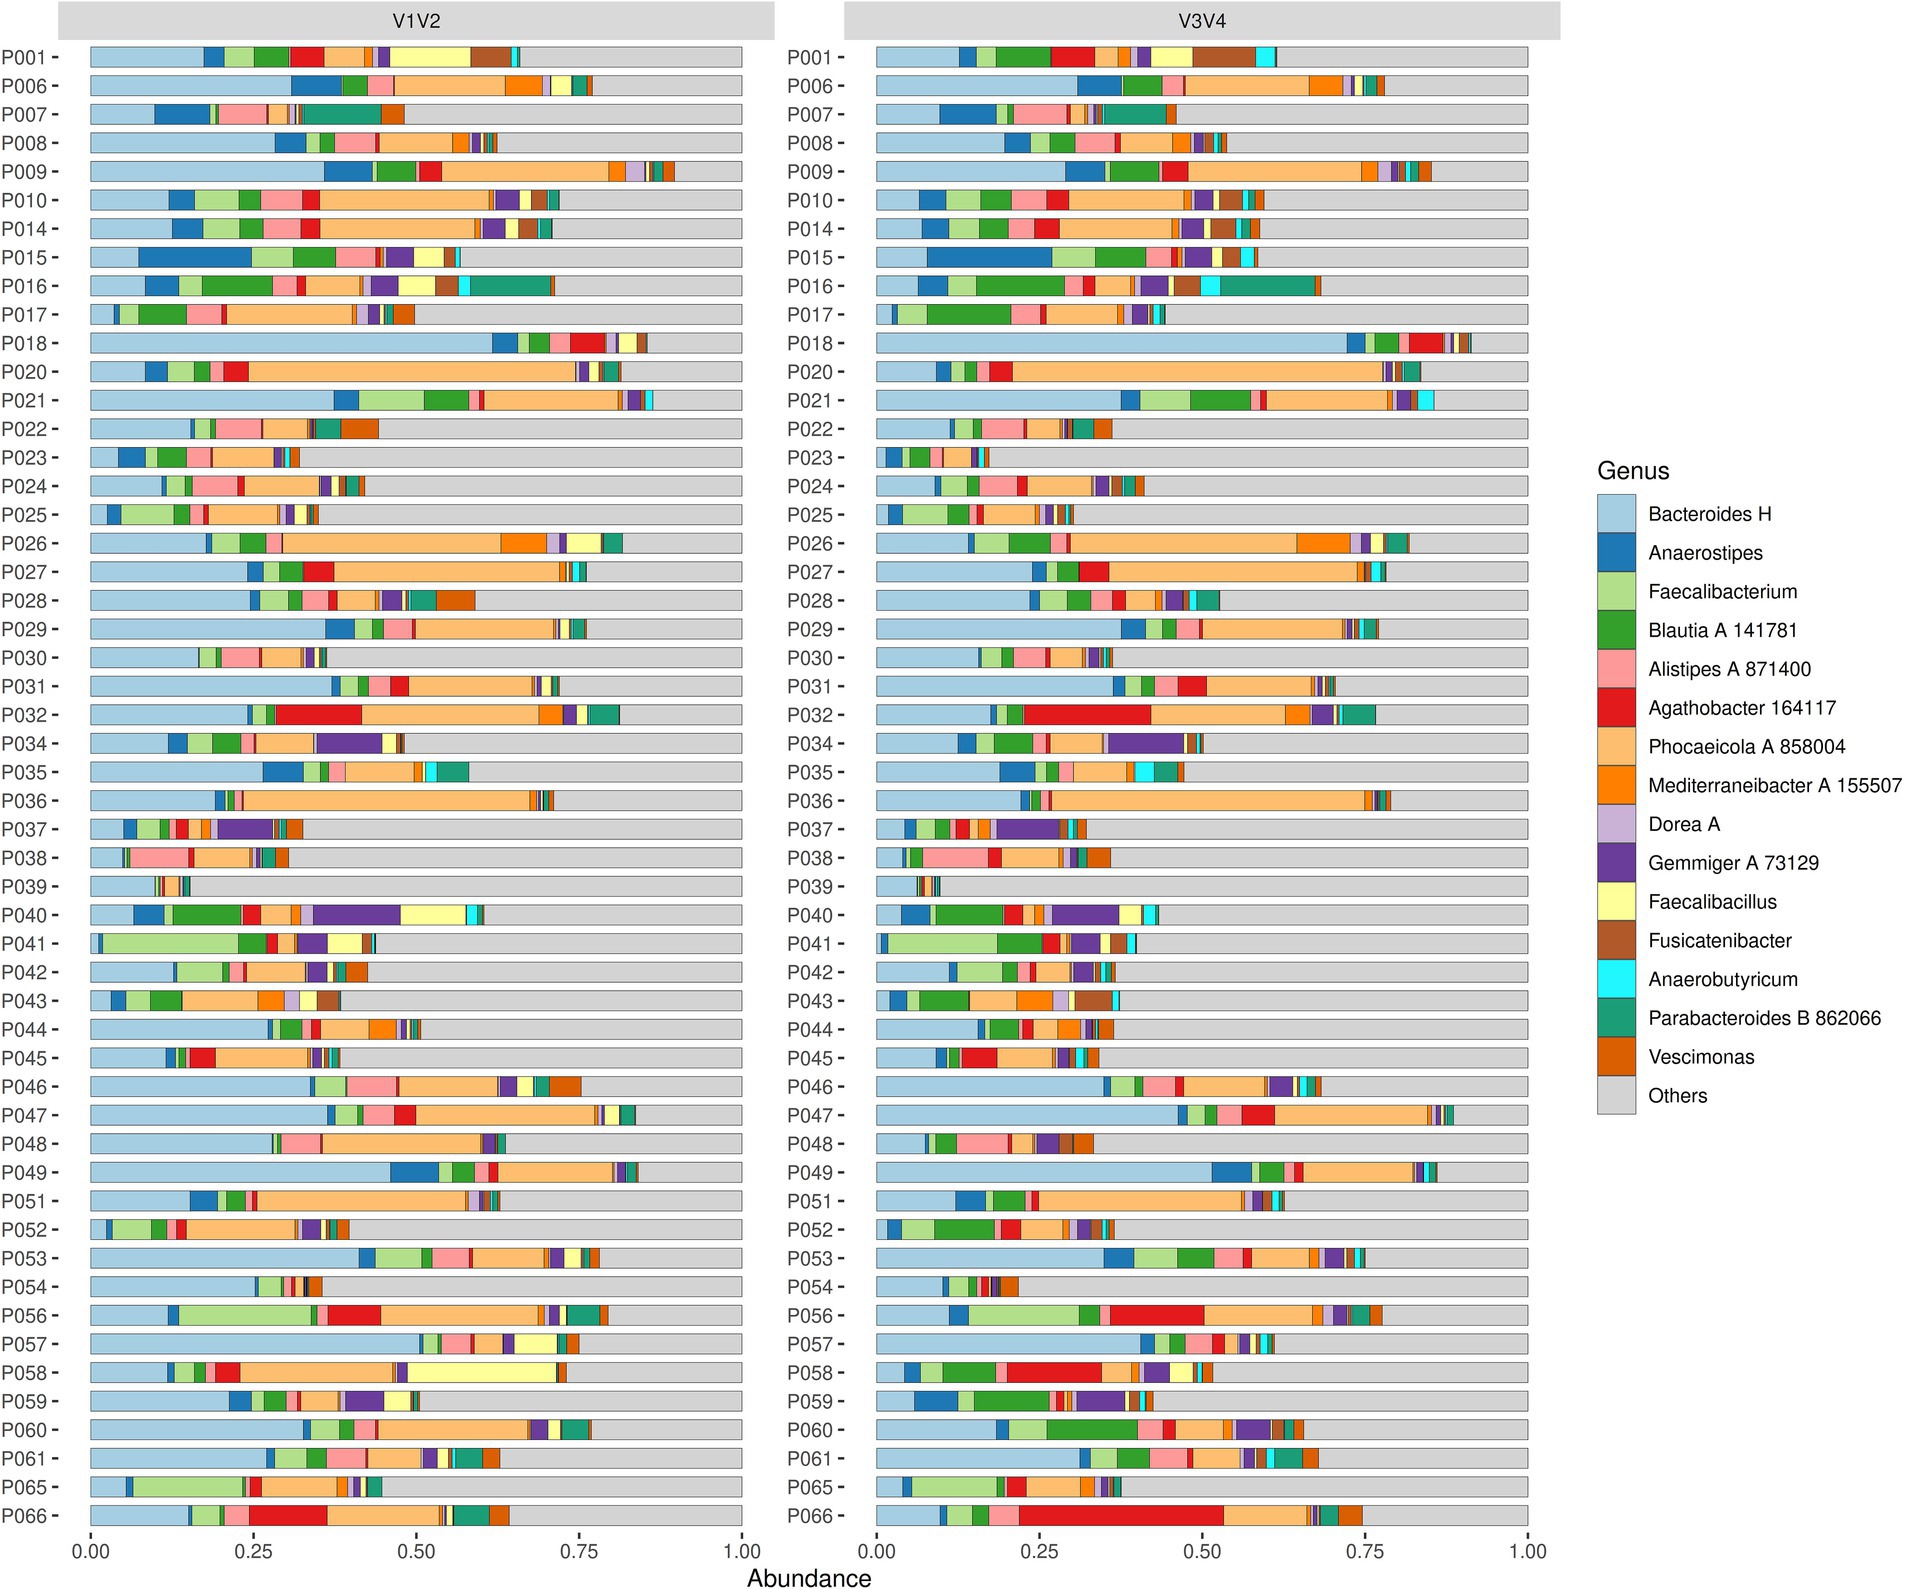
Figure 1. Microbiota composition at T0 in patients with AN. The figure shows the composition of microbes at the genus level for various samples between the V1V2 (left panel) and V3V4 (right panel) sequencing regions. Every sample is represented as a horizontal bar, where the colours describe the relative abundance of the 15 most abundant genera.
At T0, all patients showed high relative abundance for genera Bacteroides H, Faecalibacterium, Blautia A 141781, and Phocaeicola A 858004. Specifically, Bacteroides H and Phocaeicola A 858004 were predominant in most of the patients and were consistently present in both V1V2 and V3V4 datasets. On the other hand, genera such as Gemmiger A 73129, Alistipes A 871400, and Parabacteroides B 862066 showed lower prevalence across both datasets. At T7, the dominant taxa were the same ones from the timepoint T0 for all patients, namely, Bacteroides H, Faecalibacterium, Blautia A 141781, and Phocaeicola A 858004. Similar results were also noted for the T8 timepoint, where the microbial community composition showed a prevalence of the dominant taxa across the whole patient group. When we looked at both datasets, in some patients (e.g., P018, P047 and P049), Bacteroides H was seen to have higher abundance in the V3V4 region than in the V1V2 region and conversely, Faecalibacterium was more abundant in V1V2 than in V3V4 (e.g., P041, P056 and P065). Additionally, both datasets were able to detect low-abundance taxa such as Parabacteroides B 862066, Alistipes A 871400 and Gemmiger A 73129. To summarise, the composition of the main genera was relatively consistent across all timepoints in V1V2 and V3V4. Moreover, both datasets showed a similar presence of low-abundance genera, but no region provided definitive evidence to support rare taxa identification.
At T0, genera Phocaeicola A 858004, Bacteroides H, Faecalibacterium and Gemmiger A 73129 showed a high relative abundance for the control group. Of these, Phocaeicola A 858004 and Bacteroides H were the most dominant genera in most of the control subjects and were consistently present in both the V1V2 and V3V4 datasets. Genera Faecalibacterium and Gemmiger A 73129 were other notable taxa present at T0. We observed a lower abundance of genera Blautia A 141781, Alistipes A 871400, Parabacteroides B 862066 and Roseburia with no conclusive distinction between the distribution across the two datasets. At T7, the dominant genera from T0 continued to be similarly abundant. Of them, genera such as Bacteroides H and Phocaeicola A 858004 were more noticeable in some individuals compared to T0. Genera Lachnospira, Anaerostipes and Anaerobutyricum showed a slight increase in their detection, while Dorea A was seen to be less prevalent but appeared occasionally in some subjects. At T8, most of the taxa that were dominant in the previous timepoints were observed namely Phocaeicola A 858004, Bacteroides H and Faecalibacterium with the addition of Alistipes A 871400. Furthermore, the abundance of taxa Parabacteroides B 862066, Blautia A 141781, and Lachnospira were low. Other notable taxa such as Mediterraneibacter A 155507 and Fusicatenibacter, although at lower frequencies, are also seen in certain controls.
3.3 Taxonomic overlap
To understand the overlap and uniqueness of the ‘core taxa’, ‘prominent taxa’ and ‘low-prevalence taxa’ (defined by a prevalence greater than 50, 5 and 0.5% respectively) between V1V2 and V3V4 datasets, among all samples and a detection threshold of 0.01% relative abundance, we looked at their intersection using a Venn diagram (Figure 2). In case of the core taxa, the V1V2 dataset included 13 unique taxa, whereas the V3V4 dataset comprised 20 unique taxa. Seventeen taxa were common to both V1V2 and V3V4, highlighting little overlap (34%) in the core microbiome structure between these two amplicon regions. When we looked at the prominent taxa and low-prevalence taxa, overlaps of 50 and 55% were observed for the taxa derived from the two regions.
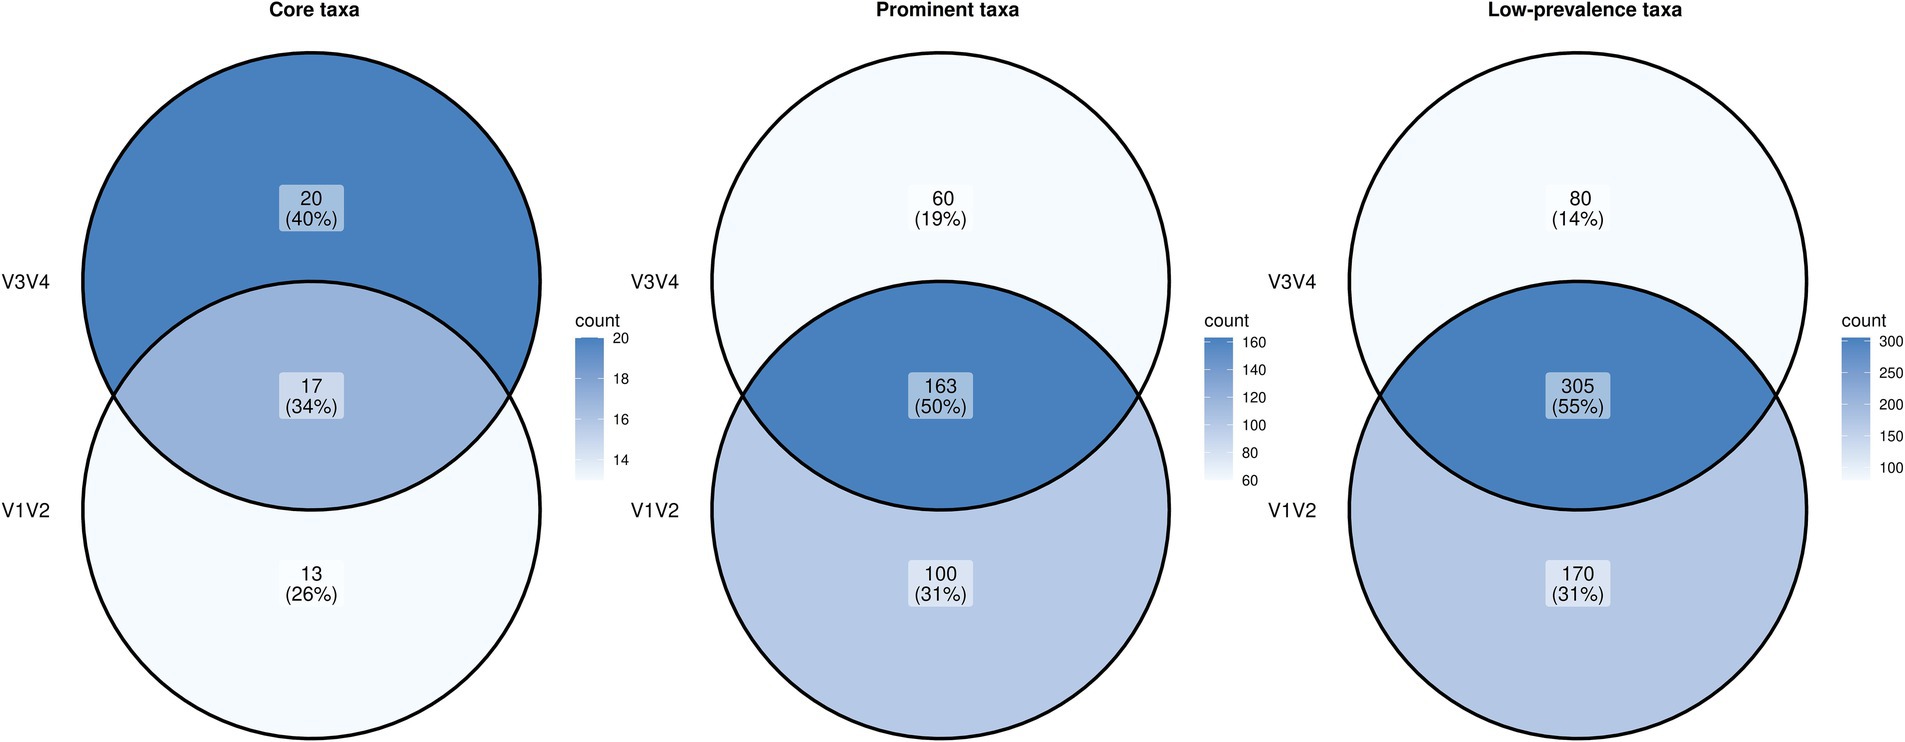
Figure 2. Venn diagram showing the intersection of the core, prominent and low-prevalence microbial taxa between V1V2 and V3V4 datasets.
3.4 Agreement between V1V2 and V3V4 abundance data among patients
The Bland–Altman (BA) analysis was performed to evaluate the agreement between the relative abundances and alpha diversity measures from V1V2 and V3V4 datasets for patients at admission (T0). BA plots visualise the differences in the microbial relative abundances between the two methods against their means.
For this analysis, we first looked at a few select dominant genera at admission that formed the common core for both methods, along with a comparison of Shannon and Chao 1 alpha diversity indices (Figure 3A). These genera included Phocaeicola_A_858,004, Gemmiger_A_73,129, Alistipes_A_871,400, Agathobacter_164117, Faecalibacterium, Mediterraneibacter_A_155,507 and Dorea_A. Of these, Gemmiger_A_73,129, Agathobacter_164117, Faecalibacterium and Mediterraneibacter_A_155,507 showed the most consistency between the two methods. They displayed low bias as their mean difference was close to zero, however, with wide limits of agreement (LOA), indicating that there were large absolute differences between abundances calculated from V1V2 data compared to V3V4 data for individual samples. Alistipes_A_871,400 showed a moderate variability between the methods, although the bias was quite minimal. In contrast, higher variability and systematic trends, indicative of proportional bias, were observed in Dorea_A and Phocaeicola_A_858,004. In the case of Dorea_A, although the overall bias was close to zero, the systematic pattern visible as a decreasing line in the BA plot was due to many patients with an abundance of zero in V1V2 data and abundance values greater than zero in the other dataset (Figure 3B). In the case of Phocaeicola_A_858,004, the change in the differences remained systematic across a range of means. An illustration of these differences has been provided in Figure 3B, which shows the scatterplot of abundances in V1V2 vs. V3V4 datasets for Faecalibacterium, Dorea_A and Agathobacter_164117. The BA plot for the Shannon Index indicated consistent overall agreement with tight clustering of points and negligible bias, except for a few outliers. Interestingly, Chao1 Index showed a bias of around 100 with V1V2 dataset consistently overestimating the index relative to the V3V4 dataset.
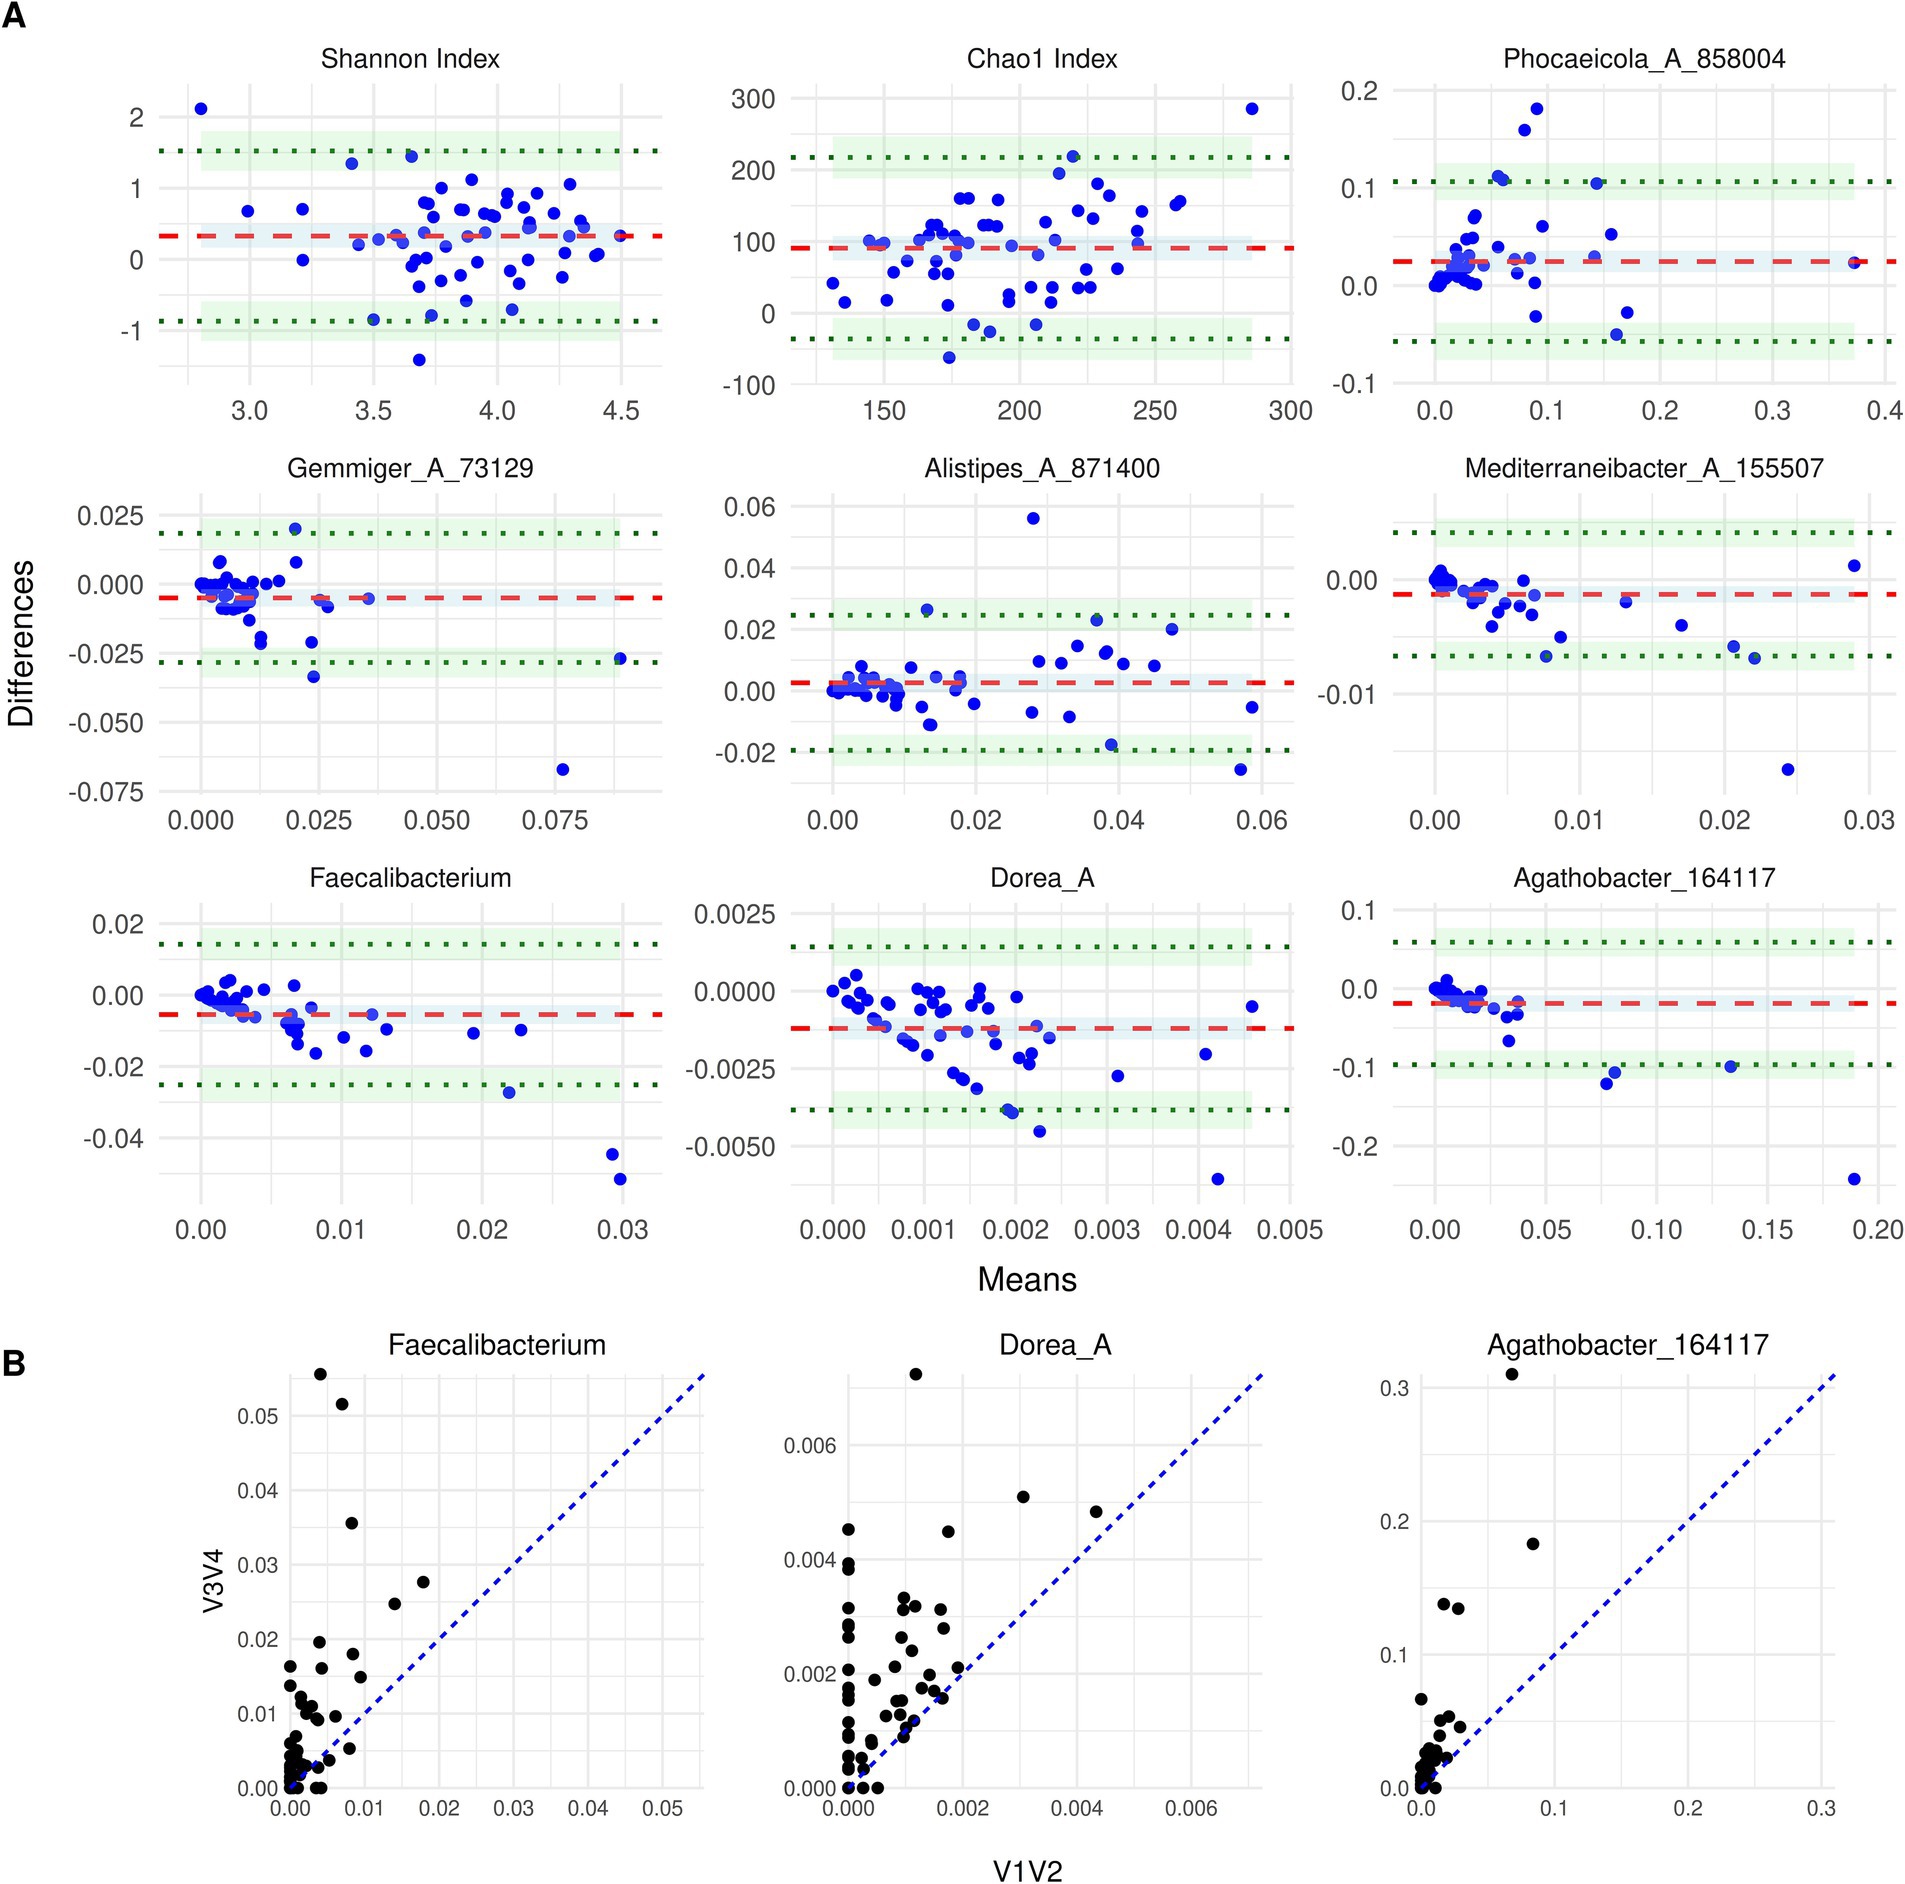
Figure 3. (A) Bland–Altman plots of genera at T0. The BA plots compare the taxon abundance between the two sequencing regions: V1V2 and V3V4. The subplots display a specific taxon or alpha diversity measure, where the x-axis denotes the mean abundance of the two methods and the y-axis denotes the difference between the two (V3V4 - V1V2). The red dashed line indicates the mean difference (bias), and the green dotted lines represent the limits of agreement. (B) Scatterplot of abundances for Faecalibacterium, Dorea_A and Agathobacter_164117 from the V1V2 and V3V4 datasets. The blue identity line (y = x) denotes the ideal case of perfect agreement and deviations from this line reflect differences between the relative abundances from the two regions.
Then, we systematically looked at the agreement between the two methods for taxa that have previously been associated with AN as listed in Di Lodovico et al. (2021) (Supplementary Figure S2). Among the genera from Di Lodovico et al., genera Ruminococcus, Roseburia, Turicibacter and Anaerotruncus showed consistent overall agreement between the methods with minimal bias and no apparent bias trends, albeit a few outliers. Genera Bifidobacterium, Clostridium, Eubacterium and Streptococcus, on the other hand, exhibited systematic trends that suggest proportional biases. For Streptococcus, the differences were higher at higher mean abundances and in the case of Bifidobacterium, the differences tend to be negative at higher microbial abundances, where the V3V4 dataset yielded consistently higher values. Furthermore, Anaerostipes showed a slight funnel-shaped pattern at lower abundances, indicating a slightly increased variability between the methods. The phyla Bacteroidota, Firmicutes and Proteobacteria showed good consistency between methods, indicating negligible systematic differences, although few outliers were observed. Meanwhile, Actinobacteria and Verrucomicrobiota showed negative proportional bias with decreasing differences at higher mean abundances.
We also looked at the relative agreement between V1V2 and V3V4 for alpha diversity indices, Shannon and Chao1 at different timepoints (Figure 4). The BA plots for the Shannon Index (Supplementary Figure S3) at various timepoints did not demonstrate a consistent measurement between V1V2 and V3V4 datasets, although the bias typically neared zero for a majority of the timepoints. Nevertheless, some heteroscedasticity was observed, especially at T8, where differences seem to rise slightly at lower Shannon diversity values. The LOAs were relatively wide, reflecting a weak concordance between the two methods over time. Looking at the Chao1 index (Supplementary Figure S3), the differences between V1V2 and V3V4 data seem to be greater and exhibit more variability than those of the Shannon Index. The average bias remains positively skewed, with the Chao1 index consistently estimating higher richness values. Furthermore, the data points were more dispersed in comparison to the Shannon index. Overall, although both indices showed some degree of consistency between V1V2 and V3V4 datasets, the Chao1 index has greater variability and a more noticeable systematic bias than Shannon.
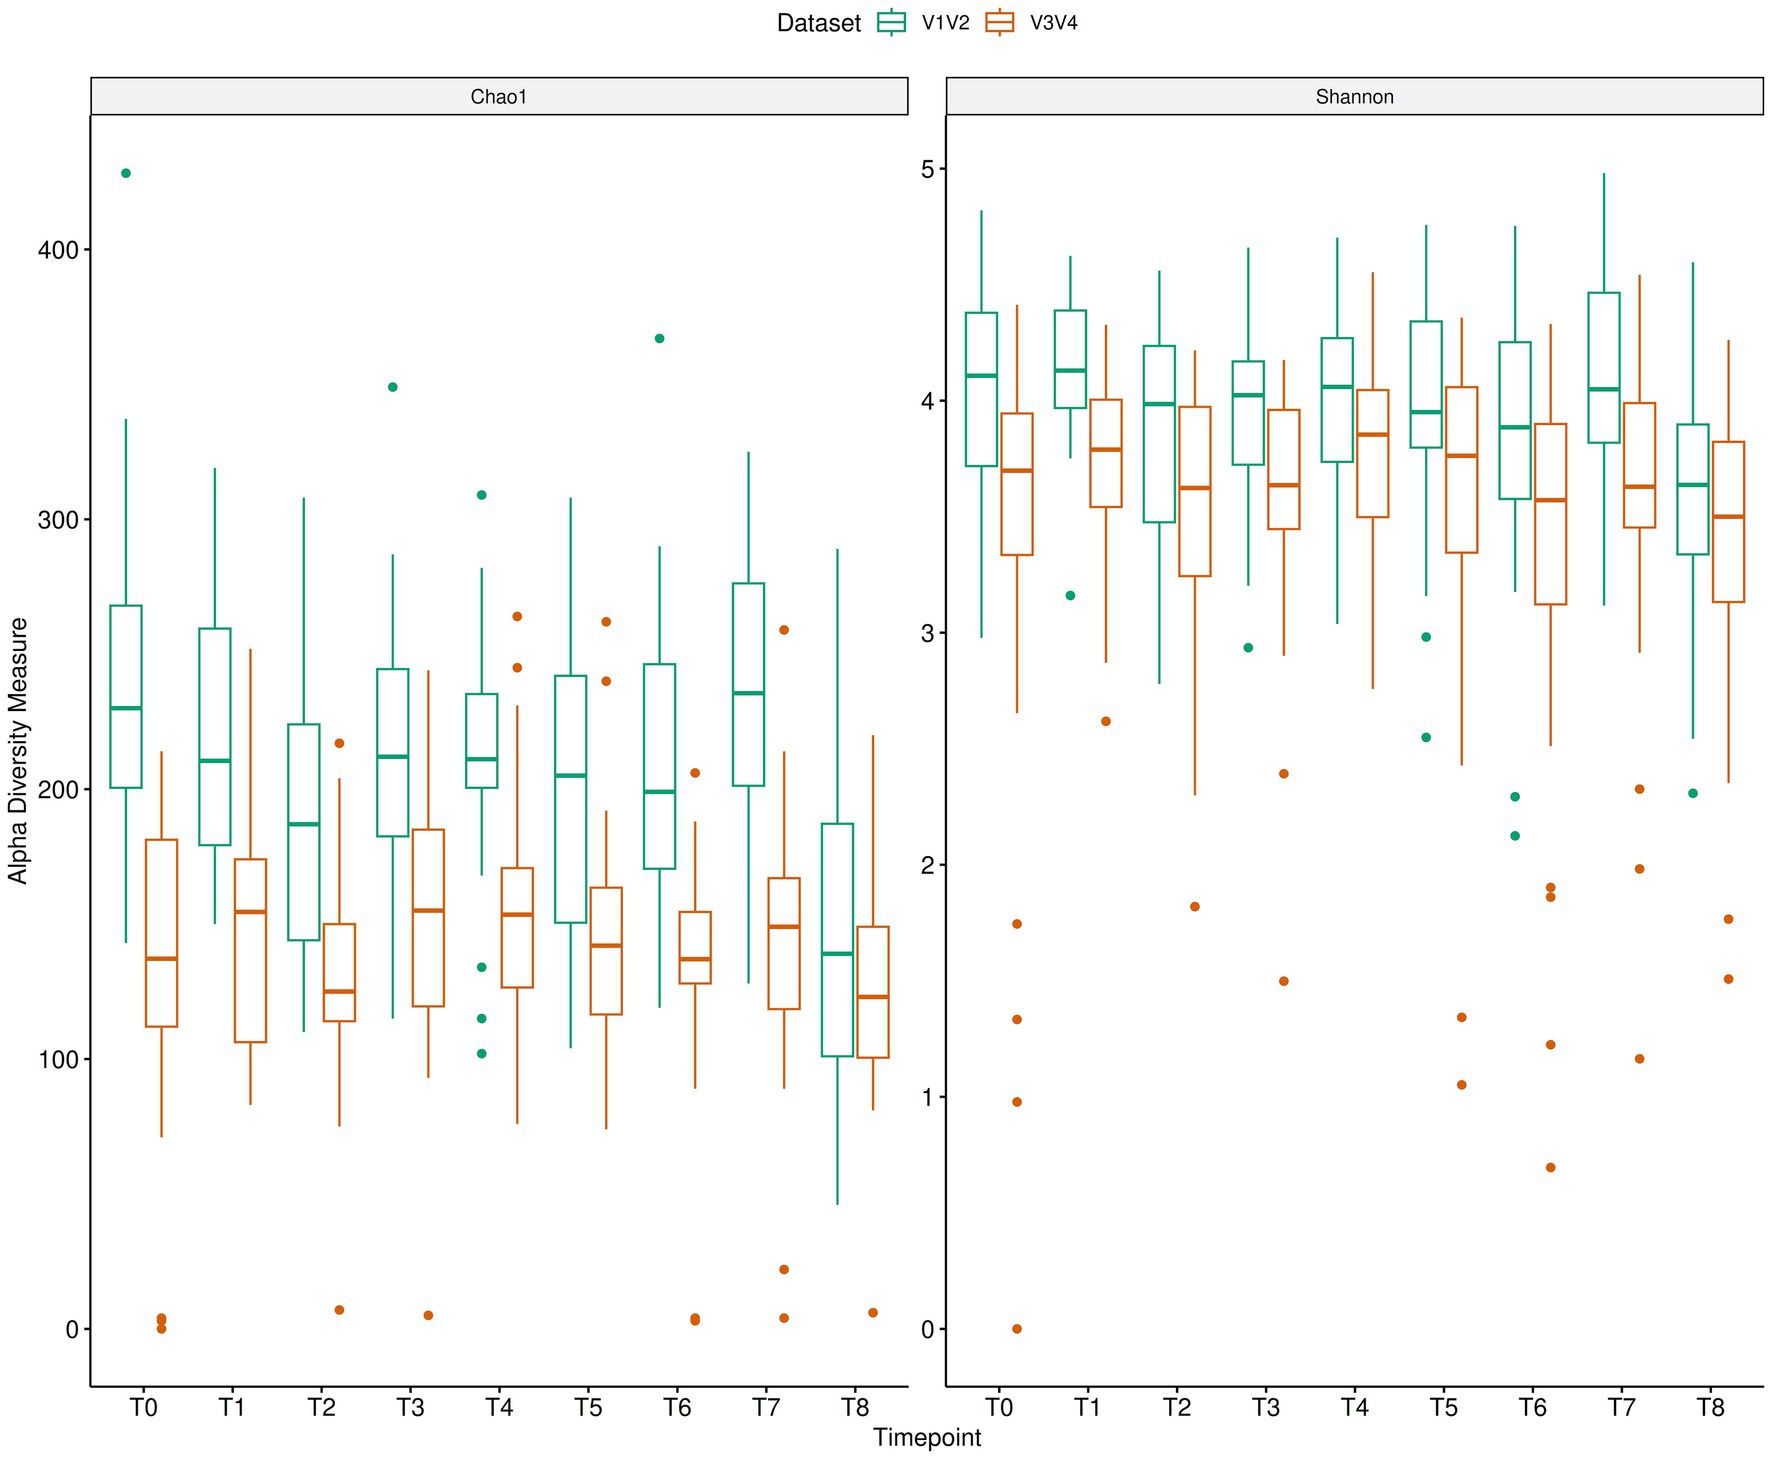
Figure 4. Longitudinal microbiome changes of AN patients depicted using alpha diversity indices (Chao1 and Shannon) for V1V2 and V3V4 data.
Finally, we also compared the agreement between the overall microbiome composition based on relative abundances from both methods for patients and controls. This was based on pairwise Jaccard and Bray–Curtis (BC) distance (beta diversity) for each subject as a measure of overall microbiome profile (dis)-similarity (Figure 5; Supplementary Figure S4). In the patients’ group, the overall microbiome profiles derived from the V1V2 and V3V4 data showed very little similarity between them with a median BC dissimilarity value of 0.38. Interestingly, 20% of the patients had a BC value greater than 0.5, indicating a high degree of dissimilarity between V1V2 and V3V4. In contrast, only 9.2% of patients had a BC value smaller than 0.2, showing good similarity between the methods. Among the patients, P009, P037 and P034 showed the highest similarity; and P051, P027 and P006 are the least similar in terms of their overall microbiome profiles from the two sequencing regions. Similarly, among healthy controls, the two methods were substantially dissimilar (median BC dissimilarity of 0.34). Of these controls, K030, K032 and K023 were the most similar and K039, K038 and K022 showed the highest dissimilarity. Figure 1 and Supplementary Figure S1 show the overall microbiota composition of these patients and controls highlighting the 15 most abundant genera.
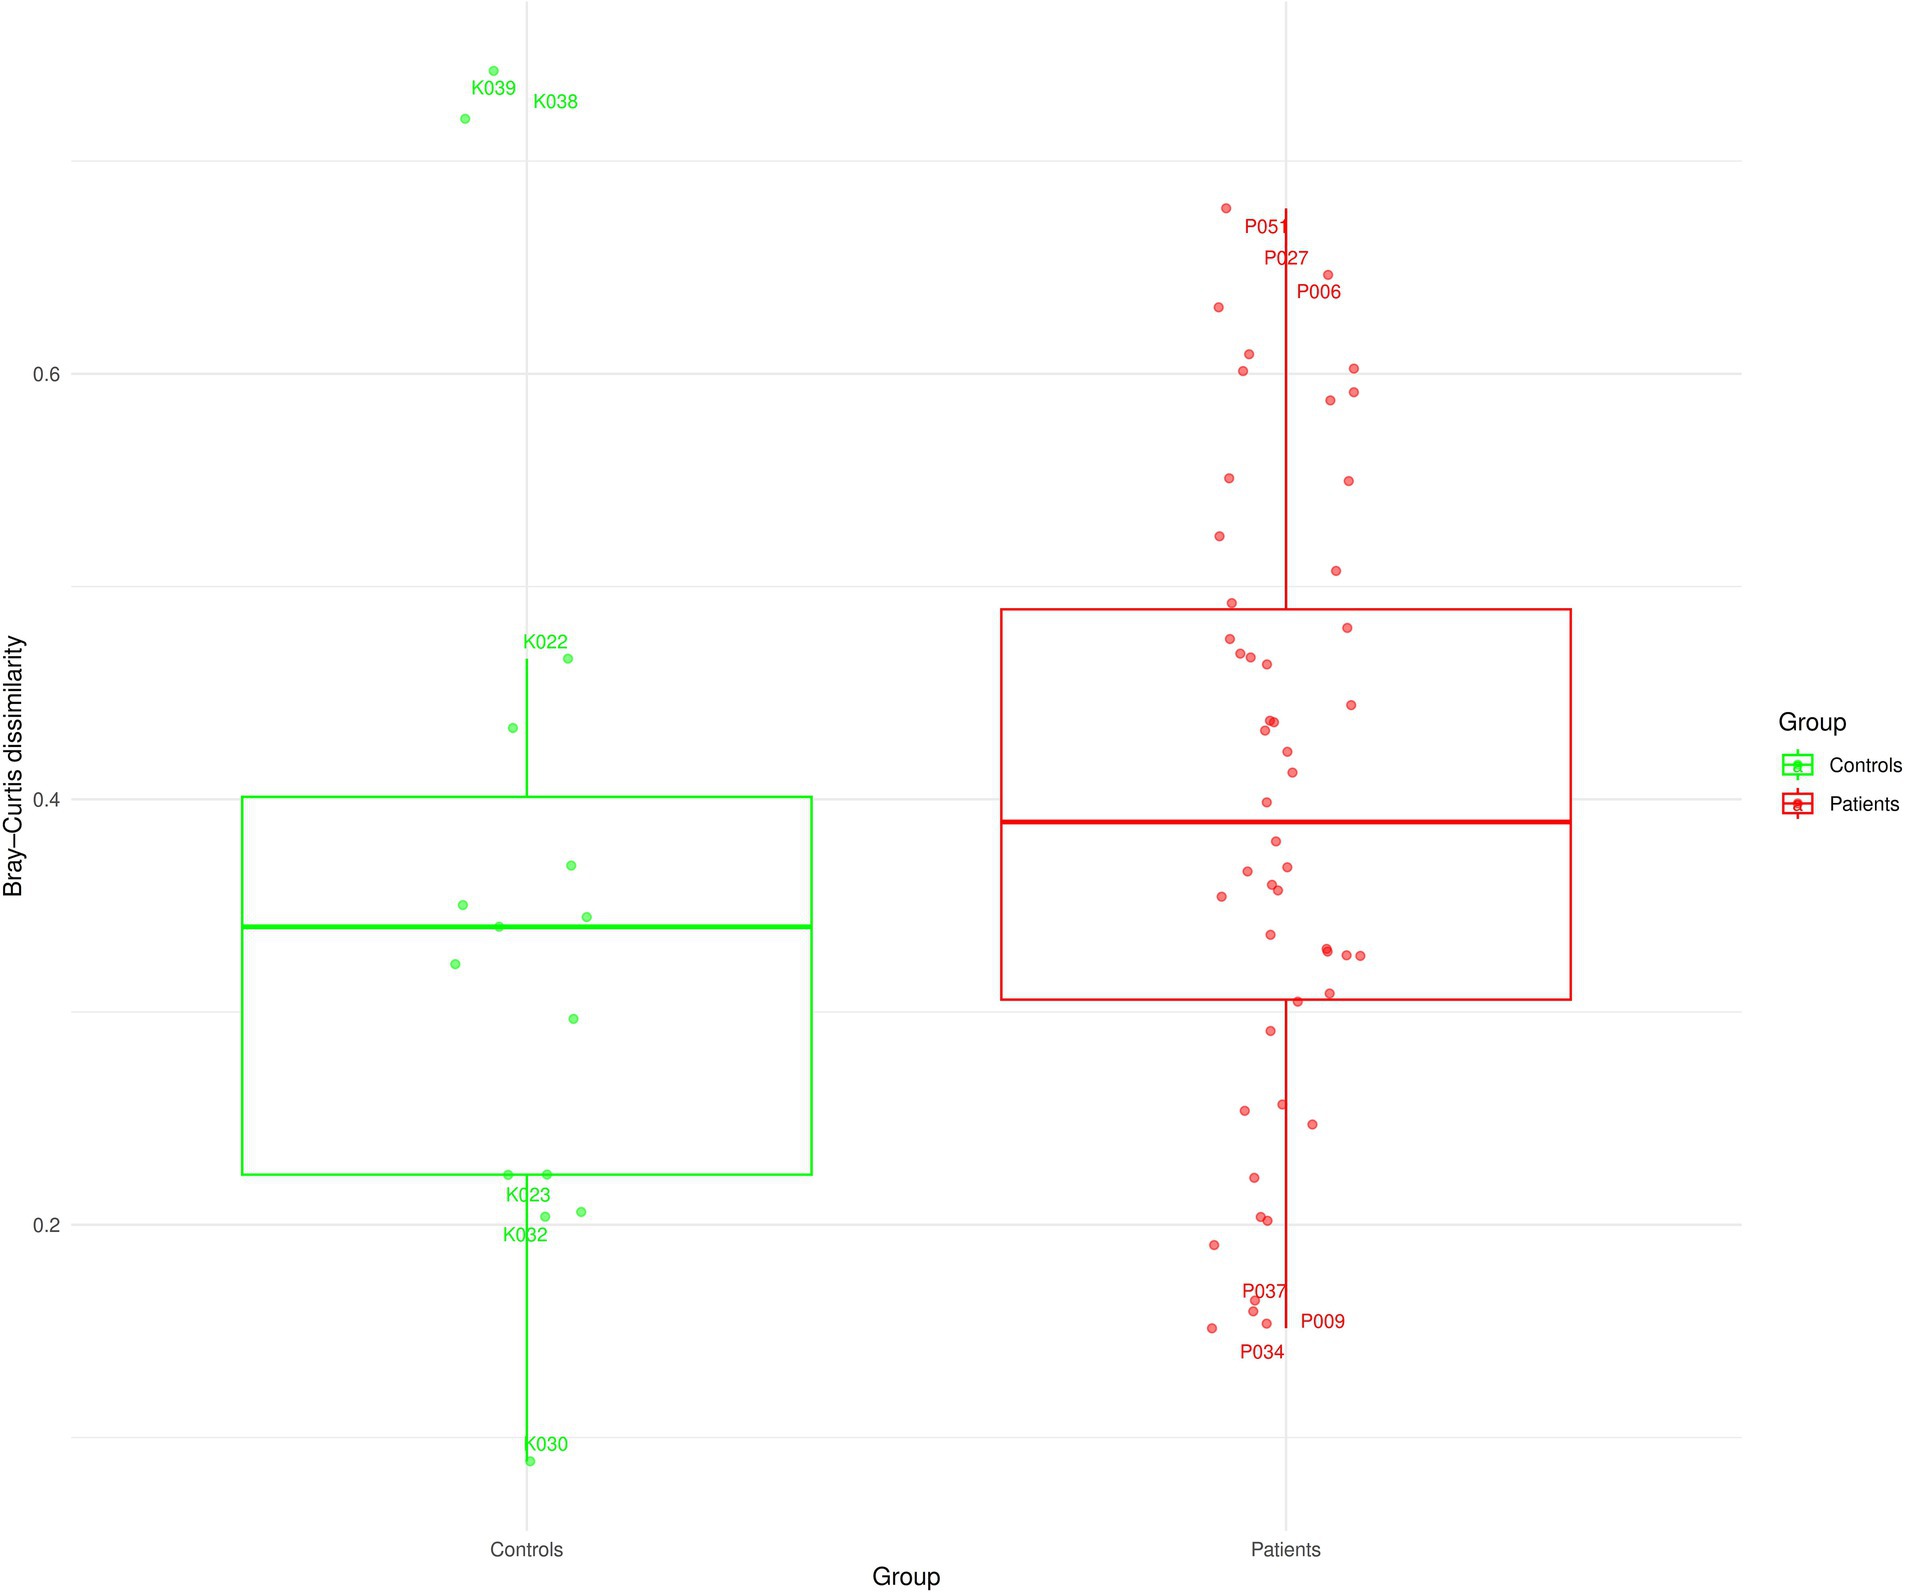
Figure 5. Distance-based analysis based on overall microbiome profiles of patients and controls at the genus level. Each boxplot summarises the within-sample distances (Bray–Curtis) of microbial relative abundances obtained from V1V2 and V3V4 regions, respectively.
3.5 Differential abundance analysis
We used the ANCOM-BC2 (Lin and Peddada, 2024) methodology to perform differential abundance analysis to compare the V1V2 and V3V4 datasets at the genus level using all available timepoints for the patient group. A total of 18 genera were identified as significantly differentially abundant after correcting for multiple testing (Figure 6). It is worth noting that since these were the same samples, the differentially abundant taxa reflect the fact that specific taxa were picked up systematically differently by either of the primers used for library preparation. The genera Bifidobacterium_388775, CAG-83, Akkermansia, and Anaerobutyricum appeared to be enriched when the V3V4 region was considered. Of these Bifidobacterium_388775 showed the maximum log fold change, indicating that it is substantially more abundant in the V3V4 region data than in V1V2 data. On the other hand, taxa like Sutterella, Haemophilus_D_735815, Turicibacter, Faecalibacillus, Erysipelatoclostridium and Streptococcus were depleted in V3V4 datasets hinting at the possibility that the V1V2 region might be better able to represent these taxa.
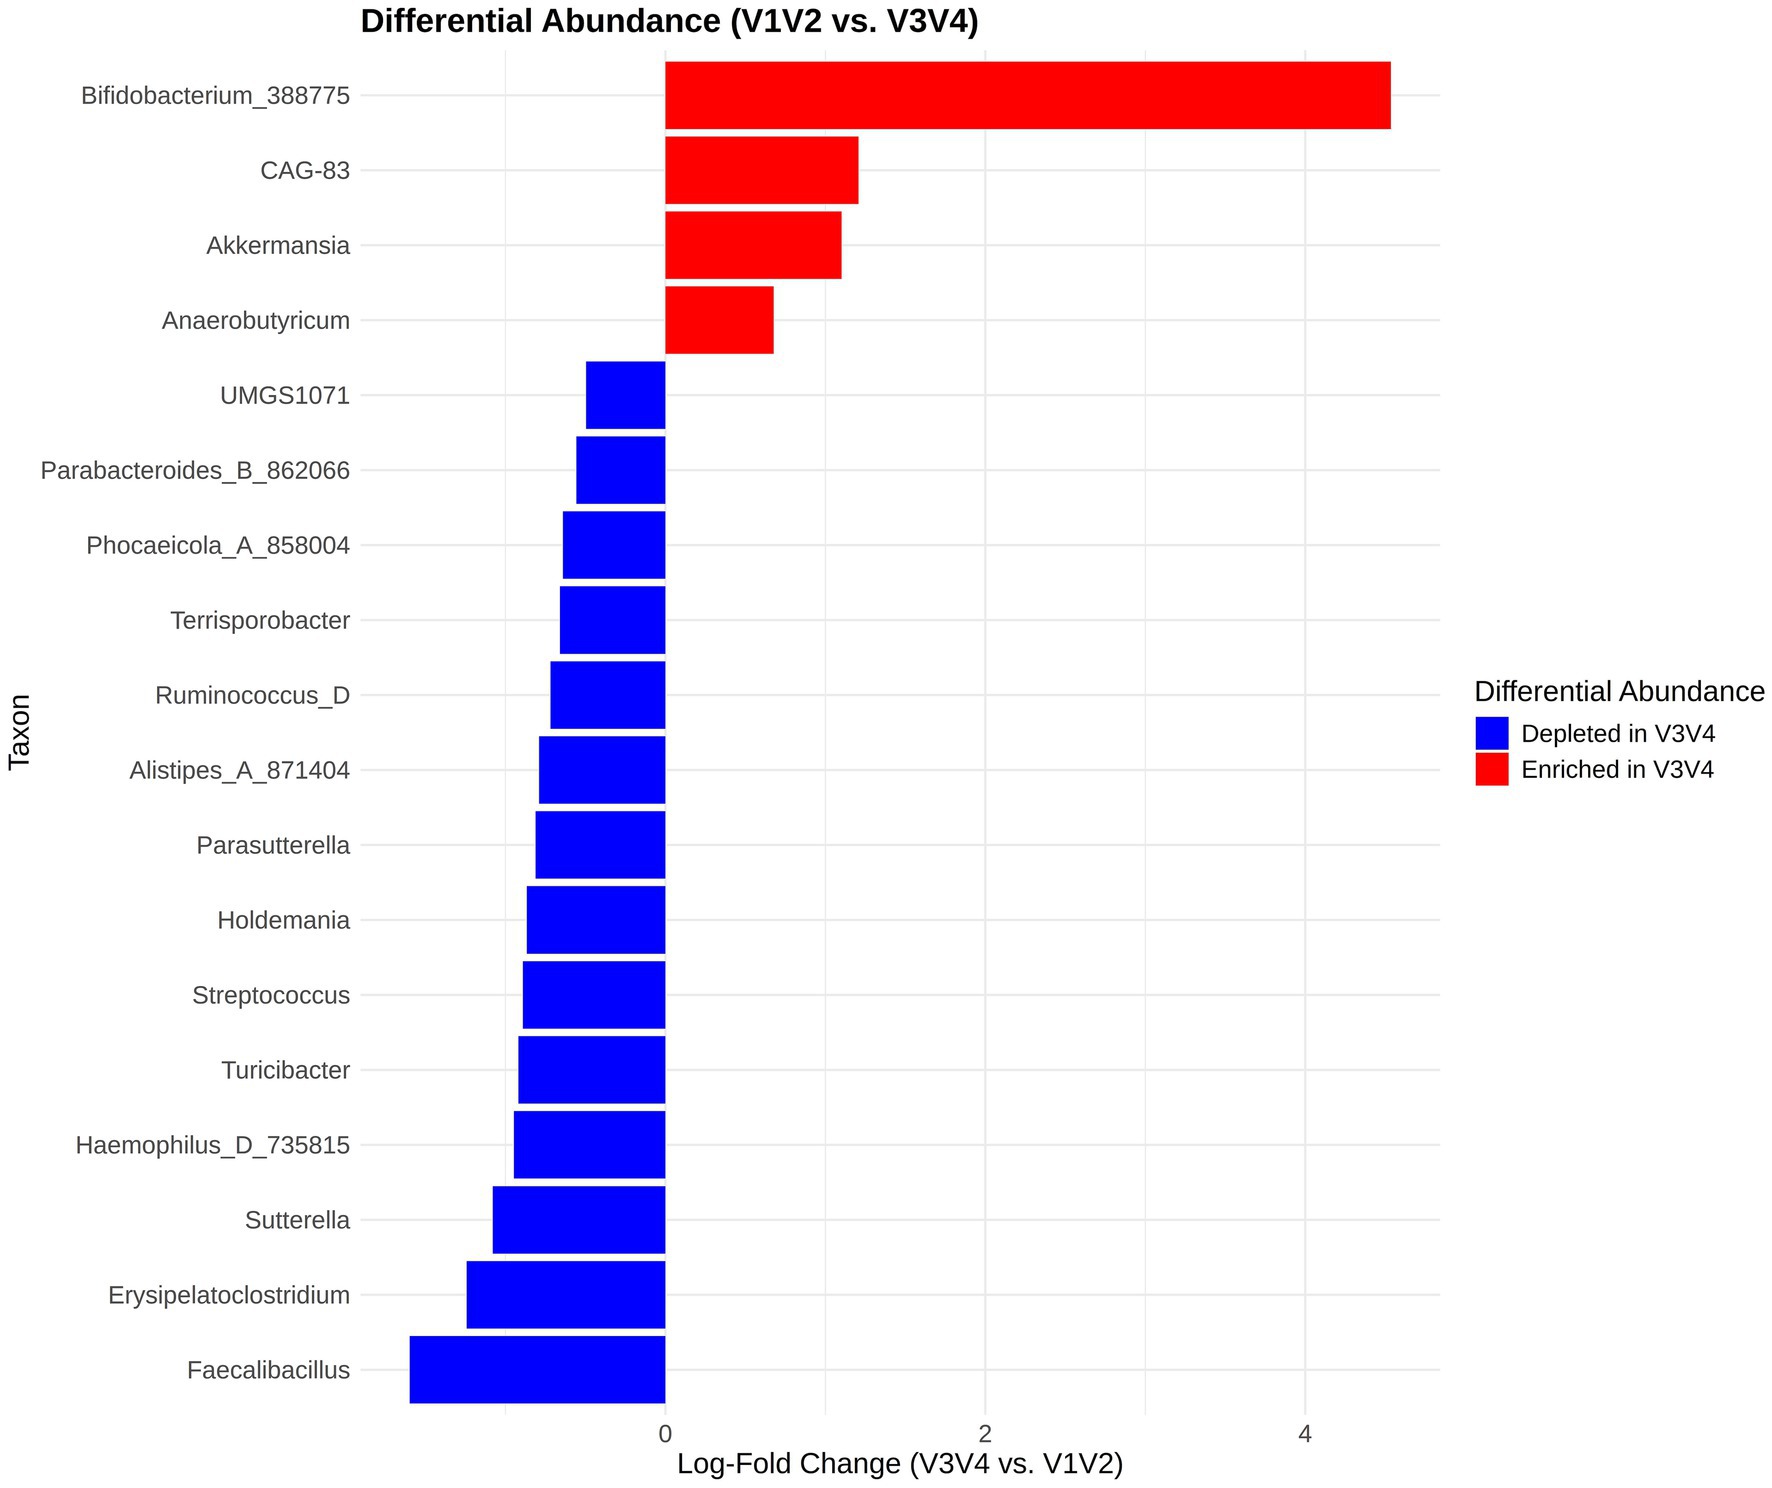
Figure 6. Differential abundance analysis using ANCOMBC2. The x-axis displays the log-fold change (LFC) of the V3V4 region relative to the V1V2 region and the y-axis shows the list of differentially abundant taxa.
We next performed a BA analysis of the differentially abundant taxa to see how much they differed based on the sequencing region (Supplementary Figure S5). The DA taxa show, expectedly, systematic differences between V1V2 and V3V4 regions as seen in the BA plots. When comparing the two sequencing methods, we see a notable variation in the abundance of these differentially abundant taxa, and in particular, taxa such as Bifidobacterium_388775, Akkermansia, Alistipes_A_871404, Phocaeicola_A_858,004, and Ruminococcus_D.
4 Discussion
Short-read sequencing uses various combinations of primer pairs that target different regions of the bacterial 16S rRNA gene to decipher the composition and abundance of bacterial communities. So far, several studies have compared different combinations of 16S rRNA primers to profile the microbiome in diverse environments (Fadeev et al., 2021; Kameoka et al., 2021; Sirichoat et al., 2021). These studies conclude similarly, arguing that the selection of the 16S rRNA region can significantly impact the analysis of microbiota diversity and composition (Heidrich et al., 2022). Additionally, many previous studies indicate that different regions provide non-concordant outcomes when applied to the same samples (Albertsen et al., 2015; Meisel et al., 2016; Graspeuntner et al., 2018). To our knowledge, these systematic assessments have not been done in the context of AN, resulting in non-consistent and inconclusive literature, due to the variety of methods applied. In this study, we compare the use of 16S rRNA hypervariable regions V1V2 and V3V4 to assess the differences and variability in microbial composition and taxonomic resolution in patients with AN and matched controls using a longitudinal cohort. We systematically look at the agreement of taxonomic abundances between the two regions as it might have an impact on downstream statistical analysis.
We observe that the number of taxa and Chao1 alpha diversity measure detected by amplifying and analysing the V1V2 region is higher compared to the V3V4 region across both patient and control groups. This finding is in line with previous reports, which suggest that the V1V2 region is more sensitive to certain bacterial taxa, capturing more diverse microbes (Heidrich et al., 2022; López-Aladid et al., 2023). Even though the detection of taxa is higher for this region, the region is sparse in terms of proportion. Conversely, the V3V4 dataset shows a higher density despite fewer taxa detected, implying that it could give a more robust identification of common taxa across samples. We also noted a difference in the sequencing depths, where V1V2 yields more reads, which may have resulted in the region detecting a higher number of taxa. This difference is likely attributable to the distinct sequencing chemistries used: V1V2 was sequenced with 250 bp paired-end (250PE) reads, while V3V4 was sequenced with 300 bp paired-end (300PE) reads. The longer read length in the 300PE chemistry typically leads to a greater loss of reads due to reduced quality towards the end of the reads, which may explain the lower read count and subsequently lower number of taxa detected in the V3V4 dataset. These observations and differences reiterate the importance of choosing a methodology and 16S hypervariable region based on the study aims, especially involving the balance of sensitivity and consistency in taxonomic detection.
An important aspect of this study is its design; it looks at both patients and matched healthy controls longitudinally with a focus on three key timepoints for the patients- hospital admission, discharge, and one-year follow-up. We observe that the dominant genera were consistently present across both datasets and sample groups at these different timepoints. Some of the main taxa such as Bacteroides H, Faecalibacterium and Phocaeicola A 858004 are detected consistently, suggesting they are present steadily in the gut microbiome over time. However, the low abundant and rare taxa are highly variable and no systematic pattern is observed. This shows that the highly abundant dominant taxa can be expectedly detected across the two sequencing regions but the rare taxa may be more influenced by sequencing depth and biases introduced during the study. An analysis of this study focusing on associations between the microbiome and clinical data was previously published (Andreani et al., 2024).
Furthermore, we used Bland–Altman analysis to compare the agreement of relative abundance measurements between the two sequencing regions to evaluate the biases introduced by the methods. While some taxa, including Faecalibacterium and Mediterraneibacter_A_155,507, showed sufficient agreement between the methods, most of them exhibited variability and differences. When we looked at alpha diversity at different time points, the Shannon index showed relatively consistent agreement but the Chao1 index indicated variability. We also systematically looked at taxa previously associated with AN (Di Lodovico et al., 2021). Of those AN-related taxa, a few genera such as Ruminococcus, Roseburia, Turicibacter and Anaerotruncus showed good overall agreement while the others showed inconsistencies and differences. Taken together, the lack of strong agreement between the methods again illustrates the impact of the choice of the sequencing region can have on profiling the microbiome, especially for certain taxonomic groups.
Our analysis of differential abundance showed that 18 taxa showed significant systematic differences in the same samples when analysed by V1V2 or V3V4 regions. V3V4 dataset showed enrichment of certain taxa, such as Bifidobacterium_388775, CAG-83, Akkermansia and Anaerobutyricum. Bifidobacterium_388775 also exhibited the highest log fold change. In contrast, taxa such as Sutterella, Haemophilus_D_735815, Turicibacter and Faecalibacillus were depleted in this dataset. We then performed a BA analysis of these differentially abundant taxa which revealed systematic bias and differences, reiterating that the choice of sequencing region influences abundance estimates and thereby the downstream microbiome analysis and interpretation.
The work discussed here accentuates the significance of methodological considerations in the characterisation of the microbiome of patients diagnosed with AN. At different timepoints, the most abundant genera were frequently observed but it is also important to note that the results from differences in taxonomic detection, diversity estimates, and differential abundance are significant due to potential biases introduced by the choices of selecting the sequencing region. We want to emphasise that when datasets generated using different 16S rRNA regions are compared they need to be interpreted carefully since the sequencing choices affect the resulting taxa detection and relative abundance measurements. Studies should prioritise the sequencing region selection depending on their specific research questions, especially when comparing taxonomic profiles across multiple datasets. In this regard, it is worth mentioning that some studies have tackled these methodological challenges in 16S rRNA-based sequencing. For instance, Fuks et al. have suggested that a combination of two or more hypervariable regions can increase resolution when identifying bacterial taxa (Fuks et al., 2018).
The relative abundance data is intrinsically compositional which could lead to biases while estimating differential abundance. Since our study heavily relies on such data, it could be a crucial drawback and may bias our results. In the future, using absolute quantification methods could provide more robust interpretations of our findings. Furthermore, longitudinal studies including larger sample sizes and metagenomic validation could give us more concrete generalizability of our results. To conclude, we emphasise the importance of choosing an appropriate sequencing region for the study aims as it influences the microbiome profiles significantly. From our study, we observed that the V1V2 region detected a larger number of taxa but indicated higher sparsity as well, while the V3V4 region shows consistency of detection across our samples. Neither of the approaches appears to be systematically better, regardless of these variations. However, the observed differences highlight the variability that is present currently in the literature due to the selection of sequencing regions.
Data availability statement
The datasets presented in this article are not readily available because the informed consent form used for the study does not cover depositing the data in a public repository due to privacy/ethical concerns; since the study participants were minors. Requests to access the datasets should be directed to the corresponding author.
Ethics statement
The studies involving humans were approved by RWTH Aachen University Hospital Ethics Committee. The studies were conducted in accordance with the local legislation and institutional requirements. Written informed consent for participation in this study was provided by the participants’ legal guardians/next of kin.
Author contributions
AS: Conceptualization, Data curation, Formal analysis, Methodology, Writing – original draft, Writing – review & editing. NA: Data curation, Writing – review & editing. LK: Writing – review & editing. BH-D: Funding acquisition, Writing – review & editing. JS: Funding acquisition, Writing – review & editing. JB: Funding acquisition, Writing – review & editing. AD: Conceptualization, Funding acquisition, Supervision, Writing – review & editing.
Funding
The author(s) declare that financial support was received for the research and/or publication of this article. This work was supported by the ERANET-NEURON 2018 (MIGBAN grants: 01EW1906A-01EW1906B) grant and Deutsche Forschungsgemeinschaft (grants: BA 2863/14–1), project number 509492174; SE 2787/3–1; DE1614/4–1; EXC2167 (Precision Medicine in Chronic Inflammation).
Conflict of interest
The authors declare that the research was conducted in the absence of any commercial or financial relationships that could be construed as a potential conflict of interest.
Correction note
This article has been corrected with minor changes. These changes do not impact the scientific content of the article.
Generative AI statement
The authors declare that no Gen AI was used in the creation of this manuscript.
Any alternative text (alt text) provided alongside figures in this article has been generated by Frontiers with the support of artificial intelligence and reasonable efforts have been made to ensure accuracy, including review by the authors wherever possible. If you identify any issues, please contact us.
Publisher’s note
All claims expressed in this article are solely those of the authors and do not necessarily represent those of their affiliated organizations, or those of the publisher, the editors and the reviewers. Any product that may be evaluated in this article, or claim that may be made by its manufacturer, is not guaranteed or endorsed by the publisher.
Supplementary material
The Supplementary material for this article can be found online at: https://www.frontiersin.org/articles/10.3389/fmicb.2025.1665847/full#supplementary-material
References
Abellan-Schneyder, I., Matchado, M. S., Reitmeier, S., Sommer, A., Sewald, Z., Baumbach, J., et al. (2021). Primer, pipelines, parameters: issues in 16S rRNA gene sequencing. mSphere 6:e01202-20. doi: 10.1128/mSphere.01202-20
Albertsen, M., Karst, S. M., Ziegler, A. S., Kirkegaard, R. H., and Nielsen, P. H. (2015). Back to basics—the influence of DNA extraction and primer choice on phylogenetic analysis of activated sludge communities. PLoS One 10:e0132783. doi: 10.1371/journal.pone.0132783
Andreani, N. A., Sharma, A., Dahmen, B., Specht, H. E., Mannig, N., Ruan, V., et al. (2024). Longitudinal analysis of the gut microbiome in adolescent patients with anorexia nervosa: microbiome-related factors associated with clinical outcome. Gut Microbes 16:2304158. doi: 10.1080/19490976.2024.2304158
Arcelus, J., Mitchell, A. J., Wales, J., and Nielsen, S. (2011). Mortality rates in patients with anorexia nervosa and other eating disorders: a meta-analysis of 36 studies. Arch. Gen. Psychiatry 68, 724–731. doi: 10.1001/archgenpsychiatry.2011.74
Barnett, D. J. m., Arts, I. C. w., and Penders, J. (2021). microViz: an R package for microbiome data visualization and statistics. J. Open Source Softw. 6:3201. doi: 10.21105/joss.03201
Bolyen, E., Rideout, J. R., Dillon, M. R., Bokulich, N. A., Abnet, C., Al-Ghalith, G. A., et al. (2018). QIIME 2: reproducible, interactive, scalable, and extensible microbiome data science. PeerJ Preprints. doi: 10.7287/peerj.preprints.27295v2
Bulik, C. M., Flatt, R., Abbaspour, A., and Carroll, I. (2019). Reconceptualizing anorexia nervosa. Psychiatry Clin. Neurosci. 73, 518–525. doi: 10.1111/pcn.12857
Callahan, B. J., McMurdie, P. J., Rosen, M. J., Han, A. W., Johnson, A. J. A., and Holmes, S. P. (2016). DADA2: high-resolution sample inference from Illumina amplicon data. Nat. Methods 13, 581–583. doi: 10.1038/nmeth.3869
Caporaso, J. G., Lauber, C. L., Walters, W. A., Berg-Lyons, D., Lozupone, C. A., Turnbaugh, P. J., et al. (2011). Global patterns of 16S rRNA diversity at a depth of millions of sequences per sample. Proceed. National Acad. Sci. 108, 4516–4522. doi: 10.1073/pnas.1000080107
Chen, H., and Boutros, P. C. (2011). VennDiagram: a package for the generation of highly-customizable Venn and Euler diagrams in R. BMC Bioinformatics 12:35. doi: 10.1186/1471-2105-12-35
Di Lodovico, L., Mondot, S., Doré, J., Mack, I., Hanachi, M., and Gorwood, P. (2021). Anorexia nervosa and gut microbiota: a systematic review and quantitative synthesis of pooled microbiological data. Prog. Neuro-Psychopharmacol. Biol. Psychiatry 106:110114. doi: 10.1016/j.pnpbp.2020.110114
Fadeev, E., Cardozo-Mino, M. G., Rapp, J. Z., Bienhold, C., Salter, I., Salman-Carvalho, V., et al. (2021). Comparison of two 16S rRNA primers (V3–V4 and V4–V5) for studies of Arctic microbial communities. Front. Microbiol. 12:637526. doi: 10.3389/fmicb.2021.637526
Fuks, G., Elgart, M., Amir, A., Zeisel, A., Turnbaugh, P. J., Soen, Y., et al. (2018). Combining 16S rRNA gene variable regions enables high-resolution microbial community profiling. Microbiome 6:17. doi: 10.1186/s40168-017-0396-x
Graspeuntner, S., Loeper, N., Künzel, S., Baines, J. F., and Rupp, J. (2018). Selection of validated hypervariable regions is crucial in 16S-based microbiota studies of the female genital tract. Sci. Rep. 8:9678. doi: 10.1038/s41598-018-27757-8
Grice, E. A., Kong, H. H., Conlan, S., Deming, C. B., Davis, J., Young, A. C., et al. (2009). Topographical and temporal diversity of the human skin microbiome. Science 324, 1190–1192. doi: 10.1126/science.1171700
Guerrero-Preston, R., Godoy-Vitorino, F., Jedlicka, A., Rodríguez-Hilario, A., González, H., Bondy, J., et al. (2016). 16S rRNA amplicon sequencing identifies microbiota associated with oral cancer, human papilloma virus infection and surgical treatment. Oncotarget 7, 51320–51334. doi: 10.18632/oncotarget.9710
Heidrich, V., Inoue, L. T., Asprino, P. F., Bettoni, F., Mariotti, A. C. H., Bastos, D. A., et al. (2022). Choice of 16S ribosomal RNA primers impacts male urinary microbiota profiling. Front. Cell. Infect. Microbiol. 12:862338. doi: 10.3389/fcimb.2022.862338
Herpertz-Dahlmann, B., Bonin, E., and Dahmen, B. (2021). Can you find the right support for children, adolescents and young adults with anorexia nervosa: access to age-appropriate care systems in various healthcare systems. Eur. Eat. Disord. Rev. 29, 316–328. doi: 10.1002/erv.2825
Hills, R., Pontefract, B., Mishcon, H., Black, C., Sutton, S., and Theberge, C. (2019). Gut microbiome: profound implications for diet and disease. Nutrients 11:1613. doi: 10.3390/nu11071613
Kameoka, S., Motooka, D., Watanabe, S., Kubo, R., Jung, N., Midorikawa, Y., et al. (2021). Benchmark of 16S rRNA gene amplicon sequencing using Japanese gut microbiome data from the V1–V2 and V3–V4 primer sets. BMC Genomics 22:527. doi: 10.1186/s12864-021-07746-4
Kassambara, A.. (2023). Ggpubr: “ggplot2” based publication ready plots. Available online at: https://cran.r-project.org/web/packages/ggpubr/index.html (Accessed February 26, 2025).
Kehrmann, J., Veckollari, B., Schmidt, D., Schildgen, O., Schildgen, V., Wagner, N., et al. (2017). The lung microbiome in patients with pneumocystosis. BMC Pulm. Med. 17:170. doi: 10.1186/s12890-017-0512-5
Lin, H., and Peddada, S. D. (2024). Multigroup analysis of compositions of microbiomes with covariate adjustments and repeated measures. Nat. Methods 21, 83–91. doi: 10.1038/s41592-023-02092-7
López-Aladid, R., Fernández-Barat, L., Alcaraz-Serrano, V., Bueno-Freire, L., Vázquez, N., Pastor-Ibáñez, R., et al. (2023). Determining the most accurate 16S rRNA hypervariable region for taxonomic identification from respiratory samples. Sci. Rep. 13:3974. doi: 10.1038/s41598-023-30764-z
Martin Bland, J., and Altman, D. G. (1986). Statistical methods for assessing agreement between two methods of clinical measurement. Lancet 327, 307–310. doi: 10.1016/S0140-6736(86)90837-8
McDonald, D., Jiang, Y., Balaban, M., Cantrell, K., Zhu, Q., Gonzalez, A., et al. (2024). Greengenes2 unifies microbial data in a single reference tree. Nat. Biotechnol. 42, 715–718. doi: 10.1038/s41587-023-01845-1
McMurdie, P. J., and Holmes, S. (2013). Phyloseq: an R package for reproducible interactive analysis and graphics of microbiome census data. PLoS One 8:e61217. doi: 10.1371/journal.pone.0061217
McMurdie, P. J., and Holmes, S. (2014). Waste not, want not: why rarefying microbiome data is inadmissible. PLoS Comput. Biol. 10:e1003531. doi: 10.1371/journal.pcbi.1003531
Meisel, J. S., Hannigan, G. D., Tyldsley, A. S., SanMiguel, A. J., Hodkinson, B. P., Zheng, Q., et al. (2016). Skin microbiome surveys are strongly influenced by experimental design. J. Invest. Dermatol. 136, 947–956. doi: 10.1016/j.jid.2016.01.016
Mukherjee, C., Beall, C. J., Griffen, A. L., and Leys, E. J. (2018). High-resolution ISR amplicon sequencing reveals personalized oral microbiome. Microbiome 6:153. doi: 10.1186/s40168-018-0535-z
Neu, A. T., Allen, E. E., and Roy, K. (2021). Defining and quantifying the core microbiome: challenges and prospects. Proc. Natl. Acad. Sci. 118:e2104429118. doi: 10.1073/pnas.2104429118
Oksanen, J., Simpson, G. L., Blanchet, F. G., Kindt, R., Legendre, P., Minchin, P. R., et al. (2022). Vegan: community ecology package. Available at: https://CRAN.R-project.org/package=vegan (Accessed October 11, 2022).
Peciña, M., Bohnert, A. S. B., Sikora, M., Avery, E. T., Langenecker, S. A., Mickey, B. J., et al. (2015). Association between placebo-activated neural systems and antidepressant responses: neurochemistry of placebo effects in major depression. JAMA Psychiatry 72, 1087–1094. doi: 10.1001/jamapsychiatry.2015.1335
Santacroce, L., Man, A., Charitos, I. A., Haxhirexha, K., and Topi, S. (2021). Current knowledge about the connection between health status and gut microbiota from birth to elderly. A narrative review. Front Biosci 26, 135–148. doi: 10.52586/4930
Schulz, N., Belheouane, M., Dahmen, B., Ruan, V. A., Specht, H. E., Dempfle, A., et al. (2021). Gut microbiota alteration in adolescent anorexia nervosa does not normalize with short-term weight restoration. Int. J. Eat. Disord. 54, 969–980. doi: 10.1002/eat.23435
Shetty, S. (2023). biomeUtils: utilities for microbiome analytics, p 0. R package version 0.022. Available at: https://rivm-iiv-microbiome.github.io/biomeUtils/index.html
Sirichoat, A., Sankuntaw, N., Engchanil, C., Buppasiri, P., Faksri, K., Namwat, W., et al. (2021). Comparison of different hypervariable regions of 16S rRNA for taxonomic profiling of vaginal microbiota using next-generation sequencing. Arch. Microbiol. 203, 1159–1166. doi: 10.1007/s00203-020-02114-4
Wickham, H., Averick, M., Bryan, J., Chang, W., McGowan, L. D., François, R., et al. (2019). Welcome to the tidyverse. J. Open Source Softw. 4:1686. doi: 10.21105/joss.01686
Keywords: gut microbiome, anorexia nervosa, eating disorder, gut-brain axis, longitudinal study, 16S rRNA, V1V2, V3V4
Citation: Sharma A, Andreani NA, Keller L, Herpertz-Dahlmann B, Seitz J, Baines JF and Dempfle A (2025) Comparison of 16S ribosomal RNA hypervariable regions in microbiome studies of anorexia nervosa. Front. Microbiol. 16:1665847. doi: 10.3389/fmicb.2025.1665847
Edited by:
Laura Mitrea, University of Agricultural Sciences and Veterinary Medicine of Cluj-Napoca, RomaniaReviewed by:
Yu Zongliang, Beijing University of Chinese Medicine, ChinaWalter J. Sandoval-Espinola, Universidad Nacional de Asunción, Paraguay
Copyright © 2025 Sharma, Andreani, Keller, Herpertz-Dahlmann, Seitz, Baines and Dempfle. This is an open-access article distributed under the terms of the Creative Commons Attribution License (CC BY). The use, distribution or reproduction in other forums is permitted, provided the original author(s) and the copyright owner(s) are credited and that the original publication in this journal is cited, in accordance with accepted academic practice. No use, distribution or reproduction is permitted which does not comply with these terms.
*Correspondence: Astrid Dempfle, ZGVtcGZsZUBtZWRpbmZvLnVuaS1raWVsLmRl