 Marguerite R. Butler1
 Jana Hrncirova1,2
 Terry A. Jacot3
 Sucharita Dutta3
 Meredith R. Clark3
 Gustavo F. Doncel3John B. Cooper1*
- 1Department of Chemistry and Biochemistry, Old Dominion University, Norfolk, VA, United States
- 2Department of Physical and Macromolecular Chemistry, Charles University, Prague, Czechia
- 3CONRAD, Department of Obstetrics and Gynecology, Eastern Virginia Medical School, Norfolk, VA, United States
This study introduces a convenient and ultra-sensitive method of detection and quantification of the antiviral drug, tenofovir (TFV), by surface-enhanced Raman spectroscopy (SERS). Novel spatially resolved instrumentation for spectral acquisition and subsequent statistical analysis for hot spot selection was developed for convenient quantification of TFV in an aqueous matrix. Methods of statistical analysis include the use of partial least squares (PLS) regression vector analysis and spectral ranking by quality indices computed using CHAOS theory. Hydroxylamine-reduced Ag colloidal nanoparticles evaporated to dryness on an aluminum well-plate were used as the SERS substrate. To our knowledge, quantification of TFV down to 25 ng/mL by SERS, comprising clinically relevant concentrations, has not been previously reported. Furthermore, in this work we propose a novel method of quantification of aqueous TFV standards by SERS using statistical treatment of data by PLS and CHAOS theory. Based on these data, we propose future studies to develop a method of TFV detection and quantification in biological samples, beneficial to clinicians for rapid assessment of drug adherence during the treatment and prevention of viral diseases.
1 Introduction
Viral diseases are on the rise (Baker et al., 2022). Among them, human immunodeficiency virus (HIV) remains a prevalent infection, and according to UNAIDS, as of 2021, there were approximately 38.4 million individuals living with HIV worldwide, and about 1.3 million new infections per year. With HIV resources available totaling an estimated $21.4 billion USD, it is estimated that 21.4 million individuals are accessing antiretroviral therapy and another 1.6 million are using these drugs for prevention of HIV (UNAIDS, 2022). Strict adherence to daily pill regimens is critical not only for the success of treatment and prevention of infection but also to avoid the emergence of drug resistance. Today, there is no commercially available point-of-care assay that may provide clinicians with objective evidence of the patients’ drug adherence profile. Most of the assays used to quantify antiretroviral (ARV) drugs rely on liquid chromatography with tandem mass spectrometry (LC/MS/MS), an accurate but expensive and complex method that requires specialized labs to be performed. Two lateral flow assays have been reported for the qualitative detection of tenofovir in urine (Hermans et al., 2023; McCluskey et al., 2023).
Among ARV drugs, tenofovir (TFV) is one widely used as part of the first-line therapeutic and preventive regimens (Venter et al., 2017). TFV is a synthetic acyclic nucleotide analogue of adenosine (see Figure 1) belonging to the medication class nucleoside reverse transcriptase inhibitors (NRTIs). TFV has a molecular formula of C9H14N5O4P and a molecular weight of 287.21 g/mol. TFV itself has poor oral bioavailability and is commonly administered in a prodrug form, tenofovir disoproxil fumarate (TDF) or tenofovir alafenamide fumarate (TAF). Briefly, following oral administration, TFV is activated via bi-phosphorylation and inhibits chain elongation by competing with deoxyadenosine 5′- triphosphate for chain incorporation during the synthesis of new viral DNA. When TFV is inserted in the chain in place of deoxyadenosine 5′- triphosphate, chain termination is induced, ultimately inhibiting viral DNA replication (National Center for Biotechnology Information, 2023). Tenofovir is used in the therapy of HIV and hepatitis B virus (HBV) infection (National Center for Biotechnology Information, 2023).
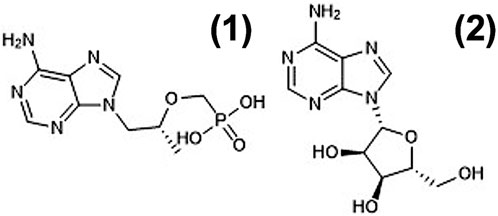
FIGURE 1. Chemical structures of 1) TFV and 2) adenosine.
Surface-enhanced Raman spectroscopy (SERS) is a highly sensitive analytical method that utilizes surface plasmon resonances (SPR) from metal nanostructures for detection of molecules (Schlücker, 2009). Briefly summarizing the theory of SERS, incident photons from a laser beam colliding with a molecule will result in a perturbation of its electron distribution, causing geometric distortion. In response, regions of the molecule will generate an electric dipole moment. This relationship can be mathematically modeled in Eq. 1 such that the induced dipole moment,
Termed inelastic scattering, as the molecule undergoes an energy transition following a collision with incident photons, a small fraction of these photons will scatter at a different frequency than their initial frequency from the laser beam. Stokes and anti-Stokes shifts describe scattered photons whose vibrational energy is higher or lower than their initial energy, respectively. Relevant factors that contribute to signal enhancement of Raman scattering, termed surface-enhanced Raman scattering (SERS), include the optical properties, light absorption, and scattering by metal nanoparticles (Schlücker, 2009). Additionally, SERS is dependent on the optical phenomenon surface plasmon resonance (SPR). Briefly, SPR provides electric enhancement on the nanostructure surface. When a metal nanostructure experiences an electric field from incident polarized light, polarization of the electron cloud surrounding the nanostructure occurs, resulting in charge separation (Jana et al., 2016). At a particular angle of this interaction (the angle of incidence), photon energy will couple with electrons on the metal surface, resulting in changes in the atomic nuclear coordinates (Nguyen et al., 2015). Surface plasmons can be excited in small metal particles or a metal-containing non-uniform surface. The morphology of these metal nanostructures, including size, shape, and composition, has been reported extensively in literature as a factor of SERS enhancement and SPR (Fleger and Rosenbluh, 2009). The morphology and size of Ag nanoparticles can influence SERS enhancement. Silver nanostructures of different shapes have different plasmon modes (Puente et al., 2023), and thus will exhibit different levels of electromagnetic enhancement relative to each other. Different capping agents (i.e., chloride ions, citrate, polyvinylpyrrolidone, etc.) used for aggregation control of nanoparticle suspensions also influences the resulting size and shape of the nanoparticles (Javed et al., 2020; Yang et al., 2020).
SERS has emerged as a highly sensitive technique for detecting drugs by generating unique vibrational spectra for specific molecules (Thobakgale et al., 2022). This approach offers a considerable advantage over conventional methods such as LC-MS/MS, which involve complex instrumentation and sample preparation (Lin et al., 2023). Other methods of detection of aqueous TFV include square-wave voltammetry where Festinger and coworkers reported limits of detection as low as 1.35 × 10⁻⁷ M (39 ng/mL) and 4.86 × 10⁻⁸ M (14 ng/mL) (Festinger et al., 2022). Chiral separation phase (CSP) LCMS of enantiomeric mixtures of a prodrug form of tenofovir, tenofovir disoproxil fumarate (TDF), reported limits of detection of 1.5 ng/mL and 1.2 ng/mL for the R- and S- TDF enantiomers, respectively (Lin et al., 2023). While these are very impressive limits of detection, these methods require complex instrumentation and skill. In this paper, detection of TFV down to 25 ng/mL was achieved using SERS. Analysis by SERS can also be applied to field studies whereas LC- MS/MS requires vacuum technology and expensive detectors for accurate mass measurements as well as considerable operator skills. The SERS platform itself is also considerably smaller than LC- MS/MS apparatuses. Nevertheless, it should be noted that the reaction mixture of a 1:1 solution of Ag colloidal nanoparticles and aqueous TFV used in this study inherently dilutes the TFV present in the reaction mixture, potentially limiting detection and quantification limits. However, evaporating the reaction mixture to dryness significantly enhances the quantifiable detection limit by effectively concentrating the reaction mixture through evaporation of the solvent. This deposition technique allows multiple depositions due to the lack of spatial constraints that exist in a liquid-phase reaction mixture. In this study, a double-deposition TFV experiment is presented, which demonstrates improved spectral signal-to-noise ratio (S/N) and linearity of quantitation compared to a single-deposition experiment. Statistical variability with respect to SERS enhancement and quantification was also considered in the interpretation of results. To overcome this, a variety of statistical treatments were applied to large data sets to generate reproducible quantitative data. We aim to apply these results and methods of analysis to clinical samples for quantification of TFV and other HIV drug levels.
2 Materials and methods
2.1 Synthesis of Ag colloidal nanoparticles
Ag colloidal nanoparticles (CNP) were prepared by reduction of AgNO3 (Sigma- Aldrich,
2.2 Preparation of TFV and adenosine standards for spectra acquisition
Powder TFV and adenosine were provided by CONRAD at Eastern Virginia Medical School and manufactured by Gilead Alberta ULC. Serial dilutions from an aqueous stock of 100 μg/mL TFV and adenosine were performed for subsequent concentration gradients. An aluminum plate containing 40 machined wells in an 8 × 5 well-plate, each having a volume capacity of 20 μL, was used as our SERS surface. Certified 1,100 aluminum was used for the well plate construction. In between experiment replicates, the plate was cleaned by soaking in a 1 M NaOH bath and hand milling with a drill bit, followed by deposition of 4 M HClO4 into the wells and thorough DI H2O rinsing.
All samples presented in this study underwent the preparation and spectra acquisition parameters described in the preceding section. A 1:1 mixture of Ag CNP and analyte was prepared in a microcentrifuge tube and vortexed for 5 seconds. 20 μL aliquots of this mixture were added into each well where each TFV concentration was deposited into five aluminum wells and taken to dryness in a chemical hood prior to spectra acquisition. Since the evaporative process is stochastic, the total volume for all reaction mixtures remained constant (i.e., equivalent volumes of CNP suspension and aqueous TFV or adenosine standards, where each standard is a different concentration). For the TFV double-aliquot experiment, this mixture, deposition, and evaporation process was repeated for one additional aliquot of 20 μL in each well. A high-resolution “square” scan was acquired of each well in the well plate following parameters described in Table 1. The platform by which statistical analysis is performed was developed by our group at Old Dominion University. A computerized XY stage (ThorLabs) holding the Wasatch Photonics 785 nm Raman spectrometer (Kent Lawson Wise and Lee Schoen, 2002) was used for automated spectra acquisition of each well in the aluminum well plate. A raster scan pattern was used for acquisition. See Figure 2 for images of the sampling apparatus. Additional acquisition software setup parameters are listed in Supplementary Figure S3.
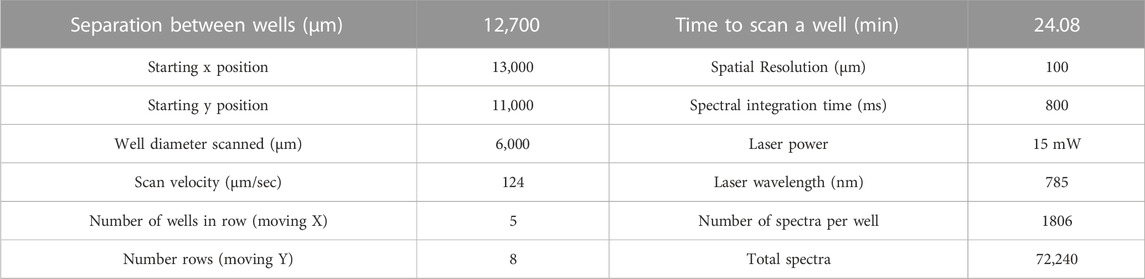
TABLE 1. Instrument parameters used for acquisition of spatially-resolved SERS spectra.
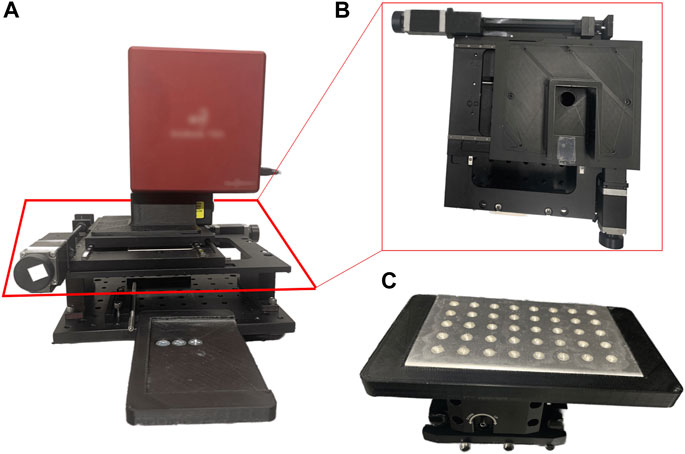
FIGURE 2. (A) Raman scanning apparatus constructed using materials purchased from ThorLabs (B) x-y computer-controlled moving stage that holds the Raman spectrometer (C) aluminum well plate holder with a well plate fitted inside.
3 Results and discussion
3.1 Quality indexing of acquired spectra
For all experiments, 1806 spectra were acquired of each sample well. Statistical analysis was done on acquired spectra to generate calibration curves of TFV and adenosine. Adenosine was investigated in this study for the purpose of comparison with TFV analysis (see Figure 3; Figure 4) because the adenine ring-breathing peak was used for quantification of both analytes and TFV’s inherent derivation from adenosine. See Supplementary Figure S7 and Supplementary Table S2 for peak assignments from acquired TFV data compared to literature assignments. Calibration curves were also generated for the double aliquot TFV experiment (see Figure 5) to probe the benefit of evaporating our reaction mixture of TFV and CNP to dryness then depositing an additional aliquot. Spectra were statistically analyzed using quality indexes (Qi) calculated from the intensity of the adenine ring-breathing peak in the spectral region 739–745 cm-1.
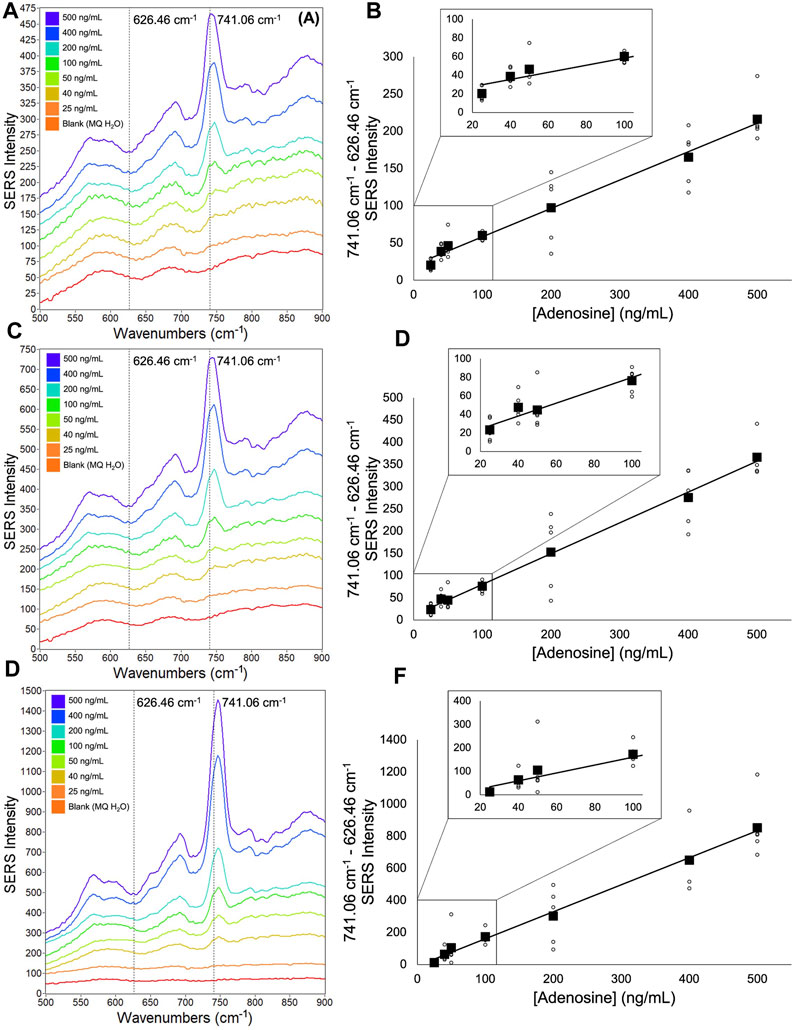
FIGURE 3. Averaged adenosine SERS spectra and corresponding calibration curves (A) 9,030 spectra (100% spectra) averaged per concentration (B) corresponding calibration curve (C) 4,515 spectra (50% spectra) averaged per concentration (D) corresponding calibration curve (E) 900 spectra (10% spectra) averaged per concentration (F) corresponding calibration curve. Calibration curves show the difference of SERS intensity between 626.46 cm-1 and 741.06 cm-1 plotted as a function of adenosine concentration. All spectra had a 5- point Savitzsky- Golay (S–G) smoothing function applied and were offset for clarity. Zoomed insets of calibration curves magnify adenosine concentrations 25 ng/mL—100 ng/mL.
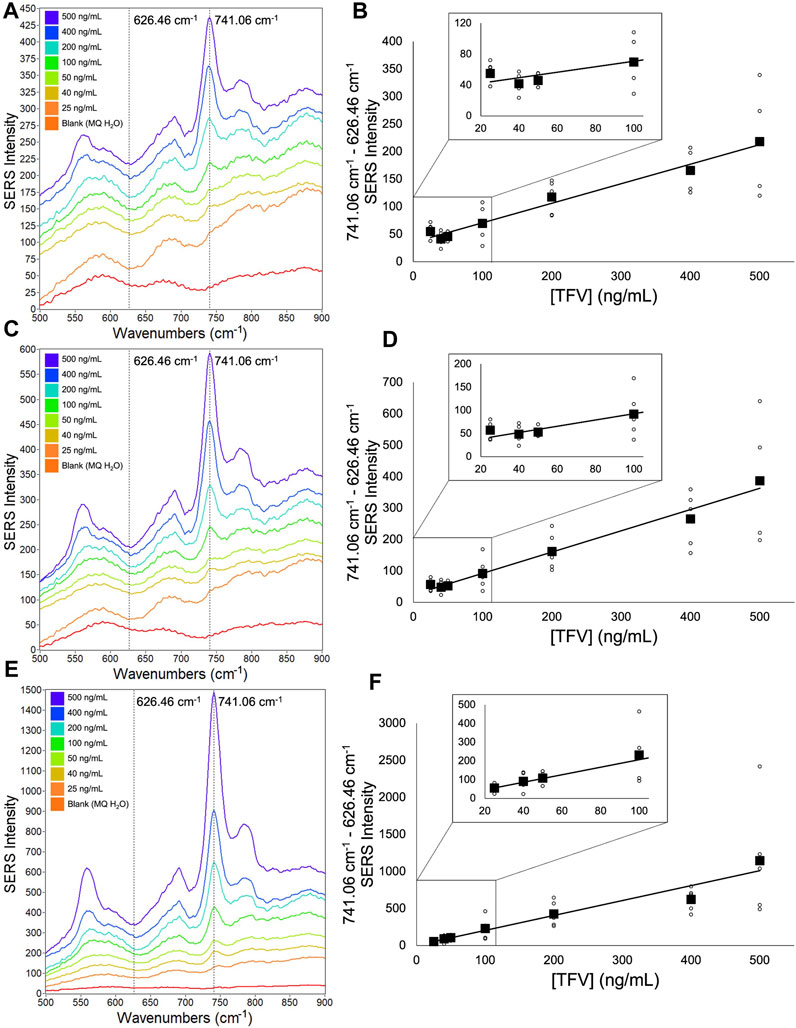
FIGURE 4. Averaged single-aliquot TFV SERS spectra and corresponding calibration curves (A) 9,030 spectra (100% spectra) averaged per concentration (B) corresponding calibration curve (C) 4,515 spectra (50% spectra) averaged per concentration (D) corresponding calibration curve (E) 900 spectra (10% spectra) averaged per concentration (F) corresponding calibration curve. Calibration curves show the difference of SERS intensity between 626.46 cm-1 and 741.06 cm-1 plotted as a function of TFV concentration. All spectra had a 5- point Savitzsky- Golay (S–G) smoothing function applied and were offset for clarity. Zoomed insets of calibration curves magnify TFV concentrations 25 ng/mL—100 ng/mL.
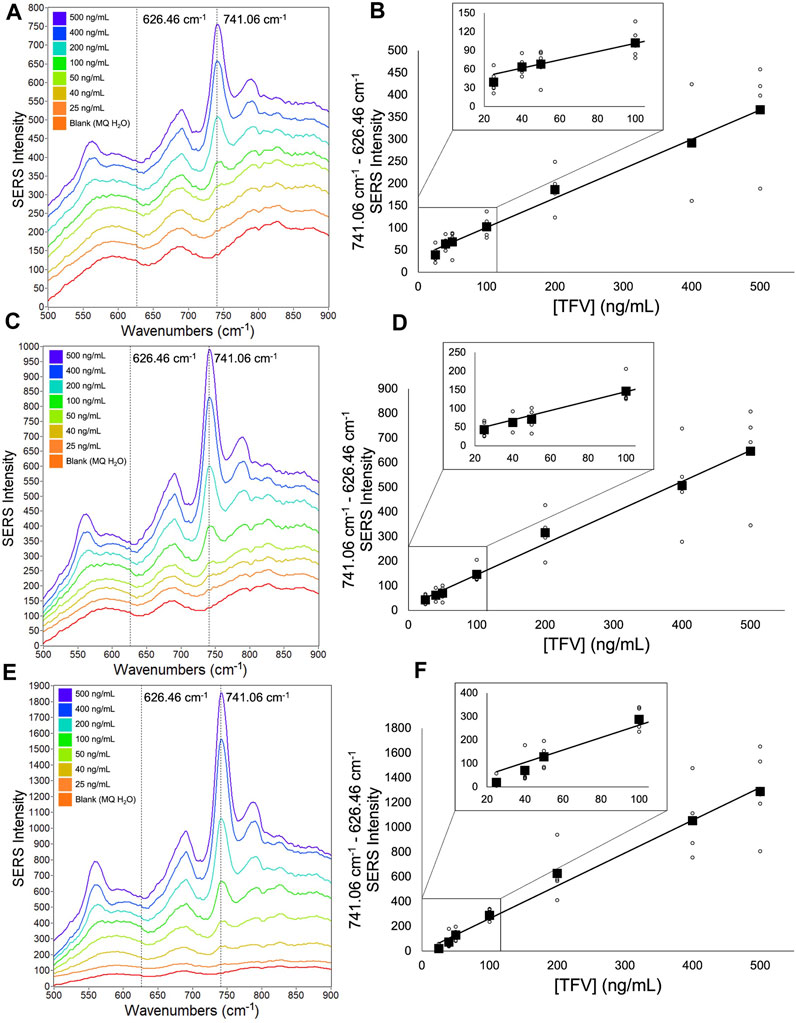
FIGURE 5. Averaged double-aliquot TFV SERS spectra and corresponding calibration curves (A) 9,030 spectra (100% spectra) averaged per concentration (B) corresponding calibration curve (C) 4,515 spectra (50% spectra) averaged per concentration (D) corresponding calibration curve (E) 900 spectra (10% spectra) averaged per concentration (F) corresponding calibration curve. Calibration curves show the difference of SERS intensity between 626.46 cm-1 and 741.06 cm-1 plotted as a function of TFV concentration. All spectra had a 5- point Savitzsky- Golay (S–G) smoothing function applied and were offset for clarity. Zoomed insets of calibration curves magnify TFV concentrations 25 ng/mL—100 ng/mL.
The calculation of spectra quality indexes in general terms is described in the preceding paragraph. The subscript indexes, positions of cursors in the data processing program, p: peak; b1: baseline 1; b2: baseline 2. Baselines are defined in Eqs 2, 3.
Where FWHM is defined as the full width and half max of the selected peak(s) of interest. To maximize S/N of the selected peak(s) of interest, a summation of intensities at respective points, generally defined as point j, Ij, can be calculated to determine the average intensity about each peak at a user-defined range of points to the right of the selected cursor. The difference between these intensity summations with respect to peak(s) and their respective baselines are defined as a quality index (Qi) used for spectral ranking in this study, defined in Eq. 4.
Where t is defined as the total number of peaks factored into the Qi. The Qi value is also conditional such that any calculated Qi less than 0 is equal to 0, defined in Eq. 5. Supplementary Figures S4–S6 show scatter diagrams of all spectra Qi values corresponding to each concentration for these experiment sets. All Qi data corresponding to acquired spectra was then written into a new file and uploaded to a second data processing program.
The second data processing program employed a selection criterion that involved choosing a percentage of high-quality spectra prior to computing an average spectrum for each well. Each averaged spectrum corresponding to the same concentration, a total of five each because each concentration had five replicates, were then averaged, generating a single averaged spectrum for each concentration. This selection process was carried out based on the Qi values computed in the first data processing program, allowing the second data processing program to sort the Qi values for each well. The selected percentages of spectra from each well factored into the total averaged spectrum for each concentration was comprised of spectra corresponding to the highest Qi values within that percent range. Using this program, three different percentages of spectra acquired for each replicate were averaged (Figures 3–5): 100% (1806 spectra), 50% (903 spectra), and 10% (180 spectra) and used for analysis in the preceding section. SERS Enhancement factors (EFs) were calculated for each dataset and are shown in Supplementary Table S3. Briefly, for each concentration, the spectrum corresponding to the maximum SERS intensity of the 741 cm-1 peak was divided by the average 741 cm-1 peak intensity for all spectra. These quotients were then multiplied by 106, an established EF of a prominent adenine peak (733–740 cm-1) (Sivaprakasam and Hart, 2021). From these calculations, our system of Ag CNP and analyte mixtures evaporated to dryness exhibited relative EFs between 107 and 106 across all concentrations.
3.2 Calibrations of experiment sets
For all three experiment sets, based on the analysis of the three percentage subsets of spectra above, using 50% of spectra (903 spectra) from each well for each concentration yielded linear correlations similar to that using 100% of the spectra for each well for each concentration (Table 2; Table 3; Table 4). However, the 50% spectral subsets showed increased S/N in the total averaged spectra compared to the 100% spectral subsets. The 10% spectral subsets generated averaged spectra with the highest S/N, however the smaller sampling size drastically increased the standard deviation and decreased the linearity across the three sample sets. Based on this result, 50% spectral subsets appeared to be the most representative of the entire data population corresponding to each concentration yet also sufficiently excluded spectra with low quality indexes and poor S/N with respect to the adenine ring-breathing peak in the 739–745 cm-1 region. Limits of detection for all experiment sets were calculated by averaging the S/N for each TFV concentration and are shown in Supplementary Table S4.
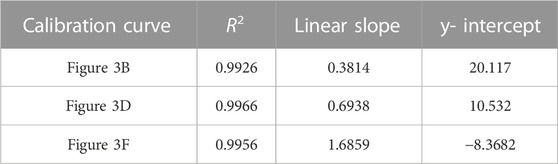
TABLE 2. Correlation coefficient, linear slope, and y-intercept values for calibration curves of adenosine data shown in Figure 3.
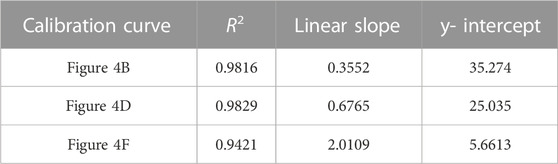
TABLE 3. Correlation coefficient, linear slope, and y-intercept values for calibration curves of TFV single-aliquot data shown in Figure 4.
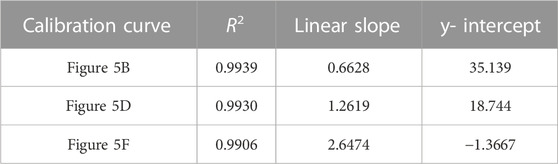
TABLE 4. Correlation coefficient, linear slope, and y-intercept values for calibration curves of TFV double-aliquot data shown in Figure 5.
A notable aspect of our analysis was investigating the impact of a second aliquot of the TFV and Ag CNP mixture after the initial aliquot was taken to dryness versus a single aliquot of the TFV and Ag CNP mixture with respect to spectra signal enhancement, analytical sensitivity, and the ability to differentiate between TFV concentrations 25 ng/mL, 40 ng/mL, and 50 ng/mL. From data presented in Figure 4 and Figure 5, it was shown that the double-aliquot TFV experiment exhibited superior signal-to-noise ratios in the averaged concentration spectra to the single-aliquot TFV averaged concentration spectra. Additionally, the double-aliquot TFV experiment demonstrated improved linearity in the concentration calibration curve with respect to the correlation coefficient, coinciding with improved discrimination between concentrations 25 ng/mL, 40 ng/mL, and 50 ng/mL. Furthermore, double-aliquot calibrations demonstrated higher analytical sensitivity across all subsets than single-aliquot calibrations as shown by the higher slope values (Tables 3, 4). This result is consistent with the benefit of our sampling apparatus such that evaporating the analyte and Ag CNP reaction mixture to dryness has a concentrating effect on the analyte of interest, and a second aliquot of the mixture taken to dryness enhances the SERS signal of our analyte even more, possibly from the increased amount of TFV detected at the sensitivity of the system. In addition to the improved distinction between 25 ng/mL, 40 ng/mL, and 50 ng/mL, these results suggest that with a second reaction mixture aliquot, there is better analyte/CNP well coverage, resulting in a greater amount of high Qi spectra, highlighting another benefit of our sampling apparatus. In addition, the standard deviation for each concentration in the calibration curves also improved for the double aliquot experiments compared to the single aliquot experiments (see Supplementary Tables S5–S7). The standard deviation of the 40 ng/mL and 50 ng/mL data points were closer in value to each other in the double aliquot experiment, compared to the single aliquot experiment where the standard deviation of the 40 ng/mL data point was nearly double the standard deviation of 50 ng/mL. This is also observed between the 500 ng/mL and 400 ng/mL data points, where they are close in value in the double aliquot experiment, but the 500 ng/mL standard deviation is nearly double the 400 ng/mL standard deviation in the single-aliquot experiment. This improvement in both analytical sensitivity and precision suggests that the additional aliquot provides better well coverage and an increase in hot spots for sample wells.
3.3 Partial least squares regression analysis of experiment sets
Partial least squares (PLS) regression analysis was applied to the three experiments presented in this study (Figure 6; Figure 7; Figure 8). The collinear nature of each factor modeled by these regressions was used to predict responses of future factors with respect to these models whose TFV concentrations are unknown. Correlation coefficient, slope, and y-intercept values for these regressions are shown in Table 5, Table 6, and Table 7. Extending these findings into future work, our aim is to use these analytical methods of TFV and apply them to analysis of TFV in biological samples for detection and quantification. This is currently under investigation by our group.
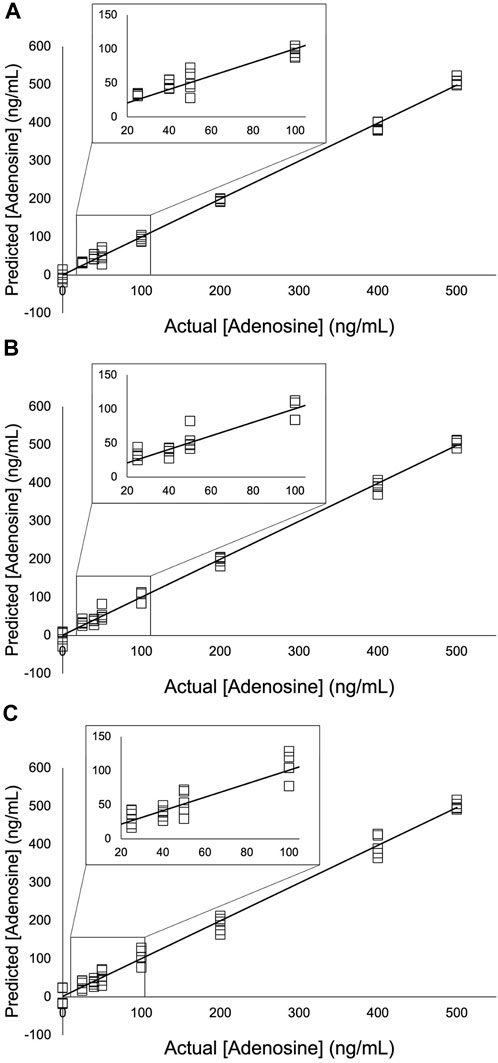
FIGURE 6. PLS models of the adenosine experiment using (A) 9,030 spectra for each concentration (B) 4,515 spectra for each concentration; and (C) 900 spectra for each concentration. A 5- point S-G first derivative and 5- point S-G smoothing function was applied to a truncated spectral region (368.14 cm-1—1,639.58 cm-1). Six principal components (PCs) were used. Zoomed insets show adenosine concentrations 25 ng/mL—100 ng/mL.
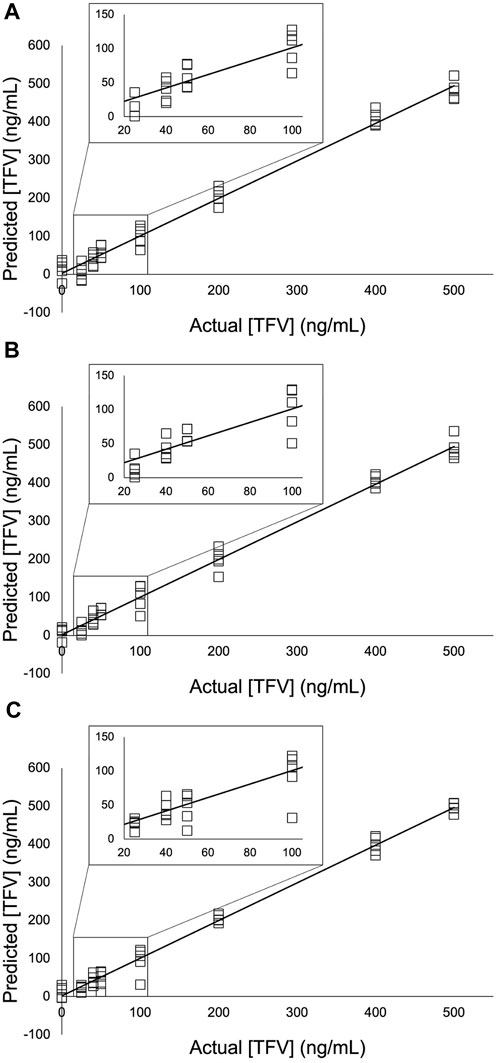
FIGURE 7. PLS models of the TFV single-aliquot experiment using (A) 9,030 spectra for each concentration (B) 4,515 spectra for each concentration; and (C) 900 spectra for each concentration. A 3- point S-G first derivative and 5- point S-G smoothing function was applied to a truncated spectral region (368.14 cm-1—1,072.6 cm-1). Six principal components (PCs) were used. Zoomed insets show TFV concentrations 25 ng/mL—100 ng/mL.
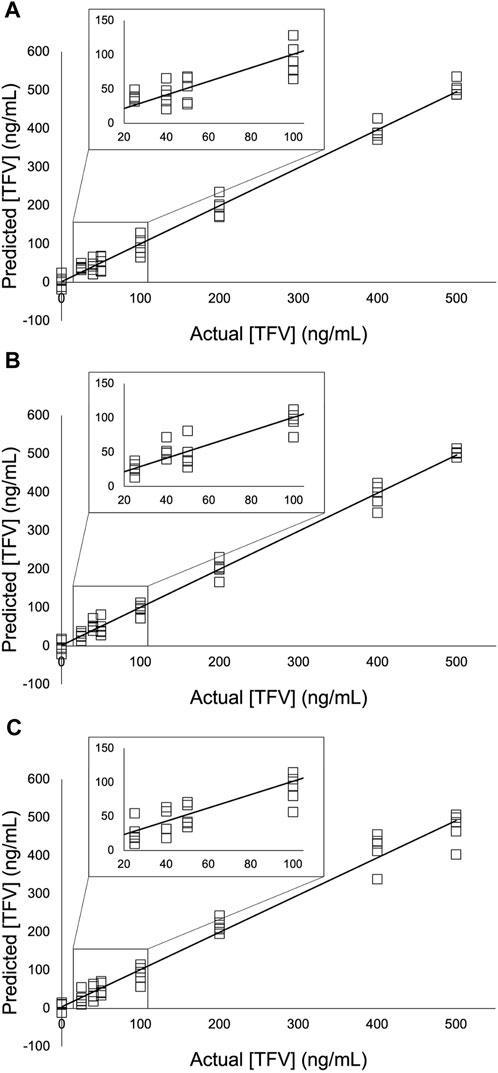
FIGURE 8. PLS models of the TFV double-aliquot experiment using (A) 9,030 spectra for each concentration (B) 4,515 spectra for each concentration; and (C) 900 spectra for each concentration. A 5- point S-G first derivative and 7- point S-G smoothing function was applied to a truncated spectral region (368.14 cm-1—1,639.58 cm-1). Five principal components (PCs) were used. Zoomed insets show TFV concentrations 25 ng/mL—100 ng/mL.
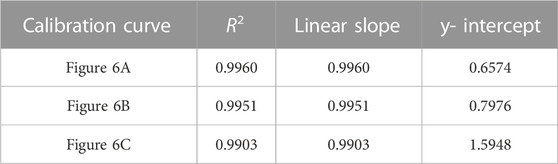
TABLE 5. Correlation coefficient, linear slope, and y-intercept values for calibration curves of adenosine data shown in Figure 6.
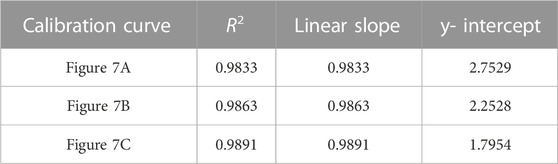
TABLE 6. Correlation coefficient, linear slope, and y-intercept values for calibration curves of TFV single-aliquot data shown in Figure 7.
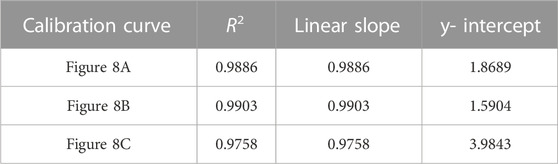
TABLE 7. Correlation coefficient, linear slope, and y-intercept values for calibration curves of TFV double-aliquot data shown in Figure 8.
4 Conclusion
In conclusion, this study demonstrated detection and quantification of the antiviral HIV drug tenofovir using surface-enhanced Raman spectroscopy down to 25 ng/mL. This was achieved using hydroxylamine-reduced Ag colloidal nanoparticles as the SERS substrate and novel acquisition and processing software for spectra acquisition and statistical analysis. An 8 × 5 aluminum well plate with machined wells was used as the SERS surface. The statistical methods used, including partial least squares (PLS) regression and spectra ranking by quality indices computed using CHAOS theory, proved to be effective in the quantification of TFV in an aqueous matrix. These data show promise for future studies aimed at detecting and quantifying TFV in biological samples by SERS, which could provide clinicians with a rapid and convenient means of objectively assessing drug adherence in the treatment and prevention of viral diseases such as HIV.
Data availability statement
The original contributions presented in the study are included in the article/Supplementary Materials, further inquiries can be directed to the corresponding author.
Author contributions
MB: Conceptualization, Data curation, Formal Analysis, Investigation, Methodology, Validation, Writing–original draft, Writing–review and editing. JH: Conceptualization, Methodology, Resources, Validation, Writing–review and editing. TJ: Funding acquisition, Project administration, Supervision, Writing–review and editing. SD: Project administration, Supervision, Writing–review and editing. MC: Funding acquisition, Project administration, Supervision, Writing–review and editing, Conceptualization. GD: Funding acquisition, Project administration, Supervision, Writing–review and editing. JC: Funding acquisition, Project administration, Resources, Software, Supervision, Validation, Writing–review and editing, Conceptualization.
Funding
The author(s) declare financial support was received for the research, authorship, and/or publication of this article. This work was funded by subaward ENS-20-001 from CONRAD/EVMS under Project Engage, a cooperative agreement (7200AA20CA00030) between the U.S. Agency for International Development (USAID) and EVMS funded by U.S. President’s Emergency Plan for AIDS Relief (PEPFAR). The views of the authors do not necessarily reflect those of the funding agency, PEPFAR or the US Government.
Conflict of interest
The authors declare that the research was conducted in the absence of any commercial or financial relationships that could be construed as a potential conflict of interest.
The author(s) declared that they were an editorial board member of Frontiers, at the time of submission. This had no impact on the peer review process and the final decision.
Publisher’s note
All claims expressed in this article are solely those of the authors and do not necessarily represent those of their affiliated organizations, or those of the publisher, the editors and the reviewers. Any product that may be evaluated in this article, or claim that may be made by its manufacturer, is not guaranteed or endorsed by the publisher.
Supplementary material
The Supplementary Material for this article can be found online at: https://www.frontiersin.org/articles/10.3389/fnano.2023.1270474/full#supplementary-material
References
Aroca, R. F., and Rodriguez-Llorente, S. (2006). Surface enhanced vibrational spectroscopy. Hoboken, New Jersey, United States: Wiley.
Baker, R. E., Mahmud, A. S., Miller, I. F., Rajeev, M., Rasambainarivo, F., Rice, B. L., et al. (2022). Infectious disease in an era of global change. Nat. Rev. Microbiol. 20 (4), 193–205. doi:10.1038/s41579-021-00639-z
Festinger, N., Spilarewicz-Stanek, K., Borowczyk, K., Guziejewski, D., and Smarzewska, S. (2022). Highly sensitive determination of tenofovir in pharmaceutical formulations and patients urine-comparative electroanalytical studies using different sensing methods. Molecules 27 (6), 1992. doi:10.3390/molecules27061992
Fleger, Y., and Rosenbluh, M. (2009). Surface plasmons and surface enhanced Raman spectra of aggregated and alloyed gold-silver nanoparticles. Res. Lett. Opt. 2009, 475941–475945. doi:10.1155/2009/475941
Hermans, L. E., Umunnakwe, C. N., Lalla-Edward, S. T., Hebel, S. K., Tempelman, H. A., Nijhuis, M., et al. (2023). Point-of-Care tenofovir urine testing for the prediction of treatment failure and drug resistance during initial treatment for human immunodeficiency virus type 1 (HIV-1) infection. Clin. Infect. Dis. 76 (3), e553–e560. doi:10.1093/cid/ciac755
Jana, J., Ganguly, M., and Pal, T. (2016). Enlightening surface plasmon resonance effect of metal nanoparticles for practical spectroscopic application. RSC Adv. 6 (89), 86174–86211. doi:10.1039/C6RA14173K
Javed, R., Zia, M., Naz, S., Aisida, S. O., Ain, N. u., and Ao, Q. (2020). Role of capping agents in the application of nanoparticles in biomedicine and environmental remediation: recent trends and future prospects. J. Nanobiotechnology 18 (1), 172. doi:10.1186/s12951-020-00704-4
Kent Lawson Wise, J. B. C., and Lee Schoen, C. (2002). Dispersive near-ir Raman spectrometer. U. S. Pat. Appl.
Leopold, N., and Lendl, B. (2003). A new method for fast preparation of highly surface-enhanced Raman scattering (SERS) active silver colloids at room temperature by reduction of silver nitrate with hydroxylamine hydrochloride. J. Phys. Chem. B 107 (24), 5723–5727. doi:10.1021/jp027460u
Lin, L., Huang, L., Ke, Y., Xu, X., and Huang, L. (2023). Study on quality control of tenofovir disoproxil fumarate enantiomers by high-performance liquid chromatography–mass spectrometry. Chromatographia 86 (3), 213–222. doi:10.1007/s10337-023-04240-9
McCluskey, S. M., Govender, K., Adamson, J., Gandhi, M., Spinelli, M. A., Moosa, M.-Y., et al. (2023). Point-of-care urine tenofovir testing to predict HIV drug resistance among individuals with virologic failure. AIDS Lond. Engl. 37 (7), 1109–1113. doi:10.1097/qad.0000000000003520
National Center for Biotechnology Information ,2023 PubChem compound summary for CID 464205, tenofovir. Available: https://pubchem.ncbi.nlm.nih.gov/compound/Tenofovir.
Nguyen, H., Park, J., Kang, S., and Kim, M. (2015). Surface plasmon resonance: A versatile technique for biosensor applications. Sensors 15 (5), 10481–10510. doi:10.3390/s150510481
Puente, C., Pineda Aguilar, N., Gómez, I., and López, I. (2023). Morphology effect of photoconverted silver nanoparticles on the performance of surface-enhanced Raman spectroscopy substrates. ACS Omega 8 (14), 12630–12635. doi:10.1021/acsomega.2c05958
Schlücker, S. (2009). SERS microscopy: nanoparticle probes and biomedical applications. Chemphyschem 10 (9-10), 1344–1354. doi:10.1002/cphc.200900119
Sivaprakasam, V., and Hart, M. B. (2021). Surface-enhanced Raman spectroscopy for environmental monitoring of aerosols. ACS Omega 6 (15), 10150–10159. doi:10.1021/acsomega.1c00207
Thobakgale, S. L., Ombinda-Lemboumba, S., and Mthunzi-Kufa, P. (2022). A molecular study of Aspirin and tenofovir using gold/dextran Nanocomposites and surface-enhanced Raman spectroscopy. Molecules 27 (8), 2554. doi:10.3390/molecules27082554
UNAIDS (2022). Danger: UNAIDS global AIDS update 2022. Geneva, Switzerland: Joint United Nations Programme on HIV/AIDS.
Venter, W. D. F., Clayden, P., and Serenata, C. (2017). The ADVANCE study: A groundbreaking trial to evaluate a candidate universal antiretroviral regimen. Curr. Opin. HIV AIDS 12 (4), 351–354. doi:10.1097/coh.0000000000000389
Keywords: surface-enhanced Raman spectroscopy (SERS), tenofovir (TFV), adenosine, Ag nanoparticles, pharmaceutical analysis, chemometrics
Citation: Butler MR, Hrncirova J, Jacot TA, Dutta S, Clark MR, Doncel GF and Cooper JB (2023) Detection and quantification of antiviral drug tenofovir using silver nanoparticles and surface enhanced Raman spectroscopy (SERS) with spatially resolved hotspot selection. Front. Nanotechnol. 5:1270474. doi: 10.3389/fnano.2023.1270474
Received: 31 July 2023; Accepted: 25 August 2023;
Published: 12 September 2023.
Edited by:
Nagesh Kolishetti, Florida International University, United StatesReviewed by:
Iram Maqsood, University of Maryland, United StatesWei Shao, Westlake University, China
Prajesh Prajapati, National Forensic Sciences University, India
Copyright © 2023 Butler, Hrncirova, Jacot, Dutta, Clark, Doncel and Cooper. This is an open-access article distributed under the terms of the Creative Commons Attribution License (CC BY). The use, distribution or reproduction in other forums is permitted, provided the original author(s) and the copyright owner(s) are credited and that the original publication in this journal is cited, in accordance with accepted academic practice. No use, distribution or reproduction is permitted which does not comply with these terms.
*Correspondence: John B. Cooper, amNvb3BlckBvZHUuZWR1