 Laura Airas
 Marjo Nylund
 Eero Rissanen
- 1Division of Clinical Neurosciences, Turku University Hospital and University of Turku, Turku, Finland
- 2Turku PET Centre, Turku University Hospital and University of Turku, Turku, Finland
Understanding the mechanisms underlying progression in multiple sclerosis (MS) is one of the key elements contributing to the identification of appropriate therapeutic targets for this under-managed condition. In addition to plaque-related focal inflammatory pathology typical for relapsing remitting MS there are, in progressive MS, widespread diffuse alterations in brain areas outside the focal lesions. This diffuse pathology is tightly related to microglial activation and is co-localized with signs of neurodegeneration. Microglia are brain-resident cells of the innate immune system and overactivation of microglia is associated with several neurodegenerative diseases. Understanding the role of microglial activation in relation to developing neurodegeneration and disease progression may provide a key to developing therapies to target progressive MS. 18-kDa translocator protein (TSPO) is a mitochondrial molecule upregulated in microglia upon their activation. Positron emission tomography (PET) imaging using TSPO-binding radioligands provides a method to assess microglial activation in patients in vivo. In this mini-review, we summarize the current status of TSPO imaging in the field of MS. In addition, the review discusses new insights into the potential use of this method in treatment trials and in clinical assessment of progressive MS.
Introduction
Multiple sclerosis (MS) is a chronic autoimmune disease of the central nervous system (CNS) which leads to demyelination and neurodegeneration. In 85% of cases, MS starts as a relapsing remitting disease following an attack against the CNS by the adaptive immune system. This leads to formation of MRI-detectable, gadolinium-enhancing focal inflammatory lesions. Depending on the anatomical location of the lesions, neurological symptoms, i.e., MS relapses, will follow. Inflammation within the CNS contributes to demyelination and neuronal damage (1). Within 10–15 years after the diagnosis, more than 60% of RRMS patients procede to develop secondary progressive MS (SPMS) in which relapses give way to relentless disease progression and accumulation of disability (2). This progression is associated with activation of the local innate immune system within the CNS and, gradually, white blood cell trafficking from the periphery into the CNS is reduced (3). Both resident microglia and blood-derived macrophages contribute to neuronal damage via release of pro-inflammatory cytokines and reactive oxygen species (4). These lead to oxidative injury of mitochondria and to oligodendrocyte damage and degeneration of neurons (5, 6). The resulting energy failure and membrane channel dysfunction may be key processes in progressive disease. Interfering with these mechanisms, for example by reducing the harmful pro-inflammatory microglia functions, may provide neuroprotection and prevent disability progression by myelin repair and restoration of axonal activity and conduction.
Neuropathological studies have demonstrated that MS lesions in progressive disease rarely have features of acute inflammation. Instead, brain samples from patients with progressive disease have chronic active (smoldering or expanding) lesions with microglial activation at the edge of an otherwise burned out plaque (7). Alternatively, the chronic lesions are inactive, with no microglial activation at the plaque edge (7). In addition, widespread microglial activation is seen in areas surrounding the focal lesions, in the so called normal-appearing white matter (NAWM) (8). Microglial activation is associated with signs of neuronal damage and tissue atrophy and hence it is assumed that microglial cells contribute to the CNS damage of progressive MS (9). In this narrative mini-review, we give a comprehensive overview of the present state of the use of positron emission tomography (PET) using 18-kDa translocator protein (TSPO)-binding radioligands for imaging of microglial activation in MS. We have used PubMed for literature searches using the following search terms: TSPO imaging, neuroinflammation, PET, and MS. We discuss the promise and potential of TSPO imaging in in vivo visualization of microglial activation in association with various aspects of MS, address significant gaps in the field and highlight future directions for further investigation.
Why New Imaging Methods are Needed for the Study of MS?
Given the current limited understanding of the neuropathological process of progressive MS, it is not surprising that the disease modifying treatments used successfully to treat RRMS, which mostly function on the peripheral adaptive immune system, are not effective for progressive MS. Attempts to find treatments for progressive MS have proven challenging with, frequently, disappointing results (10). However, recently, ocrelizumab, a humanized monoclonal antibody selectively depleting CD20-expressing B-cells, was the first disease modifying treatment to show efficacy in slowing down disease progression in primary progressive MS (11). A breakthrough is still awaited for effective treatment of SPMS. Imaging methods or biomarkers for progressive MS, which would assist in treatment development, are not well established and the diagnosis is usually retrospective, based on the history of gradual neurological worsening with or without occasional relapses (12). Conventional MRI is sensitive in demonstrating the gadolinium enhancing active focal inflammatory lesions, and MRI is essential for MS diagnostics, clinical follow-up and treatment trials of RRMS. MRI studies in progressive MS, on the other hand, often demonstrate limited blood–brain-barrier (BBB) permeability. This is in accordance with the ongoing compartmentalized inflammation within the CNS which has been well demonstrated in progressive disease using neuropathological studies (13). Other MRI characteristics of progressive MS include increasing number and volume of T1-hypointense lesions, brain volume loss, changes in magnetic transfer imaging, and diffusion tensor imaging (14). Conventional MRI is not sensitive enough to visualize the diffuse pathology associated with progressive MS. Hence, more sensitive methods for monitoring progressive MS are urgently needed. PET imaging using radioligands binding to the TSPO molecule on activated microglial cells provides a method to specifically quantify microglial activation both in the context of the chronic lesions and within the NAWM. PET imaging will enable longitudinal in vivo follow-up of the pathobiology relevant to progressive MS, and it thus holds promise as a new outcome measure for treatment studies of this under-treated condition.
Description of the PET Methodology
Positron emission tomography imaging uses short-lived radioactive isotopes bound to ligands that interact with their specific targets within the CNS (15). The radioactive isotopes emit positrons, that are detected using a sophisticated gamma-counter placed within a PET camera, and the amount of the bound ligand within the CNS can thus be quantitated. Radioligands used for PET imaging are produced by radiolabeling specific precursor molecules (the receptor ligands) with short-lived positron emitting isotopes, such as 18F and 11C using a cyclotron. Due to the short half-lives of the tracers, i.e., 20 min for a 11C-tracer or 110 min for a 18F-tracer, a short cyclotron-to-camera-time is required, and the radioligands must mostly be produced on-site. After an intravenous injection, the PET tracer enters the CNS, binds to its corresponding target and can be detected using the PET camera. PET imaging is a non-invasive imaging technique with high molecular sensitivity and specificity, which allows remarkably accurate in vivo quantification of the molecules of interest within the CNS (15–17). PET can be highly specific for a disease-related process, provided that a suitable PET tracer is available (18). PET imaging has been so far relatively underused in the evaluation of the disease pathogenesis in MS, despite the potential to be able to detect the pathogenic determinants related to MS pathogenesis in vivo and longitudinally in a given individual patient. Here, the detection of activated microglial cells in the context of progressive MS has been the main target of our PET imaging studies (19, 20).
The TSPO-Molecule is Upregulated upon Activation of Microglia
For visualization of microglial activation, radioligands binding to the TSPO molecule are mostly used. TSPO is a protein structure, which is expressed on the outer mitochondrial membrane of activated microglia, and TSPO upregulation on microglial cells is thus considered to be a sensitive “real-time” marker of activation of these cells (21–23). TSPO is also expressed widely outside the CNS and it is thought to be involved in a range of vital cellular functions including regulation of cell proliferation, programmed cell death, steroid biosynthesis, and heme synthesis (24, 25). TSPO also plays a role in cell activation and in opening of the mitochondrial permeability transition pore (26). It was previously called the “peripheral benzodiazepine receptor” (27).
In the “resting” or surveying microglia, TSPO is expressed at a lower level; mainly in the gray matter (28). In non-neoplastic CNS damage without BBB breakdown, microglia are the main cell population expressing TSPO, but also blood-derived macrophages, reactive astrocytes, and endothelial and smooth muscle cells in the vasculature express TSPO (21, 29–33). Interestingly, knocking out TSPO is protective in a mouse model of MS (34). On the other hand, recent in vitro work investigated TSPO expression in activated macrophages and surprisingly, a consistent downregulation of TSPO mRNA and protein in macrophages activated to a pro-inflammatory, or “M1” phenotype was demonstrated (35). On the other hand, stimulation of macrophages to an M2 phenotype with IL-4, dexamethasone or TGF-β1 did not alter TSPO expression (35). The same group investigated TSPO expression in rodent vs. human-derived macrophages and microglia upon pro-inflammatory stimulation (36). Here, they demonstrated a ninefold increase in TSPO in rodent-derived macrophages and microglia upon pro-inflammatory stimulation, but surprisingly, TSPO expression did not increase with classical pro-inflammatory activation in primary human microglia. Pro-inflammatory activation of human monocyte-derived macrophages was associated with a reduction of both TSPO gene expression and TSPO-binding site availability. How these in vitro experiments relate to MS immunopathology in MS brain in situ remains to be seen, but the findings do suggest that changes in TSPO expression in PET imaging studies of MS may reflect microglial and macrophage density rather than activation phenotype (36). Neuropathological studies of TSPO localization in various types and various patho-anatomical locations in MS brain tissue in situ are, unfortunately, still relatively limited (21).
Radioligands Used for Detection of TSPO
First Generation TSPO Ligand [11C]PK11195
The first TSPO-binding compound, PK11195, has been available for more than 30 years (37). [11C]PK11195 was first used for imaging of human gliomas in 1989 (38), and the first in vivo human MS brain study was performed in 1997 (39). [11C]PK11195 has high specificity for TSPO (40), but a short half-life (20 min) and low signal-to-noise ratio complicates image analysis (41). [11C]PK11195, like other TSPO-ligands, binds to endothelial cells and to plasma proteins, which needs to be accounted for when evaluating the images. Quantification of specific radioligand binding in a given region of interest (ROI) usually requires comparison to a reference area devoid of specific binding. MS brain naturally lacks such an anatomically clearly defined reference region, which necessitates mathematical modeling of the signal to allow reliable estimation of specific binding to cells of the innate immune system (42–44). For quantification of specific [11C]PK11195 ligand binding, a semi-automated model (supervised clustering algorithm) has been validated (43, 44) and applied in several [11C]PK11195-PET studies of MS (20, 45, 46). Up to date, 12 different studies in MS using [11C]PK11195 have been published (Table 1). These studies have evaluated the presence of activated microglia in various cohorts of MS. They have also been used as a prognostic marker for worsening of the disease, or used for measuring the treatment effect of various MS treatments, as discussed below.
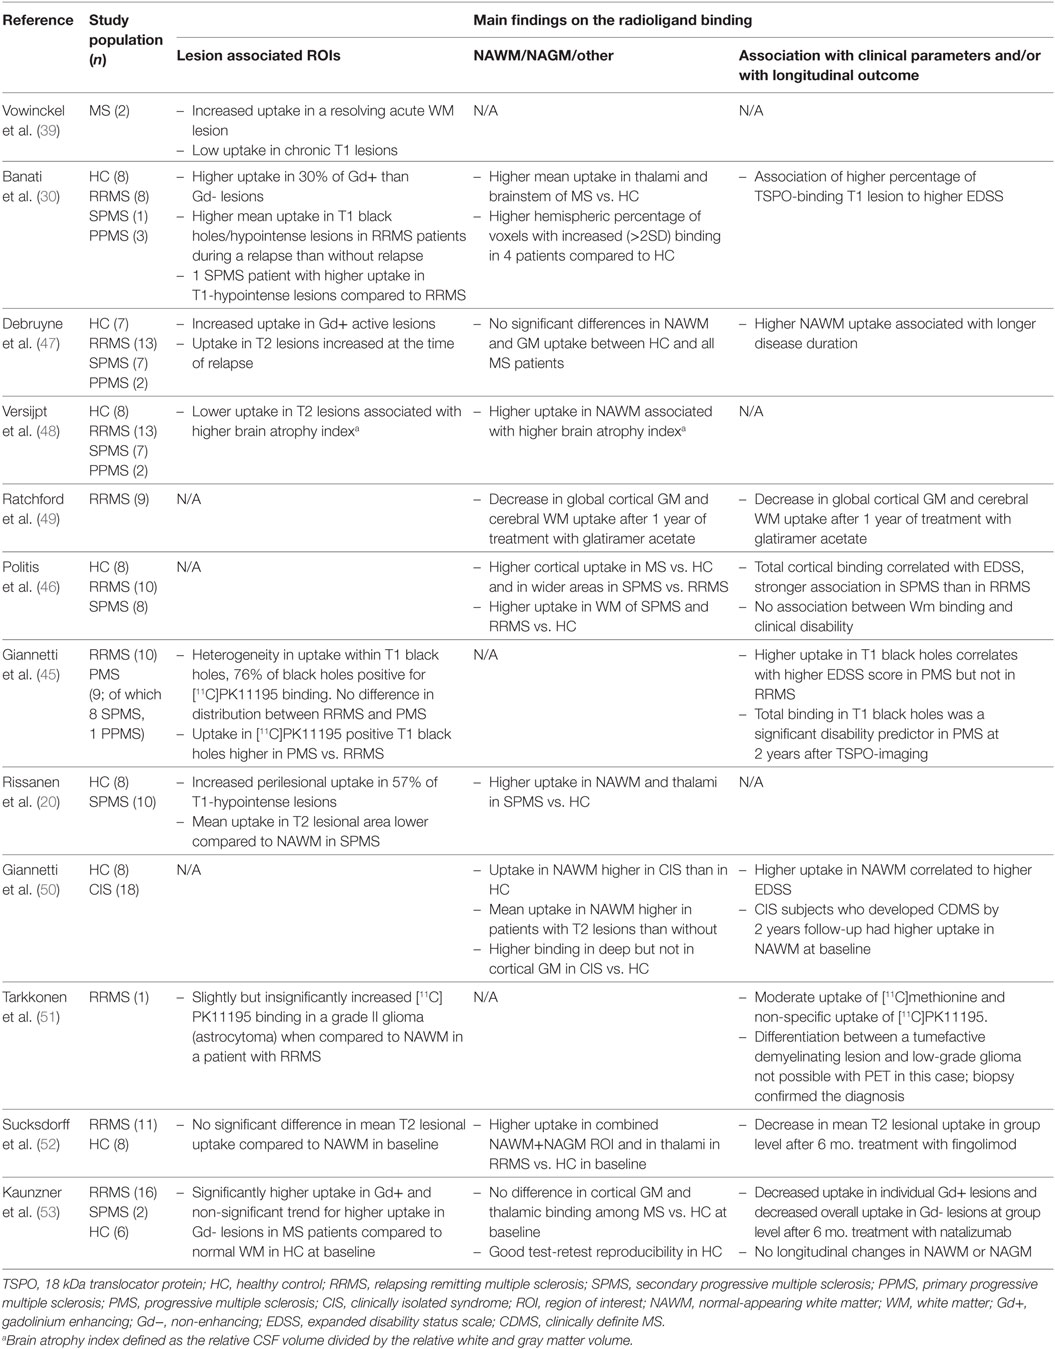
Table 1. Human in vivo positron emission tomography (PET) imaging studies with first generation TSPO ligand [11C]PK11195 in multiple sclerosis.
Second-Generation TSPO Ligands
Second-generation TSPO ligands with higher affinity and specificity have been developed (23, 54), and over 80 high-affinity TSPO tracers are currently at some stage of development (55). Of these, [11C]PBR28, [18F]PBR111, [11C]FEDAA1106, and [18F]GE180 have already been used in studies of MS (56–60) (Table 2). The first studies with these tracers did not show differences in ligand uptake between MS patients and healthy controls (58, 61). However, this was before discovering that in humans the binding affinity for these second-generation ligands is individually determined by genetic variation in the TSPO gene. Thereafter, identification of a single nucleotide polymorphism (rs6971) in exon 4 of TSPO gene has enabled stratification of study subjects into high, medium, and low affinity binders (62), and thus, more accurate estimation of the ligand binding properties is possible at group level (Table 2).
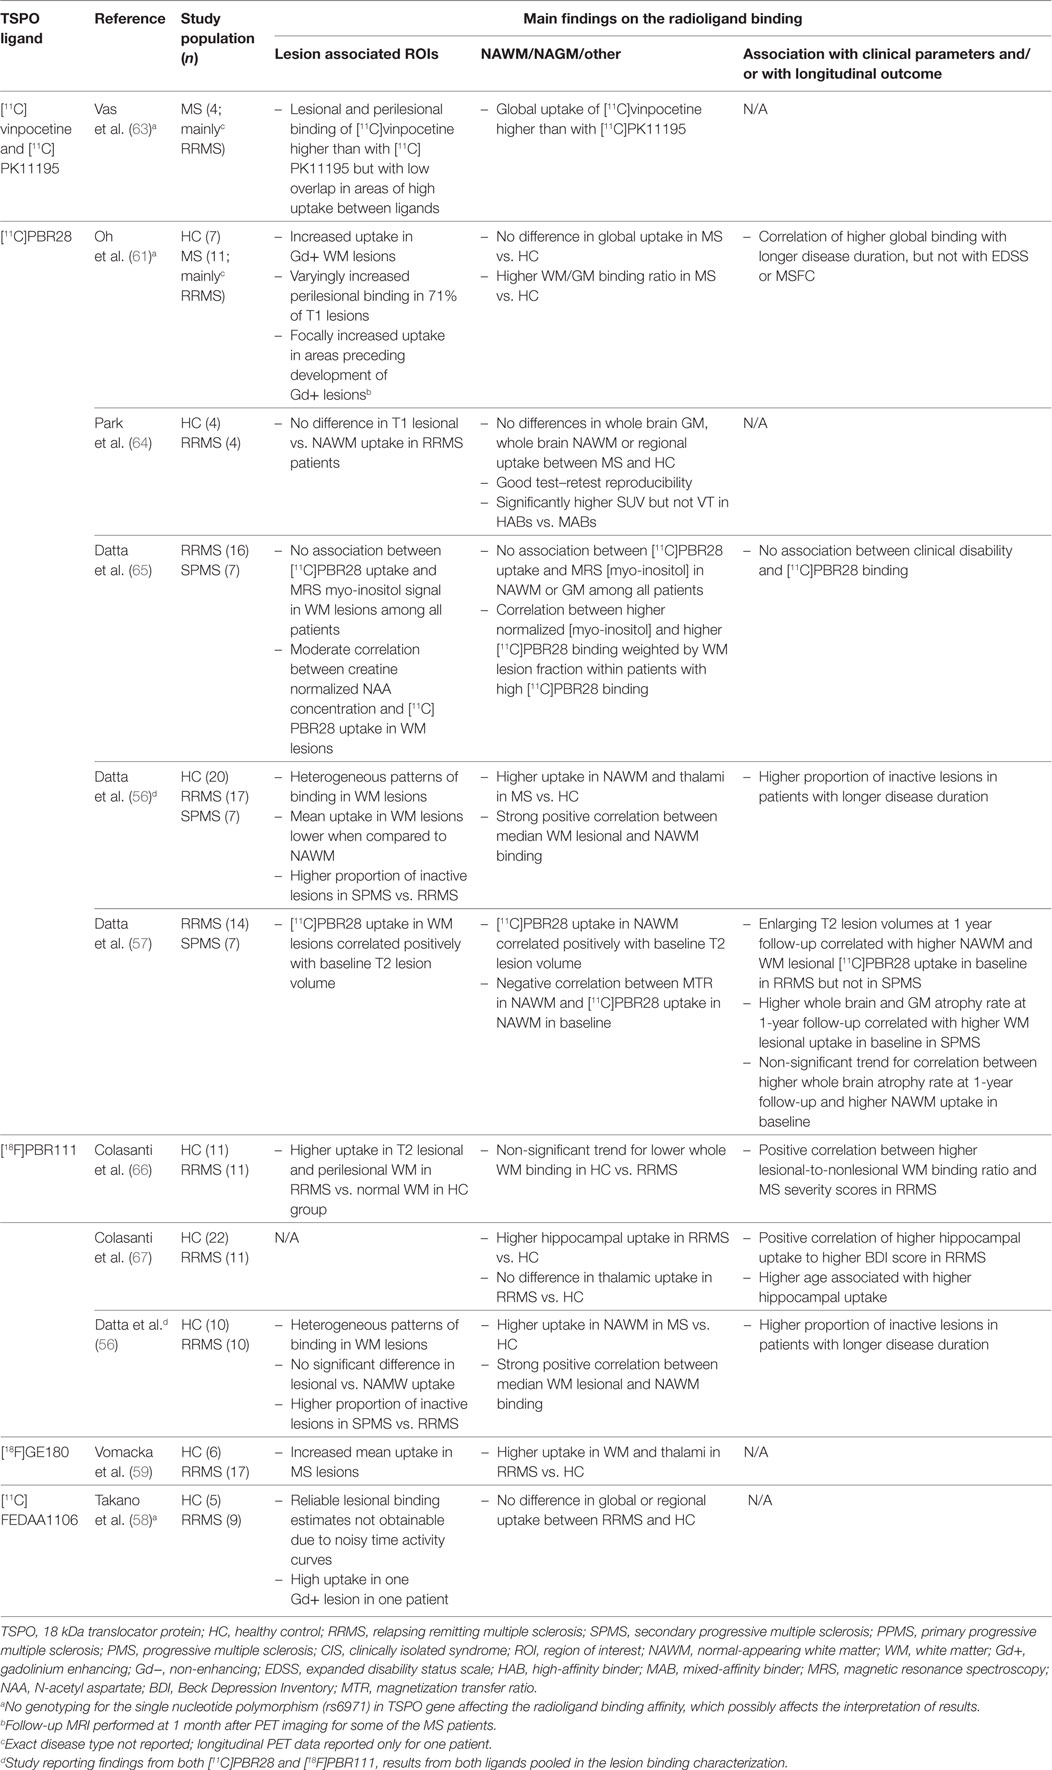
Table 2. Human in vivo positron emission tomography (PET) imaging studies with second-generation TSPO ligands in multiple sclerosis.
Despite the advances in genetic testing, other challenges remain in the image analyses and in estimation of the specific binding of these ligands. As with [11C]PK11195, some of the specific TSPO binding of second-generation ligands appears to be accounted for by binding to activated astrocytes (68) and endothelial cells (69). In addition, the methodology for individual normalization or the choice of a reference region, presumably free of specific binding, is very varied among the human brain studies using second-generation ligands. For example, use of white matter (60) and caudate nucleus (56, 57) as pseudoreference regions as well as whole brain normalization (70) have been reported but not thoroughly validated for [11C]PBR28. In contrast, [18F]GE180 appears to have surprisingly low brain uptake in healthy controls (71), which makes the quantification of specific binding even more challenging, although the methodology for total distribution volume estimation appears feasible (72).
TSPO-PET Imaging Findings in Different Subtypes of MS
TSPO-PET Imaging in Progressive MS
Studies of progressive MS have demonstrated an increase in TSPO uptake in the NAWM and NAGM which appears to be related to disease severity and patient age (60). In the NAWM of SPMS patients, the TSPO binding is significantly increased when compared to age-matched healthy controls (20, 30, 46, 47, 60). In PPMS, such studies are still lacking. In addition to quantification of the diffuse microglial activation in the NAWM and NAGM, PET imaging can also be used to differentiate between chronic active (smoldering) and chronic inactive lesions. In particular, the slowly expanding/smoldering lesions are thought to contribute to progression of MS and being able to detect these in vivo, and to evaluate the kinetics of the plaque evolution in vivo, will likely give new information into the pathology driving the progression. We found that in the brain of advanced SPMS patients, 57% of the plaques were of the chronic active type, with increased TSPO-binding at the plaque edge demonstrating persisting inflammatory activity in these “holes” (20). Figure 1 demonstrates a TSPO-PET image with both chronic active and chronic inactive lesions. Similarly, Giannetti et al. demonstrated heterogeneity in [11C]PK11195 binding pattern in black holes (45). Findings from MS studies using later generation TSPO ligands were also in accordance with the above described findings (66, 72).
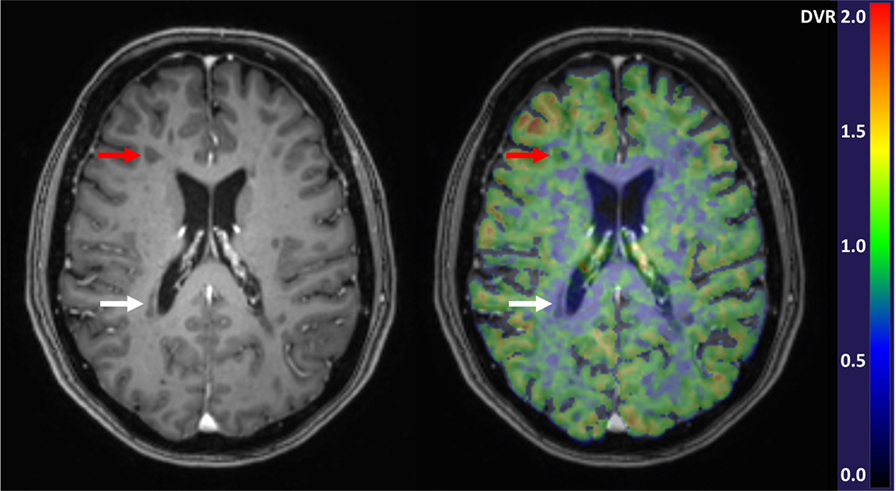
Figure 1. Gadolinium enhanced 3DT1 MRI image (left) and parametric [11C]PK11195-PET image overlayed with the 3DT1 image (right). Red arrows point to a chronic active T1-hypointense lesion with increased perilesional [11C]PK11195 binding demonstrative of microglial activation, and white arrows point to a chronic inactive lesion with negligible radioligand binding. In the parametric PET image, the color of each voxel represents the intensity of specific radioligand binding measured as distribution volume ratio (DVR) and denoted by the scaled color bar.
TSPO-PET Imaging in RRMS
In vivo TSPO-PET imaging has revealed modest microglial activation in the NAWM of RRMS patients, when compared to SPMS (46). Similarly, in neuropathological studies, the diffuse microglial activation outside focal lesions was a feature of progressive disease and was less significant in RRMS patients (7). However, CIS patients who later developed clinically definite MS were shown to have increased TSPO radioligand binding in the NAWM (50). Similarly, during a washout period for a switch in disease modifying therapy, RRMS patients had increased TSPO binding in the NAWM when compared to healthy controls (52). TSPO binding is increased in acute lesions, and T2 lesions have higher TSPO binding during a relapse than during stable disease (39, 48, 53).
TSPO-PET Imaging as a Prognostic Marker for MS Worsening
Usability of TSPO-PET as a prognostic marker for MS evolution has already been addressed in several studies. Datta et al. found that greater binding of the second-generation TSPO radioligand [11C]PBR28 in the NAWM correlated with subsequently greater MRI activity (enlarging T2 lesion volume) among RRMS patients, and with a greater rate of brain volume loss among patients with SPMS (57). This indirectly suggests that the more substantial total inflammatory burden measured using TSPO-PET might predict faster subsequent progression as both enlarging lesions and the brain atrophy rate have prognostic significance for disability progression in MS (73). Another study demonstrated that an adverse clinical outcome in a group of MS patients correlated with increased TSPO binding at baseline (50). Here, a group of patients converting from clinically isolated syndrome (CIS) to clinically definite MS during a follow-up period of 2 years had higher TSPO binding in the NAWM at baseline compared to the group who retained their CIS status (50). Similarly, those SPMS patients whose EDSS improved over a follow-up period of 30 months had lower TSPO-binding in black holes at baseline compared to patients with worsening EDSS (45).
Effect of MS Therapeutics on Microglial Activation Measured Using TSPO-PET
The greatest potential for TSPO-PET imaging over conventional MRI lies in its ability to detect the diffuse compartmentalized inflammation related to microglial activation, and there are expectations for the usability of PET imaging in the quantification of treatment effects of MS drugs targeting microglial activation. The two published longitudinal TSPO-PET studies evaluating microglial activation in the NAWM of MS are by Ratchford et al. (49), and Sucksdorff et al. (52). In the first study, RRMS patients were evaluated before and after 1 year of glatiramer acetate treatment. The study demonstrated that treatment of RRMS with glatiramer acetate reduced TSPO binding significantly in both cortical GM and cerebral WM when using cerebellum as a reference region. The TSPO-PET study by Sucksdorff et al. included three serial PET images of MS patients. After 6 months of fingolimod treatment no statistically significant reduction in microglial activation could be observed in the NAWM or NAGM in the group of ten individuals taking part in the study. A reduction in microglial activation was observed, however, in T2 lesion areas. Similarly, treatment of a focal lesion in a rat EAE model demonstrated a clear reduction in microglial activation after fingolimod treatment (74). The study by Kaunzner et al. demonstrated reduction in microglial activation in focal inflammatory lesions after natalizumab treatment (53). None of these studies included a prospectively followed MS control group without treatment, and a longitudinal study which would evaluate alteration in microglial activation in untreated MS patients over time is still awaited. In fact, longitudinal TSPO-imaging studies are scarce overall. Kreisl et al. reported recently an increase in TSPO binding among patients with Alzheimer’s disease over a period of 2.4 years, compared to healthy controls (75). Tables 1 and 2 list all known MS studies performed so far using TSPO imaging.
Future Directions in PET Imaging of Activated Microglia in MS
Despite the established role for TSPO-PET imaging in detecting activated microglia in vivo there remain challenges. One is that it is presently not possible to differentiate the anti-inflammatory (M2-type) and pro-inflammatory (M1-type) phenotypes of microglia with TSPO targeting radioligands (76). To date, two radioligands targeting the P2X7 purinergic receptor, namely [11C]GSK1482160 (77, 78) and [18F]EFB (79), have been developed and tested in animal models of neuroinflammation. Importantly, the expression of P2X7 in microglia has been associated with a pro-inflammatory M1-like phenotype of these cells (80). If further studies with the P2X7-binding radioligands show potential for their use in humans, they could be applied as imaging biomarkers in future longitudinal observational and treatment studies of neuroinflammatory and neurodegenerative conditions.
Several other targets for PET imaging of microglia have also been proposed, including inducible nitric oxide synthase (iNOS), folate receptor β (FRβ), indoleamine 2,3-dioxygenase-1 (IDO-1), kynurenine-3-monooxygenase (KMO), and cannabinoid receptor 2 (CB2) (81, 82). Of these, iNOS and FRβ may have additional value over TSPO, since iNOS is potentially specific for M1-type pro-inflammatory cells, and FRβ for the M2-type homeostatic phenotype of microglia (83, 84). Radioligands for KMO have not yet been developed, and radiotracers for IDO-1 and FRβ have so far been use only in preclinical studies (85–88). Several ligands for CB2 have been developed and tested, but none of these have been found to be suitable for clinical use (82). The first human dosimetry study (89) and one pulmonary imaging study with an endotoxin challenge in healthy subjects using the iNOS-binding radioligand [18F]NOS have been reported (90), but no brain imaging studies with this radioligand have been published. However, pitfall of using iNOS-binding radioligands in the estimation of brain microglial activation is that iNOS is expressed also in macrophages and astrocytes, in addition to microglia (91).
Conclusion
Detection of microglial activation in MS brain using in vivo PET imaging has already increased our understanding of MS pathogenesis. In the future, we can expect PET imaging to provide alternative methods to monitor the disease progression, to improve the evaluation of therapeutic needs, particularly in progressive MS, and to help choose MS patients most at risk for progression into therapeutic trials of progressive MS. TSPO-PET could also be used as an important surrogate marker in therapeutic studies of progressive MS. There are still technical challenges, such as the poor signal-to noise ratio of the [11C]PK11195 radioligand, and the genetically determined variation in the binding affinity for the second-generation tracers. Moreover, heterogeneity in TSPO image analysis methodology across different imaging centers makes it difficult to perform direct comparisons between the studies. It will be important to harmonize and validate the methodology used in TSPO-PET imaging to allow multi-center studies for evaluation of larger patient cohorts. The great expense and the high technical requirements of nuclear medicine make PET a demanding technology. Nonetheless, the potential of PET imaging to visualize hidden inflammation and other pathogenic determinants in MS brain in vivo makes the pursuit of development of yet better ligands a worthwhile effort.
Author Contributions
Drafting of the manuscript and critical revision of the manuscript: LA, MN, and ER. Study supervision: LA.
Conflict of Interest Statement
The authors declare that the research was conducted in the absence of any commercial or financial relationships that could be construed as a potential conflict of interest.
Acknowledgments
The authors wish to thank all patients who have taken part in the PET imaging studies and all co-workers who have contributed to the studies.
Funding
Our funding sources are acknowledged: Finnish Academy, Sigrid Juselius Foundation, Finnish MS Foundation, Finnish Medical Association, and the European Union’s Seventh Framework Programme (FP7/2007-2013) under grant agreement no. HEALTH-F2-2011-278850 (INMiND).
References
1. Nylander A, Hafler DA. Multiple sclerosis. J Clin Invest (2012) 122(4):1180–8. doi:10.1172/JCI58649
2. Tutuncu M, Tang J, Zeid NA, Kale N, Crusan DJ, Atkinson EJ, et al. Onset of progressive phase is an age-dependent clinical milestone in multiple sclerosis. Mult Scler (2013) 19(2):188–98. doi:10.1177/1352458512451510
3. Correale J, Gaitán MI, Ysrraelit MC, Fiol MP. Progressive multiple sclerosis: from pathogenic mechanisms to treatment. Brain (2017) 140(3):527–46. doi:10.1093/brain/aww258
4. Ransohoff RM, Hafler DA, Lucchinetti CF. Multiple sclerosis-a quiet revolution. Nat Rev Neurol (2015) 11(3):134–42. doi:10.1038/nrneurol.2015.14
5. Gandhi R, Laroni A, Weiner HL. Role of the innate immune system in the pathogenesis of multiple sclerosis. J Neuroimmunol (2010) 221(1–2):7–14. doi:10.1016/j.jneuroim.2009.10.015
6. Fischer MT, Sharma R, Lim JL, Haider L, Frischer JM, Drexhage J, et al. NADPH oxidase expression in active multiple sclerosis lesions in relation to oxidative tissue damage and mitochondrial injury. Brain (2012) 135(3):886–99. doi:10.1093/brain/aws012
7. Frischer JM, Bramow S, Dal-Bianco A, Lucchinetti CF, Rauschka H, Schmidbauer M, et al. The relation between inflammation and neurodegeneration in multiple sclerosis brains. Brain (2009) 132(5):1175–89. doi:10.1093/brain/awp070
8. Lassmann H, van Horssen J, Mahad D. Progressive multiple sclerosis: pathology and pathogenesis. Nat Rev Neurol (2012) 8(11):647–56. doi:10.1038/nrneurol.2012.168
9. Moll NM, Rietsch AM, Thomas S, Ransohoff AJ, Lee JC, Fox R, et al. Multiple sclerosis normal-appearing white matter: pathology-imaging correlations. Ann Neurol (2011) 70(5):764–73. doi:10.1002/ana.22521
10. Pardini M, Cutter G, Sormani MP. Clinical trial design for progressive MS trials. Mult Scler (2017) 23(12):1642–8. doi:10.1177/1352458517729461
11. Montalban X, Hauser SL, Kappos L, Arnold DL, Bar-Or A, Comi G, et al. Ocrelizumab versus placebo in primary progressive multiple sclerosis. N Engl J Med (2017) 376(3):209–20. doi:10.1056/NEJMoa1606468
12. Ontaneda D, Cohen JA, Amato MP. Clinical outcome measures for progressive MS trials. Mult Scler (2017) 23(12):1627–35. doi:10.1177/1352458517729465
13. Thompson AJ. Challenge of progressive multiple sclerosis therapy. Curr Opin Neurol (2017) 30(3):237–40. doi:10.1097/WCO.0000000000000453
14. Lublin FD, Reingold SC, Cohen JA, Cutter GR, Sorensen PS, Thompson AJ, et al. Defining the clinical course of multiple sclerosis: the 2013 revisions. Neurology (2014) 83(3):278–86. doi:10.1212/wnl.0000000000000560
15. Zanzonico P. Principles of nuclear medicine imaging: planar, SPECT, PET, multi-modality, and autoradiography systems. Radiat Res (2012) 177(4):349–64. doi:10.1667/RR2577.1
16. van den Hoff J. Principles of quantitative positron emission tomography. Amino Acids (2005) 29(4):341–53. doi:10.1007/s00726-005-0215-8
17. Owen DR, Piccini P, Matthews PM. Towards molecular imaging of multiple sclerosis. Mult Scler (2011) 17(3):262–72. doi:10.1177/1352458510390070
18. Wadsak W, Mitterhauser M. Basics and principles of radiopharmaceuticals for PET/CT. Eur J Radiol (2010) 73(3):461–9. doi:10.1016/j.ejrad.2009.12.022
19. Ciccarelli O, Barkhof F, Bodini B, De Stefano N, Golay X, Nicolay K, et al. Pathogenesis of multiple sclerosis: insights from molecular and metabolic imaging. Lancet Neurol (2014) 13(8):807–22. doi:10.1016/S1474-4422(14)70101-2
20. Rissanen E, Tuisku J, Rokka J, Paavilainen T, Parkkola R, Rinne JO, et al. In vivo detection of diffuse inflammation in secondary progressive multiple sclerosis using PET imaging and the radioligand 11C-PK11195. J Nucl Med (2014) 55(6):939–44. doi:10.2967/jnumed.113.131698
21. Cosenza-Nashat M, Zhao ML, Suh HS, Morgan J, Natividad R, Morgello S, et al. Expression of the translocator protein of 18 kDa by microglia, macrophages and astrocytes based on immunohistochemical localization in abnormal human brain. Neuropathol Appl Neurobiol (2009) 35(3):306–28. doi:10.1111/j.1365-2990.2008.01006.x
22. Maeda J, Higuchi M, Inaji M, Ji B, Haneda E, Okauchi T, et al. Phase-dependent roles of reactive microglia and astrocytes in nervous system injury as delineated by imaging of peripheral benzodiazepine receptor. Brain Res (2007) 1157:100–11. doi:10.1016/j.brainres.2007.04.054
23. Ching AS, Kuhnast B, Damont A, Roeda D, Tavitian B, Dolle F. Current paradigm of the 18-kDa translocator protein (TSPO) as a molecular target for PET imaging in neuroinflammation and neurodegenerative diseases. Insights Imaging (2012) 3(1):111–9. doi:10.1007/s13244-011-0128-x
24. Mukhin AG, Papadopoulos V, Costa E, Krueger KE. Mitochondrial benzodiazepine receptors regulate steroid biosynthesis. Proc Natl Acad Sci U S A (1989) 86(24):9813–6. doi:10.1073/pnas.86.24.9813
25. Veenman L, Shandalov Y, Gavish M. VDAC activation by the 18 kDa translocator protein (TSPO), implications for apoptosis. J Bioenerg Biomembr (2008) 40(3):199–205. doi:10.1007/s10863-008-9142-1
26. Hong SH, Choi HB, Kim SU, McLarnon JG. Mitochondrial ligand inhibits store-operated calcium influx and COX-2 production in human microglia. J Neurosci Res (2006) 83(7):1293–8. doi:10.1002/jnr.20829
27. Mattner F, Katsifis A, Staykova M, Ballantyne P, Willenborg DO. Evaluation of a radiolabelled peripheral benzodiazepine receptor ligand in the central nervous system inflammation of experimental autoimmune encephalomyelitis: a possible probe for imaging multiple sclerosis. Eur J Nucl Med Mol Imaging (2005) 32(5):557–63. doi:10.1007/s00259-004-1690-y
28. Doble A, Malgouris C, Daniel M, Daniel N, Imbault F, Basbaum A, et al. Labelling of peripheral-type benzodiazepine binding sites in human brain with [3H]PK 11195: anatomical and subcellular distribution. Brain Res Bull (1987) 18(1):49–61. doi:10.1016/0361-9230(87)90033-5
29. Banati RB, Myers R, Kreutzberg GW. PK (‘peripheral benzodiazepine’) – binding sites in the CNS indicate early and discrete brain lesions: microautoradiographic detection of [3H]PK11195 binding to activated microglia. J Neurocytol (1997) 26(2):77–82. doi:10.1023/A:1018567510105
30. Banati RB, Newcombe J, Gunn RN, Cagnin A, Turkheimer F, Heppner F, et al. The peripheral benzodiazepine binding site in the brain in multiple sclerosis: quantitative in vivo imaging of microglia as a measure of disease activity. Brain (2000) 123(Pt 11):2321–37. doi:10.1093/brain/123.11.2321
31. Ji B, Maeda J, Sawada M, Ono M, Okauchi T, Inaji M, et al. Imaging of peripheral benzodiazepine receptor expression as biomarkers of detrimental versus beneficial glial responses in mouse models of Alzheimer’s and other CNS pathologies. J Neurosci (2008) 28(47):12255–67. doi:10.1523/JNEUROSCI.2312-08.2008
32. Kuhlmann AC, Guilarte TR. Cellular and subcellular localization of peripheral benzodiazepine receptors after trimethyltin neurotoxicity. J Neurochem (2000) 74(4):1694–704. doi:10.1046/j.1471-4159.2000.0741694.x
33. Rojas S, Martin A, Arranz MJ, Pareto D, Purroy J, Verdaguer E, et al. Imaging brain inflammation with [(11)C]PK11195 by PET and induction of the peripheral-type benzodiazepine receptor after transient focal ischemia in rats. J Cereb Blood Flow Metab (2007) 27(12):1975–86. doi:10.1038/sj.jcbfm.9600500
34. Daugherty DJ, Chechneva O, Mayrhofer F, Deng W. The hGFAP-driven conditional TSPO knockout is protective in a mouse model of multiple sclerosis. Sci Rep (2016) 6:22556. doi:10.1038/srep22556
35. Narayan N, Mandhair H, Smyth E, Dakin SG, Kiriakidis S, Wells L, et al. The macrophage marker translocator protein (TSPO) is down-regulated on pro-inflammatory ‘M1’ human macrophages. PLoS One (2017) 12(10):e0185767. doi:10.1371/journal.pone.0185767
36. Owen DR, Narayan N, Wells L, Healy L, Smyth E, Rabiner EA, et al. Pro-inflammatory activation of primary microglia and macrophages increases 18 kDa translocator protein expression in rodents but not humans. J Cereb Blood Flow Metab (2017) 37(8):2679–90. doi:10.1177/0271678x17710182
37. Benavides J, Guilloux F, Rufat P, Uzan A, Renault C, Dubroeucq MC, et al. In vivo labelling in several rat tissues of ‘peripheral type’ benzodiazepine binding sites. Eur J Pharmacol (1984) 99(1):1–7. doi:10.1016/0014-2999(84)90425-4
38. Junck L, Olson JM, Ciliax BJ, Koeppe RA, Watkins GL, Jewett DM, et al. PET imaging of human gliomas with ligands for the peripheral benzodiazepine binding site. Ann Neurol (1989) 26(6):752–8. doi:10.1002/ana.410260611
39. Vowinckel E, Reutens D, Becher B, Verge G, Evans A, Owens T, et al. PK11195 binding to the peripheral benzodiazepine receptor as a marker of microglia activation in multiple sclerosis and experimental autoimmune encephalomyelitis. J Neurosci Res (1997) 50(2):345–53. doi:10.1002/(SICI)1097-4547(19971015)50:2<345:AID-JNR22>3.0.CO;2-5/
40. Banati RB, Middleton RJ, Chan R, Hatty CR, Wai-Ying Kam W, Quin C, et al. Positron emission tomography and functional characterization of a complete PBR/TSPO knockout. Nat Commun (2014) 5:5452. doi:10.1038/ncomms6452
41. Schweitzer PJ, Fallon BA, Mann JJ, Kumar JS. PET tracers for the peripheral benzodiazepine receptor and uses thereof. Drug Discov Today (2010) 15(21–22):933–42. doi:10.1016/j.drudis.2010.08.012
42. Tomasi G, Edison P, Bertoldo A, Roncaroli F, Singh P, Gerhard A, et al. Novel reference region model reveals increased microglial and reduced vascular binding of 11C-(R)-PK11195 in patients with Alzheimer’s disease. J Nucl Med (2008) 49(8):1249–56. doi:10.2967/jnumed.108.050583
43. Yaqub M, van Berckel BN, Schuitemaker A, Hinz R, Turkheimer FE, Tomasi G, et al. Optimization of supervised cluster analysis for extracting reference tissue input curves in (R)-[(11)C]PK11195 brain PET studies. J Cereb Blood Flow Metab (2012) 32(8):1600–8. doi:10.1038/jcbfm.2012.59
44. Turkheimer FE, Edison P, Pavese N, Roncaroli F, Anderson AN, Hammers A, et al. Reference and target region modeling of [11C]-(R)-PK11195 brain studies. J Nucl Med (2007) 48(1):158–67.
45. Giannetti P, Politis M, Su P, Turkheimer F, Malik O, Keihaninejad S, et al. Microglia activation in multiple sclerosis black holes predicts outcome in progressive patients: an in vivo [(11)C](R)-PK11195-PET pilot study. Neurobiol Dis (2014) 65:203–10. doi:10.1016/j.nbd.2014.01.018
46. Politis M, Giannetti P, Su P, Turkheimer F, Keihaninejad S, Wu K, et al. Increased PK11195 PET binding in the cortex of patients with MS correlates with disability. Neurology (2012) 79(6):523–30. doi:10.1212/WNL.0b013e3182635645
47. Debruyne JC, Versijpt J, Van Laere KJ, De Vos F, Keppens J, Strijckmans K, et al. PET visualization of microglia in multiple sclerosis patients using [11C]PK11195. Eur J Neurol (2003) 10(3):257–64. doi:10.1046/j.1468-1331.2003.00571.x
48. Versijpt J, Debruyne JC, Van Laere KJ, De Vos F, Keppens J, Strijckmans K, et al. Microglial imaging with positron emission tomography and atrophy measurements with magnetic resonance imaging in multiple sclerosis: a correlative study. Mult Scler (2005) 11(2):127–34. doi:10.1191/1352458505ms1140oa
49. Ratchford JN, Endres CJ, Hammoud DA, Pomper MG, Shiee N, McGready J, et al. Decreased microglial activation in MS patients treated with glatiramer acetate. J Neurol (2012) 259(6):1199–205. doi:10.1007/s00415-011-6337-x
50. Giannetti P, Politis M, Su P, Turkheimer FE, Malik O, Keihaninejad S, et al. Increased PK11195-PET binding in normal-appearing white matter in clinically isolated syndrome. Brain (2015) 138(Pt 1):110–9. doi:10.1093/brain/awu331
51. Tarkkonen A, Rissanen E, Tuokkola T, Airas L. Utilization of PET imaging in differential diagnostics between a tumefactive multiple sclerosis lesion and low-grade glioma. Mult Scler Relat Disord (2016) 9:147–9. doi:10.1016/j.msard.2016.07.016
52. Sucksdorff M, Rissanen E, Tuisku J, Nuutinen S, Paavilainen T, Rokka J, et al. Evaluation of the effect of fingolimod treatment on microglial activation using serial PET imaging in multiple sclerosis. J Nucl Med (2017) 58(10):1646–51. doi:10.2967/jnumed.116.183020
53. Kaunzner UW, Kang Y, Monohan E, Kothari PJ, Nealon N, Perumal J, et al. Reduction of PK11195 uptake observed in multiple sclerosis lesions after natalizumab initiation. Mult Scler Relat Disord (2017) 15:27–33. doi:10.1016/j.msard.2017.04.008
54. Owen DR, Gunn RN, Rabiner EA, Bennacef I, Fujita M, Kreisl WC, et al. Mixed-affinity binding in humans with 18-kDa translocator protein ligands. J Nucl Med (2011) 52(1):24–32. doi:10.2967/jnumed.110.079459
55. Venneti S, Lopresti BJ, Wiley CA. Molecular imaging of microglia/macrophages in the brain. Glia (2013) 61(1):10–23. doi:10.1002/glia.22357
56. Datta G, Colasanti A, Kalk N, Owen D, Scott G, Rabiner EA, et al. 11C-PBR28 and 18F-PBR111 detect white matter inflammatory heterogeneity in multiple sclerosis. J Nucl Med (2017) 58(9):1477–82. doi:10.2967/jnumed.116.187161
57. Datta G, Colasanti A, Rabiner EA, Gunn RN, Malik O, Ciccarelli O, et al. Neuroinflammation and its relationship to changes in brain volume and white matter lesions in multiple sclerosis. Brain (2017) 140(11):2927–38. doi:10.1093/brain/awx228
58. Takano A, Piehl F, Hillert J, Varrone A, Nag S, Gulyás B, et al. In vivo TSPO imaging in patients with multiple sclerosis: a brain PET study with [18F]FEDAA1106. EJNMMI Res (2013) 3(1):30. doi:10.1186/2191-219X-3-30
59. Vomacka L, Albert NL, Lindner S, Unterrainer M, Mahler C, Brendel M, et al. TSPO imaging using the novel PET ligand [18F]GE-180: quantification approaches in patients with multiple sclerosis. EJNMMI Res (2017) 7(1):89. doi:10.1186/s13550-017-0340-x
60. Herranz E, Giannì C, Louapre C, Treaba CA, Govindarajan ST, Ouellette R, et al. Neuroinflammatory component of gray matter pathology in multiple sclerosis. Ann Neurol (2016) 80(5):776–90. doi:10.1002/ana.24791
61. Oh U, Fujita M, Ikonomidou VN, Evangelou IE, Matsuura E, Harberts E, et al. Translocator protein PET imaging for glial activation in multiple sclerosis. J Neuroimmune Pharmacol (2011) 6(3):354–61. doi:10.1007/s11481-010-9243-6
62. Owen DR, Yeo AJ, Gunn RN, Song K, Wadsworth G, Lewis A, et al. An 18-kDa translocator protein (TSPO) polymorphism explains differences in binding affinity of the PET radioligand PBR28. J Cereb Blood Flow Metab (2012) 32(1):1–5. doi:10.1038/jcbfm.2011.147
63. Vas A, Shchukin Y, Karrenbauer VD, Cselényi Z, Kostulas K, Hillert J, et al. Functional neuroimaging in multiple sclerosis with radiolabelled glia markers: preliminary comparative PET studies with [11C]vinpocetine and [11C]PK11195 in patients. J Neurol Sci (2008) 264(1–2):9–17. doi:10.1016/j.jns.2007.07.018
64. Park E, Gallezot JD, Delgadillo A, Liu S, Planeta B, Lin SF, et al. (11)C-PBR28 imaging in multiple sclerosis patients and healthy controls: test-retest reproducibility and focal visualization of active white matter areas. Eur J Nucl Med Mol Imaging (2015) 42(7):1081–92. doi:10.1007/s00259-015-3043-4
65. Datta G, Violante IR, Scott G, Zimmerman K, Santos-Ribeiro A, Rabiner EA, et al. Translocator positron-emission tomography and magnetic resonance spectroscopic imaging of brain glial cell activation in multiple sclerosis. Mult Scler (2017) 23(11):1469–78. doi:10.1177/1352458516681504
66. Colasanti A, Guo Q, Muhlert N, Giannetti P, Onega M, Newbould RD, et al. In vivo assessment of brain white matter inflammation in multiple sclerosis with (18)F-PBR111 PET. J Nucl Med (2014) 55(7):1112–8. doi:10.2967/jnumed.113.135129
67. Colasanti A, Guo Q, Giannetti P, Wall MB, Newbould RD, Bishop C, et al. Hippocampal neuroinflammation, functional connectivity, and depressive symptoms in multiple sclerosis. Biol Psychiatry (2016) 80(1):62–72. doi:10.1016/j.biopsych.2015.11.022
68. Dickens AM, Vainio S, Marjamäki P, Johansson J, Lehtiniemi P, Rokka J, et al. Detection of microglial activation in an acute model of neuroinflammation using PET and radiotracers 11C-(R)-PK11195 and 18F-GE-180. J Nucl Med (2014) 55(3):466–72. doi:10.2967/jnumed.113.125625
69. Rizzo G, Veronese M, Tonietto M, Zanotti-Fregonara P, Turkheimer FE, Bertoldo A. Kinetic modeling without accounting for the vascular component impairs the quantification of [(11)C]PBR28 brain PET data. J Cereb Blood Flow Metab (2014) 34(6):1060–9. doi:10.1038/jcbfm.2014.55
70. Bloomfield PS, Selvaraj S, Veronese M, Rizzo G, Bertoldo A, Owen DR, et al. Microglial activity in people at ultra high risk of psychosis and in schizophrenia: an [(11)C]PBR28 PET brain imaging study. Am J Psychiatry (2016) 173(1):44–52. doi:10.1176/appi.ajp.2015.14101358
71. Feeney C, Scott G, Raffel J, Roberts S, Coello C, Jolly A, et al. Kinetic analysis of the translocator protein positron emission tomography ligand [18F]GE-180 in the human brain. Eur J Nucl Med Mol Imaging (2016) 43(12):2201–10. doi:10.1007/s00259-016-3444-z
72. Fan Z, Calsolaro V, Atkinson RA, Femminella GD, Waldman A, Buckley C, et al. Flutriciclamide (18F-GE180) PET: first in human PET study of novel 3rd generation in vivo marker of human translator protein. J Nucl Med (2016) 57(11):1753–9. doi:10.2967/jnumed.115.169078
73. Sormani MP, Arnold DL, De Stefano N. Treatment effect on brain atrophy correlates with treatment effect on disability in multiple sclerosis. Ann Neurol (2014) 75(1):43–9. doi:10.1002/ana.24018
74. Airas L, Dickens A, Elo P, Marjamaki PM, Johansson J, Eskola O, et al. In vivo Positron emission tomography imaging demonstrates diminished microglial activation after fingolimod treatment in an animal model of multiple sclerosis. J Nucl Med (2015) 56(2):305–10. doi:10.2967/jnumed.114.149955
75. Kreisl WC, Lyoo CH, Liow JS, Wei M, Snow J, Page E, et al. (11)C-PBR28 binding to translocator protein increases with progression of Alzheimer’s disease. Neurobiol Aging (2016) 44:53–61. doi:10.1016/j.neurobiolaging.2016.04.011
76. Amici SA, Dong J, Guerau-de-Arellano M. Molecular mechanisms modulating the phenotype of macrophages and microglia. Front Immunol (2017) 8:1520. doi:10.3389/fimmu.2017.01520
77. Territo PR, Meyer JA, Peters JS, Riley AA, McCarthy BP, Gao M, et al. Characterization of 11C-GSK1482160 for targeting the P2X7 receptor as a biomarker for neuroinflammation. J Nucl Med (2017) 58(3):458–65. doi:10.2967/jnumed.116.181354
78. Han J, Liu H, Liu C, Jin H, Perlmutter JS, Egan TM, et al. Pharmacologic characterizations of a P2X7 receptor-specific radioligand, [11C]GSK1482160 for neuroinflammatory response. Nucl Med Commun (2017) 38(5):372–82. doi:10.1097/MNM.0000000000000660
79. Fantoni ER, Dal Ben D, Falzoni S, Di Virgilio F, Lovestone S, Gee A. Design, synthesis and evaluation in an LPS rodent model of neuroinflammation of a novel 18F-labelled PET tracer targeting P2X7. EJNMMI Res (2017) 7(1):31. doi:10.1186/s13550-017-0275-2
80. Beaino W, Janssen B, Kooij G, van der Pol SMA, van Het Hof B, van Horssen J, et al. Purinergic receptors P2Y12R and P2X7R: potential targets for PET imaging of microglia phenotypes in multiple sclerosis. J Neuroinflammation (2017) 14(1):259. doi:10.1186/s12974-017-1034-z
81. Tronel C, Largeau B, Santiago Ribeiro MJ, Guilloteau D, Dupont AC, Arlicot N. Molecular targets for PET imaging of activated microglia: the current situation and future expectations. Int J Mol Sci (2017) 18(4):802. doi:10.3390/ijms18040802
82. Spinelli F, Mu L, Ametamey SM. Radioligands for positron emission tomography imaging of cannabinoid type 2 receptor. J Labelled Comp Radiopharm (2017). doi:10.1002/jlcr.3579
83. Franco R, Fernandez-Suarez D. Alternatively activated microglia and macrophages in the central nervous system. Prog Neurobiol (2015) 131:65–86. doi:10.1016/j.pneurobio.2015.05.003
84. Puig-Kroger A, Sierra-Filardi E, Dominguez-Soto A, Samaniego R, Corcuera MT, Gomez-Aguado F, et al. Folate receptor beta is expressed by tumor-associated macrophages and constitutes a marker for M2 anti-inflammatory/regulatory macrophages. Cancer Res (2009) 69(24):9395–403. doi:10.1158/0008-5472.can-09-2050
85. Guastella AR, Michelhaugh SK, Klinger NV, Kupsky WJ, Polin LA, Muzik O, et al. Tryptophan PET imaging of the kynurenine pathway in patient-derived xenograft models of glioblastoma. Mol Imaging (2016) 15:1–11. doi:10.1177/1536012116644881
86. Huang X, Gillies RJ, Tian H. Synthesis of [(18) F] 4-amino-N-(3-chloro-4-fluorophenyl)-N’-hydroxy-1,2,5-oxadiazole-3-carboximidamide (IDO5L): a novel potential PET probe for imaging of IDO1 expression. J Labelled Comp Radiopharm (2015) 58(4):156–62. doi:10.1002/jlcr.3263
87. Kularatne SA, Belanger MJ, Meng X, Connolly BM, Vanko A, Suresch DL, et al. Comparative analysis of folate derived PET imaging agents with [(18)F]-2-fluoro-2-deoxy-d-glucose using a rodent inflammatory paw model. Mol Pharm (2013) 10(8):3103–11. doi:10.1021/mp4001684
88. Gent YY, Weijers K, Molthoff CF, Windhorst AD, Huisman MC, Smith DE, et al. Evaluation of the novel folate receptor ligand [18F]fluoro-PEG-folate for macrophage targeting in a rat model of arthritis. Arthritis Res Ther (2013) 15(2):R37. doi:10.1186/ar4191
89. Herrero P, Laforest R, Shoghi K, Zhou D, Ewald G, Pfeifer J, et al. Feasibility and dosimetry studies for 18F-NOS as a potential PET radiopharmaceutical for inducible nitric oxide synthase in humans. J Nucl Med (2012) 53(6):994–1001. doi:10.2967/jnumed.111.088518
90. Huang HJ, Isakow W, Byers DE, Engle JT, Griffin EA, Kemp D, et al. Imaging pulmonary inducible nitric oxide synthase expression with PET. J Nucl Med (2015) 56(1):76–81. doi:10.2967/jnumed.114.146381
Keywords: microglia, positron emission tomography, imaging, 18-kDa translocator protein, multiple sclerosis
Citation: Airas L, Nylund M and Rissanen E (2018) Evaluation of Microglial Activation in Multiple Sclerosis Patients Using Positron Emission Tomography. Front. Neurol. 9:181. doi: 10.3389/fneur.2018.00181
Received: 15 December 2017; Accepted: 08 March 2018;
Published: 26 March 2018
Edited by:
Mireia Guerau-de-Arellano, The Ohio State University, United StatesReviewed by:
Heinz Wiendl, Universität Münster, GermanyCrystal C. Watkins, Johns Hopkins University, United States
Copyright: © 2018 Airas, Nylund and Rissanen. This is an open-access article distributed under the terms of the Creative Commons Attribution License (CC BY). The use, distribution or reproduction in other forums is permitted, provided the original author(s) and the copyright owner are credited and that the original publication in this journal is cited, in accordance with accepted academic practice. No use, distribution or reproduction is permitted which does not comply with these terms.
*Correspondence: Laura Airas, bGF1cmEuYWlyYXNAdXR1LmZp