 Tao Guo
 Xiaojun Guan
 Peiyu Huang
 Minming Zhang
- Department of Radiology, The Second Affiliated Hospital of Zhejiang University School of Medicine, Hangzhou, China
Background and objective: Rapid eye movement sleep behavior disorder (RBD) has a strong association with alpha synucleinpathies such as Parkinson’s disease (PD) and PD patients with RBD tend to have a poorer prognosis. However, we still know little about the pathogenesis of RBD in PD. Therefore, we aim to detect the alterations of structural correlation network (SCN) in PD patients with and without RBD.
Materials and methods: A total of 191 PD patients, including 51 patients with possible RBD (pRBD) and 140 patients with non-possible RBD, and 76 normal controls were included in the present study. Structural brain networks were constructed by thresholding gray matter volume correlation matrices of 116 regions and analyzed using graph theoretical approaches.
Results: There was no difference in global properties among the three groups. Significant enhanced regional nodal measures in limbic system, frontal-temporal regions, and occipital regions and decreased nodal measures in cerebellum were found in PD patients with pRBD (PD-pRBD) compared with PD patients without pRBD. Besides, nodes in frontal lobe, temporal lobe, and limbic system were served as hubs in both two PD groups, and PD-pRBD exhibited additionally recruited hubs in limbic regions.
Conclusion: Based on the SCN analysis, we found PD-pRBD exhibited a reorganization of nodal properties as well as the remapping of the hub distribution in whole brain especially in limbic system, which may shed light to the pathophysiology of PD with RBD.
Introduction
Rapid eye movement (REM) sleep behavior disorder (RBD) is a common parasomnia characterized by the loss of normal skeletal muscle atonia during REM sleep with prominent dreaming and motor activity (1–3). Studies showed that it has a strong association with alpha synucleinpathies such as Parkinson’s disease (PD) (4, 5), where it can either occur during the course of the disease or appear in the prodromal phase of PD (6). The prevalence of RBD in PD is up to 37–47% (7) and PD patients with RBD tend to have a poorer prognosis in terms of postural instability, gait disturbance, cognitive impairment, and even an association with visual hallucination compared with PD patients without RBD (8, 9). However, we still know little about the pathogenesis of RBD in PD, which may block our further understanding of complex substrate of PD.
Parkinson’s disease is a neurodegenerative disease characterized by alpha-synuclein accumulation, progressing in an ascending pattern from lower brainstem to limbic system and then to neocortex (10). Patients with RBD symptoms exhibited abnormalities in sleep-wake transitions (11, 12), which stem from the aberrant brainstem reticular formation (13). Alpha-synuclein accumulation in brainstem structures such as reticular formation may lead to the presence of RBD symptoms (14). Current physiological studies indicate that limbic system including amygdala and hippocampus, and neocortex such as frontal lobe play important roles in REM sleep, which is abnormal in patients with RBD symptoms (13, 15, 16). Therefore, based on the pathological substrate in brainstem, we argued that searching in vivo evidence would help disclose the differential phenotype of cerebral abnormalities during the clinical manifestation of RBD symptoms in PD patients.
Neuroimaging is becoming a powerful tool for investigating brain structure or function in vivo. To date, there have been increasing neuroimaging studies to investigate the alterations both in idiopathic RBD (iRBD) and in PD patients with RBD (PD-RBD). Increased gray matter (GM) density in hippocampus was observed in iRBD (17). PD-RBD patients showed decreased neocortical, limbic cortical, and thalamic cholinergic innervation (18), decreased regional GM volume in hippocampus and left posterior cingulate (19), decreased brain activity in primary motor cortex (20), and increased volume in frontal areas, mid-cingulate gyrus, and superior temporal gyrus (21). Taken together, we postulated that PD-RBD patients might exhibit abnormalities in whole brain including limbic system and neocortex. However, the understandings of these potential changes underlying the PD-RBD are unclear.
Recently, structural correlation network (SCN), a graph theory analysis, proposed a specific method to explore brain organization (22–24). SCN employs correlation analysis for a cross-sectional imaging data, could measure synchronized morphological alterations undergoing common pathological processes between brain regions (25, 26). Recent studies have suggested that PD patients are associated with abnormal SCN such as reduced global efficiency and reorganization of network hub in cortical thickness-based SCN (27–29). Another morphometric feature, GM volume, could also be used to construct large-scale SCN, which could reveal intrinsic structural organization in human brain (30). Considering that the alterations in PD-RBD may be widespread around the brain, therefore, in our study, we constructed GM volume-based SCN to explore the topological changes in whole brain in PD patients with possible RBD (PD-pRBD) and PD patients with non-possible RBD (PD-npRBD). We hypothesized that both PD-pRBD and PD-npRBD would exhibited disrupted structural organization and PD-pRBD would exhibited specific alterations related to limbic system or neocortex.
Materials and Methods
Participants
Data used in the preparation of this article were obtained from the Parkinson’s Progression Markers Initiative (PPMI) database (www.ppmi-info.org/data). For up-to-date information on the study, please visit www.ppmi-info.org. Written informed consent was obtained from all participants, and all PPMI sites received approval from their respective ethics committee on human experimentation prior to study initiation. PPMI is a large multicenter study, and consequently, a mixture of different MRI acquisitions have been used in the generation of the imaging dataset. To create a homogenous MRI dataset, we only selected those participants who had undergone T1 MRI scanning with a magnetization prepared rapid gradient echo (MPRAGE) sequence. Those PD subjects who did not have data of RBD Sleep Questionnaire (RBDSQ), MDS-UPDRS-III in off status were excluded. Normal controls (NCs) with RBDSQ score more than five were also excluded in order to remove the possibility of RBD. For a specific subject, we usually selected his baseline data, in case of poor image quality, the follow-up data were selected instead. Then, 215 PD patients and 81 NCs were initially recruited. The presence of possible RBD (pRBD, i.e., a history of dream enactment suggested by questionnaire response, but not confirmed with clinical interview/polysomnogram) was assessed by the RBDSQ (31). RBDSQ is a 10-item, patient self-rating questionnaire assessing the subject’s sleep behavior. The maximum total score of the questionnaire is 13 (32). A score of ≥6 maximizes sensitivity/specificity for RBD in the PD population and was considered as pRBD in this study (33). PD patients with a score of ≤ five of RBDSQ were classified as non-possible RBD (npRBD).
All participants’ neuropsychological performance and motor function were assessed. Participants’ neuropsychological performance was measured across a variety of cognitive tests, including Hopkins Verbal Learning Test-Revised (HVLT-R), Benton Judgment of Line Orientation (BJLO), letter number sequencing (LNS), semantic fluency (SF), and symbol digit modalities test (SDMT). Motor function for all participants in this study was evaluated using MDS-UPDRS-III and Hoehn & Yahr (H&Y) stage.
MRI Data Acquisition and Preprocessing
All three-dimensional T1-weighted MRI data were downloaded from the PPMI database. All of these images were acquired in the sagittal plane on Siemens scanners (Erlangen, Germany) at different centers using the MPRAGE sequence. The acquisition parameters were as follows: repetition time = 2,300 ms; echo time = 2.98 ms; inversion time = 900 ms; flip angle = 9°; matrix = 240 × 256; voxel = 1 mm × 1 mm × 1 mm; and slice number = 176.
T1-weighted structural images were preprocessed using Computational Anatomy Toolbox (CAT12) (http://dbm.neuro.uni-jena.de/cat12/) with SPM 12 (http://www.fil.ion.ucl.ac.uk/spm/software/spm12/). All T1-weighted images were segmented into GM, white matter, and cerebrospinal fluid. Then, MRI inhomogeneities and noise were removed and image intensities were normalized. The resulted images were registered to the Montreal Neurological Institute standard space. A partial volume estimation was extended to account for mixed voxels with two tissue types and spatial normalization was conducted using DARTEL. Subsequently, we estimated the total intracranial volume (TIV) and then conducted quality control of all images before further analysis. To further control the image quality, we used mean correlation, Mahalanobis distance and weighted overall image quality algorithms to quantify image quality. Raw images from a noticeable lower quality (below 2 SD) were rechecked and finally excluded (24 PD patients and five NCs). Finally, the obtained preprocessed structural data from 191 PD (51 PD-pRBD and 140 PD-npRBD) patients and 76 NCs were smoothed with an 8 mm full width at half maximum.
Construction of SCN
Individual modulated, normalized GM maps were used for graph analysis with GAT toolbox (https://mailman.stanford.edu/mailman/listinfo/gat_user_forum). Firstly, we selected 116 ROIs including bilateral cortical, subcortical and cerebellar gray created using the Automatic Anatomic Labeling atlas as nodes, and extracted volume information within each ROI for each subject. For each group, a 116 × 116 structural correlation matrix (Figure 1) was generated by performing Pearson correlation. The nuisance covariates including age, gender, and TIV were removed by performing a linear regression analysis. The edge between each pair of nodes was constructed when the correlation strength between the corresponding brain regions exceeded a certain threshold. Since thresholding, the correlation matrices at different thresholds could produce networks with different number of edges and may influence the network properties (23), we thresholded the correlation matrices at a range of network densities (from the estimated minimum density of 0.1 to maximum density of 0.5 with an interval of 0.02) ensuring the same number of edges in different networks. Then, we compared the network topologies among different groups at each level. The edges in the SCN represented the GM similarity between each pair of nodes.
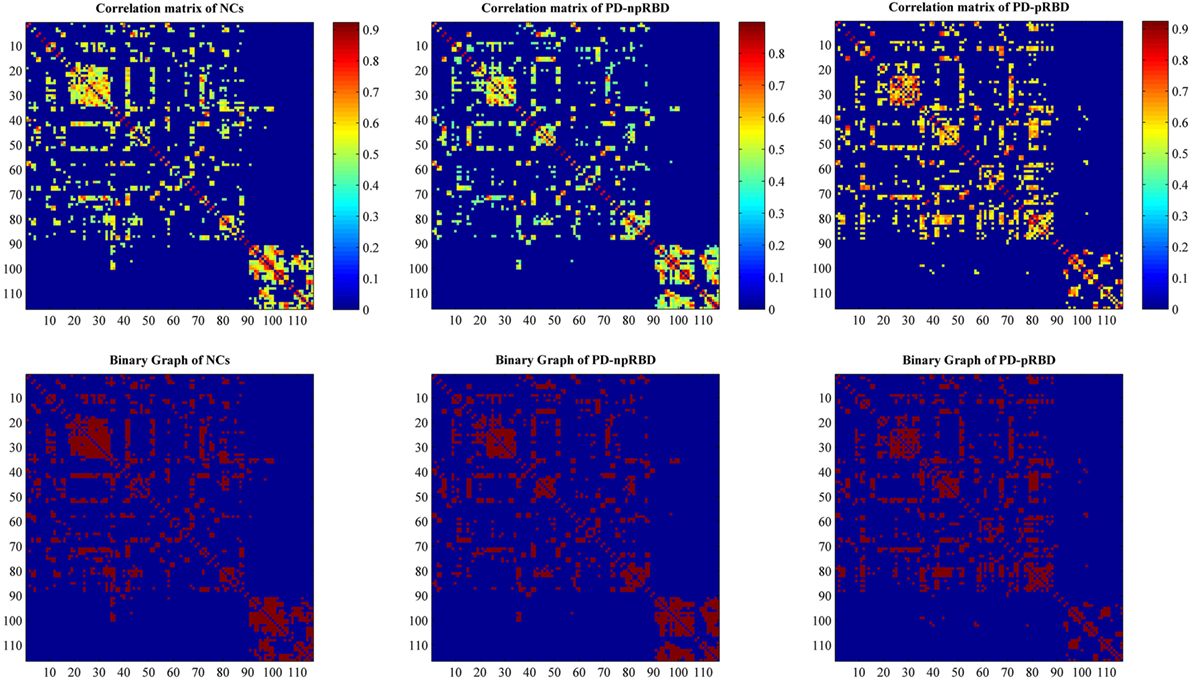
Figure 1. Structural correlation matrices for normal controls (NCs), Parkinson’s disease (PD) patients with possible rapid eye movement sleep behavior disorder (RBD) (PD-pRBD), and PD patients with non-possible RBD (PD-npRBD). The upper row represents weighted structural correlation matrices for NCs, PD-npRBD, and PD-pRBD; the color bar shows the strength of the connections. The lower row represents corresponding binary correlation matrices for NCs, PD-npRBD, and PD-pRBD; red color shows the presence of connection.
Network Analyses
Small-World Parameters
The small-worldness of a complex network has the following two crucial metrics: the clustering coefficient (C) and the characteristic path length (L). To evaluate the topology of the brain network, these parameters were compared to the corresponding mean values of a random graph (20 generated null networks) with the same number of nodes and edges as the network of interest. We obtained the normalized clustering coefficient (γ = C/Crand) and the normalized characteristic path length (λ = L/Lrand), and thus small-worldness index (σ = γ/λ) could be computed. In a small-world network, γ > 1 and λ ≈ 1 or σ > 1, which mean that the clustering coefficient is significantly higher than that of random networks, while the characteristic path length is comparable to random networks.
Network Measures
We calculated the global measures including global efficiency, mean local efficiency, regional measures including nodal degree, nodal betweenness, nodal clustering coefficient, and nodal local efficiency, and hub distribution. Briefly, global efficiency measures the ability of parallel information transfer in the network, and mean local efficiency measures the fault tolerance of the network, indicating the capacity for information exchange within each subgraph when the index node is eliminated (34). Nodal degree measures the number of connections to a node, which indicates a node’s accessibility; nodal betweenness reflects the important roles of nodal communication across a node as the bridge; nodal clustering coefficient measures how close the node’s neighbors are to forming a clique; nodal local efficiency indicates the capacity of the subgraph to exchange information if a given node is eliminated (35–38). A node is considered as a hub if its nodal degree is one SD higher than the mean network degree. Detailed calculations of these network measures are shown in Supplementary Material.
Statistical Analyses
Differences between groups in demographic and neuropsychological variables were analyzed using independent sample T test for normally distributed continuous data, Mann–Whitney U test for non-normally distributed continuous data, Pearson’s chi-squared test for categorical data in SPSS 19.0. The normality of the data was confirmed by one-sample Kolmogorov–Smirnov test. The significance of group differences was set at P < 0.05.
In order to test the statistical significance of the between-group differences (PD-pRBD vs. NCs, PD-npRBD vs. NCs, PD-pRBD vs. PD-npRBD) in network global topology and regional nodal measures, a non-parametric permutation test with 1,000 repetitions was used. Each network metric extracted across the specified density range (0.1:0.02:0.5) is represented by a curve that depicts the change in a specific network metric (for each group) as a function of network density. In order to compare these curves between groups, a summary measure using areas under the curve (AUC) analysis was performed. Finally, GAT generated the plots of between-group differences in regional network measures along with the quantified confidence intervals as a function of network density. P < 0.05 was regarded as significant.
Validation Analyses
As the different cognitive performance between patient groups may influence brain organization, we also constructed another network in the same procedures, but with extra covariates included scores of BJLO, HVLT-R_total recall, HVLT-R_delayed recall, HVLT-R_retention, HVLT-R_recognition discrimination index, LNS, SF, and SDMT (results shown in Supplementary Material). Of note, due to the missing data of SDMT score in four PD patients (one for PD-pRBD and three for PD-npRBD), only 50 PD-pRBD and 137 PD-npRBD were included.
Results
Cohort Characteristics
No significant difference in age, gender, and education was found between any two groups (Table 1). PD-pRBD and PD-npRBD were not significantly different in MDS-UPDRS-III and H&Y stage. As for cognitive performance, PD-pRBD patients performed worse on all of cognitive tests compared with NCs. When comparing with PD-npRBD, PD-pRBD performed worse on most of cognitive tests except the HVLT-R recognition discrimination index. And we detected PD-npRBD performed worse in HVLT-R recognition discrimination index and SDMT compared with NCs (Table 1). After exclusion of subjects with poor image quality, data analyses were conducted in a relatively smaller sample than a previous study using PPMI database (21). Of note, the similar statistical distribution of clinical features, such as cognitive performance, indicated the sample size was still robust to detect the imaging phenotype between PD-pRBD and PD-npRBD.
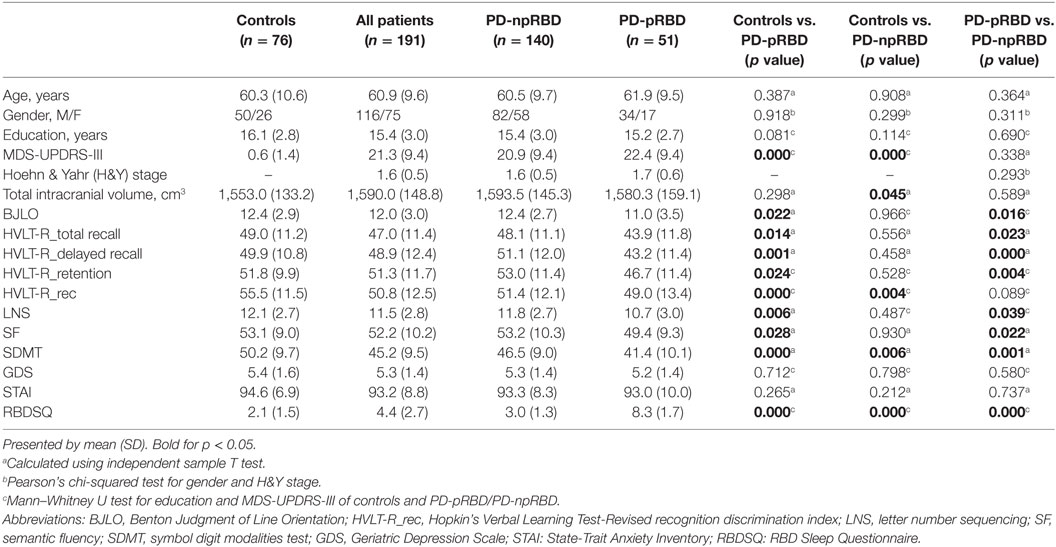
Table 1. Characteristics of normal controls, Parkinson’s disease (PD) patients with possible rapid eye movement sleep behavior disorder (RBD) (PD-npRBD) patients and PD patients with non-possible RBD (PD-pRBD) patients.
Network Analyses
Small-World Parameters
We found that over the density range of 0.1–0.5, γ was larger than 1 and λ was near 1 (σ = γ/λ was consistently greater than 1) for all SCNs from NCs, PD-npRBD group and PD-pRBD group (Figure 2). Therefore, our study indicated that these SCNs from NCs, PD-pRBD and PD-npRBD exhibited typical features of small-worldness. No significant difference in AUC analyses of small-worldness was observed among three groups (Table 2).
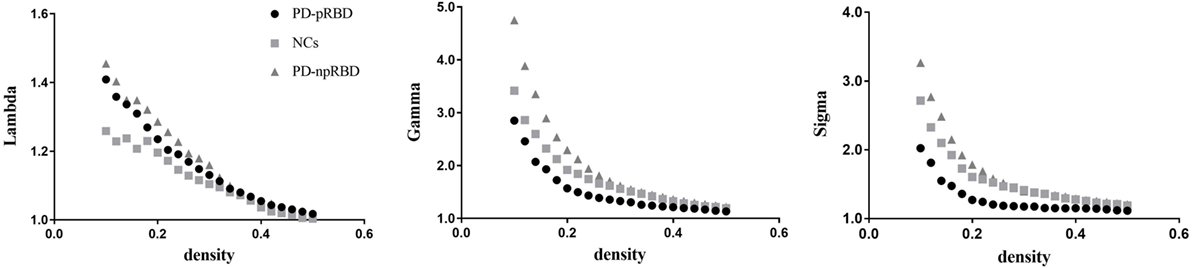
Figure 2. Small-worldness of normal controls (NCs), Parkinson’s disease (PD) patients with possible rapid eye movement sleep behavior disorder (RBD) (PD-pRBD), and PD patients with non-possible RBD (PD-npRBD). The graphs show the changes in Lambda, Gamma, and Sigma as a function of density thresholds. At a wide range of density, the network of each group have an average Gamma of greater than 1, an average Lambda of nearly 1, and Sigma greater than 1, which indicates prominent small-world properties.

Table 2. Areas under the curve analyses for small-world parameters and global network measures in groups.
Inter-Group Comparisons of Global Network Measures
We did not find any significant difference of global network measures (global efficiency and mean local efficiency) through AUC analyses among the three groups (Table 2). This indicated that both PD-pRBD and PD-npRBD preserved global function of SCN.
Inter-Group Comparisons of Regional Network Measures
Comparisons Between NCs and PD-pRBD (PD-npRBD)
In comparisons with NCs, PD-pRBD exhibited wider regions with increased nodal measures than PD-npRBD. For nodal local efficiency and clustering coefficient, PD-pRBD showed increased nodal measures in frontal-temporal regions (e.g., right pars orbitalis superior frontal gyrus, left fusiform, and left superior temporal gyrus), parietal-occipital regions (right angular and left cuneus) and right caudate. For nodal betweenness, PD-pRBD had higher betweenness in frontal region (left rectus). Besides, PD-pRBD had increased nodal degree in left olfactory and left inferior temporal gyrus. Differently, fewer regions (left cuneus and right supramarginal gyrus) with increased nodal measures were found in PD-npRBD compared with NCs (Table 3; Figure 3). In summary, when comparing with NCs, PD-pRBD showed widespread enhanced nodal properties in neocortex, whereas PD-npRBD only exhibited increased nodal degree in cuneus and supramarginal gyrus, which may indicate that presence of RBD symptoms relate to over-activation in neocortex (Table 3; Figure 3).
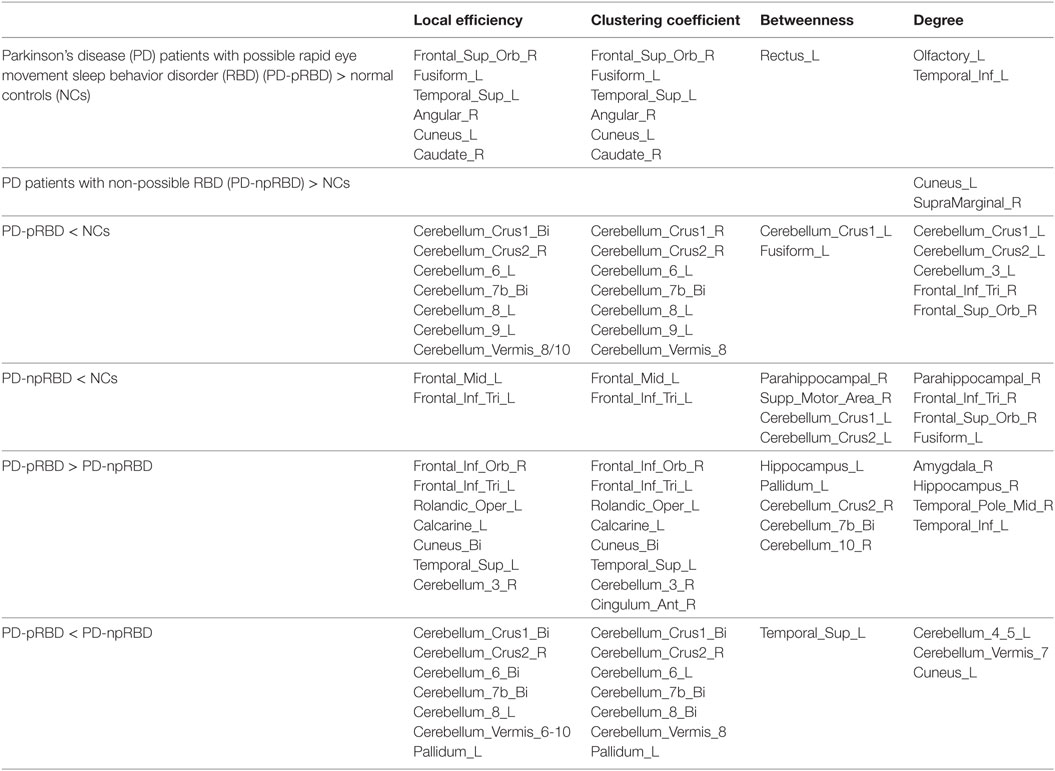
Table 3. Comparisons of nodal measures between groups.
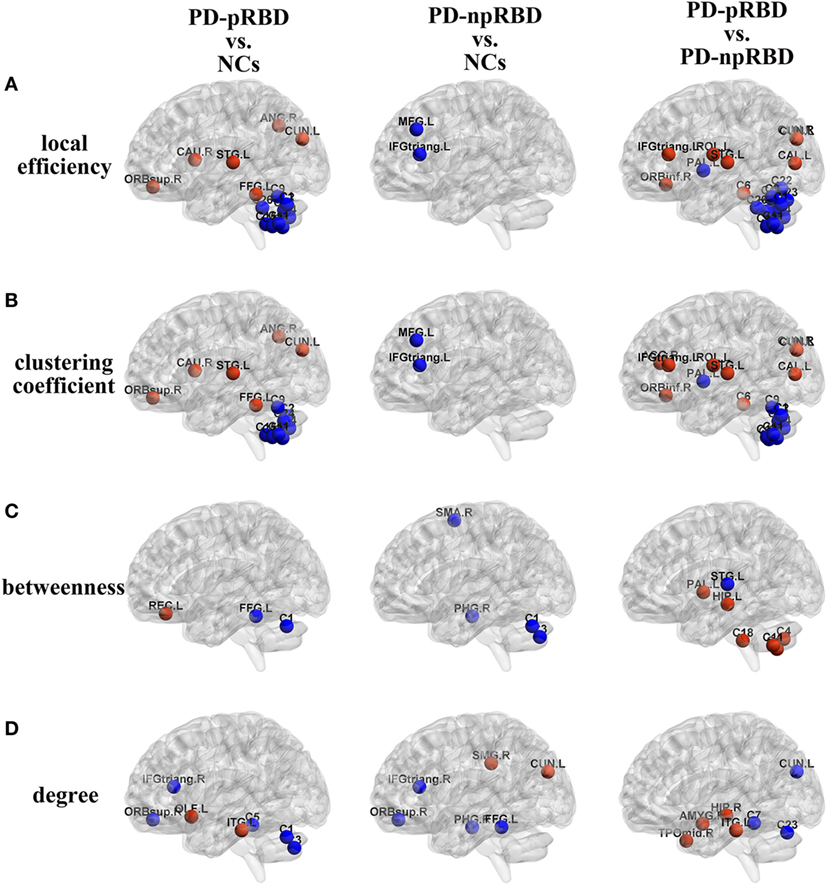
Figure 3. Group differences of (A) local efficiency, (B) clustering coefficient, (C) betweenness, and (D) degree between any two groups [Parkinson’s disease (PD) patients with possible rapid eye movement sleep behavior disorder (RBD) (PD-pRBD) vs. normal controls (NCs), PD patients with non-possible RBD (PD-npRBD) vs. NCs and PD-pRBD vs. PD-npRBD]. The red (blue) nodes in three panels, respectively, indicated increased (decreased) regional network measures in PD-pRBD (vs. NCs), PD-npRBD (vs. NCs), and PD-pRBD (vs. PD-npRBD). The results were visualized using the BrainNet Viewer (Beijing Normal University, http://www.nitrc.org/projects/bnv/). Abbreviations were presented in Table S3 in Supplementary Material.
When comparing with NCs, PD-pRBD showed decreased nodal measures mainly in cerebellum, as well as in fusiform gyrus, inferior frontal gyrus and superior frontal gyrus, and PD-npRBD showed decreased nodal properties in parahippocampus, frontal areas and part of cerebellum. For detail, PD-pRBD showed decreased nodal local efficiency and clustering coefficient in bilateral cerebellum hemisphere and vermis, decreased betweenness in left cerebellum Crus1 and left fusiform, decreased nodal degree in cerebellum (left Crus1, Crus2, and cerebellum area 3), and frontal lobe (right pars triangularis inferior frontal gyrus, right pars orbitalis superior frontal gyrus). PD-npRBD showed decreased nodal local efficiency and clustering coefficient in frontal areas (e.g., middle frontal gyrus and pars triangularis inferior frontal gyrus), decreased betweenness in right parahippocampal gyrus, right supplementary motor area and left cerebellum Crus1 and Crus2, and decreased nodal degree in parahippocampal gyrus and frontal regions (pars triangularis inferior frontal gyrus, pars orbitalis superior frontal gyrus, fusiform). These results suggested that different damage patterns of brain structural network were existed in two subtypes of PD, and widespread dysfunction in cerebellum may associate with RBD symptoms (Table 3; Figure 3).
Comparisons Between PD-npRBD and PD-pRBD
When comparing with PD-npRBD, PD-pRBD showed increased nodal measures mainly in limbic regions, frontal-temporal regions and occipital lobe regions. In detail, PD-pRBD showed increased nodal local efficiency and clustering coefficient mainly in frontal lobe (right pars orbitalis inferior frontal gyrus, left pars triangularis inferior frontal gyrus, left Rolandic operculum) and occipital lobe (left calcarine, bilateral cuneus) as well as left superior temporal gyrus and right cerebellum area 3; increased nodal betweenness in left hippocampus gyrus, left pallidum and cerebellum (right Crus2, bilateral area 7b, and right area 10); increased nodal degree in limbic system (amygdala, hippocampal gyrus, and temporal pole); and inferior temporal gyrus. Taken together, increased nodal properties in limbic system and neocortex in PD-pRBD may suggest a potential over-activation role in these regions, which may underlie RBD (Table 3; Figure 3).
Additionally, compared with PD-npRBD, PD-pRBD exhibited decreased nodal local efficiency and clustering coefficient in bilateral cerebellum hemisphere and left pallidum, decreased betweenness in left superior temporal gyrus, and decreased nodal degree in the left cerebellum areas 4, 5, and Vermis 7 and left cuneus. In brief, decreased nodal measures mainly in cerebellum may represent the potential pathological lesion in PD-RBD (Table 3; Figure 3).
Hub Distribution
As shown in Table 4, NCs had 20 regions that were identified as hubs; most of these hubs belong to frontal lobe (especially prefrontal regions), temporal lobe, limbic system, and parietal-occipital areas. PD-pRBD group had 23 regions, and PD-npRBD group had 21 regions that identified as hubs. Nine hubs, belonging temporal lobe and limbic system, co-existed in three groups. Considering the hub distribution in NCs as reference, PD-pRBD recruited eight nodes as hubs mainly located in frontal lobe and limbic system as well as left inferior temporal and left inferior parietal and lost five hubs mainly in frontal lobe as well as left superior temporal and left lingual. Compared with NCs, PD-npRBD recruited 10 nodes as hub mainly in frontal lobe as well as parietal-occipital areas and lost eight hubs mainly in frontal lobe and parietal-occipital areas as well as right parahippocampal (Table 4; Figure 4). Taken together, we could reveal two findings. First, both two PD groups exhibited reorganization of hub distribution in frontal areas. Second, specific hub alterations in PD-pRBD included recruited hubs in limbic system (amygdala, hippocampal) as well as inferior parietal gyrus and lost hubs in superior temporal gyrus as well as pars orbitalis inferior frontal gyrus, which indicated that nodes mainly in limbic system had an enhanced function accompanied by dysfunction in some other nodes. The detailed distribution of hubs is shown in Table 4 and Figure 4.
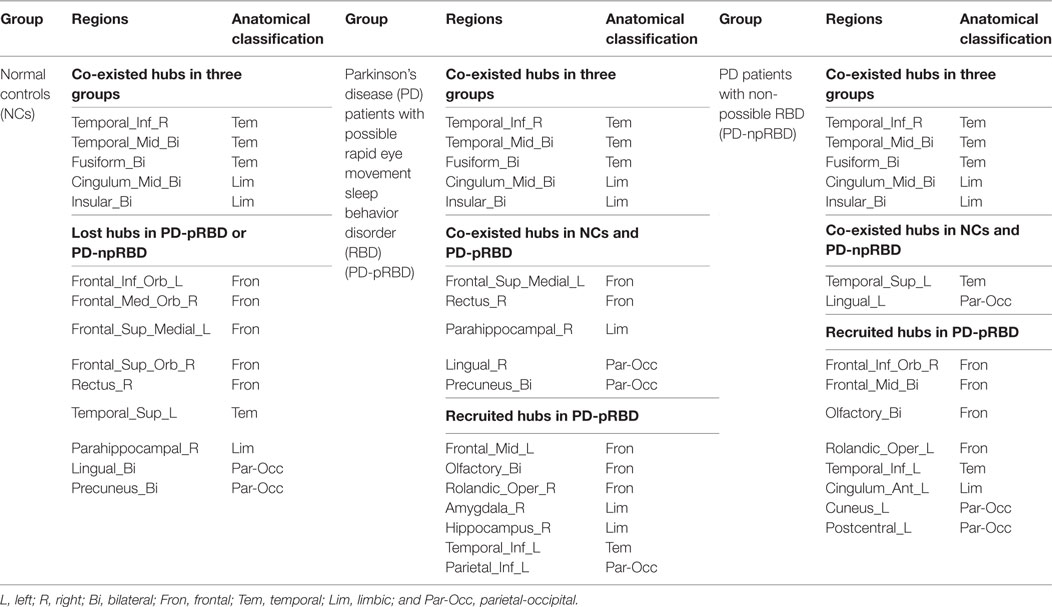
Table 4. Hub distribution in patients and controls.
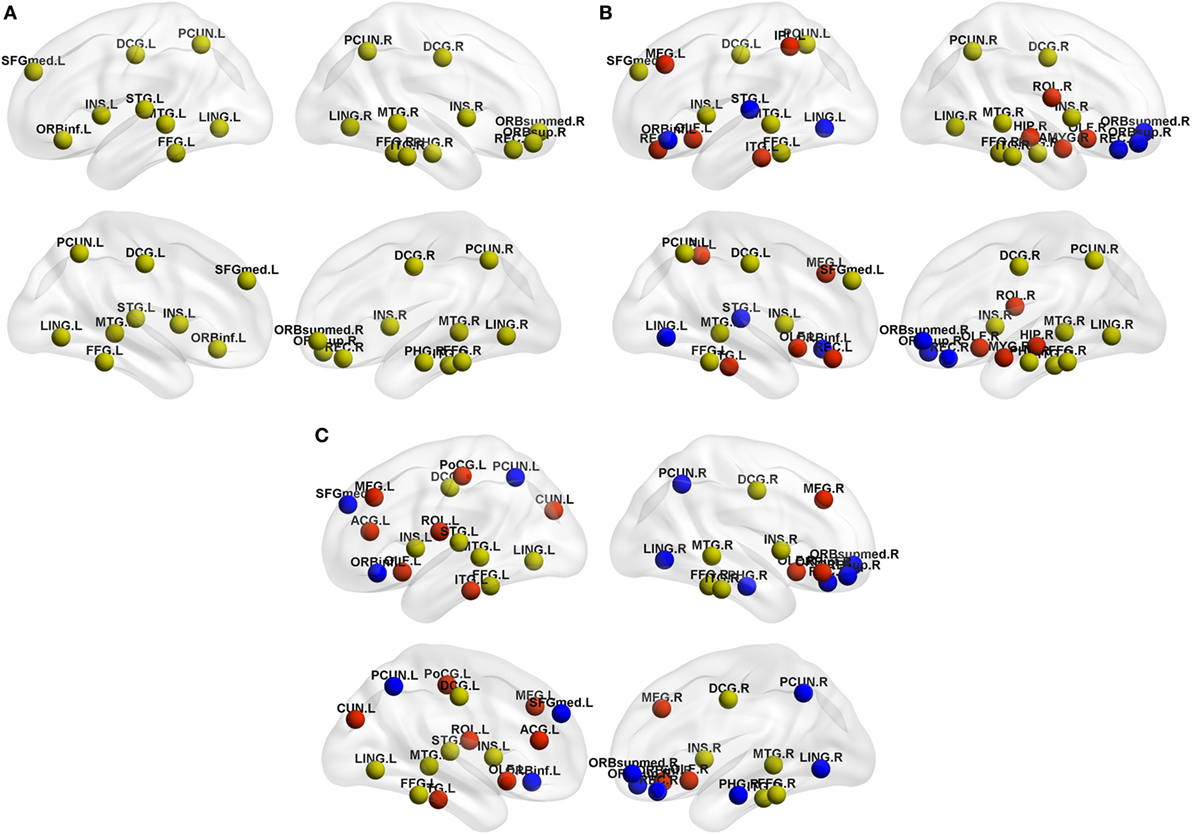
Figure 4. Hub distribution of the structural brain network in (A) normal controls (NCs), (B) Parkinson’s disease (PD) patients with possible rapid eye movement sleep behavior disorder (RBD) (PD-pRBD), and (C) PD patients with non-possible RBD (PD-npRBD). Regarding the yellow nodes in NCs as reference, red nodes in PD-pRBD and PD-npRBD groups represented the recruitment nodes, blue nodes in PD-pRBD and PD-npRBD groups represented the lost nodes. The results were visualized using the BrainNet Viewer (Beijing Normal University, http://www.nitrc.org/projects/bnv/). Abbreviations were presented in Table S3 in Supplementary Material.
Robustness of Findings
After eliminating the potential effect of cognitive function on brain organization, similar alterations of network measures were found. PD-pRBD showed increased nodal local efficiency and clustering coefficient mainly in neocortex (frontal, temporal, and occipital areas), increased nodal degree in limbic system (amygdala, hippocampus, and temporal pole) as well as temporal areas, increased nodal betweenness in part of cerebellum, and decreased nodal measures in widespread cerebellum and left cuneus (results shown in Table S1 and Figure S1 in Supplementary Material). These results indicated that the network alterations mainly due to the presence of RBD symptom.
Analyses of hub distribution in PD-pRBD and PD-npRBD with covariates of age, gender, TIV, and cognitive scores showed similar hub alterations in PD-pRBD including recruited hubs in limbic system and disrupted hubs in superior temporal gyrus as well as the reorganization in frontal areas (results shown in Table S2 in Supplementary Material). These results verified that the alterations of SCN were generated by RBD symptoms.
Discussion
In this study, we applied graph theoretical analyses to compare topology properties of GM volume-based SCN among PD groups (PD-pRBD and PD-npRBD) and NCs, which would be helpful to make out the potential neural substrates of RBD symptoms in PD. Two principal findings were observed in the present study. First, although preserved global function in two PD groups, PD-pRBD exhibited significant enhanced nodal properties in limbic system, frontal-temporal regions and occipital regions and disrupted nodal properties mainly in cerebellum. Second, PD groups exhibited both disrupt hubs and recruited hubs in frontal areas and PD-pRBD-specific hub regeneration was mainly located in limbic system.
Preserved Global Function in PD Groups
Human brain is a formidably complex system characterized of pivotal topological properties such as small-worldness and highly centralized hubs (39, 40). Small-worldness (high clustering coefficient and short characteristic path length) is a key property of complex brain network, which supports efficient information segregation and integration with low energy and wiring costs and ensures the high rate of information transmission (35). In the present study, we found that PD-pRBD group, PD-npRBD group, and NCs group exhibited typical features of small-worldness and there was no difference between any two groups in global network measures, which indicated that both two PD groups still kept a relatively integrated global function including abilities for information processing within and across anatomically interconnected brain regions. Considering the characteristics of our PD patients (mean H&Y stage was 1.6 ± 0.5), we postulated that, at early-stage PD patients could maintain normal overall information transfer in the brain network.
Increased Nodal Properties of Limbic-Neocortex in PD-pRBD
One of the main intriguing findings in our study was increased nodal measures in limbic regions such as amygdala, hippocampal gyrus, and temporal pole. A MRI study in iRBD showed an increased GM density in limbic regions such as hippocampi and adjacent parahippocampal gyrus, which were likely to be related to neuronal reorganization including sprouting of new connections and modification in the strength of existing connections (17, 41). Hyper-metabolism in hippocampus was also observed in iRBD patients (42). Our results of increased nodal measures in limbic system were consistent with these previous studies, which indicated that activated limbic system might relate to the pathogenesis of RBD in PD. Other studies also demonstrated sleep-related motor manifestations in RBD arise from the abnormal activation of brain structures such as limbic system (3, 43). The elaborated, complex, aberrant movements in RBD symptoms resemble as activities in awake status (44), and patients with RBD symptoms showed abnormalities in sleep-wake transitions (11), which suggested that RBD symptoms might relate to abnormal “like-arousal” status. Ascending reticular activating system (ARAS), involved in the transition from slow waves to REM sleep (45, 46), could be activated through by hippocampus and amygdala (15, 47). Therefore, we postulated that increased nodal properties in limbic system might play an over-activation role in regulation of ARAS, which promotes the level of “like-arousal,” leading to the abnormal motor behavior in REM sleep of PD patients.
Another interesting finding in our study was the increased nodal properties in frontal-temporal regions (e.g., inferior frontal gyrus, Rolandic operculum, and superior temporal gyrus) and occipital lobe regions (e.g., calcarine and cuneus and visual cortex) in PD-pRBD compared with PD-npRBD. A study using 18F-fluorodeoxyglucose positron emission tomography showed hyper-metabolism in frontal areas and temporal areas in iRBD (48). Furthermore, increased functional connectivity between visual cortex and pons as well as between visual cortex and frontal areas in a patient with RBD symptoms after the focal damage in pons were observed (49). Our results of increased nodal properties in frontal-temporal regions and occipital regions (visual cortex) are in line with these previous studies. Brainstem reticular formation, core pathological regions in RBD, strongly connects to frontal cortex and exhibits synchronized electrical potentials to occipital cortex (13, 50), which suggests that there are connections between brainstem reticular formation and frontal areas as well as occipital cortex. Damage in brainstem reticular formation may cause a potential effect on frontal or occipital cortex to rebalance the disrupted reticular formation, which may associate with RBD. Furthermore, ARAS could also be activated by frontal cortex and superior temporal gyrus (51) and promotes the level of “like-arousal.” The promoted ARAS may make patients more likely express the abnormal motor behavior in REM sleep. In short, increased nodal function in neocortex probably is the core pathogenesis of RBD symptoms in PD.
Decreased Nodal Properties of Cerebellum in PD-pRBD
Besides, significantly reduced nodal properties in the various regions of cerebellum were observed in PD-pRBD. Consistently, decreased regional cerebral blood flow within cerebellar hemispheres and a volumetric decrement in the cerebellar cortex were observed in iRBD and PD-RBD (21, 52, 53), which was attributed to the impaired regional neuronal activity. Physiologically, cerebellum has a role in the regulation of the sleep-wake cycle and generation of REM atonia (54, 55). Whereas disrupted cerebellum caused by cerebellectomies leads to changes in the sleep–wake cycle and even cause sleep disorders such as RBD (54–56). Therefore, our findings were in line with previous literature that disrupts brain function in cerebellum, which provided new structural network information about the role of disrupted cerebellum in RBD.
Plasticity of Nodal Properties in PD-pRBD
Nodal properties could be divided to two field, nodal centralities (e.g., nodal degree and nodal betweenness) and nodal cliquishness properties (e.g., nodal local efficiency and nodal clustering coefficient) (35, 36, 57). In our study, we showed a shift between nodal centralities and nodal cliquishness properties in PD-pRBD. For example, increased nodal local efficiency and nodal clustering coefficient but decreased nodal betweenness or nodal degree were observed in left superior temporal gyrus and cuneus. Similar shift were detected in left pallidum, right cerebellum Crus2 and bilateral cerebellum area 7b (increased betweenness accompanied by decreased nodal local efficiency and nodal clustering coefficient). We inferred that increased nodal centrality (nodal cliquishness properties) might balance the reduced nodal cliquishness properties (centrality), which reflect the plasticity of nodal function.
Reorganization of Hub Distribution in PD-pRBD
Hubs are identified as nodes with a high nodal centrality (35), which indicates the importance of the nodes in the network as they interact with various brain regions (58). In our study, most hubs observed in frontal lobe, temporal lobe, limbic system (e.g., cingulate and insula cortex), as well as parietal-occipital region (e.g., precuneus) were largely consistent with the previous studies (58–63). We observed disrupt hubs both in PD-pRBD and PD-npRBD mainly located in frontal lobe. Pathologically study demonstrated that frontal lobe was a target of alpha-synuclein accumulation (10), which indicated that the common alterations in two PD groups may stem from the PD pathophysiology. Additionally, recruited hubs in frontal areas in both PD-pRBD and PD-npRBD were observed, which consist with a recent study that increased activation in frontal areas in PD (64). These findings indicated compensatory mechanism in frontal areas, which may balance the disrupted hubs in frontal areas. More importantly, PD-pRBD-specific hub regeneration was mainly located in limbic system such as amygdala, hippocampus. Recent studies revealed that iRBD patients exhibited increased metabolism in hippocampus and activated limbic system was a feature of REM sleep (13, 65), which explained the high centralities of limbic system found in the present study. Thus, reorganization of hub distribution in frontal areas may reflect the pathological damages coexisting with compensatory effects in PD. And regenerated hubs in limbic system in PD-pRBD further provided new evidence for the association between limbic system and RBD symptoms in PD.
Several limitations in this study should be addressed. First, we included PD-pRBD because polysomnography data were not included in the PPMI database. Nevertheless, RBDSQ scores used to identify RBD have a high sensitivity (96%) and specificity (85%) (32). Future studies examining the SCN in polysomnogram-verified RBD are needed. Second, some regions such as ceruleus/subceruleus complex and lateral dorsal tegmental nucleus verified to be related to RBD were not referred as nodes when constructing structural brain network due to the limited ROI extraction technology. Further studies focusing on these core pathology regions are urgent to identify the most appropriate topological structures for the brain networks of PD-RBD patients.
In conclusion, we first investigated the topological architectures of the SCNs in PD patients with and without pRBD. We found both two PD groups exhibited a remodeling of structural network. Specifically, PD-pRBD exhibited the reorganization of relatively activated brain network including enhanced nodal properties in limbic regions, frontal-temporal regions, occipital lobe regions, and recruited hubs in limbic system. Decreased nodal properties were also observed in cerebellum in PD-pRBD. These findings provided a new insight to make out the substrate of PD-RBD.
Ethics Statement
Written informed consent was obtained from all participants, and all PPMI sites received approval from their respective ethics committee on human experimentation prior to study initiation.
Author Contributions
All of the coauthors listed meet the criteria for authorship. TG was involved with study concept and design, preparation of data, analysis and interpretation of data, and drafting/revising the manuscript. XG, QZ, QG, and MX were involved with preparation of data, analysis, and interpretation of data. XX was involved with revising the manuscript. PH was involved with the analysis of data. MZ was involved with drafting/revising the manuscript and responsible for obtaining funding and supervision of study.
Conflict of Interest Statement
The authors declare that the research was conducted in the absence of any commercial or financial relationships that could be construed as a potential conflict of interest.
Acknowledgments
The authors acknowledge the whole staff of the Parkinson’s Progression Markers Initiative (PPMI) database. PPMI – a public-private partnership – is funded by the Michael J. Fox Foundation for Parkinson’s Research and funding partners, including AbbVie, Avid, Biogen, Bristol-Myers Squibb, Covance, GE Healthcare, Genentech, GlaxoSmithKline, Lilly, Lundbeck, Merck, Meso Scale Discovery, Pfizer, Piramal, Roche, Sanofi Genzyme, Servier, Teva, and UCB.
Funding
This work was supported by the 13th Five-year Plan for National Key Research and Development Program of China (No. 2016YFC1306600), the National Natural Science Foundation of China (Nos. 81571654, 81371519, 81771820, and 81701647), the 12th Five-year Plan for National Science and Technology Supporting Program of China (No. 2012BAI10B04), the Fundamental Research Funds for the Central Universities of China (No. 2017XZZX001-01), and the Projects of Medical and Health Technology Development Program in Zhejiang Province (2015KYB174).
Supplementary Material
The Supplementary Material for this article can be found online at https://www.frontiersin.org/articles/10.3389/fneur.2018.00334/full#supplementary-material.
Abbreviations
BJLO, Benton Judgment of Line Orientation; GM, gray matter; HVLT-R, Hopkins Verbal Learning Test-Revised; LNS, letter number sequencing; NCs, normal controls; PD-pRBD, PD patients with possible RBD; PD-npRBD, PD patients with non-possible RBD; SCN, structural correlation network; SDMT, symbol digit modalities test; SF, semantic fluency.
References
1. Olson EJ, Boeve BF, Silber MH. Rapid eye movement sleep behaviour disorder: demographic, clinical and laboratory findings in 93 cases. Brain (2000) 123(Pt 2):331–9. doi:10.1093/brain/123.2.331
2. Schenck CH, Mahowald MW. REM sleep behavior disorder: clinical, developmental, and neuroscience perspectives 16 years after its formal identification in SLEEP. Sleep (2002) 25:120–38. doi:10.1093/sleep/25.2.120
3. Boeve BF, Silber MH, Saper CB, Ferman TJ, Dickson DW, Parisi JE, et al. Pathophysiology of REM sleep behaviour disorder and relevance to neurodegenerative disease. Brain (2007) 130:2770–88. doi:10.1093/brain/awm056
4. Gagnon JF, Bedard MA, Fantini ML, Petit D, Panisset M, Rompre S, et al. REM sleep behavior disorder and REM sleep without atonia in Parkinson’s disease. Neurology (2002) 59:585–9. doi:10.1212/WNL.59.4.585
5. Sudarsky L, Friedman J. REM sleep behavior disorder: a possible early marker for synucleinopathies. Neurology (2006) 67:2090; author reply 2090–1. doi:10.1212/01.wnl.0000250652.65675.7f
6. Iranzo A, Molinuevo JL, Santamaria J, Serradell M, Marti MJ, Valldeoriola F, et al. Rapid-eye-movement sleep behaviour disorder as an early marker for a neurodegenerative disorder: a descriptive study. Lancet Neurol (2006) 5:572–7. doi:10.1016/S1474-4422(06)70476-8
7. Alatriste-Booth V, Rodriguez-Violante M, Camacho-Ordonez A, Cervantes-Arriaga A. Prevalence and correlates of sleep disorders in Parkinson’s disease: a polysomnographic study. Arq Neuropsiquiatr (2015) 73:241–5. doi:10.1590/0004-282X20140228
8. Sinforiani E, Pacchetti C, Zangaglia R, Pasotti C, Manni R, Nappi G. REM behavior disorder, hallucinations and cognitive impairment in Parkinson’s disease: a two-year follow up. Mov Disord (2008) 23:1441–5. doi:10.1002/mds.22126
9. Postuma RB, Bertrand JA, Montplaisir J, Desjardins C, Vendette M, Rios Romenets S, et al. Rapid eye movement sleep behavior disorder and risk of dementia in Parkinson’s disease: a prospective study. Mov Disord (2012) 27:720–6. doi:10.1002/mds.24939
10. Braak H, Del Tredici K, Rub U, de Vos RA, Jansen Steur EN, Braak E. Staging of brain pathology related to sporadic Parkinson’s disease. Neurobiol Aging (2003) 24:197–211. doi:10.1016/S0197-4580(02)00065-9
11. Jennum P, Christensen JA, Zoetmulder M. Neurophysiological basis of rapid eye movement sleep behavior disorder: informing future drug development. Nat Sci Sleep (2016) 8:107–20. doi:10.2147/NSS.S99240
12. Lu J, Sherman D, Devor M, Saper CB. A putative flip-flop switch for control of REM sleep. Nature (2006) 441:589–94. doi:10.1038/nature04767
13. Brown RE, Basheer R, McKenna JT, Strecker RE, McCarley RW. Control of sleep and wakefulness. Physiol Rev (2012) 92:1087–187. doi:10.1152/physrev.00032.2011
14. Boeve BF. Idiopathic REM sleep behaviour disorder in the development of Parkinson’s disease. Lancet Neurol (2013) 12:469–82. doi:10.1016/S1474-4422(13)70054-1
15. Datta S, Maclean RR. Neurobiological mechanisms for the regulation of mammalian sleep-wake behavior: reinterpretation of historical evidence and inclusion of contemporary cellular and molecular evidence. Neurosci Biobehav Rev (2007) 31:775–824. doi:10.1016/j.neubiorev.2007.02.004
16. Iranzo de Riquer A, Bergareche A, Campos V. Sleep disorders in Parkinson disease. Neurologist (2011) 17:S38–42. doi:10.1097/NRL.0b013e31823966f8
17. Scherfler C, Frauscher B, Schocke M, Iranzo A, Gschliesser V, Seppi K, et al. White and gray matter abnormalities in idiopathic rapid eye movement sleep behavior disorder: a diffusion-tensor imaging and voxel-based morphometry study. Ann Neurol (2011) 69:400–7. doi:10.1002/ana.22245
18. Kotagal V, Albin RL, Muller ML, Koeppe RA, Chervin RD, Frey KA, et al. Symptoms of rapid eye movement sleep behavior disorder are associated with cholinergic denervation in Parkinson disease. Ann Neurol (2012) 71:560–8. doi:10.1002/ana.22691
19. Lim JS, Shin SA, Lee JY, Nam H, Lee JY, Kim YK. Neural substrates of rapid eye movement sleep behavior disorder in Parkinson’s disease. Parkinsonism Relat Disord (2016) 23:31–6. doi:10.1016/j.parkreldis.2015.11.027
20. Li D, Huang P, Zang Y, Lou Y, Cen Z, Gu Q, et al. Abnormal baseline brain activity in Parkinson’s disease with and without REM sleep behavior disorder: a resting-state functional MRI study. J Magn Reson Imaging (2017) 46:697–703. doi:10.1002/jmri.25571
21. Boucetta S, Salimi A, Dadar M, Jones BE, Collins DL, Dang-Vu TT. Structural brain alterations associated with rapid eye movement sleep behavior disorder in Parkinson’s disease. Sci Rep (2016) 6:26782. doi:10.1038/srep26782
22. Jiang L, Zhang T, Lv F, Li S, Liu H, Zhang Z, et al. Structural covariance network of cortical gyrification in benign childhood epilepsy with centrotemporal spikes. Front Neurol (2018) 9:10. doi:10.3389/fneur.2018.00010
23. Hosseini SM, Kesler SR. Influence of choice of null network on small-world parameters of structural correlation networks. PLoS One (2013) 8:e67354. doi:10.1371/journal.pone.0067354
24. Hosseini SM, Koovakkattu D, Kesler SR. Altered small-world properties of gray matter networks in breast cancer. BMC Neurol (2012) 12:28. doi:10.1186/1471-2377-12-28
25. Alexander-Bloch A, Giedd JN, Bullmore E. Imaging structural co-variance between human brain regions. Nat Rev Neurosci (2013) 14:322–36. doi:10.1038/nrn3465
26. Zhang Z, Liao W, Xu Q, Wei W, Zhou HJ, Sun K, et al. Hippocampus-associated causal network of structural covariance measuring structural damage progression in temporal lobe epilepsy. Hum Brain Mapp (2017) 38:753–66. doi:10.1002/hbm.23415
27. Pereira JB, Aarsland D, Ginestet CE, Lebedev AV, Wahlund LO, Simmons A, et al. Aberrant cerebral network topology and mild cognitive impairment in early Parkinson’s disease. Hum Brain Mapp (2015) 36:2980–95. doi:10.1002/hbm.22822
28. Xu J, Zhang J, Zhang J, Wang Y, Zhang Y, Wang J, et al. Abnormalities in structural covariance of cortical gyrification in Parkinson’s disease. Front Neuroanat (2017) 11:12. doi:10.3389/fnana.2017.00012
29. Chang YT, Lu CH, Wu MK, Hsu SW, Huang CW, Chang WN, et al. Salience network and depressive severities in Parkinson’s disease with mild cognitive impairment: a structural covariance network analysis. Front Aging Neurosci (2017) 9:417. doi:10.3389/fnagi.2017.00417
30. Hosseini SM, Kesler SR. Comparing connectivity pattern and small-world organization between structural correlation and resting-state networks in healthy adults. Neuroimage (2013) 78:402–14. doi:10.1016/j.neuroimage.2013.04.032
31. Nomura T, Inoue Y, Kagimura T, Uemura Y, Nakashima K. Utility of the REM sleep behavior disorder screening questionnaire (RBDSQ) in Parkinson’s disease patients. Sleep Med (2011) 12:711–3. doi:10.1016/j.sleep.2011.01.015
32. Stiasny-Kolster K, Mayer G, Schafer S, Moller JC, Heinzel-Gutenbrunner M, Oertel WH. The REM sleep behavior disorder screening questionnaire – a new diagnostic instrument. Mov Disord (2007) 22:2386–93. doi:10.1002/mds.21740
33. Chahine LM, Xie SX, Simuni T, Tran B, Postuma R, Amara A, et al. Longitudinal changes in cognition in early Parkinson’s disease patients with REM sleep behavior disorder. Parkinsonism Relat Disord (2016) 27:102–6. doi:10.1016/j.parkreldis.2016.03.006
34. Achard S, Bullmore E. Efficiency and cost of economical brain functional networks. PLoS Comput Biol (2007) 3:e17. doi:10.1371/journal.pcbi.0030017
35. Liao X, Vasilakos AV, He Y. Small-world human brain networks: perspectives and challenges. Neurosci Biobehav Rev (2017) 77:286–300. doi:10.1016/j.neubiorev.2017.03.018
36. Freeman LC. Set of measures of centrality based on betweenness. Sociometry (1977) 40:35–41. doi:10.2307/3033543
37. Sang L, Zhang J, Wang L, Zhang J, Zhang Y, Li P, et al. Alteration of brain functional networks in early-stage Parkinson’s disease: a resting-state fMRI study. PLoS One (2015) 10:e0141815. doi:10.1371/journal.pone.0141815
38. Rubinov M, Sporns O. Complex network measures of brain connectivity: uses and interpretations. Neuroimage (2010) 52:1059–69. doi:10.1016/j.neuroimage.2009.10.003
39. He Y, Evans A. Graph theoretical modeling of brain connectivity. Curr Opin Neurol (2010) 23:341–50. doi:10.1097/WCO.0b013e32833aa567
40. Bullmore E, Sporns O. Complex brain networks: graph theoretical analysis of structural and functional systems. Nat Rev Neurosci (2009) 10:186–98. doi:10.1038/nrn2575
41. Sur M, Rubenstein JL. Patterning and plasticity of the cerebral cortex. Science (2005) 310:805–10. doi:10.1126/science.1112070
42. Mazza S, Soucy JP, Gravel P, Michaud M, Postuma R, Massicotte-Marquez J, et al. Assessing whole brain perfusion changes in patients with REM sleep behavior disorder. Neurology (2006) 67:1618–22. doi:10.1212/01.wnl.0000242879.39415.49
43. Bassetti CL, Bargiotas P. REM sleep behavior disorder. Front Neurol Neurosci (2018) 41:104–16. doi:10.1159/000478914
44. De Cock VC, Vidailhet M, Leu S, Texeira A, Apartis E, Elbaz A, et al. Restoration of normal motor control in Parkinson’s disease during REM sleep. Brain (2007) 130:450–6. doi:10.1093/brain/awl363
45. De Cicco V, Tramonti Fantozzi MP, Cataldo E, Barresi M, Bruschini L, Faraguna U, et al. Trigeminal, visceral and vestibular inputs may improve cognitive functions by acting through the locus coeruleus and the ascending reticular activating system: a new hypothesis. Front Neuroanat (2017) 11:130. doi:10.3389/fnana.2017.00130
46. Steriade M, McCormick DA, Sejnowski TJ. Thalamocortical oscillations in the sleeping and aroused brain. Science (1993) 262:679–85. doi:10.1126/science.8235588
47. Xi M, Fung SJ, Zhang J, Sampogna S, Chase MH. The amygdala and the pedunculopontine tegmental nucleus: interactions controlling active (rapid eye movement) sleep. Exp Neurol (2012) 238:44–51. doi:10.1016/j.expneurol.2012.08.001
48. Wu P, Yu H, Peng S, Dauvilliers Y, Wang J, Ge J, et al. Consistent abnormalities in metabolic network activity in idiopathic rapid eye movement sleep behaviour disorder. Brain (2014) 137:3122–8. doi:10.1093/brain/awu290
49. Geddes MR, Tie Y, Gabrieli JD, McGinnis SM, Golby AJ, Whitfield-Gabrieli S. Altered functional connectivity in lesional peduncular hallucinosis with REM sleep behavior disorder. Cortex (2016) 74:96–106. doi:10.1016/j.cortex.2015.10.015
50. Jang SH, Kwon HG. The direct pathway from the brainstem reticular formation to the cerebral cortex in the ascending reticular activating system: a diffusion tensor imaging study. Neurosci Lett (2015) 606:200–3. doi:10.1016/j.neulet.2015.09.004
51. Leichnetz GR, Smith DJ, Spencer RF. Cortical projections to the paramedian tegmental and basilar pons in the monkey. J Comp Neurol (1984) 228:388–408. doi:10.1002/cne.902280307
52. Hanyu H, Inoue Y, Sakurai H, Kanetaka H, Nakamura M, Miyamoto T, et al. Voxel-based magnetic resonance imaging study of structural brain changes in patients with idiopathic REM sleep behavior disorder. Parkinsonism Relat Disord (2012) 18:136–9. doi:10.1016/j.parkreldis.2011.08.023
53. Hanyu H, Inoue Y, Sakurai H, Kanetaka H, Nakamura M, Miyamoto T, et al. Regional cerebral blood flow changes in patients with idiopathic REM sleep behavior disorder. Eur J Neurol (2011) 18:784–8. doi:10.1111/j.1468-1331.2010.03283.x
54. Cunchillos JD, De Andres I. Participation of the cerebellum in the regulation of the sleep-wakefulness cycle. Results in cerebellectomized cats. Electroencephalogr Clin Neurophysiol (1982) 53:549–58. doi:10.1016/0013-4694(82)90067-0
55. DelRosso LM, Hoque R. The cerebellum and sleep. Neurol Clin (2014) 32:893–900. doi:10.1016/j.ncl.2014.07.003
56. Canto CB, Onuki Y, Bruinsma B, van der Werf YD, De Zeeuw CI. The sleeping cerebellum. Trends Neurosci (2017) 40:309–23. doi:10.1016/j.tins.2017.03.001
57. Xu X, Guan X, Guo T, Zeng Q, Ye R, Wang J, et al. Brain atrophy and reorganization of structural network in Parkinson’s disease with hemiparkinsonism. Front Hum Neurosci (2018) 12:117. doi:10.3389/fnhum.2018.00117
58. van den Heuvel MP, Sporns O. Network hubs in the human brain. Trends Cogn Sci (2013) 17:683–96. doi:10.1016/j.tics.2013.09.012
59. Li L, Hu X, Preuss TM, Glasser MF, Damen FW, Qiu Y, et al. Mapping putative hubs in human, chimpanzee and rhesus macaque connectomes via diffusion tractography. Neuroimage (2013) 80:462–74. doi:10.1016/j.neuroimage.2013.04.024
60. Nijhuis EH, van Cappellen van Walsum AM, Norris DG. Topographic hub maps of the human structural neocortical network. PLoS One (2013) 8:e65511. doi:10.1371/journal.pone.0065511
61. Zalesky A, Fornito A, Harding IH, Cocchi L, Yucel M, Pantelis C, et al. Whole-brain anatomical networks: does the choice of nodes matter? Neuroimage (2010) 50:970–83. doi:10.1016/j.neuroimage.2009.12.027
62. Gong G, He Y, Concha L, Lebel C, Gross DW, Evans AC, et al. Mapping anatomical connectivity patterns of human cerebral cortex using in vivo diffusion tensor imaging tractography. Cereb Cortex (2009) 19:524–36. doi:10.1093/cercor/bhn102
63. Iturria-Medina Y, Sotero RC, Canales-Rodriguez EJ, Aleman-Gomez Y, Melie-Garcia L. Studying the human brain anatomical network via diffusion-weighted MRI and graph theory. Neuroimage (2008) 40:1064–76. doi:10.1016/j.neuroimage.2007.10.060
64. Moonen AJH, Weiss PH, Wiesing M, Weidner R, Fink GR, Reijnders J, et al. An fMRI study into emotional processing in Parkinson’s disease: does increased medial prefrontal activation compensate for striatal dysfunction? PLoS One (2017) 12:e0177085. doi:10.1371/journal.pone.0177085
Keywords: Parkinson’s disease, rapid eye movement sleep behavior disorder, magnetic resonance imaging, structural correlation network, graph theory analysis
Citation: Guo T, Guan X, Zeng Q, Xuan M, Gu Q, Huang P, Xu X and Zhang M (2018) Alterations of Brain Structural Network in Parkinson’s Disease With and Without Rapid Eye Movement Sleep Behavior Disorder. Front. Neurol. 9:334. doi: 10.3389/fneur.2018.00334
Received: 16 December 2017; Accepted: 26 April 2018;
Published: 11 May 2018
Edited by:
Miguel Coelho, Universidade de Lisboa, PortugalReviewed by:
Antonella Conte, Sapienza Università di Roma, ItalyMatteo Bologna, Sapienza Università di Roma, Italy
Copyright: © 2018 Guo, Guan, Zeng, Xuan, Gu, Huang, Xu and Zhang. This is an open-access article distributed under the terms of the Creative Commons Attribution License (CC BY). The use, distribution or reproduction in other forums is permitted, provided the original author(s) and the copyright owner are credited and that the original publication in this journal is cited, in accordance with accepted academic practice. No use, distribution or reproduction is permitted which does not comply with these terms.
*Correspondence: Minming Zhang, emhhbmdtaW5taW5nQHpqdS5lZHUuY24=