 Yanan Wu1,2,3†
 Zhenqian Fan4†
 Yu Chen4†
 Jingxian Ni1,2,3Jie Liu1,2,3Jing Han1Li Ren1Jun Tu1,2,3Xianjia Ning1,2,3*
 Jinghua Wang1,2,3*
- 1Department of Neurology, Tianjin Medical University General Hospital, Tianjin, China
- 2Laboratory of Epidemiology, Tianjin Neurological Institute, Tianjin, China
- 3Key Laboratory of Post-Neuroinjury Neuro-Repair and Regeneration in Central Nervous System, Tianjin Neurological Institute, Ministry of Education and Tianjin City, Tianjin, China
- 4Department of Endocrinology and Metabolism, The Second Hospital of Tianjin Medical University, Tianjin, China
Although strokes are the leading cause of death and disability in many countries, China still lacks long-term monitoring data on stroke incidence and risk factors. This study explored stroke risk factors in a low-income, rural population in China. The study population was derived from the Tianjin Brain Study, a population-based stroke monitoring study that began in 1985. This study documented the demographic characteristics, past medical histories, and personal lifestyles of the study participants. In addition, physical examinations, including measurements of blood pressure (BP), height, and weight, were performed. Hazard ratios (HRs) were estimated for the risk factors for all subtypes of stroke using multivariate Cox regression analyses. During the study with mean following-up time of 23.16 years, 3906 individuals were recruited at baseline, and during 27 years of follow-up, 638 strokes were documented. The multivariate Cox regression analyses revealed a positive correlation between age and stroke incidence. Limited education was associated with a 1.9-fold increase in stroke risk (lowest vs. highest education level). Stroke risk was higher among former smokers than among current smokers (HR, 1.8 vs. 1.6; both, P < 0.05). Moreover, stroke risk was significantly associated with sex (HR, 1.8), former alcohol drinking (HR, 2.7), baseline hypertension (HR, 3.1), and overweight (HR, 1.3). In conclusion, this study identified uncontrollable (sex and age) and controllable (education, smoking, alcohol drinking, hypertension, and overweight) risk factors for stroke in a low-income, rural population in China. Therefore, it is critical to control BP and weight effectively, advocate cessation of smoking/alcohol drinking, and enhance the education level in this population to prevent increase in the burden of stroke in China.
Introduction
Cerebrovascular disease is one of the leading causes of death and disability worldwide (1, 2). Stroke, a type of cerebrovascular disease, has been reported by the World Health Organization as the leading cause of disability among adults and the second leading cause of death worldwide (3). Overall, 71% of stroke-related deaths and 78% of disability-adjusted life loss occurred in low- and middle-income countries (4). In China, strokes account for 21.6% of total male mortality and 20.8% of total female mortality. Thus, strokes remain a major health problem in China (5).
Over the past two decades, China has experienced rapid health and sociodemographic changes that have affected the prevalence of common risk factors for stroke (6, 7). Although developed countries have shown a significant downward trend in stroke incidence through effective control of risk factors (8–10), China still lacks long-term monitoring data on stroke incidence and risk factors, especially among rural residents with low income and poor access to education. Therefore, this study aimed to explore the risk factors for developing stroke among the low-income, rural population in northern China.
Materials and Methods
Study Population and Sample Process
This is a population-based cohort study, which has conducted since 1991 in rural Tianjin, China. The study population has been described previously (11–14). Briefly, it included 14,936 people in 1991, 95% of whom were low-income farmers living in 18 administrative villages. The main source of income was cereal crop production, and the per capita incomes were <100 USD in 1990 and <1000 USD in 2010 (15).
The sampling method used in this cohort study has also been reported previously (16). In short, all residents living in the 18 administrative villages were recruited into the study. The villages were divided into three geographic regions (east, south, and north), and two villages were randomly selected from each region. Using a stratified cluster sampling approach, we selected all residents (≥15 years old) from the six villages who had no histories of ischemic heart disease (such as coronary heart disease or myocardial infarction) or stroke as participants of the survey. For this analysis, only participants aged ≥18 years were included.
This study was carried out in accordance with the recommendations of the Study involving human subjects, committee of Tianjin Medical University General Hospital. All subjects gave written informed consent in accordance with the Declaration of Helsinki. The protocol was approved by the ethics committee of Tianjin Medical University General Hospital.
Baseline Information
All information regarding demographic characteristics (including sex, age, and education level), past medical histories (including hypertension, diabetes mellitus [DM], stroke, and cardiovascular disease), and personal lifestyles (including smoking and alcohol drinking) was collected by trained local researchers through face-to-face interviews. Physical examinations, which included measurements of blood pressure (BP), height, and weight, were conducted during the interview.
Measurement Methods
The BP measurement methods are described previously (16). Briefly, standardized BP measurements were performed using a mercury sphygmomanometer, with the cuff adjusted to each patient's arm circumference. BP was measured by placing the cuff on the arm, at the level of the heart. If the difference between two systolic BP (SBP) readings was <10 mmHg and/or the difference between two diastolic BP (DBP) readings was <5 mmHg, the average of the two measurements was recorded, with the latter measurement taken after the patient had rested for 5 min in the supine position. If the differences between the two readings were outside of the indicated ranges, or the BP reached the criterion for hypertension, another two readings were obtained after an additional 20 min of resting. Hypertension was categorized into four types: normal BP, isolated systolic hypertension (ISH), isolated diastolic hypertension (IDH), and systolic-diastolic hypertension (SDH).
Body mass index (BMI) was calculated as weight (in kilograms) divided by the square of height (in meters), and categorized as follows: normal (<24 kg/m2), overweight (24–27.9 kg/m2), and obese (≥28 kg/m2) (17).
Case Definition
The stroke monitoring details and protocol used to diagnose the type of stroke are described in our previous reports (11–14). Stroke was defined as an acute, focal, neurological deficit with vascular etiology that lasts for >24 h. Stroke events included the ischemic stroke (IS) and hemorrhagic stroke subtypes. Hemorrhagic stroke was defined as an intracerebral hemorrhage (ICH) or subarachnoid hemorrhage; IS was defined as a thrombotic brain infarction, cardioembolic stroke, or lacunar infarct. Undefined strokes were those that could not be classified as either of the subtypes (18). The stroke subtypes were identified using neuroimaging examination (computed tomography or magnetic resonance imaging). All included stroke events were those diagnosed as full clinical strokes, demonstrating obvious clinical signs and symptoms. Transient ischemic attacks (TIAs) and silent strokes (diagnosed using imaging only) were excluded, and strokes occurring in individuals with histories of TIAs were considered as incident events. Patients with transient symptoms but with neuroimaging evidence of cerebral infarctions were considered as stroke cases (19). During the early phase of this study (1992–1998), strokes were confirmed mainly based on clinical examinations by senior neurologists for nonhospitalized patients and on medical records for hospitalized patients.
Statistical Analysis
Continuous variables (age, BP, and BMI) were expressed as means (standard deviation), and categorical variables were expressed as 95% confidence intervals (CIs). Age-standardized incidences were calculated using the direct method and standard population age groups: < 35, 35–39, 40–44, 45–49, 50–54, 55–59, 60–64, 65–69, 70–74, and ≥75 years (20). Subgroup analyses were conducted to evaluate the risk of first-ever stroke by age (<35, 35–44, 45–54, 55–64, 65–74, or ≥75 years), education level (illiterate, 1–6 years of schooling, 7–9 years, or >9 years), SBP (<130, 130–139, 140–159, 160–179, or ≥180 mmHg), DBP (<80, 80–89, 90–99, 100–109, or ≥110 mmHg), hypertension type (normal BP, ISH, IDH, or SDH), BMI (normal, overweight, or obese), smoking status (never smoked, former smoked, or currently smoked), and alcohol drinking status (never drank, former drank, or currently drinks). The determinants of all stroke subtypes (“total stroke” in succeeding instances) were estimated using Cox regression analysis; the results were presented as adjusted HR and 95% CIs after adjustment for covariates (age, sex, hypertension, diabetes, body mass index [BMI], hypertension types, current smoking and alcohol consumption status). In this model, there were two outcome variables (status and survival time), they were the dependent variables. Status was a dichotomous variable which was categorized stroke group and non-stroke group. Survival time, which was a continuous variable, was defined as the interval time from baseline to onset time for those participants with first-ever stroke, from baseline to June 2018 for those survivals without developing stroke (censored data) and from baseline to death date for those dead participants (censored data). All associated covariates assessed using Kaplan-Meier test were performed the Cox regression analysis. The assumption of model was that the impact of risk factors on occurring stroke events did not vary with survival time. All statistical analyses were performed using SPSS for Windows (version 19.0; SPSS, Chicago, IL, United States). A P < 0.05 was considered statistically significant.
Results
Demographic Characteristics of Participants
This study recruited 3,906 individuals (men, 1,834 [47.0%]; women, 2,072 [53.0%]; mean age, 41.74 ± 16.58 years) at baseline, with mean following-up time of 23.16 years. During 27 years of follow-up (total, 85,346.5 person-years), a total of 638 strokes (379 [59.4%] in men and 259 [40.6%] in women) were documented, including 404 ISs (63.3%), 121 hemorrhagic strokes (19.0%), and 113 undefined strokes (17.7%). The stroke incidence per 100,000 person-years in this population was as high as 748 (473 for IS; 142 for ICH). The incidence of total stroke was significantly higher among men than among women (978 vs. 556 for total stroke; 596 vs. 371 for IS; 206 vs. 88 for ICH).
The education level of the participants was very low, with 40.7% of them (men, 42.5%; women, 57.5%) having never received any formal education. The baseline prevalence was 31.0% for hypertension, 0.1% for DM, 25.7% for current smoking, and 15.4% for current alcohol drinking. The average SBP, DBP, and BMI values were 127.39 mmHg, 79.95 mmHg, and 22.58 kg/m2), respectively (Table 1).
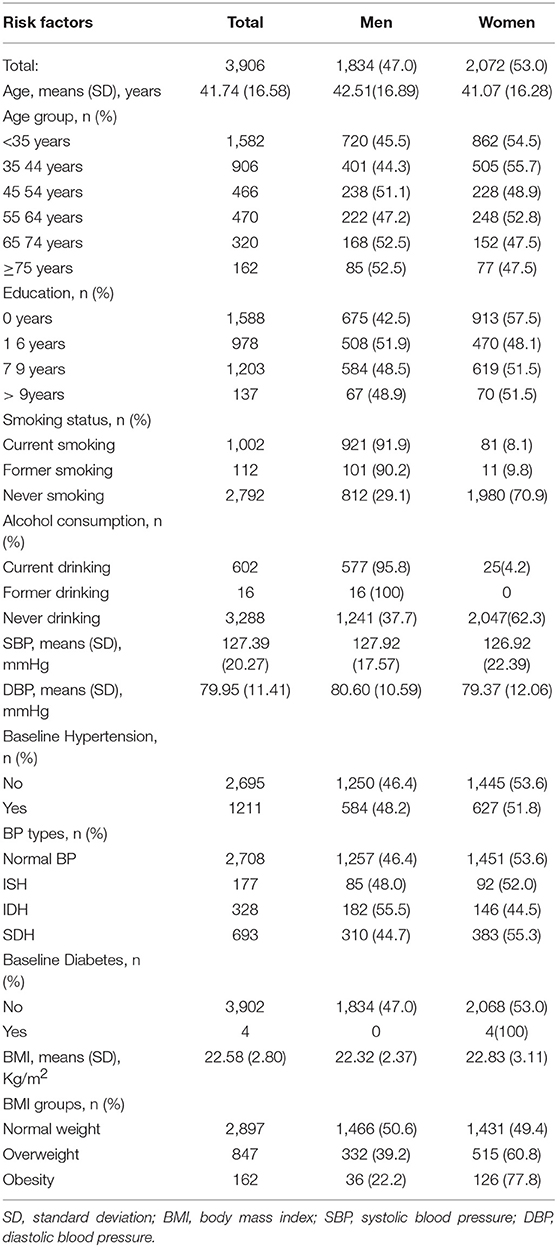
Table 1. Demographical characteristics of all participants in this study.
Associated Factors for Developing Stroke in the Univariate Analysis
During the follow-up period, the average age at baseline was higher among individuals with stroke (52.4 ± 14.7 years for total stroke; 49.5 ± 13.5 years for IS; 49.6 ± 15.1 years for ICH) than among those without stroke (all P < 0.05). Simultaneously, the incidences of total stroke and ICH increased with increasing age at baseline among individuals aged <75 years, and the incidences of ICH decreased with increasing education level (P < 0.05). The incidences were higher in ever-smokers (32.1% for total stroke; 25.9% for IS; 4.5% for ICH) and those with hypertension (27.0% for total stroke; 15.9% for IS; 4.7% for ICH; P < 0.05) than in those who never smoked or had no hypertension. However, stroke incidence was highest among former alcohol drinkers, except for ICH. Additionally, the incidence of total stroke in patients with DM (50.0%) at baseline was significantly higher than that in patients without DM (16.3%, P < 0.05). In terms of hypertension type, the incidence of total stroke was highest in patients with SDH, followed by those with ISH and IDH. Stroke incidence was also greater among overweight or obese participants than among normal-weight participants (Table 2).
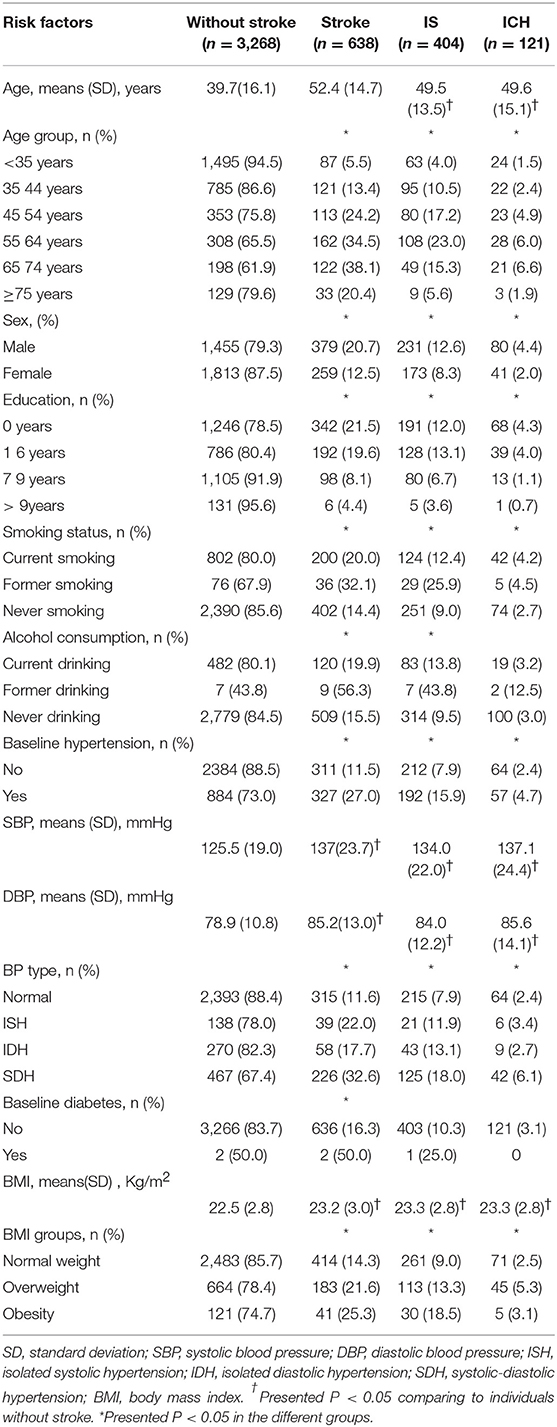
Table 2. Associated factors of developing stroke in the univariate analysis.
Determinants of Developing Stroke in the Multivariate Analysis
In the Cox proportional hazards model, a positive correlation was noted between age and stroke incidence. Compared with the <35-year-old group, participants aged ≥75 years had the highest risk of onset (HR, 23.9; 95% CI, 15.5–36.8; P < 0.001). Education level was a protective factor for stroke onset, but the stroke risk for those with 7–9 years of formal education was not any higher than the stroke risk for those with >9 years of education (P>0.05). Although smoking was also a risk factor for stroke, the stroke risk among ever-smokers was higher than that among current smokers (HR, 1.8 vs. 1.6; all P < 0.05). Stroke risk was also significantly associated with sex (HR, 1.8), previous alcohol drinking (HR, 2.7), baseline hypertension (HR, 3.1), and overweight (HR, 1.3; Table 3).
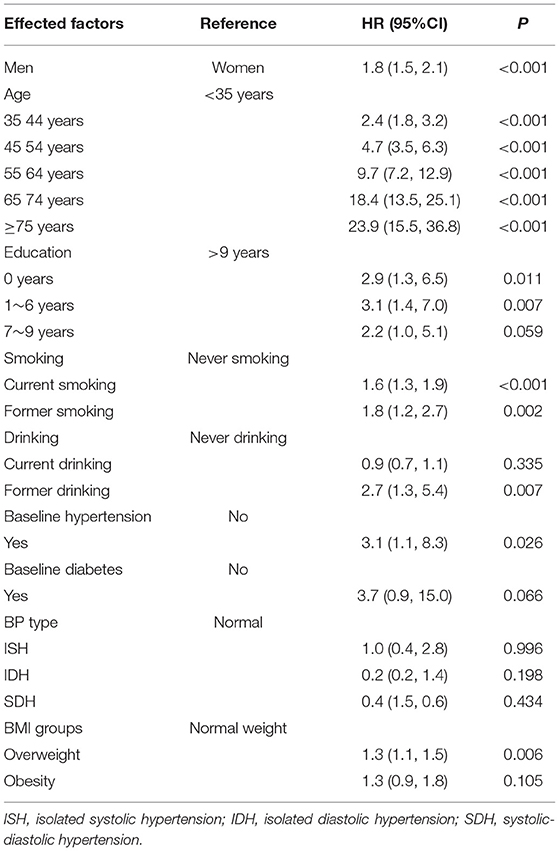
Table 3. Determinants of developing stroke in the multivariate analysis.
Determinants of Stroke by Stroke Subtype
The risk of IS was higher among men than among women (HR, 1.90; 95% CI, 1.48–2.43; P < 0.001). Compared with the <35-year-old group, participants aged 65–74 years had the highest risk of stroke (HR, 9.60; 95% CI, 6.24–14.78; P < 0.001). The risk of IS was also significantly associated with current alcohol drinking (HR, 0.69; 95% CI, 0.52–0.93), former alcohol drinking (HR, 2.51; 95% CI, 1.13–5.62), overweight (HR, 1.33; 95% CI, 1.06–1.67), and obesity (HR, 1.91; 95% CI, 1.29–2.82; Table 4).
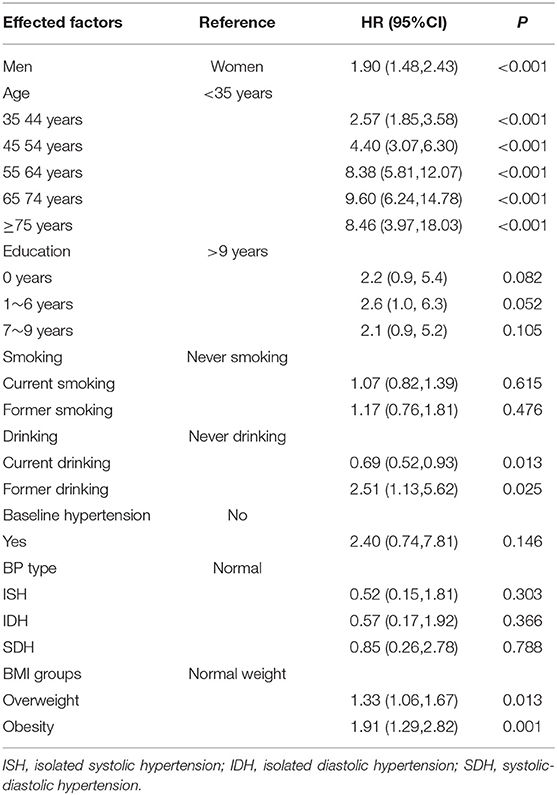
Table 4. Determinants of developing ischemic stroke in the multivariate analysis.
Meanwhile, the risk of ICH was higher in men than in women (HR, 2.88; 95% CI, 1.86–4.47; P < 0.001). Compared with the <35-year-old group, participants aged 65–74 years had the highest risk of onset (HR, 5.12; 95% CI, 2.60–10.09; P < 0.001). Education level was a protective factor for ICH onset, but the risk of ICH in those with 7–9 years of formal education was statistically significant (P < 0.001). The risk of ICH was also significantly associated with overweight (HR, 2.18; 95% CI, 1.48–3.20; Table 5).
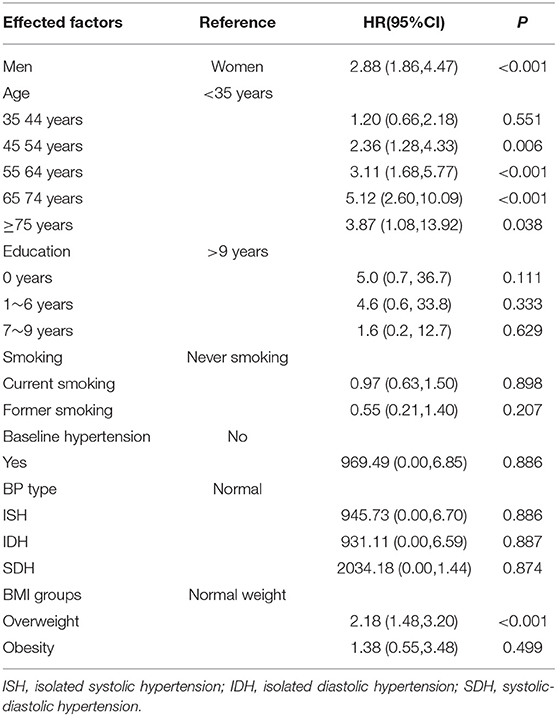
Table 5. Determinants of developing hemorrhagic stroke in the multivariate analysis.
Discussion
To our knowledge, this is the first prospective study to explore the comprehensive risk factors for stroke among low-income and poorly educated individuals in China. In this study, the overall stroke incidence per 100,000 person-years in this population was as high as 748 (473 for IS; 142 for ICH). For total stroke, sex, age, smoking status, alcohol drinking status, baseline hypertension, and overweight were risk factors, while education level was a protective factor. For IS, sex, age, former alcohol drinking, overweight, and obesity were risk factors, whereas current alcohol drinking was a protective factor. For ICH, sex, age, and overweight were risk factors, while an education level of >9 years was a protective factor.
Previous studies have reported a dramatic increase in the incidence of first-ever stroke. The age-standardized incidence of first-ever stroke per 100,000 person-years increased rapidly from 124.5 in 1992–1998 to 190.0 in 1999–2005 and to 318.2 in 2006–2012; overall, the incidence increased by 6.5% annually for this population (11). The incidences of total stroke were 586.8 per 100,000 person-years in northeastern Greece, 76.5 per 100,000 person-years in Argentina, and 345.1 per 100,000 person-years in China (21–23). However, in our study, the stroke incidence was as high as 748 per 100,000 person-years. The higher prevalence of risk factors for stroke, including hypertension, obesity, smoking, and alcohol drinking, in this population may have contributed to the elevated incidence of stroke (11).
The influence of sex and age on stroke incidence is being increasingly recognized and evaluated. With advancing age, the stroke incidence for both men and women increases exponentially (24), with approximately 75–89% of strokes occurring in individuals aged >65 years (25), consistent with our findings. Compared with individuals aged <35 years, stroke risk was 23.9 times higher among individuals aged ≥75 years, and participants aged 65–74 years had the highest risk of onset of IS and ICH. A study from Sweden also indicated that stroke risk was significantly associated with age (risk ratio [RR] per 1 year of age, 1.12) in individuals with normal BP (26).
Our results showed that stroke risk in men was 1.8 times higher than that in women. Similarly, a Swiss study showed a higher age-specific stroke incidence in men than in women (27). Overall, the global age-adjusted incidence ratio for strokes in men vs. women is 1.33, with the highest ratio occurring among individuals aged of 35–44 years and decreasing after the age of 75 years (28). The excess rate of stroke in women of advanced age may arise from their longer life expectancy than men, which results in increasing age being associated with higher stroke risk (24, 29). However, in our study population, further study is required to investigate the sex-specific differences in age-related stroke incidence. This may be partially explained by studies that have reported that estrogens beneficially affect the vasculature by improving endothelial function, enhancing vasodilation, and increasing blood flow after vascular occlusion; estrogens also have antioxidative and anti-inflammatory effects (30) and inhibit platelet aggregation (31).
Besides sex and age, smoking and alcohol drinking are independent risk factors for stroke (32–36). Although a previous studies failed to show a significant increase in total stroke risk among ever-smokers compared with never-smokers (37–39), a study from Japan found an 18% decrease in total stroke risk within the first 2 years after smoking cessation, with the maximum effect (38% risk reduction) occurring 2–4 years after smoking cessation (32). Our results also showed that smoking was a risk factor for stroke, and stroke risk was higher among former smokers than among current smokers (HR, 1.8 vs. 1.6). The reason may be because this low-education population only quit smoking after they developed a serious disease.
Previous meta-analyses (40, 41) also suggested that heavy alcohol drinking is associated with an increased risk of stroke, but that low-to-moderate intake may be protective against total stroke and IS. In this study, there was a significant increase in the risk of total stroke and IS among those who were former alcohol drinkers, but there was a significant decrease in risk among those who currently drink compared with those who never drank. This may be because low-dose alcohol drinking among current drinkers may have protective effects against stroke. Therefore, further study is needed to quantify the amount of alcohol consumed by this study population.
In our study population, ever-smokers and ever-drinkers often experienced diseases such as hypertension, and we did not have access to statistics regarding the durations of smoking and drinking cessation. Hypertension was more prevalent among ever-smokers than among never-smokers or current smokers (32). Previous studies have shown that alcohol drinking is also associated with elevated BP (42). Hypertension is often reported to be the most common and strongest risk factor associated with strokes. In a Chinese study (43) of five stroke-associated risk factors (hypertension, dyslipidemia, obesity, diabetes, and smoking), hypertension was most strongly associated with stroke risk. The results of the present study also indicated that baseline hypertension was a strong risk factor for stroke (HR, 3.1).
Diabetes is another classic risk factor for stroke. In our analysis, the prevalence of diabetes was significantly higher among stroke patients, but the relationship became nonsignificant in the multivariate analysis. This may have been due to the very low number of patients (n = 4) who exhibited known diabetes at baseline. The awareness, treatment, and control rates for diabetes in this population were 42.9, 11.1, and 11.1% in 1992, respectively. The low level of knowledge about diabetes due to the low income and low education status in this population may be the main cause of the lower prevalence of diabetes in this study.
Comparing the lowest and highest education levels, a study has demonstrated that low education level was associated with a 2.5-fold increase in stroke risk (44). Similarly, a Swedish study involving middle-aged women reported an elevated stroke risk among those with less education. In that study, the associated excess risk was largely attributed to lifestyle and biological risk factors for stroke, particularly smoking and alcohol drinking (45). Consistent with these earlier observations, the findings of the present study showed that education was a protective factor for total stroke and ICH.
A previous meta-analysis reported an RR of 1.22 (95% CI, 1.05–1.41) for IS in overweight patients and an RR of 1.64 (95% CI, 1.36–1.99) for IS in obese patients (46). Additionally, multivariate analyses of data from a study involving 76,227 Chinese adults showed that a 2 kg/m2 increase in baseline BMI increased the total stroke RR by 6.1% (47). Similarly, in the present study, overweight and obesity increased the risk of developing IS. Moreover, overweight was associated with a high risk of stroke and ICH.
This study has some limitations. The study population was selected from a township in northern China that was not representative of the country's overall population. Although this study was a prospective cohort study involving a rural, low-income population, a larger population and a longer study period may have reduced the impact of the limited representativeness of the sample on the study results. Furthermore, we did not collect information regarding all the medicines used by the participants. However, because of their low socioeconomic status, the frequency of medicine use in this population was low (16) and may not significantly affect the validity of the results.
Conclusions
This study identified uncontrollable (sex and age) and controllable (education, smoking, alcohol drinking, hypertension, and overweight) risk factors for stroke in a low-income, rural population in China. Therefore, it is critical for clinical doctors to control BP and weight effectively, advocate cessation of smoking/alcohol drinking, and enhance the education level in this population to prevent increase in the burden of stroke.
Author Contributions
JW and XN: contributed to the conception and design of the work; YW, ZF, YC, JN, JL, JH, LR, and JT: contributed the data acquisition; JW and XN: contributed the analysis and interpretation of data for the work; YW, ZF, and YC: contributed drafting the work; JW and XN: contributed revising the work for important intellectual content. All authors approved of the final version to be published, and agree to be accountable for all aspects of the work in ensuring that questions related to the accuracy or integrity of any part of the work are appropriately investigated and resolved.
Conflict of Interest Statement
The authors declare that the research was conducted in the absence of any commercial or financial relationships that could be construed as a potential conflict of interest.
Acknowledgments
We thank all participants in this study.
References
1. BD 2017 DALYs and HALE Collaborators. Global, regional, and national disability-adjusted life-years (DALYs) for 359 diseases and injuries and healthy life expectancy (HALE) for 195 countries and territories, 1990-2017: a systematic analysis for the Global Burden of Disease Study 2017. Lancet (2018) 392:1859–922. doi: 10.1016/S0140-6736(18)32335-3
2. Endres M, Heuschmann PU, Laufs U, Hakim AM. Primary prevention of stroke: blood pressure, lipids, and heart failure. Eur Heart J. (2011) 32:545–52. doi: 10.1093/eurheartj/ehq472
3. WHO. The Top Ten Causes of Death. Fact Sheet no. 310. Geneva: Word Health Organization (2014). Available online at: http://www.who.int/mediacentre/factsheets/fs310/en/ (Accessed Jun 10, 2018).
4. Feigin VL, Forouzanfar MH, Krishnamurthi R, Mensah GA, Connor M, Bennett DA, et al. Global and regional burden of stroke during 1990-2010: findings from the Global Burden of Disease Study 2010. Lancet (2014) 383:245–54. doi: 10.1016/S0140-6736(13)61953-4
5. He J, Gu D, Wu X, Reynolds K, Duan X, Yao C, et al. Major causes of death among men and women in China. N Engl J Med (2005) 353:1124–34. doi: 10.1056/NEJMsa050467
6. Zhou M, Wang H, Zhu J, Chen W, Wang L, Liu S, et al. Cause-specific mortality for 240 causes in China during 1990-2013: a systematic subnational analysis for the Global Burden of Disease Study 2013. Lancet (2016) 387:251–72. doi: 10.1016/S0140-6736(15)00551-6
7. Yang G, Wang Y, Zeng Y, Gao GF, Liang X, Zhou M, et al. Rapid health transition in China, 1990-2010: findings from the Global Burden of Disease Study 2010. Lancet (2013) 381:1987–2015. doi: 10.1016/S0140-6736(13)61097-1
8. Sivenius J, Tuomilehto J, Immonen-Raiha P, Kaarisalo M, Sarti C, Torppa J, et al. Continuous 15-year decrease in incidence and mortality of stroke in Finland: the FINSTROKE study. Stroke (2004) 35:420–5. doi: 10.1161/01.STR.0000110220.63212.59
9. Carandang R, Seshadri S, Beiser A, Kelly-Hayes M, Kase CS, Kannel WB, et al. Trends in incidence, lifetime risk, severity, and 30-day mortality of stroke over the past 50 years. JAMA (2006) 296:2939–46. doi: 10.1001/jama.296.24.2939
10. Rothwell PM, Coull AJ, Giles MF, Howard SC, Silver LE, Bull LM, et al. Change in stroke incidence, mortality, case-fatality, severity, and risk factors in Oxfordshire, UK from 1981 to 2004 (Oxford Vascular Study). Lancet (2004) 363:1925–33. doi: 10.1016/S0140-6736(04)16405-2
11. Wang J, An Z, Li B, Yang L, Tu J, Gu H, et al. Increasing stroke incidence and prevalence of risk factors in a low-income Chinese population. Neurology (2015) 84:374–81. doi: 10.1212/WNL.0000000000001175
12. Ning X, Sun J, Jiang R, Lu H, Bai L, Shi M, et al. Increased stroke burdens among the low-income young and middle aged in Rural China. Stroke (2017) 48:77–83. doi: 10.1161/STROKEAHA.116.014897
13. Wang J, Bai L, Shi M, Yang L, An Z, Li B, et al. Trends in age of first-ever stroke following increased incidence and life expectancy in a low-income chinese population. Stroke (2016) 47:929–35. doi: 10.1161/STROKEAHA.115.012466
14. Wang J, Ning X, Yang L, Tu J, Gu H, Zhan C, et al. Sex differences in trends of incidence and mortality of first-ever stroke in rural Tianjin, China, from 1992 to 2012. Stroke (2014) 45: 1626–31. doi: 10.1161/STROKEAHA.113.003899
15. The Ministry of Health of the People's Republic of China. The Causes of Death, Disease, and Hurt in Residents. China Health Statistics Yearbook 2011. Beijing: China Union Medical University Press (2011). p. 287–338.
16. Wang J, Ning X, Yang L, Lu H, Tu J, Jin W, et al. Trends of hypertension prevalence, awareness, treatment and control in rural areas of northern China during 1991-2011. J Hum Hypertens (2014) 28:25–31. doi: 10.1038/jhh.2013.44
17. Disease Control. Ministry of Health of the People's Republic of China. The Guidelines of Chinese Adult Overweight and Obesity Prevention and Control. Beijing: People's Medical Publishing House (2006), p. 1–3.
18. Aho K, Harmsen P, Hatano S, Marquardsen J, Smirnov VE, Strasser T. Cerebrovascular disease in the community: results of a WHO collaborative study. Bull World Health Organ (1980) 58:113–30.
19. Easton JD, Saver JL, Albers GW, Alberts MJ, Chaturvedi S, Feldmann E, et al. Definition and evaluation of transient ischemic attack: a scientific statement for healthcare professionals from the American Heart Association/American Stroke Association Stroke Council; Council on Cardiovascular Surgery and Anesthesia; Council on Cardiovascular Radiology and Intervention; Council on Cardiovascular Nursing; and the Interdisciplinary Council on Peripheral Vascular Disease. The American Academy of Neurology affirms the value of this statement as an educational tool for neurologists. Stroke (2009) 40:2276–93. doi: 10.1161/STROKEAHA.108.192218
20. Ahmad OB B-PC, Lopez AD, Murray CJL, Lozano R, Inoue M. Age Standardization of Rates: A New Who World Standard. GPE Discussion Paper Series, No 31. Geneva, EIP/GPE/EBD, WHO (2001).
21. Tsivgoulis G, Patousi A, Pikilidou M, Birbilis T, Katsanos AH, Mantatzis M, et al. Stroke incidence and outcomes in Northeastern Greece: the evros stroke registry. Stroke (2018) 49:288–95. doi: 10.1161/STROKEAHA.117.019524
22. Bahit MC, Coppola ML, Riccio PM, Cipriano LE, Roth GA, Lopes RD, et al. First-ever stroke and transient ischemic attack incidence and 30-day case-fatality rates in a population-based study in Argentina. Stroke (2016) 47:1640–2. doi: 10.1161/STROKEAHA.116.013637
23. Wang W, Jiang B, Sun H, Ru X, Sun D, Wang L, et al. Prevalence, incidence, and mortality of stroke in china: results from a nationwide population-based survey of 480 687 adults. Circulation (2017) 135:759–71. doi: 10.1161/CIRCULATIONAHA.116.025250
24. Truelsen T, Piechowski-Jozwiak B, Bonita R, Mathers C, Bogousslavsky J, Boysen G. Stroke incidence and prevalence in Europe: a review of available data. Eur J Neurol. (2006) 13:581–98. doi: 10.1111/j.1468-1331.2006.01138.x
25. Centers for Disease Control and Prevention (CDC). State-specific mortality from stroke and distribution of place of death–United States, 1999. MMWR (2002) 51:429–33. doi: 10.1001/jama.288.3.309-jwr0717-2-1
26. Li C, Engstrom G, Hedblad B, Berglund G, Janzon L. Risk factors for stroke in subjects with normal blood pressure: a prospective cohort study. Stroke (2005) 36:234–8. doi: 10.1161/01.STR.0000152328.66493.0a
27. Michel P, Odier C, Rutgers M, Reichhart M, Maeder P, Meuli R, et al. The Acute STroke Registry and Analysis of Lausanne (ASTRAL): design and baseline analysis of an ischemic stroke registry including acute multimodal imaging. Stroke (2010) 41:2491–8. doi: 10.1161/STROKEAHA.110.596189
28. Appelros P, Stegmayr B, Terent A. Sex differences in stroke epidemiology: a systematic review. Stroke (2009) 40:1082–90. doi: 10.1161/STROKEAHA.108.540781
29. Redon J, Olsen MH, Cooper RS, Zurriaga O, Martinez-Beneito MA, Laurent S, et al. Stroke mortality and trends from 1990 to 2006 in 39 countries from Europe and Central Asia: implications for control of high blood pressure. Eur Heart J. (2011) 32: 1424–31. doi: 10.1093/eurheartj/ehr045
30. Liu M, Dziennis S, Hurn PD, Alkayed NJ. Mechanisms of gender-linked ischemic brain injury. Restor Neurol Neurosci. (2009) 27:163–79. doi: 10.3233/RNN-2009-0467
31. Feuring M, Christ M, Roell A, Schueller P, Losel R, Dempfle CE, et al. Alterations in platelet function during the ovarian cycle. Blood Coagul Fibrinol. (2002) 13:443–7. doi: 10.1097/00001721-200207000-00009
32. Mannami T, Iso H, Baba S, Sasaki S, Okada K, Konishi M, et al. Cigarette smoking and risk of stroke and its subtypes among middle-aged Japanese men and women: the JPHC Study Cohort I. Stroke (2004) 35:1248–53. doi: 10.1161/01.STR.0000128794.30660.e8
33. Jacobs DJ, Adachi H, Mulder I, Kromhout D, Menotti A, Nissinen A, et al. Cigarette smoking and mortality risk: twenty-five-year follow-up of the Seven Countries Study. Arch Intern Med. (1999) 159:733–40. doi: 10.1001/archinte.159.7.733
34. Myint PK, Sinha S, Luben RN, Bingham SA, Wareham NJ, Khaw KT. Risk factors for first-ever stroke in the EPIC-Norfolk prospective population-based study. Eur J Cardiovasc Prev Rehabil. (2008) 15:663–9. doi: 10.1097/HJR.0b013e32830fe465
35. Gunzerath L, Faden V, Zakhari S, Warren K. National Institute on Alcohol Abuse and Alcoholism report on moderate drinking. Alcohol Clin Exp Res. (2004) 28:829–47. doi: 10.1097/01.ALC.0000128382.79375.B6
36. Klatsky AL. Alcohol and stroke: an epidemiological labyrinth. Stroke (2005) 36:1835–6. doi: 10.1161/str.36.9.1835
37. Kawachi I, Colditz GA, Stampfer MJ, Willett WC, Manson JE, Rosner B, et al. Smoking cessation and decreased risk of stroke in women. JAMA (1993) 269:232–6. doi: 10.1001/jama.1993.03500020066033
38. Wannamethee SG, Shaper AG, Whincup PH, Walker M. Smoking cessation and the risk of stroke in middle-aged men. JAMA (1995) 274:155–60. doi: 10.1001/jama.1995.03530020073035
39. Wolf PA, D'Agostino RB, Kannel WB, Bonita R, Belanger AJ. Cigarette smoking as a risk factor for stroke. The Framingham Study. JAMA (1988) 259:1025–9. doi: 10.1001/jama.1988.03720070025028
40. Reynolds K, Lewis B, Nolen JD, Kinney GL, Sathya B, He J. Alcohol consumption and risk of stroke: a meta-analysis. JAMA (2003) 289:579–88. doi: 10.1001/jama.289.5.579
41. Zhang C, Qin YY, Chen Q, Jiang H, Chen XZ, Xu CL, et al. Alcohol intake and risk of stroke: a dose-response meta-analysis of prospective studies. Int J Cardiol. (2014) 174:669–77. doi: 10.1016/j.ijcard.2014.04.225
42. Marmot MG, Elliott P, Shipley MJ, Dyer AR, Ueshima H, Beevers DG, et al. Alcohol and blood pressure: the INTERSALT study. BMJ (1994) 308:1263. doi: 10.1136/bmj.308.6939.1263
43. Yong H, Foody J, Linong J, Dong Z, Wang Y, Ma L, et al. A systematic literature review of risk factors for stroke in China. Cardiol Rev. (2013) 21:77–93. doi: 10.1097/CRD.0b013e3182748d37
44. Jackson CA, Jones M, Mishra GD. Educational and homeownership inequalities in stroke incidence: a population-based longitudinal study of mid-aged women. Eur J Public Health (2014) 24:231–6. doi: 10.1093/eurpub/ckt073
45. Kuper H, Adami HO, Theorell T, Weiderpass E. The socioeconomic gradient in the incidence of stroke: a prospective study in middle-aged women in Sweden. Stroke (2007) 38:27–33. doi: 10.1161/01.STR.0000251805.47370.91
46. Strazzullo P, D'Elia L, Cairella G, Garbagnati F, Cappuccio FP, Scalfi L. Excess body weight and incidence of stroke: meta-analysis of prospective studies with 2 million participants. Stroke (2010) 41:e418–e26. doi: 10.1161/STROKEAHA.109.576967
Keywords: stroke, risk factors, epidemiology, population-based study, cohort study
Citation: Wu Y, Fan Z, Chen Y, Ni J, Liu J, Han J, Ren L, Tu J, Ning X and Wang J (2019) Determinants of Developing Stroke Among Low-Income, Rural Residents: A 27-Year Population-Based, Prospective Cohort Study in Northern China. Front. Neurol. 10:57. doi: 10.3389/fneur.2019.00057
Received: 25 October 2018; Accepted: 16 January 2019;
Published: 05 February 2019.
Edited by:
Tracey Weiland, The University of Melbourne, AustraliaReviewed by:
Ettore Beghi, Istituto Di Ricerche Farmacologiche Mario Negri, ItalyAndrea Giordano, Istituto Neurologico Carlo Besta (IRCCS), Italy
Copyright © 2019 Wu, Fan, Chen, Ni, Liu, Han, Ren, Tu, Ning and Wang. This is an open-access article distributed under the terms of the Creative Commons Attribution License (CC BY). The use, distribution or reproduction in other forums is permitted, provided the original author(s) and the copyright owner(s) are credited and that the original publication in this journal is cited, in accordance with accepted academic practice. No use, distribution or reproduction is permitted which does not comply with these terms.
*Correspondence: Xianjia Ning, eGpuMDkwNkBnbWFpbC5jb20=
Jinghua Wang, amh3ODc5OUB5YWhvby5jb20=
†These authors have contributed equally to this work