 Lu Yu1,2
 Yuhui Chen3Min Chen1Xiaojie Luo1Shanshan Jiang4
 Yi Zhang5
 Haibo Chen3Tao Gong3
 Jinyuan Zhou4
 Chunmei Li1*
- 1Department of Radiology, Beijing Hospital, National Center of Gerontology, Beijing, China
- 2Graduate School of Peking Union Medical College, Beijing, China
- 3Department of Neurology, Beijing Hospital, National Center of Gerontology, Beijing, China
- 4Division of MR Research, Department of Radiology, Johns Hopkins University, Baltimore, MD, United States
- 5Key Laboratory for Biomedical Engineering of Ministry of Education, Center for Brain Imaging Science and Technology, College of Biomedical Engineering and Instrument Science, Zhejiang University, Hangzhou, China
Background: Amide proton transfer (APT) MR imaging has shown great potential in the evaluation of stroke severity because of its sensitivity to acid environments. However, this promising MRI technique has not been used to assess treatment efficacy with regard to stroke recovery.
Purpose: To assess the therapeutic effect of supportive treatment in ischemic stroke patients using the pH-sensitive APT MRI technique.
Material and Methods: Forty-three ischemic stroke patients at an early stage were recruited and scanned with conventional and APT MRI sequences at 3T before treatment. After treatment, 26 patients underwent a follow-up MRI scan (one to three times on different days). The magnetization-transfer-ratio asymmetry at 3.5 ppm, usually called the APT-weighted (APTW) signal, was measured. The APTW signal changes following treatment were analyzed.
Results: Baseline APTW signal intensities in the infarcted lesions inversely correlated with baseline stroke severity. Lesion APTW values gradually increased with time in 24 cases (92.3%) with a follow-up MRI scan, showing clinical symptom improvements. Two cases (7.7%) showed further decreased APTW signal in the follow-up scan, accompanied by clinical symptom aggravation. Compared to the baseline, significant APTW signal increases were found for all post-treatment patients (efficacious), whether based on post-treatment or on stroke onset times. The increase in APTW signal in the ischemic stroke lesion after treatment was associated with an improvement in clinical symptoms.
Conclusion: The APTW signal would be a useful imaging biomarker by which to assess the therapeutic efficacy of ischemic stroke treatment.
Introduction
Stroke is one of the leading causes of death, and, due to a lack of adequate treatments, is a cause of extensive concern throughout the world (1). China reports more patients with stroke than anywhere else in the world. It is estimated that approximately two million new cases are diagnosed annually, and approximately one million die from the disease (2). For ischemic stroke, recanalization treatment is an effective way to increase reperfusion rates and to reduce the final infarct size, when administered within the first 4.5 h of symptom onset (3–5). However, due to the time window limitation or a contraindication, many patients fail to accept thrombolysis treatment, usually with supportive treatment. The proper choice of supportive treatment is important for a good outcome. A reliable predictor of treatment response would play an important part in the clinic, especially at the early treatment stage, when it is practical for neurologists to make timely treatment adjustments.
MRI has played an important role in the evaluation of stroke severity and recovery, as well as in the selection of therapy regimens (6, 7). Several different kinds of functional MRI techniques have been used in stroke, for example, diffusion-weighted imaging (DWI) (8–10), perfusion-weighted imaging (PWI) (11), and MR angiography (12). Amide proton transfer (APT) MR imaging (13, 14), a type of chemical exchange saturation transfer (CEST) imaging (15), has shown promise in the detection of a separate pH-based acidosis penumbra in animal stroke models (16–18), even before a diffusion abnormality. Some early human studies have also proved the value of APT MRI in stroke (19–22). However, to our knowledge, no previous studies have been reported about the detection of the pH environment during the process of supportive treatment. In this study, we observed the early treatment effects on ischemic stroke patients using APT-weighted (APTW) (quantified with the magnetization-transfer-ratio asymmetry at 3.5 ppm), and explored the potential of pH-sensitive APTW in the management of ischemic stroke patients at an early stage.
Materials and Methods
Subjects
This retrospective study was approved by the Institutional Review Board of Beijing Hospital. Written informed consent was acquired from each subject prior to participation in this study. From April 2014 to March 2015, 61 patients with suspected stroke were enrolled. The inclusion criteria for this study were: diffusion-weighted (DW) images showed areas of restricted diffusion; patients who were not suitable for thrombolysis and only underwent supportive treatment. The supportive treatment that these patients underwent mainly included antiplatelet and anticoagulation therapy, and free radical scavenging. The exclusion criteria for this study were: a history of head trauma; central nervous system infection; other neurologic or psychiatric diseases; or a structural lesion or hydrocephalus on brain magnetic resonance images. The National Institutes of Health Stroke Scale (NIHSS) score was used to measure clinical stroke severity prior to the MR examination. This was performed based on the level of consciousness (LOC), LOC question, commands, best gaze, visual field, facial palsy, motor arm, motor leg, limb ataxia, sensory, best language, dysarthia, and extinction/neglect of the patient by an neurologist: 0–1: normal or near normal, 1–4: mild stroke, 5–15: moderate stroke, 15–20: moderate to severe stroke, and 21–42: severe stroke.
Of the 61 patients, 12 were excluded due to small infarcted regions (<2–3 mm), and six were excluded due to motion artifacts during the MRI scan. As a result, 43 patients (33 men and 10 women; mean age, 64.9 years; range, 44–84 years; Table 1) were included in this study. The first scan was performed prior to treatment for all patients. Some of these patients continued to undergo MRI scanning after treatment, one to three times on different days. The numbers of MRI scans for the 43 patients were as follows: 17 patients with one MRI scan; 13 patients with two MRI scans; eight patients with three MRI scans; and five patients with four MRI scans. In total, 26 patients had follow-up scans. The median onset of symptoms until the first research MRI scan was 3 days (ranging from 6 h to 8 days).
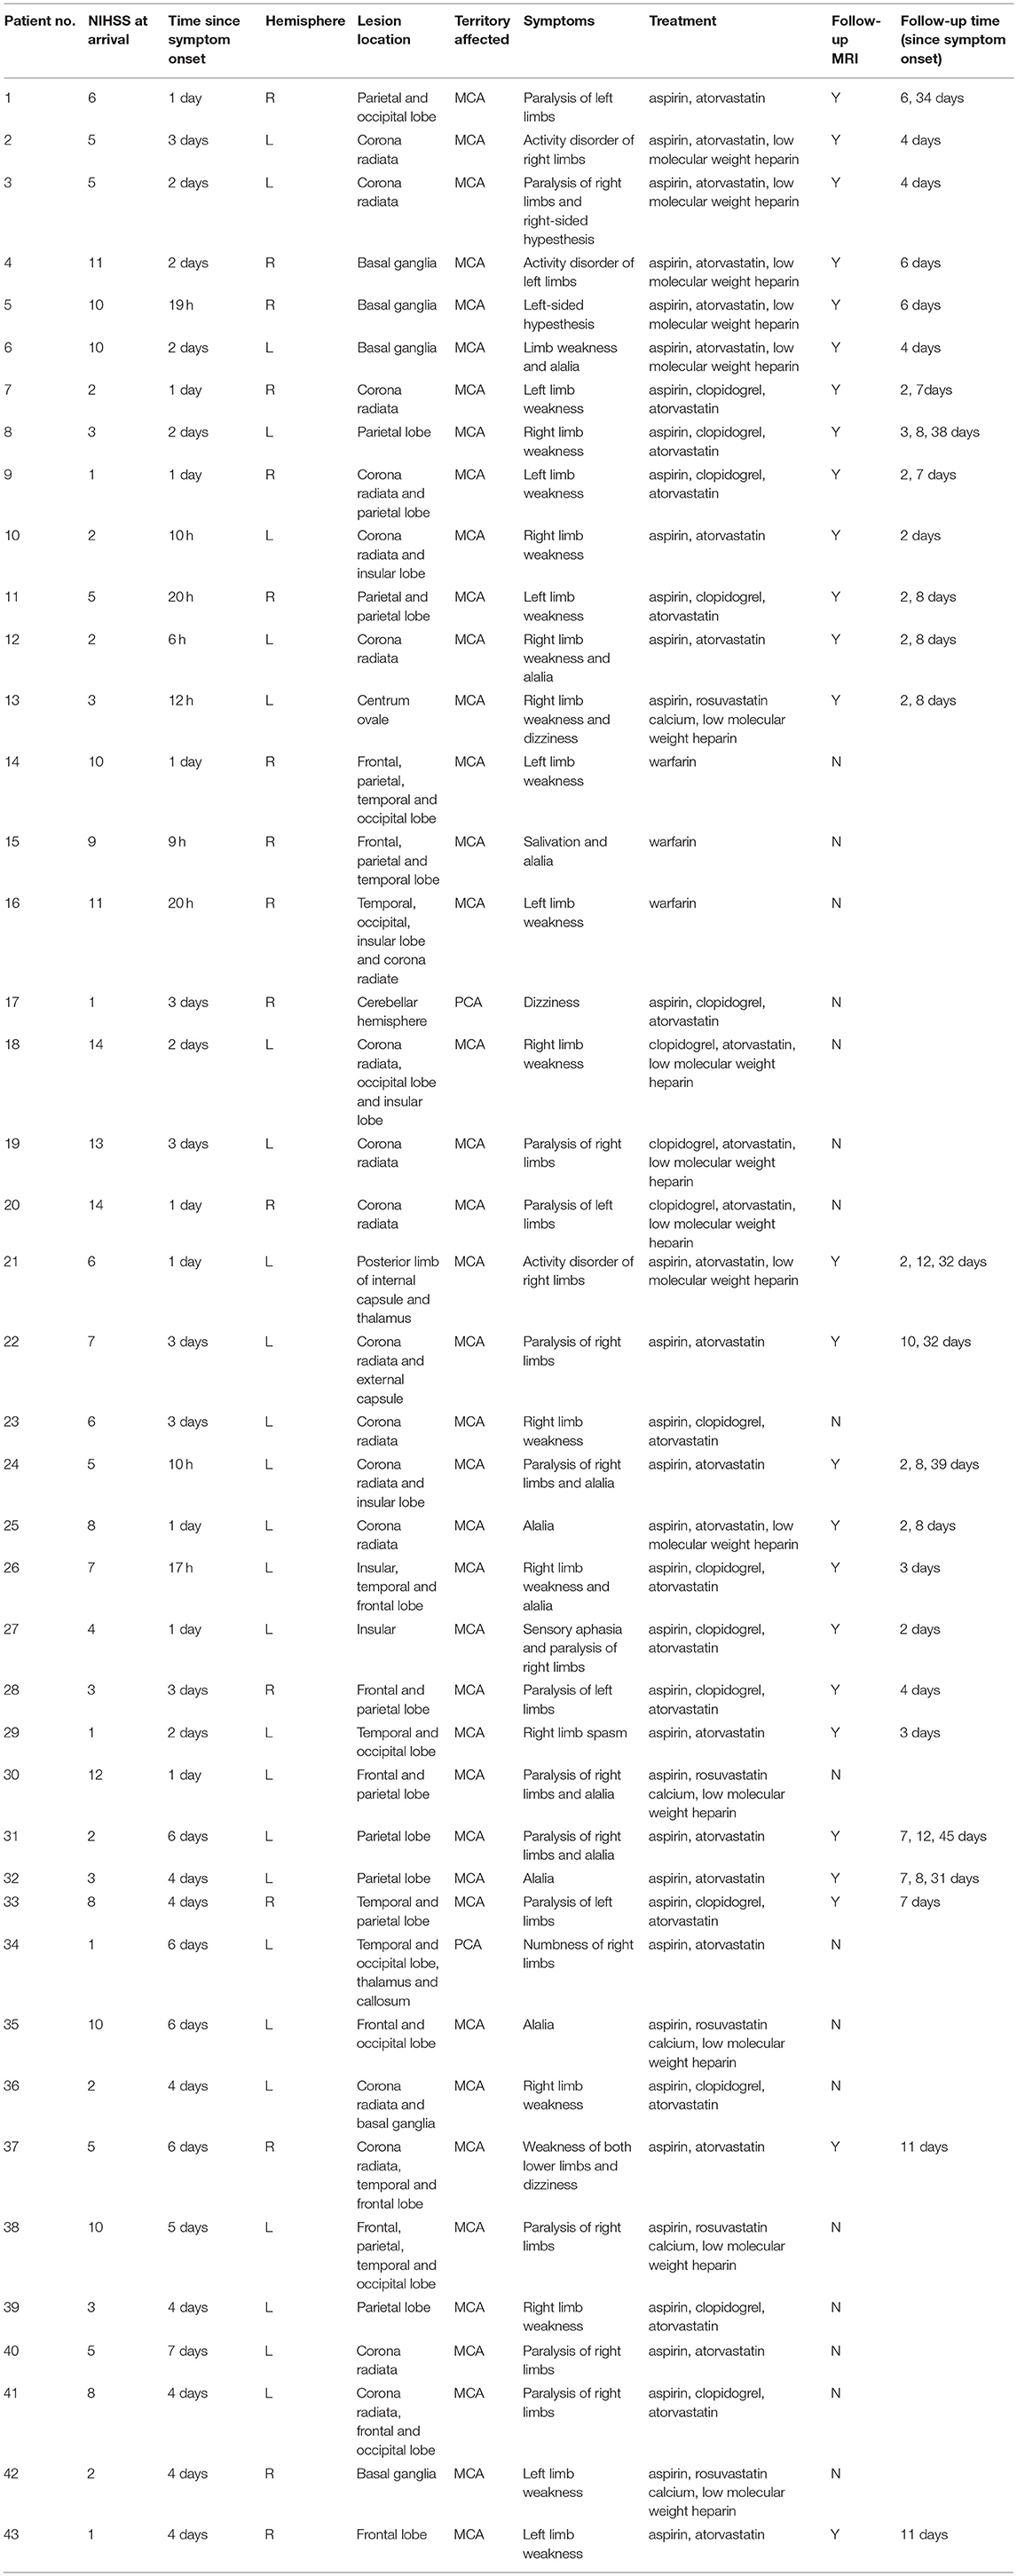
Table 1. Basic patient demographic data.
MRI Acquisition
All subjects were imaged on a 3 Tesla Philips MRI system (Achieva 3.0T; Philips Medical Systems, Best, The Netherlands), with an eight-channel head coil. The patients were scanned shortly after the neurological assessment. Axial T2-weighted, T1-weighted, fluid-attenuated inversion recovery (FLAIR), and DWI sequences, were acquired prior to APTW imaging. The APTW imaging slice for each patient was located in the largest hyperintensity area on the DW images. APTW imaging was performed using a 2D single-slice sequence, based on pseudo-continuous wave, off-resonance RF irradiation (saturation duration, 800 ms; power level, 2 μT), and a single-shot, turbo-spin-echo readout. We set the APTW position parameters, including the AP, FH and RL the same as the slice of DWI to further improve registration. The other parameters were as follows: repetition time, 3,000 ms; turbo-spin-echo factor, 54; field of view, 230 mm × 221 mm; matrix, 105 × 100 (reconstructed to be 400 × 400); slice thickness, 6 mm. A multi-offset, multi-acquisition APTW imaging protocol, similar to previous studies (23–25), was used. The 31 offsets were 0, ±0.25, ±0.5,±0.75, ±1 (2), ±1.5 (2), ±2 (2), ±2.5 (2), ±3 (2), ±3.25 (2), ±3.5 (8), ±3.75 (2), ±4 (2), ±4.5, ±5, ±6 ppm (the values in parentheses were the number of acquisitions, which was 1, if not specified). An unsaturated image was acquired for signal normalization. The acquisition time was 3 min 12 s.
Imaging Processing
The APTW imaging analysis was performed using the Interactive Data Language (ITT Visual Information Solutions, Boulder, CO). To reduce possible motion artifacts during the scanning, the acquired APTW image series for each case was registered to the saturated image at 3.5 ppm, using a rigid-body transformation with three degrees of freedom (26). Then, the z-spectrum (Ssat/S0, in which Ssat and S0 are the signal intensities with and without selective RF irradiation, respectively, plotted as a function of saturation frequency offset, relative to water) was organized and corrected for the B0 field inhomogeneity effect on a voxel-by-voxel basis, as reported before (23–25, 27, 28). CEST imaging is quantified through the magnetization transfer ratio (MTR = 1–Ssat/S0) asymmetry (MTRasym) analysis with respect to the water resonance (25):
Specifically for APTW imaging at the offset of 3.5 ppm, we have:
where APTR is the proton transfer ratio for the amide protons associated with mobile cellular proteins and peptides in tissue, and consists of various nuclear Overhauser enhancement (NOE) effects of the upfield non-exchangeable protons (such as aliphatic protons) of cellular macromolecules and metabolites (29, 30), including the inherent MTRasym of the solid-phase magnetization transfer effect (25).
For the quantitative APTW image analysis, the DW images co-registered to the saturated image at 3.5 ppm and the corresponding APTW image (26) were used as the anatomical reference to draw regions of interest (ROIs). For each infarct lesion, similar to a few previous reports (27, 28), several small ROIs (Figure 1) were manually selected (100~125 pixels each) on the hyperintense brain regions on DW images by a radiologist who was blinded to patient outcome. The number of ROIs selected depended on the size of the lesion. Theoretically, the lowest APTW value may correspond to the lowest pH in the lesion, a value in which one is interested. Thus, instead of the mean value for each case, the lowest APTW value and the corresponding z-spectrum and MTRasym spectrum data were recorded. The value of contralateral normal-appearing white matter (CNAWM) mirrored the lesion ROIs was also measured for each case. The sulci, hemorrhage, or vessels evident on standard MRI sequences were always avoided. The CNAWM was relatively homogenous, and only one ROI was selected. The APTW difference between an ischemic lesion and the CNAWM (namely, APTW contrast) was also analyzed. In addition, for each infarct lesion, the whole infarct lesion was also manually drawn on the hyperintense brain regions on DW images as ROI.
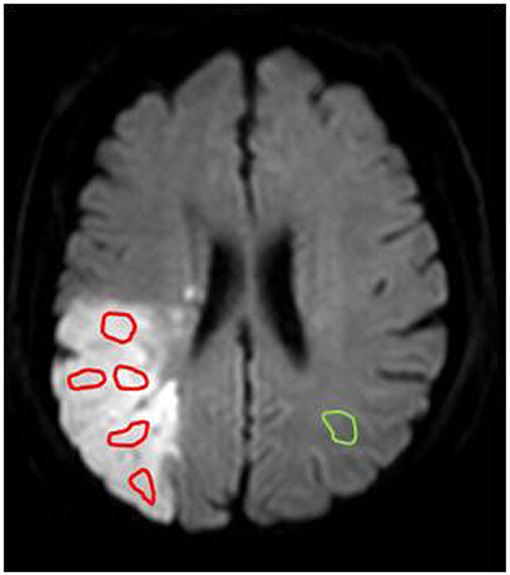
Figure 1. An example of the ROI selection for quantitative APTW image analysis on a DW image. Several ROIs (red, 100~125 pixels each) were selected within the infarcted lesion, and a ROI (green, 100~125 pixels) was selected within the CNAWM for comparison.
Statistical Analysis
All data were analyzed using the statistical package SPSS16.0 (Chicago, IL). Pearson's correlation analysis was performed between the baseline APTW signals and NIHSS at arrival. For patients with more than one scan, the longitudinal signal changes in stroke after treatment were analyzed. We grouped the patients using a time frame similar to that reported in the literature (6). We divided the patients according to post-treatment duration (a time interval between the beginning of treatment and MRI scanning): ≤ 96 h; 4 ~ 7 days; 8 ~ 21 days; and ≥ 22 days. A one-way analysis of variance (ANOVA) test, followed by the least significant difference (LSD) post-hoc test, was used to analyze the differences in APTW between pre-treatment and post-treatment with different post-treatment durations. We also divided the patients according to the onset times: ≤ 96 h; 4 ~ 7 days; 8 ~ 21 days; and ≥22 days. APTW MRI signal differences between stroke patients with and without treatment at the same onset time were analyzed by an independent-samples t-test. Pearson's correlation analysis was performed for the APTW signals with onset time or post-treatment time. The level of significance was set at P < 0.05.
Results
Correlation Between Baseline APTW Signals and NIHSS at Arrival
Both lesion APTW values and APTW contrast values had significant correlations with the NIHSS at arrival (Figure 2; r = −0.491; p = 0.001; r = −0.425; p = 0.004, respectively), while the correlation between pre-treatment ADC and NIHSS at arrival was not significant (r = 0.01, p = 0.949). No significant correlation was found between CNAWM APTW values and the NIHSS at arrival (r = −0.170; p = 0.275).
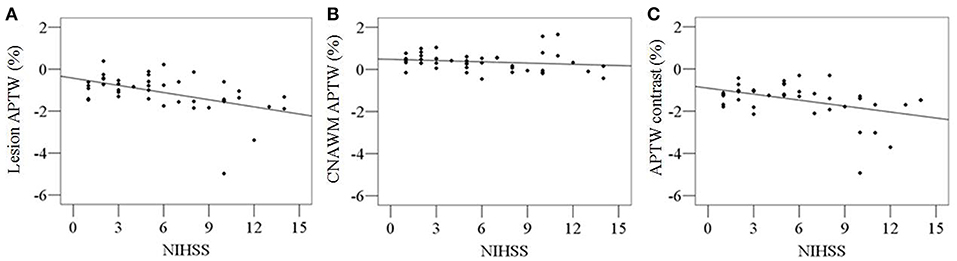
Figure 2. Correlations between pre-treatment APTW signal intensities and NIHSS at arrival. Significant correlations were found between lesion APTW values and NIHSS (r = −0.491; p = 0.001) (A), as well as APTW contrast values and NIHSS (r = −0.425; p = 0.004) (C). No significant correlation were found between CNAWM APTW values and NIHSS (r = −0.170; p = 0.275) (B).
Change of MTRasym Spectra After Treatment
The average z-spectra of the ischemic stroke lesions and CNAWM for the pre-treatment and post-treatment groups were demonstrated (Supplementary Figure S1). Figure 3 compared the average MTRasym spectra of the ischemic stroke lesions and CNAWM pre-treatment and at several time points post-treatment. The CEST effect was clearly visible in the offset range of 1–4 ppm in the MTRasym spectra. As reported before (25), the presence of the nuclear Overhauser enhancement (NOE) effects (29, 30) upfield from the water resonance caused a negative background for the asymmetry analysis of the z-spectra, leading to the negative CEST signals to be observed in the offset range of >4.5 ppm in the MTRasym spectra. Notably, most CEST signals in the offset range of 2–5 ppm at pre-treatment were decreased in the ischemic stroke lesions, compared to CNAWM. The maximal change appeared at the offset of 3.5 ppm, where the amide protons of mobile proteins and peptides resonate. The APTW signal intensities of the ischemic stroke lesion increased gradually with post-treatment duration (negative values to positive values), and became even higher than those in the CNAWM at 8 ~ 21 days and ≥22 days post-treatment (0.65 ± 0.39% vs. 0.51 ± 0.19%, 0.82 ± 0.79% vs. 0.21 ± 0.35%, respectively, also see Table 2).
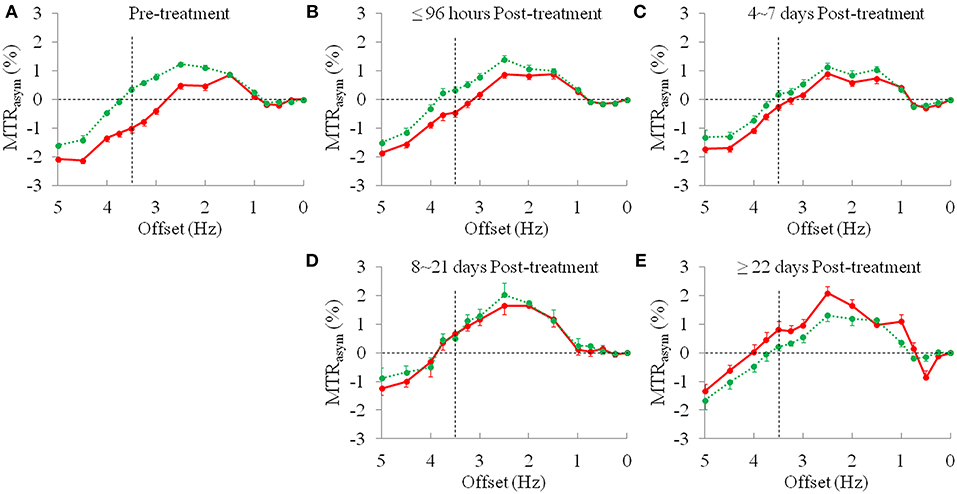
Figure 3. The average MTRasym spectra (mean ± standard error) of the ischemic stroke lesions (red line) and CNAWM (green line). (A) Pre-treatment, n = 43; (B) ≤96 h post-treatment, n = 18; (C) 4~7 days post-treatment, n = 14; (D) 8~21 days post-treatment, n = 3; and (E) ≥22 days post-treatment, n = 7.
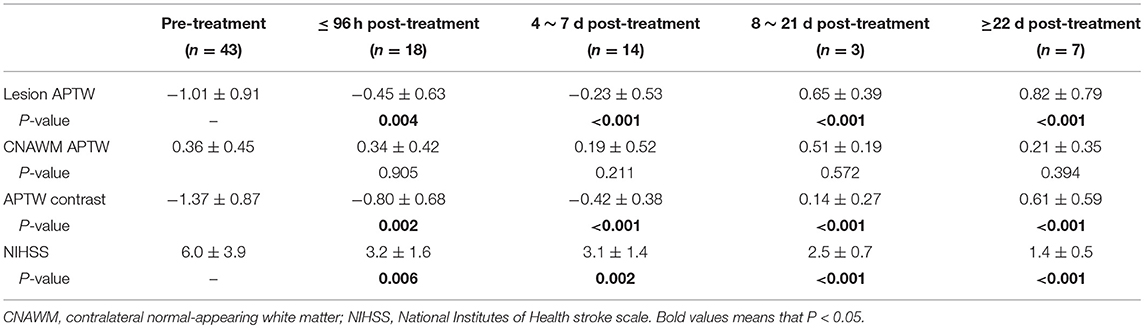
Table 2. Comparisons of APTW signal intensities (mean ± SD; % of the bulk water signal) for pre-treatment and post-treatment groups and P-values when comparing to pre-treatment.
Change of APTW Signals After Treatment
Of 26 patients with follow-up scans after supportive treatment, 24 (92.3%) showed gradually increased APTW signal in the infarcted lesion with time, accompanied by an improvement in clinical symptoms. Figure 4 shows a typical case with effective treatment at 1, 6, and 34 days post-onset. At 1 day post-onset, DW images showed a hyperintensity in the lesion on the right frontal and parietal lobes, the APTW images showed a hypointensity in the same region, and the NIHSS was 6. At 6 days post-onset, DW images still showed the hyperintensity in the lesion, while the APTW images showed a considerable increase, and NIHSS decreased from 6 to 3. As for 34 days post-onset, DW images showed a hypointensity in the lesion. However, the APTW images had a further increased signal, which was even higher than that in the contralateral hemisphere, perhaps due to cystic liquefactive necrosis (31, 32). The NIHSS fell to 2, with further clinical improvement.
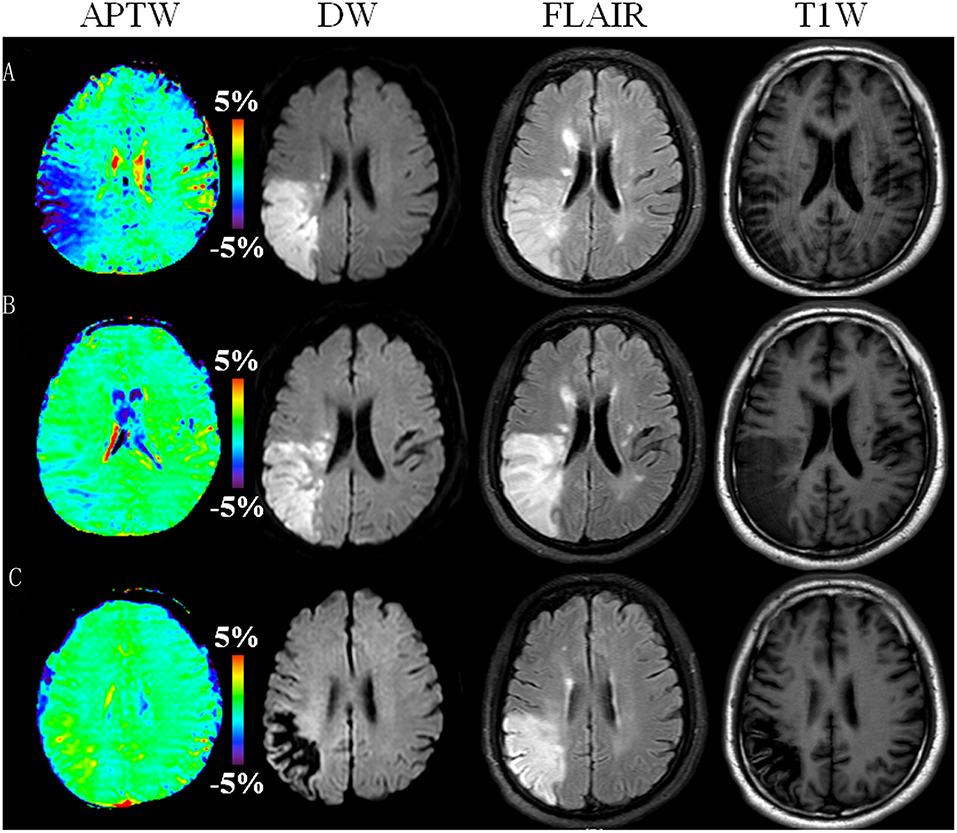
Figure 4. APTW, DW, FLAIR, and T1-weighted (T1W) images of a representative patient with ischemic stroke (male, 52 years old) at 1 day (A), 6 days (B), and 34 days (C) post-onset (or pre-treatment, 5 days, and 33 days post-treatment). DW images showed a hyperintensity in the lesion on the first and second scans, but hypointensity on the third scan. APTW images showed gradually increased signal intensity values in the corresponding lesion area. The NIHSS was 6, 3, and 2 at 1, 6, and 34 days post-onset, respectively. Note that the geometry and location of the slice was not positioned very well at the last time point.
We quantitatively assessed the APTW signal changes before and after treatment. For the 24 patients with effective treatment, a significant increase in APTW values in the infarcted lesions was observed at all four time points post-treatment (Table 2). A significant NIHSS decrease was also seen at all time points post-treatment. In addition, we observed the significant APTW signal difference between the pre-treatment and post-treatment patients with the same post-onset time (Table 3). At two post-onset times of ≤96 h and 4–7 days, the APTW signal intensities were significantly higher in the post-treatment patients than in the pre-treatment patients, consistent with improved NIHSS in the post-treatment patients, while the CNAWM APTW showed no significant differences. The data for two later post-onset times of 8–21 days and ≥22 days were not analyzed because no untreated subjects had been recruited. This corresponded to significant correlations between lesion APTW signal intensities and post-treatment time (Figure 5B) or stroke onset time (Figure 5C) for the treated patients.
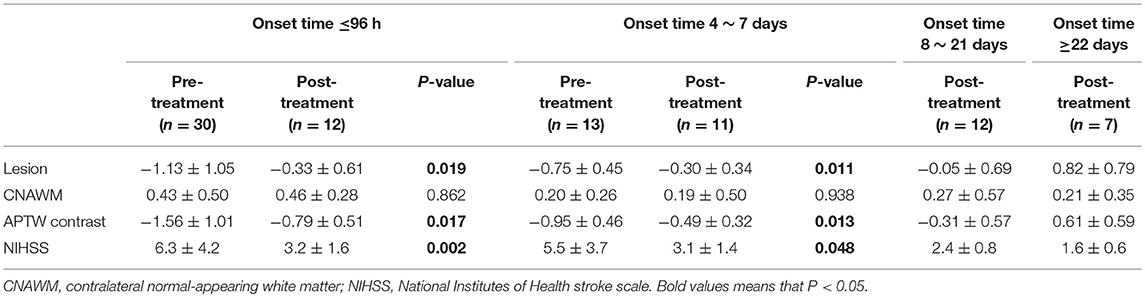
Table 3. Comparisons of APTW signal intensities (mean ± SD; % of the bulk water signal) for pre-treatment and post-treatment groups with different stroke onset times.
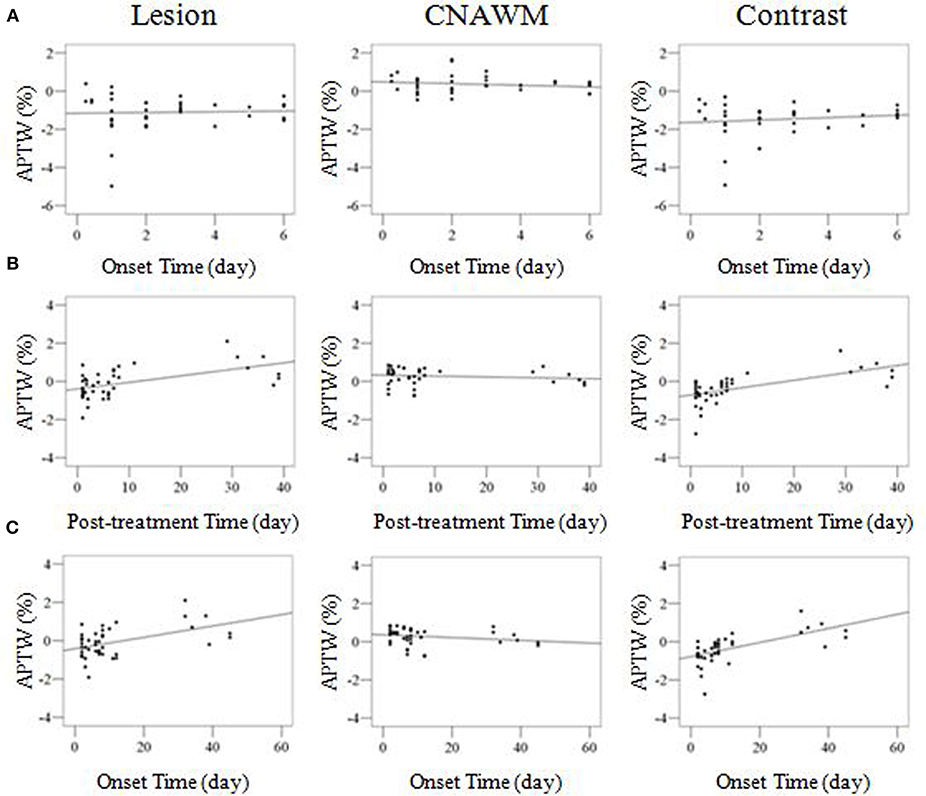
Figure 5. (A) Correlation analyses between APTW and onset time for the untreated patients, showing no significant correlations for lesion APTW (r = 0.043; p = 0.784), CNAWM APTW (r = −0.187; p = 0.229), and APTW contrast (r = 0.142; p = 0.362). (B) Correlation analyses between APTW signal intensities and post-treatment time for the treated patients. Lesion APTW (r = 0.537; p < 0.001), CNAWM APTW (r = −0.127; p = 0.422), and APTW contrast (r = 0.631; p < 0.001). (C) Correlation analyses between APTW signal intensities and onset time for the treated patients. Lesion APTW (r = 0.484; p = 0.001), CNAWM APTW (r = −0.211; p = 0.179), and APTW contrast (r = 0.625; p < 0.001). Both (B,C) show significant correlations for lesion APTW and APTW contrast, but no significant correlations for CNAWM APTW.
The remaining two patients (7.7%) showed further decreased APTW in the infarcted lesion on the second scan (the first scan after treatment), accompanied by clinical symptom aggravation. For example, the first case was scanned at 3 days post-onset, showing the DWI hyperintensity and APTW hypointensity (lesion APTW = −1.10%) on the right frontal lobe, with an NIHSS of 3. One day later (post-treatment), DW images still showed a hyperintensity in the lesion, while APTW images showed further decreased signal (lesion APTW = −1.91%), with an increase of the NIHSS to 6. The symptoms of this patient further worsened, and his NIHSS reached 8 at 11 days post-onset. These two patients whose treatment was ineffective were excluded from the quantitative analysis in Tables 2, 3.
Discussion
Based on our results, baseline pre-treatment APTW signals correlated, inversely and significantly, with the baseline NIHSS, even though the infarction occurred in different regions of the brain. After treatment, most patients (over 90%) showed a gradually increasing APTW MRI intensity over time, accompanied by clinical symptom improvements and, therefore, an improvement in NIHSS; however, few patients showed a clearly decreasing APTW MRI intensity, accompanied by clinical symptom aggravation. APTW MRI is most likely sensitive to intracellular acidosis in stroke, including in animal models (33–36) and in patients (19–22), because of its sensitivity to pH changes. The increase in APTW MRI intensity indicates amelioration of intracellular acidosis, or relief of brain tissue ischemia and hypoxia. This explains the improvement in clinical symptoms. In contrast to this, the decrease in APTW MRI intensity indicates an aggravation of brain tissue ischemia and hypoxia, which would result in more serious clinical symptoms. It appears that APT imaging can provide unique information about post-treatment status and make the therapeutic effect visible. This also makes it possible to predict treatment effect by observing the APTW MRI signal changes after supportive treatment, especially the changes on the first scan after treatment. Increased APTW values may predict a good treatment effect, and decreased APTW values may predict a poor treatment effect at the very beginning of supportive treatment, which will help neurologists to make proper adjustment to treatment. Thus, the APTW signal may have the potential to serve as a new predictable imaging biomarker, additional to the MRI biomarkers listed in the review of Kidwell (37).
To explore the effect of supportive treatment on ischemia, we investigated longitudinal changes in APTW signal intensities based on post-treatment duration and onset time (Tables 2, 3, as well as Figure 5). For the patients with effective treatment, increased APTW values were observed with post-treatment duration, likely indicating the pH increase, which could be used to explain the improved symptoms and NIHSS improvement. For the onset times ≤96 h and 4–7 days, the APTW MRI signals of the treated patients were significantly higher than those of the untreated patients, which may have indicated a pH increase. Note that the change in APTW between these two untreated patient groups may reflect spontaneous recovery, which can be supported by the decrease NIHSS. The untreated patients with an onset time of 8–21 days and ≥22 days were not analyzed in this study, because there were no cases collected, which is not practical in the clinic. However, we could still see an increasing tendency in APTW signals after treatment in patients who had an onset time of 8–21 days. These results may indicate that the pH value of the infarction increased and cerebral alkalosis occurred at a late stage after treatment. This might be indicative of the influence of treatment, which would result in a pH increase for the relief of intracellular acidosis in the infarcted region.
The APTW signal quantified from MTRasym(3.5 ppm), as used in this study, was contaminated with the upfield NOE signal from mobile and semisolid proton types (29, 30). To obtain more pure APT signal, several alternative APTW imaging analysis or acquisition approaches have been proposed recently (38–42), such as Lorentzian-line-fit analysis and Bayesian model-based analysis (43). For example, it has been shown recently on stroke patients (44) that APTW imaging quantification using the extrapolated semi-solid MT model reference approach (41, 42) can achieve not only more pure APTW signals but also higher detection sensitivity, which may allow reliably delineation of ischemic penumbra tissues. However, these methods typically require a longer acquisition time, and their use for the routine practice requires further validation. Further, according to the theory (45), in addition to tissue pH, some other tissue factors (amide proton concentration, water proton concentration, and T1 of water) may affect the measured APTW signal. However, it is very important to realize that the contributions of tissue water content and T1 to APTW are mostly compensated in many diseases, as discussed in the previous papers (13, 46). Notably, in spite of its complexity, some recent numerical simulation studies (47, 48) have clearly demonstrated that the APT effect in tissue is actually not associated with water T1 at the saturation power of 2 μT used in this study. Consequently, the fact that the APTW signal increased during stroke recovery may suggest the amelioration of intracellular acidosis or even the occurrence of cerebral alkalosis, consistent with some early 31P MR spectroscopy studies (49, 50), but further validation is required.
In order to determine the robustness of the multiple small ROI selection method used, we further evaluated the mean APTW values and mean APTW contrasts across the infarct area drawn in the whole hyperintense brain regions on DW images (Supplementary Results). The lowest APTW seemed to provide more or similar information than the mean APTW of the whole lesion.
Some other limitations to this study should also be mentioned. First, we used 2D APT sequences in this study, and thus, only one slice was evaluated. To minimize possible error, we chose the central slice with the largest infarct size. In a planned future study, 3D APT sequences, as reported in the literature (51), would be used. Second, some other factors which may correlate with the treatment effect, such as the residual stenosis or occlusion of the affected vessel(s), the collateral flow, the degree of diffusion-perfusion mismatch, and the infarct volumes, were not analyzed in the present study. Third, the sample number was relatively small, and MRI scans had the very heterogeneous time points. Because of the sample size limitation, we did not statistically analyze the difference between the effective and ineffective (only two cases) treatment groups, although we could infer that a significant decrease in APTW signal could be found after treatment. Further analysis with more samples is needed in the future. Fourth, in this work, we focused on the recovery at sub-acute and early chronic stages post-stroke. A further study with patients at hyper-acute and acute stages will be performed in the near future. Finally, a further study should be performed to determine the utility of APTW signal as imaging biomarker to predict the final outcome of patients. The utility of APTW in the decision of thrombolysis and endovascular treatment of acute stroke patients, particularly in a multicenter trial, should be another interesting study to be performed in the future.
Conclusion
APTW MRI is a promising non-invasive technique with which to characterize pH changes in the infarcted lesion in ischemic stroke patients. The increase in APTW signals in comparison to CNAWM may indicate an improvement in clinical symptoms, while a decrease in APTW signals may indicate a worsening of clinical symptoms. These findings would provide a new insight into the microenvironmental change in the ischemic stroke lesion with treatment. Therefore, APTW MRI can enable a visual assessment of the therapeutic effect because of its sensitivity to pH changes, and the APTW signal could serve as a useful surrogate biomarker with which to quantify the therapeutic effect of ischemic stroke treatments.
Ethics Statement
This study was carried out in accordance with the recommendations of the human ethics committee of the Beijing Hospital with written informed consent from all subjects. All subjects gave written informed consent in accordance with the Declaration of Helsinki. The protocol was approved by the human ethics committee of the Beijing Hospital.
Author Contributions
LY and CL: conducted the MRI data processing and statistical analyses, and drafted the initial manuscript; LY, YC, MC, XL, HC, TG, and CL: contributed to data collection and analyses; SJ, YZ, and JZ: assisted with data analysis and interpretation; CL: designed the study.
Funding
This study was supported by the National Natural Science Foundation of China (81361120392, 81401404 and 81771826), Beijing Municipal Natural Science Foundation (7154235 and 7162171), the National Institutes of Health (R01CA166171, R01CA228188, R01NS083425, and UG3NS106937), and Beijing Hospital Research Program (bj-2015-142).
Conflict of Interest Statement
The authors declare that the research was conducted in the absence of any commercial or financial relationships that could be construed as a potential conflict of interest.
Acknowledgments
We thank Xuna Zhao, Guodong Song, Shuai Zhang, and Kaining Shi for their help and discussion and MS. Mary McAllister (Division of MR Research, Department of Radiology, Johns Hopkins University) for editorial assistance.
Supplementary Material
The Supplementary Material for this article can be found online at: https://www.frontiersin.org/articles/10.3389/fneur.2019.00104/full#supplementary-material
References
1. Lopez AD, Mathers CD, Ezzati M, Jamison DT, Murray CJ. Global and regional burden of disease and risk factors, 2001: systematic analysis of population health data. Lancet (2006) 367:1747–57. doi: 10.1016/S0140-6736(06)68770-9
2. Liu M, Wu B, Wang WZ, Lee LM, Zhang SH, Kong LZ. Stroke in China: epidemiology, prevention, and management strategies. Lancet Neurol. (2007) 6:456–64. doi: 10.1016/S1474-4422(07)70004-2
3. NINDS rt-PA Stroke Study Group. Tissue plasminogen activation for acute ischemic stroke. N Engl J Med. (1995) 333:1581–87.
4. Wechsler LR. Intravenous thrombolytic therapy for acute ischemic stroke. N Engl J Med. (2011) 364:2138–46. doi: 10.1056/NEJMct1007370
5. Hesselmann V, Niederstadt T, Dziewas R, Ritter M, Kemmling A, Maintz D, et al. Reperfusion by combined thrombolysis and mechanical thrombectomy in acute stroke: effect of collateralization, mismatch, and time to and grade of recanalization on clinical and tissue outcome. AJNR Am J Neuroradiol. (2012) 33:336–42. doi: 10.3174/ajnr.A2746
6. Warach S, Dashe JF, Edelman RR. Clinical outcome in ischemic stroke predicted by early diffusion-weighted and perfusion magnetic resonance imaging: a preliminary analysis. J Cereb Blood Flow Metab. (1996) 16:53–9. doi: 10.1097/00004647-199601000-00006
7. Jiang Q, Zhang ZG, Chopp M. MRI of stroke recovery. Stroke (2010) 41:410–4. doi: 10.1161/STROKEAHA.109.568048
8. Aoki J, Tateishi Y, Cummings CL, Cheng-Ching E, Ruggieri P, Hussain MS, et al. Diffusion-weighted imaging volume as the best predictor of the diffusion-perfusion mismatch in acute stroke patients within 8 hours of onset. J Neuroimaging (2015) 25:217–25. doi: 10.1111/jon.12107
9. Soize S, Tisserand M, Charron S, Turc G, Ben Hassen W, Labeyrie MA, et al. How sustained is 24-hour diffusion-weighted imaging lesion reversal? Serial magnetic resonance imaging in a patient cohort thrombolyzed within 4.5 hours of stroke onset. Stroke (2015) 46:704–10. doi: 10.1161/STROKEAHA.114.008322
10. Gon Y, Sakaguchi M, Okazaki S, Mochizuki H, Kitagawa K. Prevalence of positive diffusion-weighted imaging findings and ischemic stroke recurrence in transient ischemic attack. J Stroke Cerebrovasc Dis. (2015) 24:1000–7. doi: 10.1016/j.jstrokecerebrovasdis.2014.12.023
11. Simonsen CZ, Madsen MH, Schmitz ML, Mikkelsen IK, Fisher M, Andersen G. Sensitivity of diffusion- and perfusion-weighted imaging for diagnosing acute ischemic stroke is 97.5%. Stroke (2015) 46:98–101. doi: 10.1161/STROKEAHA.114.007107
12. Seeger A, Klose U, Poli S, Kramer U, Ernemann U, Hauser TK. Acute stroke imaging: feasibility and value of MR angiography with high spatial and temporal resolution for vessel assessment and perfusion analysis in patients with wake-up stroke. Acad Radiol. (2015) 22:413–22. doi: 10.1016/j.acra.2014.11.013
13. Zhou J, Payen JF, Wilson DA, Traystman RJ, van Zijl PC. Using the amide proton signals of intracellular proteins and peptides to detect pH effects in MRI. Nat Med. (2003) 9:1085–90. doi: 10.1038/nm907
14. Zhou J, van Zijl PC. Chemical exchange saturation transfer imaging and spectroscopy. Progr NMR Spectr. (2006) 48:109–36. doi: 10.1016/j.pnmrs.2006.01.001
15. Ward KM, Aletras AH, Balaban RS. A new class of contrast agents for MRI based on proton chemical exchange dependent saturation transfer (CEST). J Magn Reson. (2000) 143:79–87. doi: 10.1006/jmre.1999.1956
16. Zhou JY, van Zijl PCM. Defining an acidosis-based ischemic penumbra from pH-weighted MRI. Transl Stroke Res. (2011) 3:76–83. doi: 10.1007/s12975-011-0110-4
17. Sun PZ, Zhou J, Sun W, Huang J, van Zijl PC. Detection of the ischemic penumbra using pH-weighted MRI. J Cereb Blood Flow Metab. (2007) 27:1129–36. doi: 10.1038/sj.jcbfm.9600424
18. Sun PZ, Cheung JS, Wang E, Lo EH. Association between pH-weighted endogenous amide proton chemical exchange saturation transfer MRI and tissue lactic acidosis during acute ischemic stroke. J Cereb Blood Flow Metab. (2011) 31:1743–50. doi: 10.1038/jcbfm.2011.23
19. Zhao X, Wen Z, Huang F, Lu S, Wang X, Hu S, et al. Saturation power dependence of amide proton transfer image contrasts in human brain tumors and strokes at 3 T. Magn Reson Med. (2011) 66:1033–41. doi: 10.1002/mrm.22891
20. Tietze A, Blicher J, Mikkelsen IK, Østergaard L, Strother MK, Smith SA, et al. Assessment of ischemic penumbra in patients with hyperacute stroke using amide proton transfer (APT) chemical exchange saturation transfer (CEST) MRI. NMR Biomed. (2014) 27:163–74. doi: 10.1002/nbm.3048
21. Tee YK, Harston GW, Blockley N, Okell TW, Levman J, Sheerin F, et al. Comparing different analysis methods for quantifying the MRI amide proton transfer (APT) effect in hyperacute stroke patients. NMR Biomed. (2014) 27:1019–29. doi: 10.1002/nbm.3147
22. Harston GW, Tee YK, Blockley N, Okell TW, Thandeswaran S, Shaya G, et al. Identifying the ischaemic penumbra using pH-weighted magnetic resonance imaging. Brain (2015) 138:36–42. doi: 10.1093/brain/awu374
23. Li C, Peng S, Wang R, Chen H, Su W, Zhao X, et al. Chemical exchange saturation transfer MR imaging of Parkinson's disease at 3 Tesla. Eur Radiol. (2014) 24:2631–39. doi: 10.1007/s00330-014-3241-7
24. Wen Z, Hu S, Huang F, Wang X, Guo L, Quan X, et al. MR imaging of high-grade brain tumors using endogenous protein and peptide-based contrast. Neuroimage (2010) 51:616–22. doi: 10.1016/j.neuroimage.2010.02.050
25. Zhou J, Blakeley JO, Hua J, Kim M, Laterra J, Pomper MG, et al. Practical data acquisition method for human brain tumor amide proton transfer (APT) imaging. Magn Reson Med. (2008) 60:842–49. doi: 10.1002/mrm.21712
26. Zhang Y, Heo HY, Lee DH, Zhao X, Jiang S, Zhang K, et al. Selecting the reference image for registration of CEST series. J Magn Reson Imaging (2016) 43:756–61. doi: 10.1002/jmri.25027
27. Song G, Li C, Luo X, Zhao X, Zhang S, Zhang Y, et al. Evolution of cerebral ischemia assessed by amide proton transfer-weighted MRI. Front Neurol. (2017) 8:67. doi: 10.3389/fneur.2017.00067
28. Jiang S, Yu H, Wang X, Lu S, Li Y, Feng L, et al. Molecular MRI differentiation between primary central nervous system lymphomas and high-grade gliomas using endogenous protein-based amide proton transfer MR imaging at 3 Tesla. Eur Radiol. (2016) 26:64–71. doi: 10.1007/s00330-015-3805-1
29. Ling W, Regatte RR, Navon G, Jerschow A. Assessment of glycosaminoglycan concentration in vivo by chemical exchange-dependent saturation transfer (gagCEST). Proc Natl Acad Sci USA. (2008) 105:2266–70. doi: 10.1073/pnas.0707666105
30. Zhou J, Hong X, Zhao X, Gao JH, Yuan J. APT-weighted and NOE-weighted image contrasts in glioma with different RF saturation powers based on magnetization transfer ratio asymmetry analyses. Magn Reson Med. (2013) 70:320–7. doi: 10.1002/mrm.24784
31. Zhang H, Wang W, Jiang S, Zhang Y, Heo HY, Wang X, et al. Amide proton transfer-weighted MRI detection of traumatic brain injury in rats. J Cereb Blood Flow Metab. (2017) 37:3422–32. doi: 10.1177/0271678X17690165
32. Jiang S, Eberhart CG, Zhang Y, Heo HY, Wen Z, Blair L, et al. Amide proton transfer-weighted MR image-guided stereotactic biopsy in patients with newly diagnosed gliomas. Eur J Cancer (2017) 83:9–18. doi: 10.1016/j.ejca.2017.06.009
33. Jokivarsi KT, Gröhn HI, Gröhn OH, Kauppinen RA. Proton transfer ratio, lactate, and intracellular pH in acute cerebral ischemia. Magn Reson Med. (2007) 57:647–53. doi: 10.1002/mrm.21181
34. Jin T, Wang P, Zong X, Kim SG. Magnetic resonance imaging of the Amine-Proton EXchange (APEX) dependent contrast. Neuroimage (2012) 59:1218–27. doi: 10.1016/j.neuroimage.2011.08.014
35. Zong X, Wang P, Kim SG, Jin T. Sensitivity and source of amine-proton exchange and amide-proton transfer magnetic resonance imaging in cerebral ischemia. Magn Reson Med. (2014) 71:118–32. doi: 10.1002/mrm.24639
36. McVicar N, Li AX, Goncalves DF, Bellyou M, Meakin SO, Prado MA, et al. Quantitative tissue pH measurement during cerebral ischemia using amine and amide concentration-independent detection (AACID) with MRI. J Cereb Blood Flow Metab. (2014) 34:690–8. doi: 10.1038/jcbfm.2014.12
37. Kidwell CS. MRI biomarkers in acute ischemic stroke: a conceptual framework and historical analysis. Stroke (2013) 44:570–8. doi: 10.1161/STROKEAHA.111.626093
38. Zaiss M, Schmitt B, Bachert P. Quantitative separation of CEST effect from magnetization transfer and spillover effects by Lorentzian-line-fit analysis of z-spectra. J Magn Reson. (2011) 211:149–55. doi: 10.1016/j.jmr.2011.05.001
39. Zu Z, Janve VA, Xu J, Does MD, Gore JC, Gochberg DF. A new method for detecting exchanging amide protons using chemical exchange rotation transfer. Magn Reson Med. (2013) 69:637–47. doi: 10.1002/mrm.24284
40. Jin T, Wang P, Zong X, Kim SG. MR imaging of the amide-proton transfer effect and the pH-insensitive nuclear overhauser effect at 9.4 T. Magn Reson Med. (2013) 69:760–70. doi: 10.1002/mrm.24315
41. Heo H-Y, Zhang Y, Lee DH, Hong X, Zhou J. Quantitative assessment of amide proton transfer (APT) and nuclear Overhauser enhancement (NOE) imaging with extrapolated semi-solid magnetization transfer reference (EMR) signals: application to a rat glioma model at 4.7 Tesla. Magn Reson Med. (2016) 75:137–49. doi: 10.1002/mrm.25581
42. Heo HY, Zhang Y, Jiang S, Lee DH, Zhou J. Quantitative assessment of amide proton transfer (APT) and nuclear Overhauser enhancement (NOE) imaging with extrapolated semi-solid magnetization transfer reference (EMR) signals: II. Comparison of three EMR models and application to human brain glioma at 3 Tesla. Magn Reson Med. (2016) 75:1630–9. doi: 10.1002/mrm.25795
43. Chappell MA, Donahue MJ, Tee YK, Khrapitchev AA, Sibson NR, Jezzard P, et al. Quantitative Bayesian model-based analysis of amide proton transfer MRI. Magn Reson Med. (2013) 70:556–67. doi: 10.1002/mrm.24474
44. Heo HY, Zhang Y, Burton TM, Jiang S, Zhao Y, van Zijl PCM, et al. Improving the detection sensitivity of pH-weighted amide proton transfer MRI in acute stroke patients using extrapolated semisolid magnetization transfer reference signals. Magn Reson Med. (2017) 78:871–80. doi: 10.1002/mrm.26799
45. Zhou J, Wilson DA, Sun PZ, Klaus JA, Van Zijl PC. Quantitative description of proton exchange processes between water and endogenous and exogenous agents for WEX, CEST, and APT experiments. Magn Reson Med. (2004) 51:945–52. doi: 10.1002/mrm.20048
46. Lee DH, Heo HY, Zhang K, Zhang Y, Jiang S, Zhao X, et al. Quantitative assessment of the effects of water proton concentration and water T1 changes on amide proton transfer (APT) and nuclear overhauser enhancement (NOE) MRI: The origin of the APT imaging signal in brain tumor. Magn Reson Med. (2017) 77:855–63. doi: 10.1002/mrm.26131
47. Heo HY, Lee DH, Zhang Y, Zhao X, Jiang S, Chen M, et al. Insight into the quantitative metrics of chemical exchange saturation transfer (CEST) imaging. Magn Reson Med. (2017) 77:1853–65. doi: 10.1002/mrm.26264
48. Zu Z. Towards the complex dependence of MTR on T in amide proton transfer (APT) imaging. NMR Biomed. (2018) 31:e3934. doi: 10.1002/nbm.3934
49. Chopp M, Vande Linde AM, Chen H, Knight R, Helpern JA, Welch KM. Chronic cerebral intracellular alkalosis following forebrain ischemic insult in rats. Stroke (1990) 21:463–6. doi: 10.1161/01.STR.21.3.463
50. Back T, Hoehn M, Mies G, Busch E, Schmitz B, Kohno K, et al. Penumbral tissue alkalosis in focal cerebral ischemia: relationship to energy metabolism, blood flow, and steady potential. Ann Neurol. (2000) 47:485–92. doi: 10.1002/1531-8249(200004)47:4<485::AID-ANA12>3.0.CO;2-8
Keywords: ischemia, stroke, infarction, acidosis, magnetic resonance imaging, APT
Citation: Yu L, Chen Y, Chen M, Luo X, Jiang S, Zhang Y, Chen H, Gong T, Zhou J and Li C (2019) Amide Proton Transfer MRI Signal as a Surrogate Biomarker of Ischemic Stroke Recovery in Patients With Supportive Treatment. Front. Neurol. 10:104. doi: 10.3389/fneur.2019.00104
Received: 25 August 2018; Accepted: 25 January 2019;
Published: 22 February 2019.
Edited by:
Rick Dijkhuizen, University Medical Center Utrecht, NetherlandsReviewed by:
Paula Louise Croal, University of Oxford, United KingdomYee Kai Tee, Universiti Tunku Abdul Rahman, Malaysia
Copyright © 2019 Yu, Chen, Chen, Luo, Jiang, Zhang, Chen, Gong, Zhou and Li. This is an open-access article distributed under the terms of the Creative Commons Attribution License (CC BY). The use, distribution or reproduction in other forums is permitted, provided the original author(s) and the copyright owner(s) are credited and that the original publication in this journal is cited, in accordance with accepted academic practice. No use, distribution or reproduction is permitted which does not comply with these terms.
*Correspondence: Chunmei Li, YmVlOTAyMEAxMjYuY29t