 Muhammad E. Haque1*
 Refaat E. Gabr2
 Sarah D. George1
 Seth B. Boren1Farhaan S. Vahidy1Xu Zhang3
 Octavio D. Arevalo2
 Susan Alderman1
 Ponnada A. Narayana2
 Khader M. Hasan2Elliott R. Friedman2Clark W. Sitton2
 Sean I. Savitz1
- 1Institute for Stroke and Cerebrovascular Diseases, McGovern Medical School, The University of Texas Health Science Center at Houston, Houston, TX, United States
- 2Diagnostic and Interventional Imaging, McGovern Medical School, The University of Texas Health Science Center at Houston, Houston, TX, United States
- 3Biostatistics, Epidemiology, Research Design Component, Center for Clinical and Translational Sciences, McGovern Medical School, The University of Texas Health Science Center at Houston, Houston, TX, United States
Purpose: Cell-based therapy offers new opportunities for the development of novel treatments to promote tissue repair, functional restoration, and cerebral metabolic balance. N-acetylasperate (NAA), Choline (Cho), and Creatine (Cr) are three major metabolites seen on proton magnetic resonance spectroscopy (MRS) that play a vital role in balancing the biochemical processes and are suggested as markers of recovery. In this preliminary study, we serially monitored changes in these metabolites in ischemic stroke patients who were treated with autologous bone marrow-derived mononuclear cells (MNCs) using non-invasive MRS.
Materials and Methods: A sub-group of nine patients (3 male, 6 female) participated in a serial MRS study, as part of a clinical trial on autologous bone marrow cell therapy in acute ischemic stroke. Seven to ten million mononuclear cells were isolated from the patient's bone marrow and administered intravenously within 72 h of onset of injury. MRS data were obtained at 1, 3, and 6 months using a whole-body 3.0T MRI. Single voxel point-resolved spectroscopy (PRESS) was obtained within the lesion and contralesional gray matter. Spectral analysis was done using TARQUIN software and absolute concentration of NAA, Cho, and Cr was determined. National Institute of Health Stroke Scale (NIHSS) was serially recoreded. Two-way analysis of variance was performed and p < 0.05 considered statistically significant.
Results: All metabolites showed statistically significant or clear trends toward lower ipsilesional concentrations compared to the contralesional side at all time points. Statistically significant reductions were found in ipsilesional NAA at 1M and 3M, Cho at 6M, and Cr at 1M and 6M (p < 0.03), compared to the contralesional side. Temporally, ipsilesional NAA increased between 3M and 6M (p < 0.01). On the other hand, ipsilesional Cho showed continued decline till 6M (p < 0.01). Ipsilesional Cr was stable over time. Contralesional metabolites were relatively stable over time, with only Cr showing a reduction 3M (p < 0.02). There was a significant (p < 0.03) correlation between ipsilesional NAA and NIHSS at 3M follow-up.
Conclusion: Serial changes in metabolites suggest that MRS can be applied to monitor therapeutic changes. Post-treatment increasing trends of NAA concentration and significant correlation with NIHSS support a potential therapeutic effect.
Introduction
The only therapeutic options for patients with ischemic stroke are approaches that promote recanalization and reperfusion to restore blood flow to the brain. Currently, there are no effective post stroke interventions that can promote repair of damaged tissues and restore brain function. Cell based therapies offer great potential to promote possible repair of damaged tissue, prevent atrophy, and help restore brain function. Extensive animal data have shown the safety and feasibility of the bone marrow-derived mononuclear cells (MNCs) as an attractive therapeutic option for stroke (1–4). Significant physical and cognitive improvement was shown to occurs in animals treated with cell therapies by providing a protective mechanism to attenuate progressive tissue damage (5–8). Clinical trials have shown the feasibility and safety of both autologous and allogenic cell administration in stroke patients (9–13). An important advancement in this field would be to develop post-stroke therapeutic biomarkers.
Number of post-stroke magnetic resonance spectroscopy (MRS) studies have shown elevated lactate (Lac), decreased N-acetylaspartate (NAA) and Creatine (Cr), and variable changes in choline (Cho) concentration in the ipsilesional hemisphere (14–18). Restoration of these cerebral metabolites concentration could facilitate in the evaluation of recovery (19). NAA is synthesized in neurons and is crucial for cerebral lipid synthesis and energy production (20, 21). The cerebral Cr is associated with energy recycling via converting adenosine diphosphate (ADP) to ATP (22). Choline is involved in memory function and muscle control (23). These metabolites have been extensively used as surrogate markers of neuronal health (NAA), membrane integrity (Cho), cellular energy (Cr) and oxidative stress (Lac) (14, 16, 24–28).
The application of MRS to characterize neural progenitor cells (NPCs) in-vivo, which can differentiate into neurons, astrocytes, and oligodendrocytes, has been reported (29). Furthermore, two separate studies presented MRS as a tool for monitoring NPCs and human umbilical mesenchymal stem cells differentiation (30, 31). Number of in-vitro studies showed the ability of MRS to identify cell types based on their metabolic profile in the cell culture (31). Previously, Brazzini reported an increase in NAA concentration in both left and right basal ganglia in patients with Parkinson treated with bone marrow-derived autologous MNCs transplantation (32). Metabolic improvement was also documented in amyotrophic lateral sclerosis patients treated with stem cells (33).
In this prospective study, we serially monitored NAA, Cho, and Cr concentrations with MRS as possible therapeutic biomarkers following intravenous infusion of autologous MNCs in patients with acute ischemic stroke. Our findings in this preliminary study encourage pursuing a larger study that can be correlated with therapeutic efficacy to predict post-stroke recovery.
Materials and Methods
Human Protection
This study was conducted under Federal Investigational New Drug Application BB IND 13775 and was approved by the University of Texas Health Sciences Center at Houston Committee for the Protection of Human Subjects and by the Memorial Hermann Hospital Office of Research.
Patient Enrollment and Serial MRI
A sub-group of nine patients (3 males, 6 females) participated in this serial MRS study, which was an add-on scan to clinical trial testing autologous bone marrow mononuclear cells in patients with ischemic stroke. Written informed consent was obtained after a thorough discussion with the patient family prior to enrollment. The inclusion and exclusion criteria are described elsewhere (10). Post MNCs follow-up imaging was done at one (1M), three (3M), and six (6M) months of onset.
Intervention
Bone Marrow Cells Harvesting
The procedural details about mononuclear cells isolation and intravenous infusion are described elsewhere (10). Briefly, a total of 2 ml/kg bone marrow was harvested aseptically from the posterior iliac bone. All patients were placed in the prone position and a 11-gauge bone marrow needle was placed into the posterior iliac crest, and about 5 to 7 cc was aspirated with a 20-cc syringe and the procedure repeated. IV normal saline was administered if there were changes in the patient's hemodynamics, and all the patients were monitored for oxygen saturation, blood pressure, heart and respiratory rate before, during and after the procedure.
MNCs Isolation and Infusion
Bone marrow was transported in an anticoagulated blood collection bag for isolation and enrichment of the MNCs. The bone marrow was filtered (170-ml blood filter) to remove spicules. The MNCs were enriched from the bone marrow using Ficoll-Paque (GE Healthcare, Milwaukee, WI) and Plus density gradient separation using the density gradient procedure on the Sepax device (Biosafe SA, Geneva, Switzerland). The MNCs were then washed twice with 5% human serum albumin in normal saline and adjusted to the appropriate concentration for administration (final concentration of 1.25%). A maximum of 10 million cells/kg in normal saline was administered into the antecubital vein over 30 min. Cells Transplantation was done within 72 h from onset of the stroke.
Clinical Assessments
National Institutes of Health Stroke Scale (NIHSS) (34), modified Rankin scale (mRS), and Barthal Index (BI) were recorded at baseline and NIHSS at each follow-up visit.
Imaging Acquisition Protocols
All imaging experiments were performed on a whole body 3.0 T Philips system (Philips Healthcare, Best, The Netherlands) using 8-channel head coil. Structural MRI was obtained using 3D T1-weighted volumes (TE/TR = 3.66 ms/8.2 ms, acquisition matrix = 256 × 256 × 170, FOV = 256 × 256 mm2) and T2-weighted (TE/TR/ = 80 ms/2.5 s, acquisition matrix = 256 × 256 × 170, and FOV = 256 × 256 mm2) images. Anatomical localizations of the lesions were performed using 2D fluid-attenuated inversion recovery (FLAIR, TE/TI/TR = 95 ms/2.6 s/11 sec, acquisition matrix = 256 × 256, FOV = 256 × 256 mm2) images. Single voxel (SV) proton MRS was obtained with point-resolved spectroscopy (PRESS, voxel size 20 × 20 × 20 mm3 TE/TR = 35/2,000 ms, sampling frequency = 2,000 Hz, data points = 1,024, number of scans = 128) on both the ipsilesional and contralesional regions. Volumes of interest (VOIs) were carefully placed within the infarct and contralateral normal appearing gray matter tissue using FLAIR images. Standard 3-pulse chemical shift selective scheme was used for water suppression with automated shimming. Unsuppressed water spectra were also obtained as an internal reference for metabolite quantification. Saturation bands were placed around the VOI to minimize lipid contamination.
Spectral Analysis and Metabolite Quantification
All the spectral analysis were performed using publicly available Totally Automated Robust Quantitation in NMR (TARQUIN) software (35), available at https://www.nitrc.org/projects/tarquin/. Absolute concentration was calculated in milli-mole (mM) units by scaling the fitted signal amplitude by the amplitude of the unsuppressed water signal. A detailed description of the measurements are described elsewhere (36, 37). Metabolite peaks at 2.01, 3.03, 3.19 ppm were referenced to NAA, Cr, and Cho, respectively, with respect to unsuppressed water signal at 4.7 ppm. Typically metabolite concentrations are normalized to creatine or choline concentration assuming they were constant; here, we reported absolute concentrations because they were not constant.
Lesion Volume Measurements
A semi-automated seed growing algorithm within Analyze 12.0 (Analyze Direct Inc., KS, USA) was used to delineate lesion volume on T2-weighted images by a single rater. The rater selected two seed points within the hyper and hypointense regions within the lesions and a region-growing algorithm automatically expanded the seed points within the 3D space of the image. Manual editing of the lesion volume was done when necessary.
Statistical Analysis
Cerebral metabolites concentration was analyzed by the mixed model (38) The fixed effects in the model included brain hemisphere (ipsilesional and contralesional), polychotomous time (1, 3, and 6 month), and interaction between hemisphere and polychotomous time. The random effects in the model included patient and interaction between patient and hemisphere. These random effects led to a nested covariance matrix accounting for correlation of measurements due to the same patient and a different level of correlation for measurements due to the same hemisphere of brain. Correlation between cerebral metabolites concentrations and NIHSS scores was depicted in scatter plot, together with Pearson correlation coefficient. Two-sided p-values were reported and p-values less than 0.05 were considered as significant. All statistical analyses were performed using the SAS software (version 9.4, the SAS Institute, Cary, NC).
Results
After cellular intervention, six female and three male patients with average age of 56.5 ± 17.6 years (range 31–78 years) underwent serial metabolite measurements. Patient demographics and lesion laterality, size, location, and severity are summarized in Table 1. Patient P01 data were removed from spectroscopic measurement because of noisy spectra at two time points. The lesion size was 13.9–74.4 cc at 1M, and NIHSS was 5–34 at the onset. There was a significant (p < 0.03) decrease in lesion volume between 1 and 6 months.
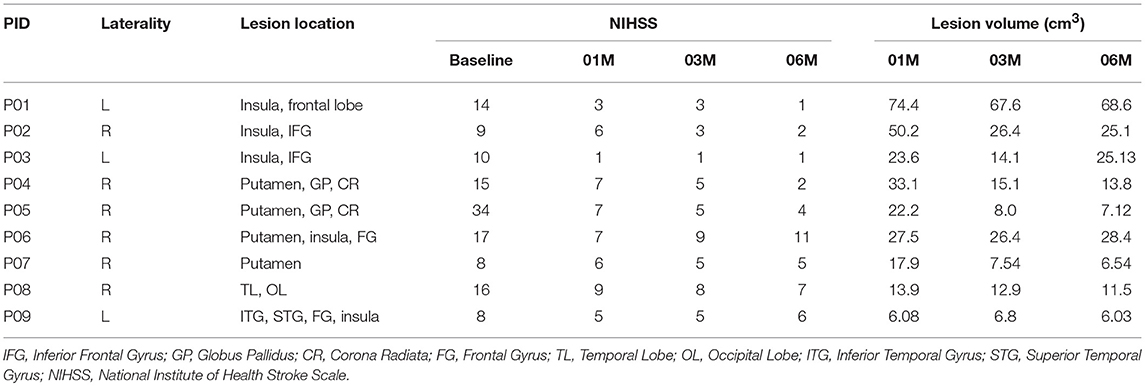
Table 1. Patient demographics, clinical score, and lesion volume.
Figure 1 shows a representative MRI of a patient illustrating typical MRS voxel placement in the lesion and contralateral tissue at the three follow-up scans, with their corresponding spectra below it. The contralateral voxel was placed on the normal appearing gray matter regions with some expected partial volume. Spectra were scaled and normalized to the unsuppressed water signal. As shown, the signal amplitude of NAA on the lesion spectra increased at 6 months as compared to 1 month, with minimal change in the contralateral NAA.
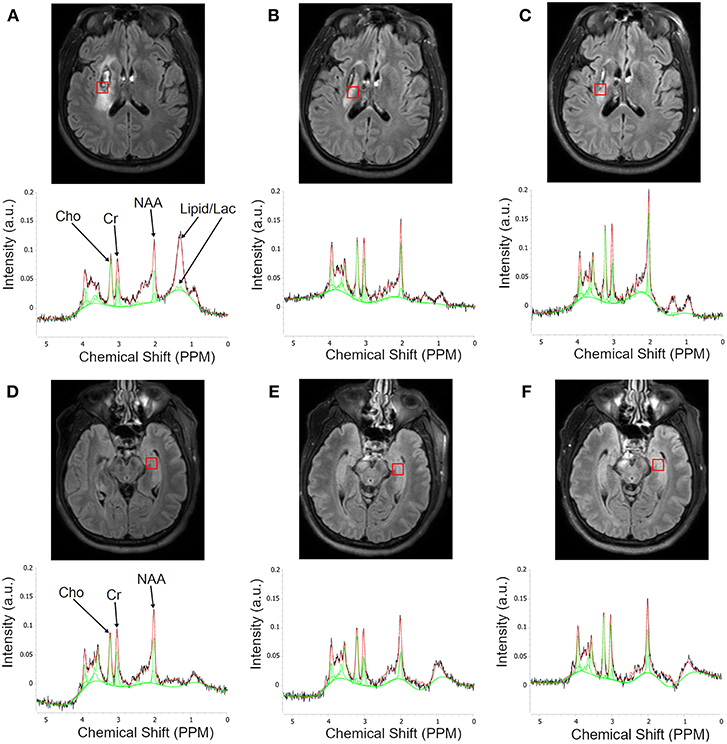
Figure 1. Serial Flair MR images illustrating typical MRS voxel placement in the lesion and contralateral tissues and corresponding MR spectra. The first row of images (A–C) is a single slice showing voxel placement in the lesion at 1, 3, and 6 months, respectively. The second row shows the corresponding spectra within the lesion. Each plot shows the raw spectrum (black), library spectra of matching metabolites (red), and fitted function (green). Third row (D–F) shows voxel placement in the contralesional gray matter with corresponding spectra in the fourth row. Note the questionable peak at 1.33 ppm at 1 month that disappears at the later time point.
Metabolite changes in individual participants and its average values over the study cohort are summarized in Figure 2. All three metabolites showed statistically significant or clear trends toward lower ipsilesional concentrations compared to the contralesional side at all time points. Statistically significant reductions were found in ipsilesional NAA at 1M and 3M, Cho at 6M, and Cr at 1M and 6M (p < 0.03), compared to the contralesional side.
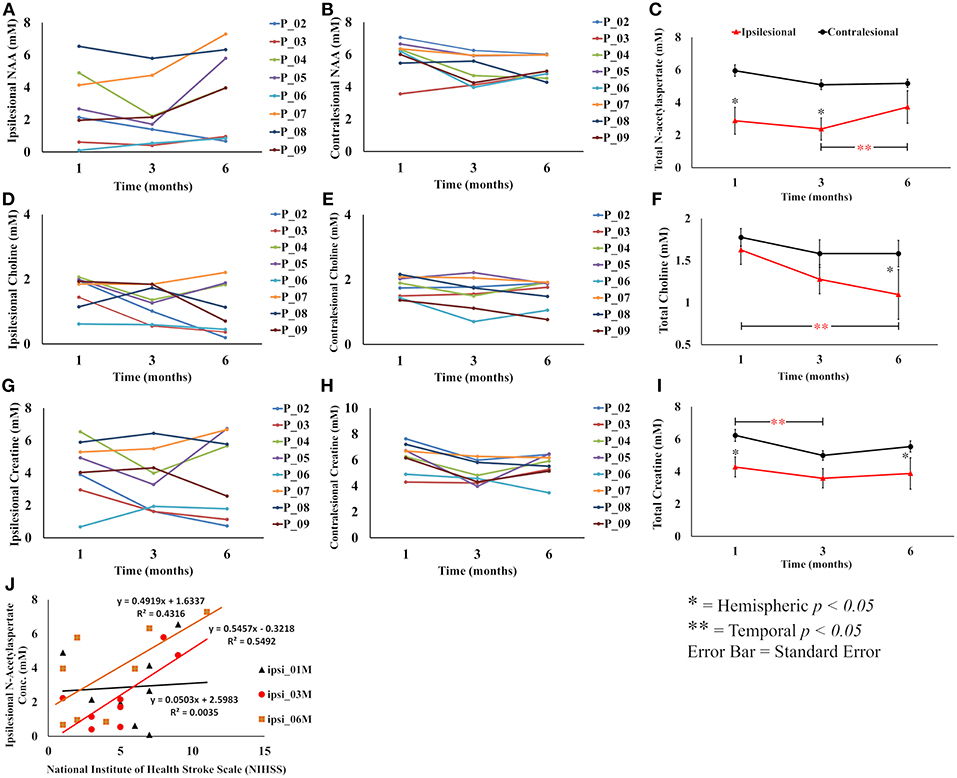
Figure 2. Overall summary of post treatment serial change in metabolite concentration in the lesion and contralesion voxels. (A,B) Show serial ipsilesional and contralesional NAA concentrations in individual participants, respectively. (C) Shows overall trend of significant hemispheric decrease of NAA concentration between 1 and 3 months. Temporally, ipsilesional NAA increased between 3 and 6 months. (D,E) Show serial ipsilesional and contralesional choline concentrations in individual participants, respectively. (F) Shows an overall significant continual decline of ipsilesional choline concentration between 1 and 6 months, whereas in the contralesion it decreased between 1 and 3 months and then stabilized between 3 and 6 months. (G,H) Show serial ipsilesional and contralesional creatine concentrations in individual participants, respectively. (I) Illustrates the overall hemispheric and temporal decrease of creatine concentration between 1 and 3 months that stabilized between 3 and 6 months. A correlation between ipsilesional NAA concentration and NIHSS at 1, 3, and 6 months is shown in (J). A significant (p < 0.03) correlation was observed at 3 months.
The temporal NAA concentration within the lesion showed an initial decreasing trend between 1 and 3 months (2.88 ± 2.1 to 2.37 ± 1.9 mM, p = 0.24) followed by an increase between 3 and 6 (2.37 ± 1.9 to 3.72 ± 2.6 mM, p < 0.01) months. The contralesional NAA also showed a strong trend toward lower concentration between 1 and 3 months (5.95 ± 1.0 to 5.09 ± 0.93 mM, p < 0.053), but stabilized between 3 and 6 months (5.09 ± 0.93 to 5.17 ± 0.70 mM, p = NS). Post graft Cho concentration in the lesion showed a continuing trend for reduction, which reached statistical significance at 6 months (1.62 ± 0.51 to 1.09 ± 0.78 mM, p < 0.01), while contralesional measurements revealed a decreasing trend between 1 and 3 months (1.77 ± 0.31 to 1.58 ± 0.49 mM, p = NS) that stabilized through 6 months (1.58 ± 0.44 mM). Ipsilesional Cr was stable over the study period, but contralesional Cr reduced between 1 and 3 month (6.23 ± 1.12 to 4.99 ± 0.89 mM, p < 0.02).
Ipsilesional NAA concentration and NIHSS score were significantly correlated (p < 0.05) at 3 month follow-up and almost reached statistical significance at 6 months (p = 0.07), but no correlation was found at 1 month as shown in Figure 2J. There was no statistically significant correlation between Cho, Cr, and NIHSS in either ipsi or contralesional hemisphere. There was no significant correlation between lesion volume change and metabolite concentrations.
Discussion
A handful of clinical trials have shown safety and feasibility of cell administration as an exploratory new therapeutic option in patients with recent ischemic stroke; however, to the best of our knowledge, this is the first prospective study in which patient's cerebral metabolites were serially measured over 6 months after the cellular intervention.
Our finding is in-line with an animal study reporting a significant increase in NAA/Cr and NAA/Cho ratios within the lesion in treated animals with gadolinium labeled mesenchymal stem cells compared to the sham group (39). In another animal study, Qian reported an initial decrease followed by an increase in ipsilesional NAA concentrations without any treatment after inducing transient ischemic stroke (TIA). However, unlike the permanent stroke model, both the lesions and symptoms resolve within a few hours of onset in most patients with TIA (40).
The correlation between the NAA and NIHSS is in support of the previous study (19) suggesting NAA as a marker of therapeutic efficacy. However, the small sample size is the major limitation of our study. Interestingly the decreasing trends of all three metabolites concentrations in the contralesional measurement suggest global depletion of available energy which is supported by a decrease in Cr concentration which is considered a marker of neuronal energy.
Prior studies investigated brain metabolites as a marker of post-stroke recovery especially NAA because it is exclusively found within neurons. A reduction in NAA in the ipsilesional hemisphere has been associated with continued neuronal death and expansion of the infarct (41–43). A continued decline in NAA concentration within the lesion or other ipsilesional tissues at 1, 3, and 6 months has been documented, with few exceptions (44–46). Contrary to the literature, our preliminary results show a trend of regaining NAA concentrations within the lesion between 3 and 6 months following MNC infusion. This is in agreement with a previous study in patients with Parkinson disease who were also treated with MNCs, which reported an increase in NAA in the basal ganglia. Here we found increased NAA within the lesion.
We also noted that most of the patients had one or two broad peaks between 0.9 and 1.5 ppm, resonance regions of lipid and lactate, in the ipsilesional voxel at 1 month (Figure 1) suggesting possible hypoxic environment or cells proliferation which resolved at later follow-up visits. Interestingly, there was no peak between 0.9 and 1.5 ppm in the contralesional voxel. Further investigation of this finding requires a non-treated matching control patients as a control group.
A higher choline concentration around the penumbra region in acute phase has been documented (47). Here we observed a decreasing trend of choline concentration in both ipsilesional and contralesional measurement between 1 and 3 months. While the choline signal stabilized in the contralesional side, it continued to decrease in the lesion suggestion progressive membrane disintegration. The opposite trend between NAA (increasing) and Cho (decreasing) between 3 and 6 months in the lesion could be due to a higher number of immature neurons without membrane, which is typically developed at the final stages of neuronal maturation. However, we will investigate this hypothesis in future animal study combining MRS and histology.
Study Limitation
The limitations of this exploratory pilot study included the small sample size, the absence of non-treated patient group, the limited coverage of single voxel spectroscopy, and known partial volume effects. Future studies will address these limitations by increasing sample size, adding non-treated patients group and obtaining multi-voxel MRS.
Conclusion
Our study supports using MRS as an innovative means to evaluate treatment efficacies by quantifying lesion metabolites. In this preliminary study we observed signals of a slow treatment effect, regain in NAA concentrations in a damaged tissue area, and patients with increased NAA recovering better on clinical deficits scores.
Author Contributions
MH designed the study, carried MRI quantitative analysis, and drafted the manuscript. RG contributed to data analysis, assisted in optimizing MRI acquisition. SG and SB created plots and figures. SA and FV recruited, consented, and obtained patient's serial neurological assessment. XZ performed statistical analysis. KH and PN provided qualitative and quantitative quality assurance of images and data analysis. OA, EF, and CS provided radiology reports and assisted in lesion locations. SS supervised the study and provided necessary resources. All authors contributed to and approved the final manuscript.
Funding
This work was funded by the National Institutes of Health (NIH/NINDS 1R21HD060978-01A1).
Conflict of Interest Statement
The authors declare that the research was conducted in the absence of any commercial or financial relationships that could be construed as a potential conflict of interest.
Acknowledgments
We wish to thank Mr. Vipulkumar Patel and Dr. Kasam Mallikarjunarao for helping in data acquisition and management.
References
1. Kamiya N, Ueda M, Igarashi H, Nishiyama Y, Suda S, Inaba T, et al. Intra-arterial transplantation of bone marrow mononuclear cells immediately after reperfusion decreases brain injury after focal ischemia in rats. Life Sci. (2008) 83:433–7. doi: 10.1016/j.lfs.2008.07.018
2. Shichinohe H, Kuroda S, Maruichi K, Osanai T, Sugiyama T, Chiba Y, et al. Bone marrow stromal cells and bone marrow-derived mononuclear cells: which are suitable as cell source of transplantation for mice infarct brain? Neuropathology (2010) 30:113–22. doi: 10.1111/j.1440-1789.2009.01050.x
3. Vasconcelos-Dos-Santos A, Rosado-De-Castro PH, Lopes De Souza SA, Da Costa Silva J, Ramos AB, Rodriguez De Freitas G, et al. Intravenous and intra-arterial administration of bone marrow mononuclear cells after focal cerebral ischemia: Is there a difference in biodistribution and efficacy? Stem Cell Res. (2012) 9:1–8. doi: 10.1016/j.scr.2012.02.002
4. Yang B, Li W, Satani N, Nghiem DM, Xi X, Aronowski J, et al. Protective effects of autologous bone marrow mononuclear cells after administering t-PA in an embolic stroke model. Transl Stroke Res. (2018) 9:135–45. doi: 10.1007/s12975-017-0563-1
5. Bjorklund A, Lindvall O. Cell replacement therapies for central nervous system disorders. Nat Neurosci. (2000) 3:537–44. doi: 10.1038/75705
6. Honma T, Honmou O, Iihoshi S, Harada K, Houkin K, Hamada H, et al. Intravenous infusion of immortalized human mesenchymal stem cells protects against injury in a cerebral ischemia model in adult rat. Exp Neurol. (2006) 199:56–66. doi: 10.1016/j.expneurol.2005.05.004
7. Gao Q, Li Y, Shen L, Zhang J, Zheng X, Qu R, et al. Bone marrow stromal cells reduce ischemia-induced astrocytic activation in vitro. Neuroscience (2008) 152:646–55. doi: 10.1016/j.neuroscience.2007.10.069
8. Sammali E, Alia C, Vegliante G, Colombo V, Giordano N, Pischiutta F, et al. Intravenous infusion of human bone marrow mesenchymal stromal cells promotes functional recovery and neuroplasticity after ischemic stroke in mice. Sci Rep. (2017) 7:6962. doi: 10.1038/s41598-017-07274-w
9. Kondziolka D, Steinberg GK, Wechsler L, Meltzer CC, Elder E, Gebel J, et al. Neurotransplantation for patients with subcortical motor stroke: a phase 2 randomized trial. J Neurosurg. (2005) 103:38–45. doi: 10.3171/jns.2005.103.1.0038
10. Savitz SI, Misra V, Kasam M, Juneja H, Cox CS Jr, Alderman S, et al. Intravenous autologous bone marrow mononuclear cells for ischemic stroke. Ann Neurol. (2011) 70:59–69. doi: 10.1002/ana.22458
11. Bhasin A, Srivastava MV, Mohanty S, Bhatia R, Kumaran SS, Bose S. Stem cell therapy: a clinical trial of stroke. Clin Neurol Neurosurg. (2013) 115:1003–8. doi: 10.1016/j.clineuro.2012.10.015
12. Steinberg GK, Kondziolka D, Wechsler LR, Lunsford LD, Coburn ML, Billigen JB, et al. Clinical outcomes of transplanted modified bone marrow-derived mesenchymal stem cells in stroke: a phase 1/2a study. Stroke (2016) 47:1817–24. doi: 10.1161/STROKEAHA.116.012995
13. Hess DC, Wechsler LR, Clark WM, Savitz SI, Ford GA, Chiu D, et al. Safety and efficacy of multipotent adult progenitor cells in acute ischaemic stroke (MASTERS): a randomised, double-blind, placebo-controlled, phase 2 trial. Lancet Neurol. (2017) 16:360–8. doi: 10.1016/S1474-4422(17)30046-7
14. Felber SR, Luef GJ, Birbamer GG, Aichner FT, Gerstenbrand F. Magnetic resonance studies in stroke. Lancet (1992) 339:879–80. doi: 10.1016/0140-6736(92)90328-Z
15. Ford CC, Griffey RH, Matwiyoff NA, Rosenberg GA. Multivoxel 1H-MRS of stroke. Neurology (1992) 42:1408–12. doi: 10.1212/WNL.42.7.1408
16. Kang DW, Roh JK, Lee YS, Song IC, Yoon BW, Chang KH. Neuronal metabolic changes in the cortical region after subcortical infarction: a proton MR spectroscopy study. J Neurol Neurosurg Psychiatr. (2000) 69:222–7. doi: 10.1136/jnnp.69.2.222
17. Kobayashi M, Takayama H, Suga S, Mihara B. Longitudinal changes of metabolites in frontal lobes after hemorrhagic stroke of basal ganglia: a proton magnetic resonance spectroscopy study. Stroke (2001) 32:2237–45. doi: 10.1161/hs1001.096621
18. Munoz Maniega S, Cvoro V, Chappell FM, Armitage PA, Marshall I, Bastin ME, et al. Changes in NAA and lactate following ischemic stroke: a serial MR spectroscopic imaging study. Neurology (2008) 71:1993–9. doi: 10.1212/01.wnl.0000336970.85817.4a
19. Bivard A, Yassi N, Krishnamurthy V, Lin L, Levi C, Spratt NJ, et al. A comprehensive analysis of metabolic changes in the salvaged penumbra. Neuroradiology (2016) 58:409–15. doi: 10.1007/s00234-015-1638-x
20. Madhavarao CN, Namboodiri AM. NAA synthesis and functional roles. Adv Exp Med Biol. (2006) 576:49–66. Discussion: 361–3. doi: 10.1007/0-387-30172-0_4
21. Rigotti DJ, Inglese M, Babb JS, Rovaris M, Benedetti B, Filippi M, et al. Serial whole-brain N-acetylaspartate concentration in healthy young adults. AJNR Am J Neuroradiol. (2007) 28:1650–1. doi: 10.3174/ajnr.A0712
22. Rackayova V, Cudalbu C, Pouwels PJW, Braissant O. Creatine in the central nervous system: from magnetic resonance spectroscopy to creatine deficiencies. Anal Biochem. (2017) 529:144–57. doi: 10.1016/j.ab.2016.11.007
23. Prado MA, Reis RA, Prado VF, De Mello MC, Gomez MV, De Mello FG. Regulation of acetylcholine synthesis and storage. Neurochem Int. (2002) 41:291–9. doi: 10.1016/S0197-0186(02)00044-X
24. Fenstermacher MJ, Narayana PA. Serial proton magnetic resonance spectroscopy of ischemic brain injury in humans. Invest Radiol. (1990) 25:1034–9. doi: 10.1097/00004424-199009000-00016
25. Felber SR, Aichner FT, Sauter R, Gerstenbrand F. Combined magnetic resonance imaging and proton magnetic resonance spectroscopy of patients with acute stroke. Stroke (1992) 23:1106–10. doi: 10.1161/01.STR.23.8.1106
26. Graham GD, Blamire AM, Howseman AM, Rothman DL, Fayad PB, Brass LM, et al. Proton magnetic resonance spectroscopy of cerebral lactate and other metabolites in stroke patients. Stroke (1992) 23:333–40. doi: 10.1161/01.STR.23.3.333
27. Kamada K, Houkin K, Iwasaki Y, Abe H, Kashiwaba T. Metabolic and neurological patterns in chronic cerebral infarction: a single-voxel 1H-MR spectroscopy study. Neuroradiology (1997) 39:560–5. doi: 10.1007/s002340050467
28. Saunders DE. MR spectroscopy in stroke. Br Med Bull. (2000) 56:334–45. doi: 10.1258/0007142001903256
29. Manganas LN, Zhang X, Li Y, Hazel RD, Smith SD, Wagshul ME, et al. Magnetic resonance spectroscopy identifies neural progenitor cells in the live human brain. Science (2007) 318:980–5. doi: 10.1126/science.1147851
30. Xu ZF, Pan AZ, Yong F, Shen CY, Chen YW, Wu RH. Human umbilical mesenchymal stem cell and its adipogenic differentiation: profiling by nuclear magnetic resonance spectroscopy. World J Stem Cells (2012) 4:21–7. doi: 10.4252/wjsc.v4.i4.21
31. Chung YL, El Akabawy G, So PW, Solanky BS, Leach MO, Modo M. Profiling metabolite changes in the neuronal differentiation of human striatal neural stem cells using 1H-magnetic resonance spectroscopy. Neuroreport (2013) 24:1035–40. doi: 10.1097/WNR.0000000000000056
32. Brazzini A, Cantella R, De La Cruz A, Yupanqui J, Leon C, Jorquiera T, et al. Intraarterial autologous implantation of adult stem cells for patients with Parkinson disease. J Vasc Interv Radiol. (2010) 21:443–51. doi: 10.1016/j.jvir.2010.01.008
33. Garcia Santos JM, Inuggi A, Gomez Espuch J, Vazquez C, Iniesta F, Blanquer M, et al. Spinal cord infusion of stem cells in amyotrophic lateral sclerosis: magnetic resonance spectroscopy shows metabolite improvement in the precentral gyrus. Cytotherapy (2016) 18:785–96. doi: 10.1016/j.jcyt.2016.03.296
34. Brott T, Adams HP Jr, Olinger CP, Marler JR, Barsan WG, Biller J, et al. Measurements of acute cerebral infarction: a clinical examination scale. Stroke (1989) 20:864–70. doi: 10.1161/01.STR.20.7.864
35. Wilson M, Reynolds G, Kauppinen RA, Arvanitis TN, Peet AC. A constrained least-squares approach to the automated quantitation of in vivo (1)H magnetic resonance spectroscopy data. Magn Reson Med. (2011) 65:1–12. doi: 10.1002/mrm.22579
36. Ernst T, Lee JH, Ross BD. Direct 31P imaging in human limb and brain. J Comput Assist Tomogr. (1993) 17:673–80. doi: 10.1097/00004728-199309000-00001
37. Kreis R, Ernst T, Ross BD. Development of the human brain: in vivo quantification of metabolite and water content with proton magnetic resonance spectroscopy. Magn Reson Med. (1993) 30:424–37. doi: 10.1002/mrm.1910300405
38. Littell RC, Henry PR, Ammerman CB. Statistical analysis of repeated measures data using SAS procedures. J Anim Sci. (1998) 76:1216–31. doi: 10.2527/1998.7641216x
39. Shyu WC, Chen CP, Lin SZ, Lee YJ, Li H. Efficient tracking of non-iron-labeled mesenchymal stem cells with serial MRI in chronic stroke rats. Stroke (2007) 38:367–74. doi: 10.1161/01.STR.0000254463.24655.14
40. Qian J, Qian B, Lei H. Reversible loss of N-acetylaspartate after 15-min transient middle cerebral artery occlusion in rat: a longitudinal study with in vivo proton magnetic resonance spectroscopy. Neurochem Res. (2013) 38:208–17. doi: 10.1007/s11064-012-0910-2
41. Petroff OA, Graham GD, Blamire AM, Al-Rayess M, Rothman DL, Fayad PB, et al. Spectroscopic imaging of stroke in humans: histopathology correlates of spectral changes. Neurology (1992) 42:1349–54. doi: 10.1212/WNL.42.7.1349
42. Demougeot C, Marie C, Giroud M, Beley A. N-acetylaspartate: a literature review of animal research on brain ischaemia. J Neurochem. (2004) 90:776–83. doi: 10.1111/j.1471-4159.2004.02583.x
43. Glodzik-Sobanska L, Slowik A, Kieltyka A, Kozub J, Sobiecka B, Urbanik A, et al. Reduced prefrontal N-acetylaspartate in stroke patients with apathy. J Neurol Sci. (2005) 238:19–24. doi: 10.1016/j.jns.2005.06.004
44. Houkin K, Kamada K, Kamiyama H, Iwasaki Y, Abe H, Kashiwaba T. Longitudinal changes in proton magnetic resonance spectroscopy in cerebral infarction. Stroke (1993) 24:1316–21. doi: 10.1161/01.STR.24.9.1316
45. Wardlaw JM, Marshall I, Wild J, Dennis MS, Cannon J, Lewis SC. Studies of acute ischemic stroke with proton magnetic resonance spectroscopy: relation between time from onset, neurological deficit, metabolite abnormalities in the infarct, blood flow, and clinical outcome. Stroke (1998) 29:1618–24. doi: 10.1161/01.STR.29.8.1618
46. Cirstea CM, Brooks WM, Craciunas SC, Popescu EA, Choi IY, Lee P, et al. Primary motor cortex in stroke: a functional MRI-guided proton MR spectroscopic study. Stroke (2011) 42:1004–9. doi: 10.1161/STROKEAHA.110.601047
Keywords: autologous mononuclear cells transplantation, cells therapy, ischemic stroke, cerebral metabolites, magnetic resonance spectroscopy
Citation: Haque ME, Gabr RE, George SD, Boren SB, Vahidy FS, Zhang X, Arevalo OD, Alderman S, Narayana PA, Hasan KM, Friedman ER, Sitton CW and Savitz SI (2019) Serial Cerebral Metabolic Changes in Patients With Ischemic Stroke Treated With Autologous Bone Marrow Derived Mononuclear Cells. Front. Neurol. 10:141. doi: 10.3389/fneur.2019.00141
Received: 06 December 2018; Accepted: 04 February 2019;
Published: 25 February 2019.
Edited by:
Johannes Boltze, Fraunhofer-Institut für Zelltherapie und Immunologie (IZI), GermanyReviewed by:
Christopher G. Sobey, La Trobe University, AustraliaTracy D. Farr, University of Nottingham, United Kingdom
Copyright © 2019 Haque, Gabr, George, Boren, Vahidy, Zhang, Arevalo, Alderman, Narayana, Hasan, Friedman, Sitton and Savitz. This is an open-access article distributed under the terms of the Creative Commons Attribution License (CC BY). The use, distribution or reproduction in other forums is permitted, provided the original author(s) and the copyright owner(s) are credited and that the original publication in this journal is cited, in accordance with accepted academic practice. No use, distribution or reproduction is permitted which does not comply with these terms.
*Correspondence: Muhammad E. Haque, bXVoYW1tYWQuZS5oYXF1ZUB1dGgudG1jLmVkdQ==