 Anna Campabadal1
 Barbara Segura1,2
 Carme Junque1,2,3*
 Monica Serradell4
 Alexandra Abos1
 Carme Uribe1
 Hugo C. Baggio1Carles Gaig2,4Joan Santamaria2,4Yaroslau Compta2,3,5
 Nuria Bargallo6
 Alex Iranzo2,4
- 1Medical Psychology Unit, Department of Medicine, Institute of Neuroscience, University of Barcelona, Barcelona, Spain
- 2Centro de Investigación Biomédica en Red sobre Enfermedades Neurodegenerativas (CIBERNED), Hospital Clínic de Barcelona, Barcelona, Spain
- 3Neuropsychology Group, Clinical and Experimental Neuroscience, Institute of Biomedical Research August Pi i Sunyer, Barcelona, Spain
- 4Multidisciplinary Sleep Unit, Hospital Clínic, Barcelona, Spain
- 5Movement Disorders Unit, Neurology Service, Institute of Neuroscience, Hospital Clínic de Barcelona, University of Barcelona, Barcelona, Spain
- 6Centre de Diagnòstic per la Imatge, Hospital Clínic, Barcelona, Spain
Objective: In this study we investigate cortical and subcortical gray matter structure in patients with Idiopathic REM-sleep behavior disorder (IRBD), and their relation to cognitive performance.
Methods: This study includes a sample of 20 patients with polysomnography-confirmed IRBD and 27 healthy controls that underwent neuropsychological and T1-weighted MRI assessment. FreeSurfer was used to estimate cortical thickness, subcortical volumetry (version 5.1), and hippocampal subfields segmentation (version 6.0). FIRST, FSL's model-based segmentation/registration tool was used for hippocampal shape analysis.
Results: Compared with healthy subjects, IRBD patients showed impairment in facial recognition, verbal memory, processing speed, attention, and verbal naming. IRBD patients had cortical thinning in left superior parietal, post-central, and fusiform regions, as well as in right superior frontal and lateral occipital regions. Volumetric and shape analyses found right hippocampal atrophy in IRBD, specifically in posterior regions. Hippocampal subfields exploratory analysis identified significant differences in the right CA1, molecular layer, granule cell layer of dentate gyrus, and CA4 of this patients. No correlations were found between cognitive performance and brain atrophy.
Conclusion: This work confirms the presence of posterior based cognitive dysfunction, as well as cortical and right hippocampal atrophy in IRBD patients.
Introduction
Rapid eye movement (REM) sleep behavior disorder (RBD) is a parasomnia characterized by abnormal motor and vocal behaviors associated with unpleasant dreams and increased electromyographic activity during REM sleep (1). Polysomnography with audiovisual recording is needed to confirm the diagnosis of RBD and to exclude other sleep disorders that can mimic its symptoms, including obstructive sleep apnea, nocturnal hallucinations, and confusional arousals (2).
Over the past years, the idiopathic form of RBD (IRBD) has been increasingly recognized as a prodromal phase of some neurodegenerative diseases, mainly of alpha-synucleinopathies such as dementia with Lewy bodies (DLB), Parkinson's disease (PD), and multiple system atrophy (3, 4). The risk for IRBD patients of eventually developing a neurodegenerative disease increases with time (3, 5). IRBD is by far the strongest and most specific clinical predictor of neurodegenerative disease available (6). Therefore, there is growing interest in describing neuroimaging and cognitive biomarkers of brain neurodegeneration in this prodromal disorder.
With an estimated prevalence of 50%, cognitive impairment is frequently present in IRBD patients (7), affecting manly attention, verbal memory, visuospatial, and executive domains (8). Furthermore, previous works demonstrated cognitive decline in attention and executive functions strongly predict conversion to DLB in IRBD patients (9).
Structural brain imaging techniques have been used to investigate neurodegenerative changes in IRBD. Previous works using diffusion-tensor imaging showed that IRBD patients had decreased fractional anisotropy in the tegmentum of the midbrain, increased mean diffusivity in the pontine reticular formation (10), and microstructural changes in widespread areas including brainstem, substantia nigra, temporal lobe, and visual stream (11). Voxel-based morphometry (VBM) studies revealed that IRBD patients had gray matter volume reduction in the superior frontal sulcus (12), anterior cingulate gyrus, caudate nucleus (13), anterior lobes of the cerebellum, tegmental portion of the pons, and parahippocampal gyrus (14). Studies addressing cortical thickness, in turn, have reported thinning in the frontal cortex, lingual gyrus, and fusiform gyrus (12), as well in medial superior frontal, orbitofrontal, anterior cingulate cortices, and dorsolateral primary motor cortex (13).
In the current work, we aimed to investigate [1] cognitive impairment in a sample of IRBD patients compared to healthy controls, [2] MRI gray matter changes and [3] correlation between cognitive impairment and cortical and subcortical atrophy.
Methods
Participants
Twenty patients with IRBD without cognitive or motor complaints at the time of diagnosis were recruited from our multidisciplinary sleep unit. Diagnosis of IRBD required a history of dream-enacting behaviors, video-polysomnographic demonstration of REM sleep without atonia and absence of other neurological diseases (15, 16). Twenty-seven healthy subjects without cognitive, motor, or sleep complaints were recruited from the Institut de l'Envelliment (Barcelona, Spain).
Exclusion criteria consisted of: [1] Presence of psychiatric and/or neurologic comorbidity, [2] low global IQ score estimated by the Vocabulary subtest of the Wechsler Adult Intelligence Scale, 3rd edition (scalar score ≤7 points), [3] MMSE score <25, [4] claustrophobia, [5] MRI movement artifacts, and [6] no evidence in HC of sleep disorders or mild cognitive impairment.
The study was approved by the Ethics Committee of the University of Barcelona (IRB00003099) and Hospital Clinic (HCB/2014/0224). All subjects provided written informed consent to participate after full explanation of the procedures involved.
Neuropsychological and Clinical Assessment
Participants were evaluated with a neuropsychological battery assessing the main cognitive domains impaired in alpha-synuclein-related neurodegenerative diseases. Attention and working memory were assessed with the Trail Making Test (TMT, parts A and B) (in seconds), Digit Span Forward and Backward, the Stroop Color-word Test, and the Symbol Digits Modalities Test (SDMT)-Oral version. Executive functions were evaluated with phonemic (words beginning with the letter “p” in 1 min) and semantic (animals in 1 min) fluencies. Language was assessed by the total number of correct responses in the short version of the Boston Naming Test (BNT). In the memory domain, we assessed total learning recall (sum of correct responses from trial I to trial V), delayed recall (total recall after 20 min), and recognition abilities using Rey's Auditory Verbal Learning Test (RAVLT total, RAVLT recall, and RAVLT recognition, respectively). Visuospatial and visuoperceptual functions were assessed with Benton's Judgement of Line Orientation (JLO), Visual Form Discrimination (VFD), and Facial Recognition (FRT) tests (17). Expected z scores adjusted for age, sex, and education for each test and each subject were calculated based on a multiple regression analysis performed in the HC group (18).
Beck Depression Inventory II (19), Starkstein's Apathy Scale (20), and the Neuropsychiatric Inventory (NPI) (21) were used to assess neuropsychiatric symptomatology.
MRI Acquisition
MRI data were acquired with a 3T scanner (MAGNETOM Trio, Siemens, Germany). The scanning protocol included high-resolution 3-dimensional T1-weighted images acquired in the sagittal plane (TR = 2,300 ms, TE = 2.98 ms, TI = 900 ms, 240 slices, FOV = 256 mm; 1 mm isotropic voxel) and an axial FLAIR sequence (TR = 9,000 ms, TE = 96 ms).
MRI Preprocessing and Cortical Thickness Analysis
FreeSurfer software was used to estimate cortical thickness. This study sample is part of an extensive cohort recruited since 2010, for that reason T1-weighted images were preprocessed with the FreeSurfer 5.1 version (available at https://surfer.nmr.mgh.harvard.edu/ since 2011). The 3D cortical surface model used in this estimation is created using intensity and continuity information, as described in detail by the authors (22). Independent steps are performed in the initial preprocessing of images for each subject: removal of non-brain tissue, automated Talairach transformation, intensity normalization (23), tessellation of the gray matter/white matter boundary, automated topology correction (24), and accurate surface deformation to optimally place the gray matter/white matter and gray matter/cerebrospinal fluid (CSF) boundaries (22). The resulting representation of cortical thickness is calculated as the distance between white and gray matter surfaces at each vertex of the reconstructed cortical mantle (23). In our study, results for each subject were carefully inspected visually to ensure accuracy of registration, skull stripping, segmentation, and cortical surface reconstruction. Cortical thickness maps were smoothed using a circularly symmetric Gaussian kernel across the surface with a full width at half maximum (FWHM) of 15 mm.
Comparisons between groups were assessed using a vertex-by-vertex general linear model introducing age as a covariate (FreeSurfer 5.1). A subsequent analysis introducing both age and sex as covariates was computed. Vertex-wise correlations between cortical thickness and cognitive measures were computed in the IRBD group. In order to avoid clusters appearing significant purely by chance (i.e., false positives), Monte Carlo Null-Z Simulation with 10,000 iterations was applied to cortical thickness maps to provide clusterwise correction for multiple comparisons; results were thresholded at a corrected p-value of 0.05 (25).
Subcortical Segmentation
Automated subcortical segmentation performed with FreeSurfer (version 5.1) was used to estimate subcortical volumetry. Estimated Total Intracranial Volume (eTIV) was obtained to correct volumetric data for inter-individual differences in head sizes.
Hippocampal Shape Analysis
FIRST, FSL's model-based segmentation/registration tool was used for hippocampal shape analysis (https://fsl.fmrib.ox.ac.uk/fsl/fslwiki/FIRST) (26). Segmentation of both hippocampi with automated boundary correction were generated. We then used first-utils to run a vertex-wise analysis on the results. FSL's Randomize script (27, 28) with 5,000 random permutations of the data was used to study inter-group differences. ETIV was estimated with FSL according to ENIGMA's imaging protocol (http://enigma.usc.edu/). Age and eTIV were introduced as covariates in the analyses. A subsequent analysis introducing both age and sex as covariates was computed. All results were thresholded at p < 0.05. Correlations with cognitive variables were performed.
Segmentation of Hippocampal Subfields
FreeSurfer automated hippocampal subfield segmentation [version 6.0 (29)], was used to estimate individual hippocampal subfield volumes. Segmentation analysis was conducted for the right hippocampus. Since no previous works have studied hippocampal subfields in IRBD patients, an exploratory analysis was undertaken, and results were considered significant if they showed a p-value of p < 0.05. All hippocampal subfield measures were introduced in a general linear model with eTIV as a covariate.
Statistical Analyses
Statistical analyses of neuropsychological, demographic, clinical, and MRI volumetric data were carried out using the statistical package SPSS-24 (2016; Armonk, NY: IBM Corp.). Student's t-test was used to assess group differences between IRBD and healthy subjects in clinical variables. The general linear model was used to assess group differences in neuropsychological variables and MRI volumetric data. Pearson's chi-squared test was applied to assess group differences in categorical variables. Correlations between structural measures and neuropsychological scores were analyzed using Pearson's correlation. Age, sex, and eTIV were introduced as covariates when needed.
Results
Sociodemographic, Clinical, and Neuropsychological Data
Groups did not differ significantly in any demographical measure. The interval between IRBD diagnosis and time of neuroimaging was 3.1 +/– 3.5 years. Inter-group comparisons of clinical, sociodemographic, and neuropsychological variables are shown in Tables 1, 2, respectively.
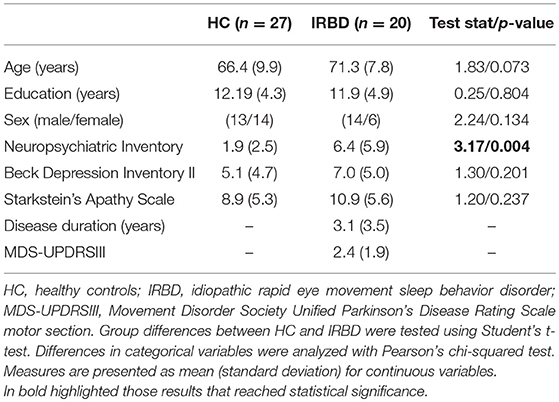
Table 1. Demographic and clinical characteristics.
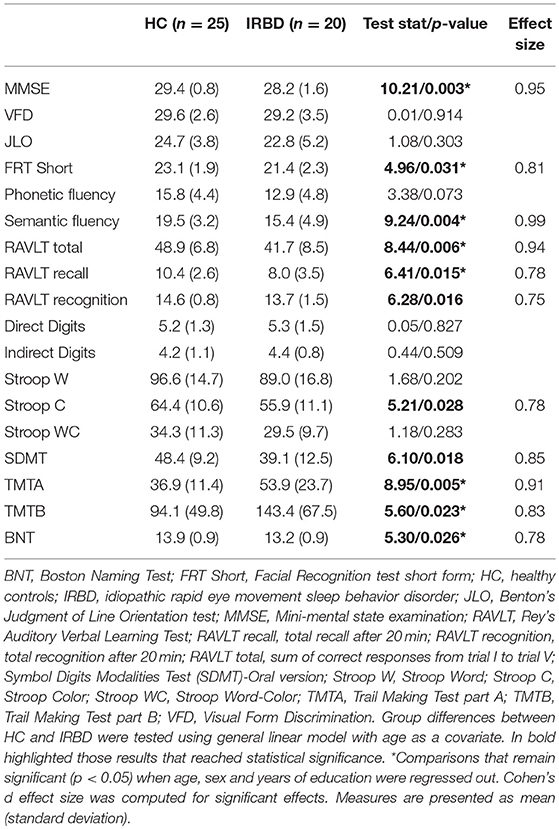
Table 2. Group comparison of neuropsychological performance.
Cortical Thickness Analysis
Results of whole-brain cortical thickness analyses showed that IRBD patients had cortical thinning compared with HC in left superior parietal, post-central, and fusiform regions, as well as in right superior frontal and lateral occipital regions. Left superior parietal, left post-central, and right lingual and paracentral regions remained significant after controlling for both, age and sex Figure 1, Table 3, and Supplementary Material 1.
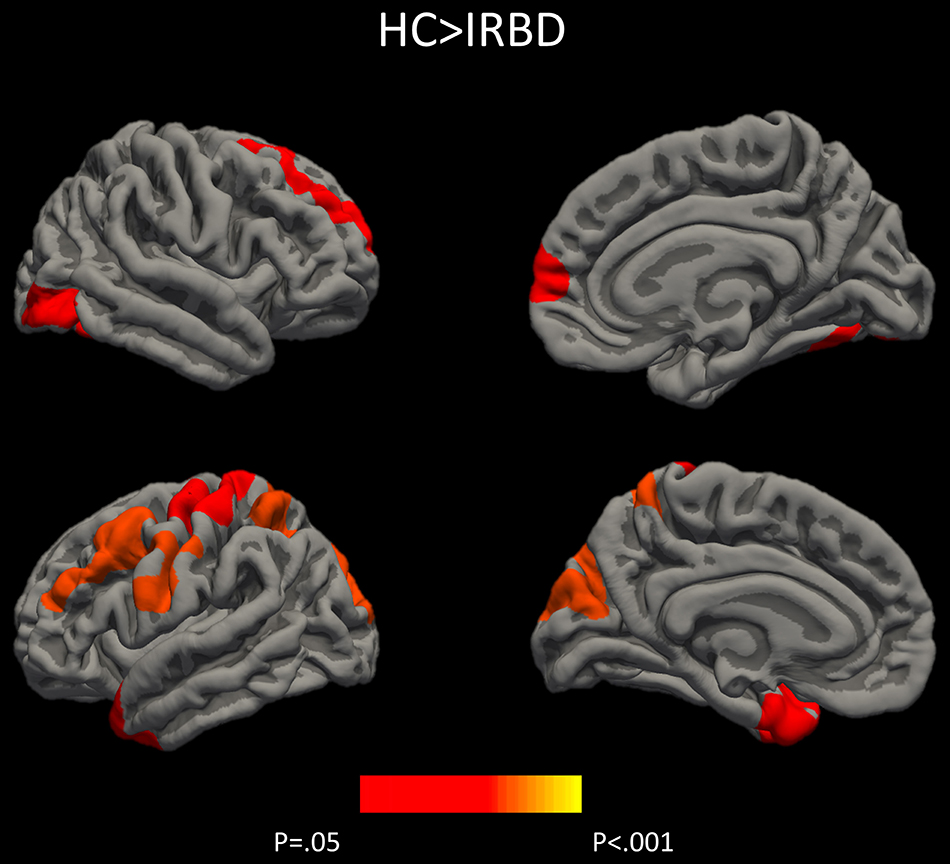
Figure 1. Differences between HC and IRBD patients in cortical thickness. Image show vertex-wise cortical thickness differences between HC and IRBD patients when age was introduced as covariate. Significant clusters are highlighted in warm colors. Results after FWE correction with Monte Carlo simulation and threshold at p ≤ 0.05. Graphics program: Freeview from FreeSurfer (https://surfer.nmr.mgh.harvard.edu/fswiki/FreeviewGuide), and edited with Microsoft PowerPoint®.
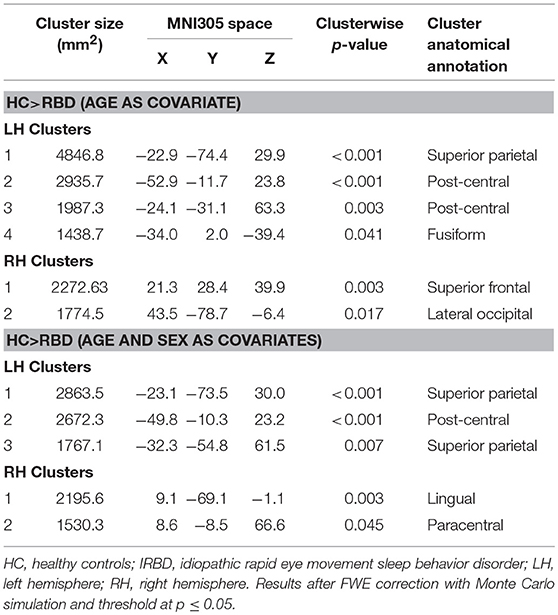
Table 3. Differences between HC and IRBD patients in cortical thickness.
Subcortical Segmentations
Inter-group analysis of subcortical segmentations showed IRBD patients had reduced hippocampal volume (F = 7.730; P = 0.008; Cohen's d effect size = 0.77). In a subsequent analysis right hippocampal volume achieved significance (F = 5.086; P = 0.029; Cohen's d effect size = 0.85), whereas no differences were found for the left hippocampus (F = 2.491; P = 0.122). These results remained significant after controlling for both, age and sex Table 4.
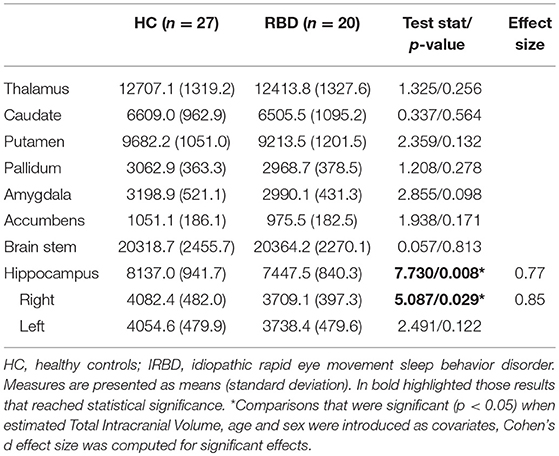
Table 4. Deep gray matter measures (mm3).
Hippocampal Shape Analysis
Shape analysis showed inter-group differences for the right hippocampus in a cluster located in its posterior region, including mainly the CA1, the hippocampal tail, the subiculum, and the dentate gyrus Figure 2. A clear tendency to significance was seen when sex was introduced as a covariate (P = 0.058).
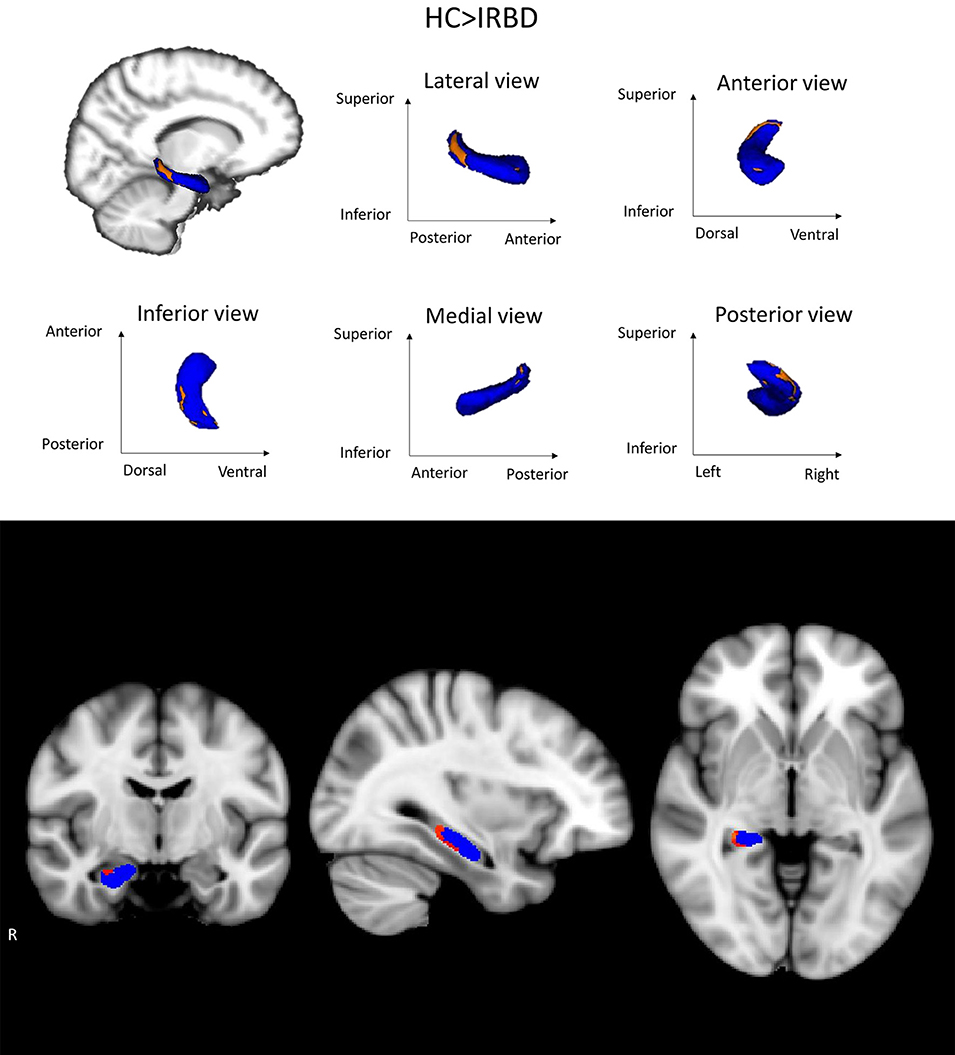
Figure 2. Hippocampal shape differences between HC and IRBD patients. Images show right hippocampus shape differences between HC and IRBD patients when age and estimated Total Intracranial Volume were introduced as covariates. Significant clusters of shape differences (local atrophy) between the groups are highlighted in warm colors (corrected P < 0.05). Results are overlaid on the right hippocampus mask (blue) and displayed over the sagittal, coronal and axial sections of the MNI standard brain. Graphics Program: fslview from FSL (https://fsl.fmrib.ox.ac.uk/fsl/fslwiki/FslView/UserGuide) and edited with Microsoft PowerPoint®.
Segmentation of Hippocampal Subfields
An exploratory analysis of right hippocampal subfields showed that, in comparison with the HC group, IRBD patients had a significant reduction in the right cornu ammonis 1 (CA1) (F = 5.685; P = 0.021; Cohen's d effect size = 0.616), molecular layer (F = 5.764; P = 0.021; Cohen's d effect size = 0.645), granule cell layer of the dentate gyrus (F = 4.863; P = 0.033; Cohen's d effect size = 0.579), and cornu ammonis 4 (CA4) (F = 4.890; P = 0.032; Cohen's d effect size = 0.586) Supplementary Material 2.
Correlation Analyses
To search for cortical substrates of cognitive changes in patients, we performed cortical thickness analyses. Nevertheless, none cognitive function correlated significantly with cortical thickness maps. Moreover, no significant correlations in the IRBD group were found between measures of hippocampal atrophy and either memory scores or other cognitive variables.
Discussion
To our knowledge this is the first study that combine MRI structural data and cognitive assessment to compare IRBD patients and a group of healthy controls. Our results showed that IRBD patients had posterior based cognitive impairment, cortical atrophy and reduction of the hippocampal volume. In this study we explore the hippocampal structure through different structural MRI techniques and found reductions in right whole-hippocampus volume, mainly in posterior regions.
Similarly to previous neuropsychological results on IRBD, in the current study, patients differed from controls in several cognitive domains (8), namely attention (30, 31), verbal memory (30–33), executive function (30, 34, 35) and semantic fluency (30, 31, 36). Our results showed large effect size for facial recognition, semantic fluency, RAVLT total learning, SDMT, TMTA, and TMTB tests. Interestingly, a previous work found TMT, verbal fluency and Stroop Color Word test, were the best predictors of Lewy bodies dementia in IRBD patients (9). As far as we know, this is the first work assessing facial recognition in IRBD patients and showing lower scores in comparison to HC. In this sense, there are previous literature identifying facial emotion recognition (37) and facial recognition impairment in PD patients (38) suggesting this posterior-based dysfunction could be a cognitive biomarker of PD conversion in IRBD patients. Further longitudinal studies are needed to elucidate this issue.
Cortical thickness analysis showed in comparison to HC, IRBD patients had atrophy in left superior parietal, post-central, and fusiform regions, as well as in right superior frontal and lateral occipital regions. When age and sex were introduced as covariates, left superior parietal, left post-central, and right lingual and paracentral regions remained significant. These results agree with those obtained by Rahayel et al. (12, 13) regarding the involvement of dorsolateral prefrontal and occipito-medial regions. In addition, we observed superior parietal thinning similarly to that described in non-demented PD (39, 40). Interestingly, similar to our results fusiform gyrus and parietal lobe thinning was observed in cross sectional (41, 42) and longitudinal DLB dementia studies (43).
Deep gray matter analysis showed a reduction in the right hippocampus in IRBD patients, there are some works indicating the existence of medial temporal lobe abnormalities in such patients using other neuroimaging approaches. For example, studies using whole-brain VBM approach, reported increased hippocampal gray matter density (10), but also gray matter reduction in related structures such as the parahippocampal gyrus (14). On the other hand, brain perfusion studies have found an increased metabolic activity of the hippocampus in IRBD patients (30, 44–47). Some of these works have found this effect specifically in the right hippocampus (30, 44). Furthermore, hippocampal perfusion in IRBD has been reported as a predictor of PD or DLB evolution (45).
Exploratory analyses indicated a trend to reduction in IRBD patients in the right CA1 and CA4 subfields, right molecular layer, and right granule cell layer of the dentate gyrus. In agreement with our findings, reductions in the CA1 (48, 49), CA4-DG (50), subiculum, and presubiculum (48) have been found in DLB patients. By contrast, a previous work reported preservation of hippocampal subfields in DLB patients (51). Neuropathological studies in DLB evidenced greater Lewy pathology in the CA2 (52), but also in the entorhinal cortex, CA1, CA3, CA4, and the subiculum (53).
In a longitudinal study including a larger sample of MCI subjects, the hippocampal volume reduction was reported as predictor of evolution to AD rather than DLB (54). In the same line, AD showed higher hippocampal atrophy than PDD and healthy controls, and regional vulnerability differed between AD and PDD specifically in whole right hippocampus and right subiculum (55). Previous literature have found the progression of IRBD patients is mainly to alpha-synucleinopathies such as DLB, PD, and MSA (3, 4), and not to AD. Further recent findings also provide evidence that APOE-ε4 is linked to hippocampal atrophy and learning/memory phenotypes across the AD/DLB spectrum (56). However, in light of previous data, we cannot rule out that some of our patients could evolve to AD, in this sense could be interesting to obtain APOE ε4 genotypic profile.
Finally, it can be difficult to dissociate if hippocampal atrophy and memory impairment are due to sleep problems itself or to sleep problems plus the neurodegenerative process. Sleep deprivation has been related to hippocampal dysfunction and volume reduction (57), so we cannot attribute our results to the neurodegenerative process per se. For that reason, studies including other sleep disturbances as control group are needed.
Contrary to our hypothesis, we did not find significant correlations between cognitive performance and brain atrophy. However, there is coherence between the detected brain atrophy by MRI and neuropsychological profile observed in our sample. This could be due to the small sample size, or the lack of linear relationship between structural changes and neuropsychological impairment. A previous work studying IRBD patients reported that cortical thinning was associated with lower performance in cognitive domains, namely attention and executive functions, learning and memory, and visuospatial abilities (58). In this setting, right hippocampus volume has been related to spatial memory abilities (59) and spatial mapping (60), with a greater role of posterior hippocampi (60). The lack of association between hippocampal volume and memory performance in our study might be improved in the future by using an extensive neuropsychological assessment including visual and spatial memory tests, as well as test paradigms such as the Free and Cued selective Reminding Test to study memory dissociations between recall and recognition in IRBD patients.
Despite the novel findings described above, some limitations of the current study should be acknowledged. First, the relatively small sample size requires caution in generalizing our results, therefore these findings need to be reproduced in larger samples. Second, considering the exploratory nature of the hippocampal subfield analysis, we did not apply correction for multiple comparisons
In conclusion, we found reductions of mainly posterior cortical thickness and right hippocampal volume in IRBD, alongside evidence of cognitive impairment. This pattern is similar to cognitive decline and atrophy observed in PD and DLB.
Author Contributions
CJ contributed in the design of the study. AC, AA, and CU contributed to the analysis of the data and AC, BS, CJ, MS, AA, CU, HB, CG, JS, YC, and AI contributed to the interpretation of the data. AC and CJ contributed to the draft of the article. AC, BS, CJ, MS, AA, CU, HB, CG, JS, YC, NB, and AI revised the manuscript critically for important intellectual content and approved the final version of the manuscript.
Funding
AC was supported by APIF pre-doctoral fellowship from the University of Barcelona [grant number 2017-2018], CU was supported by a fellowship from 2014, Spanish Ministry of Economy and Competitiveness [grant number BES-2014-068173] and co-financed by the European Social Fund (ESF) and AA was supported by a 2016-2019 fellowship from the Departament d'Empresa i Coneixement de la Generalitat de Catalunya, AGAUR (2016FI_B 00360; 2017FI_B1 00013; 2018FI_B2 00001). This work was sponsored by Fundació La Marató de TV3 in Spain [grant number 20142310] and by Generalitat de Catalunya (2017SGR748).
Conflict of Interest Statement
The authors declare that the research was conducted in the absence of any commercial or financial relationships that could be construed as a potential conflict of interest.
Acknowledgments
We thank the cooperation of the patients, their families, and control subjects. We are also indebted to the Magnetic Resonance Imaging core facility of the IDIBAPS for the technical support, especially to C. Garrido, G. Lasso, V. Sanchez, and A. Albaladejo; and we would also like to acknowledge the CERCA Programme/Generalitat de Catalunya.
Supplementary Material
The Supplementary Material for this article can be found online at: https://www.frontiersin.org/articles/10.3389/fneur.2019.00312/full#supplementary-material
References
1. Iranzo A. The REM sleep circuit and how its impairment leads to REM sleep behavior disorder. Cell Tissue Res. (2018) 373:245–66. doi: 10.1007/s00441-018-2852-8
2. Iranzo A, Santamaria J, Tolosa E. The clinical and pathophysiological relevance of REM sleep behavior disorder in neurodegenerative diseases. Sleep Med Rev. (2009) 13:385–401. doi: 10.1016/j.smrv.2008.11.003
3. Iranzo A, Fernández-Arcos A, Tolosa E, Serradell M, Molinuevo JL, Valldeoriola F, et al. Neurodegenerative disorder risk in idiopathic REM sleep behavior disorder: study in 174 patients. PLoS ONE. (2014) 9:e89741. doi: 10.1371/journal.pone.0089741
4. Mahlknecht P, Iranzo A, Högl B, Frauscher B, Müller C, Santamaría J, et al. Olfactory dysfunction predicts early transition to a Lewy body disease in idiopathic RBD. Neurology. (2015) 84:654–8. doi: 10.1212/WNL.0000000000001265
5. Postuma RB, Gagnon JF, Vendette M, Fantini ML, Massicotte-Marquez J, Montplaisir J. Quantifying the risk of neurodegenerative disease in idiopathic REM sleep behavior disorder. Neurology. (2009) 72:1296–300. doi: 10.1212/01.wnl.0000340980.19702.6e
6. Postuma RB, Aarsland D, Barone P, Burn DJ, Hawkes CH, Oertel W, et al. Identifying prodromal Parkinson's disease: pre-motor disorders in Parkinson's disease. Mov Disord. (2012) 27:617–26. doi: 10.1002/mds.24996
7. Gagnon J-F, Vendette M, Postuma RB, Desjardins C, Massicotte-Marquez J, Panisset M, et al. Mild cognitive impairment in rapid eye movement sleep behavior disorder and Parkinson's disease. Ann Neurol. (2009) 66:39–47. doi: 10.1002/ana.21680
8. Högl B, Stefani A, Videnovic A. Idiopathic REM sleep behaviour disorder and neurodegeneration - an update. Nat Rev Neurol. (2018) 14:40–56. doi: 10.1038/nrneurol.2017.157
9. Marchand DG, Montplaisir J, Postuma RB, Rahayel S, Gagnon J. Detecting the cognitive prodrome of dementia with lewy bodies: a prospective study of REM sleep behavior disorder. Sleep. (2016) 40:zsw014. doi: 10.1093/sleep/zsw014
10. Scherfler C, Frauscher B, Schocke M, Iranzo A, Gschliesser V, Seppi K, et al. White and gray matter abnormalities in idiopathic rapid eye movement sleep behavior disorder: a diffusion-tensor imaging and voxel-based morphometry study. Ann Neurol. (2011) 69:400–7. doi: 10.1002/ana.22245
11. Unger MM, Belke M, Menzler K, Heverhagen JT, Keil B, Stiasny-Kolster K, et al. Diffusion tensor imaging in idiopathic REM sleep behavior disorder reveals microstructural changes in the brainstem, substantia nigra, olfactory region, and other brain regions. Sleep. (2010) 33:767–73. doi: 10.1093/sleep/33.6.767
12. Rahayel S, Montplaisir J, Monchi O, Bedetti C, Postuma RB, Brambati S, et al. Patterns of cortical thinning in idiopathic rapid eye movement sleep behavior disorder. Mov Disord. (2015) 30:680–7. doi: 10.1002/mds.25820
13. Rahayel S, Postuma RB, Montplaisir J, Bedetti C, Brambati S, Carrier J, et al. Abnormal gray matter shape, thickness, and volume in the motor cortico-subcortical loop in idiopathic rapid eye movement sleep behavior disorder: association with clinical and motor features. Cereb Cortex. (2018) 28:658–71. doi: 10.1093/cercor/bhx137
14. Hanyu H, Inoue Y, Sakurai H, Kanetaka H, Nakamura M, Miyamoto T, et al. Voxel-based magnetic resonance imaging study of structural brain changes in patients with idiopathic REM sleep behavior disorder. Parkinsonism Relat Disord. (2012) 18:136–9. doi: 10.1016/j.parkreldis.2011.08.023
15. Boeve BF. REM sleep behavior disorder: updated review of the core features, the RBD-neurodegenerative disease association, evolving concepts, controversies, and future directions. Ann N Y Acad Sci. (2010) 184:15–54. doi: 10.1111/j.1749-6632.2009.05115.x
16. Iranzo A, Molinuevo JL, Santamaría J, Serradell M, Martí MJ, Valldeoriola F, et al. Rapid-eye-movement sleep behaviour disorder as an early marker for a neurodegenerative disorder: a descriptive study. Lancet Neurol. (2006) 5:572–77. doi: 10.1016/S1474-4422(06)70476-8
17. Lezak MD. Neuropsychological Assessment. Oxford University Press (2012). Available online at: https://global.oup.com/academic/product/neuropsychological-assessment-9780195395525?cc=es&lang=en& (accessed May 19, 2017).
18. Aarsland D, Bronnick K, Larsen JP, Tysnes OB, Alves G, Norwegian ParkWest Study Group. Cognitive impairment in incident, untreated Parkinson disease: the Norwegian ParkWest Study. Neurology. (2009) 72:1121–6. doi: 10.1212/01.wnl.0000338632.00552.cb
19. Beck A, Steer R BG. Manual for the Beck Depression Inventory-II. San Antonio, TX: Psychological Corporation (1996).
20. Starkstein SE, Mayberg HS, Preziosi TJ, Andrezejewski P, Leiguarda R, Robinson RG. Reliability, validity, and clinical correlates of apathy in Parkinson's disease. J Neuropsychiatry Clin Neurosci. (1992) 4:134–9.
21. Cummings JL, Mega M, Gray K, Rosenberg-Thompson S, Carusi DA, Gornbein J. The neuropsychiatric inventory: comprehensive assessment of psychopathology in dementia. Neurology. (1994) 44:2308–14. doi: 10.1212/WNL.44.12.2308
22. Fischl B, Dale AM. Measuring the thickness of the human cerebral cortex from magnetic resonance images. Proc Natl Acad Sci USA. (2000) 97:11050–5. doi: 10.1073/pnas.200033797
23. Sled JG, Zijdenbos AP, Evans AC. A nonparametric method for automatic correction of intensity nonuniformity in MRI data. IEEE Trans Med Imaging. (1998) 17:87–97. doi: 10.1109/42.668698
24. Ségonne F, Pacheco J, Fischl B. Geometrically accurate topology-correction of cortical surfaces using nonseparating loops. IEEE Trans Med Imaging. (2007) 26:518–29. doi: 10.1109/TMI.2006.887364
25. Hagler DJ, Saygin AP, Sereno MI. Smoothing and cluster thresholding for cortical surface-based group analysis of fMRI data. Neuroimage. (2006) 33:1093–103. doi: 10.1016/j.neuroimage.2006.07.036
26. Patenaude B, Smith SM, Kennedy DN, Jenkinson M. A Bayesian model of shape and appearance for subcortical brain segmentation. Neuroimage. (2011) 56:907–22. doi: 10.1016/j.neuroimage.2011.02.046
27. Anderson MJ, Robinson J. Permutation tests for linear models. Aust New Zeal J Stat Stat. (2001) 43:75–88. doi: 10.1111/1467-842X.00156
28. Winkler AM, Ridgway GR, Webster MA, Smith SM, Nichols TE. Permutation inference for the general linear model. Neuroimage. (2014) 92:381–97. doi: 10.1016/j.neuroimage.2014.01.060
29. Iglesias JE, Augustinack JC, Nguyen K, Player CM, Player A, Wright M, et al. A computational atlas of the hippocampal formation using ex vivo, ultra-high resolution MRI: application to adaptive segmentation of in vivo MRI. Neuroimage. (2015) 115:117–37. doi: 10.1016/j.neuroimage.2015.04.042
30. Vendette M, Montplaisir J, Gosselin N, Soucy J-P, Postuma RB, Dang-Vu TT, et al. Brain perfusion anomalies in rapid eye movement sleep behavior disorder with mild cognitive impairment. Mov Disord. (2012) 27:1255–61. doi: 10.1002/mds.25034
31. Terzaghi M, Zucchella C, Rustioni V, Sinforiani E, Manni R. Cognitive performances and mild cognitive impairment in idiopathic rapid eye movement sleep behavior disorder: results of a longitudinal follow-up study. Sleep. (2013) 36:1527–32. doi: 10.5665/sleep.3050
32. Fantini ML, Farini E, Ortelli P, Zucconi M, Manconi M, Cappa S, et al. Longitudinal study of cognitive function in idiopathic REM sleep behavior disorder. Sleep. (2011) 34:619–25. doi: 10.1093/sleep/34.5.619
33. Massicotte-Marquez J, Décary A, Gagnon J-F, Vendette M, Mathieu A, Postuma RB, et al. Executive dysfunction and memory impairment in idiopathic REM sleep behavior disorder. Neurology. (2008) 70:1250–7. doi: 10.1212/01.wnl.0000286943.79593.a6
34. Delazer M, Högl B, Zamarian L, Wenter J, Ehrmann L, Gschliesser V, et al. Decision making and executive functions in REM sleep behavior disorder. Sleep. (2012) 35:667–73. doi: 10.5665/sleep.1828
35. Youn S, Kim T, Yoon IY, Jeong J, Kim HY, Han JW, et al. Progression of cognitive impairments in idiopathic REM sleep behaviour disorder. J Neurol Neurosurg Psychiatry. (2016) 87:890–6. doi: 10.1136/jnnp-2015-311437
36. Barber TR, Lawton M, Rolinski M, Hons BA, Evetts S, Baig F, et al. Prodromal Parkinsonism and neurodegenerative risk stratification in REM sleep behavior disorder. Sleep. (2017) 40:11–13. doi: 10.1093/sleep/zsx071
37. Gray HM, Tickle-Degnen L. A meta-analysis of performance on emotion recognition tasks in parkinson's disease. Neuropsychology. (2010) 24:176–91. doi: 10.1037/a0018104
38. Pereira JB, Junqué C, Martí MJ, Ramirez-Ruiz B, Bargalló N, Tolosa E. Neuroanatomical substrate of visuospatial and visuoperceptual impairment in Parkinson's disease. Mov Disord. (2009) 24:1193–9. doi: 10.1002/mds.22560
39. Segura B, Baggio HC, Marti MJ, Valldeoriola F, Compta Y, Garcia-Diaz AI, et al. Cortical thinning associated with mild cognitive impairment in Parkinson's disease. Mov Disord. (2014) 29:1495–503. doi: 10.1002/mds.25982
40. Uribe C, Segura B, Baggio HC, Abos A, Marti MJ, Valldeoriola F, et al. Patterns of cortical thinning in nondemented Parkinson's disease patients. Mov Disord. (2016) 31:699–708. doi: 10.1002/mds.26590
41. Watson R, Colloby SJ, Blamire AM, O'Brien JT. Assessment of regional gray matter loss in dementia with lewy bodies: a surface-based MRI analysis. Am J Geriatr Psychiatry. (2015) 23:38–46. doi: 10.1016/j.jagp.2014.07.005
42. Blanc F, Colloby SJ, Philippi N, De Pétigny X, Jung B, Demuynck C, et al. Cortical thickness in dementia with lewy bodies and alzheimer's disease: a comparison of prodromal and dementia stages. PLoS ONE. (2015) 10:e0127396. doi: 10.1371/journal.pone.0127396
43. Mak E, Su L, Williams GB, Watson R, Firbank MJ, Blamire AM, et al. Progressive cortical thinning and subcortical atrophy in dementia with Lewy bodies and Alzheimer's disease. Neurobiol Aging. (2015) 36:1743–50. doi: 10.1016/j.neurobiolaging.2014.12.038
44. Mazza S, Soucy JP, Gravel P, Michaud M, Postuma R, Massicotte-Marquez J, et al. Assessing whole brain perfusion changes in patients with REM sleep behavior disorder. Neurology. (2006) 67:1618–22. doi: 10.1212/01.wnl.0000242879.39415.49
45. Dang-Vu TT, Gagnon JF, Vendette M, Soucy JP, Postuma RB, Montplaisir J. Hippocampal perfusion predicts impending neurodegeneration in REM sleep behavior disorder. Neurology. (2012) 79:2302–6. doi: 10.1212/WNL.0b013e318278b658
46. Wu P, Yu H, Peng S, Dauvilliers Y, Wang J, Ge J, et al. Consistent abnormalities in metabolic network activity in idiopathic rapid eye movement sleep behaviour disorder. Brain. (2014) 137:3122–8. doi: 10.1093/brain/awu290
47. Ge J, Wu P, Peng S, Yu H, Zhang H, Guan Y, et al. Assessing cerebral glucose metabolism in patients with idiopathic rapid eye movement sleep behavior disorder. J Cereb Blood Flow Metab. (2015) 35:2062–9. doi: 10.1038/jcbfm.2015.208
48. Sabattoli F, Boccardi M, Galluzzi S, Treves A, Thompson PM, Frisoni GB. Hippocampal shape differences in dementia with Lewy bodies. Neuroimage. (2008) 41:699–705. doi: 10.1016/j.neuroimage.2008.02.060
49. Chow N, Aarsland D, Honarpisheh H, Beyer MK, Somme JH, Elashoff D, et al. Comparing hippocampal atrophy in alzheimer's dementia and dementia with lewy bodies. Dement Geriatr Cogn Disord. (2012) 34:44–50. doi: 10.1159/000339727
50. Delli Pizzi S, Franciotti R, Bubbico G, Thomas A, Onofrj M, Bonanni L. Atrophy of hippocampal subfields and adjacent extrahippocampal structures in dementia with Lewy bodies and Alzheimer's disease. Neurobiol Aging. (2016) 40:103–9. doi: 10.1016/j.neurobiolaging.2016.01.010
51. Mak E, Gabel S, Su L, Williams GB, Arnold R, Passamonti L, et al. Multi-modal MRI investigation of volumetric and microstructural changes in the hippocampus and its subfields in mild cognitive impairment, Alzheimer's disease, and dementia with Lewy bodies. Int Psychogeriatr. (2017) 29:545–55. doi: 10.1017/S1041610216002143
52. Harding AJ, Lakay B, Halliday GM. Selective hippocampal neuron loss in dementia with Lewy bodies. Ann Neurol. (2002) 51:125–8. doi: 10.1002/ana.10071
53. Adamowicz DH, Roy S, Salmon DP, Galasko DR, Hansen LA, Masliah E, et al. Hippocampal α-synuclein in dementia with lewy bodies contributes to memory impairment and is consistent with spread of pathology. J Neurosci. (2017) 37:1675–84. doi: 10.1523/JNEUROSCI.3047-16.2016
54. Kantarci K, Lesnick T, Ferman TJ, Przybelski SA, Boeve BF, et al. Hippocampal volumes predict risk of dementia with Lewy bodies in mild cognitive impairment. Neurology. (2016) 87:2317–23. doi: 10.1212/WNL.0000000000003371
55. Novellino F, Vasta R, Sarica A, Chiriaco C, Salsone M, Morelli M, et al. Relationship between hippocampal subfields and category cued recall in AD and PDD: a multimodal MRI study. Neuroscience. (2018) 371:506–17. doi: 10.1016/j.neuroscience.2017.12.028
56. Saeed U, Mirza SS, MacIntosh BJ, Herrmann N, Keith J, Ramirez J, et al. APOE-ε4 associates with hippocampal volume, learning, and memory across the spectrum of Alzheimer's disease and dementia with Lewy bodies. Alzheimer's Dement. (2018) 14:1137–47. doi: 10.1016/j.jalz.2018.04.005
57. Kreutzmann JC, Havekes R, Abel T, Meerlo P. Review sleep deprivation and hippocampal vulnerability: changes in neuronal plasticity, neurogenesis and cognitive function. Neuroscience. (2015) 309:173–90. doi: 10.1016/j.neuroscience.2015.04.053
58. Rahayel S, Postuma RB, Montplaisir J, Génier Marchand D, Escudier F, Gaubert M, et al. Cortical and subcortical gray matter bases of cognitive deficits in REM sleep behavior disorder. Neurology. (2018) 90:e1759–70. doi: 10.1212/WNL.0000000000005523
59. Ezzati A, Katz MJ, Zammit AR, Lipton ML, Zimmerman ME, Sliwinski MJ, et al. Differential association of left and right hippocampal volumes with verbal episodic and spatial memory in older adults HHS Public Access. Neuropsychologia. (2016) 93:380–5. doi: 10.1016/j.neuropsychologia.2016.08.016
Keywords: idiopathic REM-sleep behavior disorder, MRI-magnetic resonance imaging, cortical gray matter atrophy, hippocampal atrophy, hippocampal subfields, cognition
Citation: Campabadal A, Segura B, Junque C, Serradell M, Abos A, Uribe C, Baggio HC, Gaig C, Santamaria J, Compta Y, Bargallo N and Iranzo A (2019) Cortical Gray Matter and Hippocampal Atrophy in Idiopathic Rapid Eye Movement Sleep Behavior Disorder. Front. Neurol. 10:312. doi: 10.3389/fneur.2019.00312
Received: 20 November 2018; Accepted: 11 March 2019;
Published: 05 April 2019.
Edited by:
Federica Agosta, Vita-Salute San Raffaele University, ItalyReviewed by:
Menno Michiel Schoonheim, VU University Medical Center, NetherlandsMaria Salsone, Italian National Research Council (CNR), Italy
Copyright © 2019 Campabadal, Segura, Junque, Serradell, Abos, Uribe, Baggio, Gaig, Santamaria, Compta, Bargallo and Iranzo. This is an open-access article distributed under the terms of the Creative Commons Attribution License (CC BY). The use, distribution or reproduction in other forums is permitted, provided the original author(s) and the copyright owner(s) are credited and that the original publication in this journal is cited, in accordance with accepted academic practice. No use, distribution or reproduction is permitted which does not comply with these terms.
*Correspondence: Carme Junque, Y2p1bnF1ZUB1Yi5lZHU=