 Zeinab Gharaylou1
 Lida Shafaghi1
 Mohammad Ali Oghabian2
 Ali Yoonessi1Abbas Tafakhori3Esmaeil Shahsavand Ananloo4
 Mahmoudreza Hadjighassem1,5*
- 1Department of Neuroscience and Addiction Studies, School of Advanced Technologies in Medicine, Tehran University of Medical Sciences, Tehran, Iran
- 2Neuroimaging and Analysis Group, Imam Khomeini Hospital, Tehran University of Medical Sciences, Tehran, Iran
- 3Imam Khomeini Hospital, Iranian Center of Neurological Research, Tehran University of Medical Sciences, Tehran, Iran
- 4Roozbeh Hospital, Tehran University of Medical Sciences, Tehran, Iran
- 5Brain and Spinal Cord Injury Research Center, Neuroscience Institute, Tehran University of Medical Sciences, Tehran, Iran
Antiepileptic drugs (AEDs) have repeatedly shown inconsistent and almost contradictory effects on the neurocognitive system, from substantial impairments in processing speed to the noticeable improvement in working memory and executive functioning. Previous studies have provided a novel insight into the cognitive improvement by bumetanide as a potential antiepileptic drug. Through the current investigation, we evaluated the longitudinal effects of bumetanide, an NKCC1 co-transporter antagonist, on the brain microstructural organization as a probable underlying component for cognitive performance. Microstructure assessment was completed using SPM for the whole brain assay and Freesurfer/TRACULA for the automatic probabilistic tractography analysis. Primary cognitive operations including selective attention and processing speed, working memory capacity and spatial memory were evaluated in 12 patients with a confirmed diagnosis of refractory epilepsy. Participants treated with bumetanide (2 mg/ day) in two divided doses as an adjuvant therapy to their regular AEDs for 6 months, which followed by the re-assessment of their cognitive functions and microstructural organizations. Seizure frequency reduced in eight patients which accompanied by white matter reconstruction; fractional anisotropy (FA) increased in the cingulum-cingulate gyrus (CCG), anterior thalamic radiation (ATR), and temporal part of the superior longitudinal fasciculus (SLFt) in correlation with the clinical response. The voxel-based analysis in responder patients revealed increased FA in the left hippocampus, right cerebellum, and right medial temporal lobe, while mean diffusivity (MD) values reduced in the right occipital lobe and cerebellum. Microstructural changes in SLFt and ATR accompanied by a reduction in the error rate in the spatial memory test. These primary results have provided preliminary evidence for the effect of bumetanide on cognitive functioning through microstructural changes in patients with drug-resistant epilepsy.
Introduction
Impairment in diverse cognitive domains is a frequently occurring component in epileptic syndromes either due to the natural course of the disease or the antiepileptic drug (AED) related adverse effects. Various forms of epilepsies cause neurocognitive abnormalities such as substantial memory disturbances (1–3). The specific drug-induced dysfunctions which are irreversible in some circumstances could deleteriously affect medication tolerability, behavioral performance, and psychosocial functioning within a long-term scope (4–6). Even with these cognitive sequels, a number of antiepileptic drugs have been able to improve executive functions in some ways (7). Consequently, the assessment of the AEDs associated cognition-reshaping impact would make a substantial contribution to medicinal progression in these interacting fields (7). Prior investigations have broadly signified the role of gamma-aminobutyric acid (GABA) system as the main inhibitory agency in mediating epileptogenesis/anti-epileptogenesis processes and shaping the fundamental cognitive constructs like memory consolidation (8, 9). The overexpression of NKCC1, a chloride concentration regulating transporter, and resulting abnormal alterations in GABA functional polarity have been reported in several neuropsychological disorders such as epilepsy, tuberous sclerosis complex (TSC), Down syndrome, Huntington disease and autism spectrum disorders (10–12). Bumetanide is a sulfonamide-derived loop diuretic, which powerfully blocks NKCC1 co-transporter (12). We have already reported that bumetanide could be a potent and safe adjuvant therapeutic agent in seizure controlling protocols (13, 14). Despite the low concentration of bumetanide in the brain environment, studies on Huntington and Down's model revealed that restoring the inhibitory function of GABA -as the major probable mechanism of bumetanide- might assist in memory improvement through inducing modifications in synaptic plasticity patterns (15–17). In addition, bumetanide improved social stimuli processing in autism (18, 19) and made the behavioral domain indices in TSC more efficient (20). Although the earlier studies provided considerable insights into cognitive recovery by bumetanide, no research has been found that surveyed the neuro-cognitive impacts of bumetanide add-on therapy on patients with pharmaco-resistant epilepsy.
Structural neuroimaging studies have repeatedly reported the association between cognitive deficits and changes in white matter microstructure in epileptic syndromes (3, 21). Structural connectivity and microstructural integrity can be detected by Diffusion Tensor Imaging (DTI) (22). Several cross-sectional evaluations have generally supported widespread white matter diffusion abnormalities in the epileptic brain (23, 24) that measured by fractional anisotropy (FA) and mean diffusivity (MD). Newly developed tractography technique, TRACULA (TRActs Constrained by UnderLying Anatomy), is a powerful whole-brain tractography method which reconstructs 18 major white matter fibers. The principle superiority of TRACULA is its ability to analyze longitudinal tract alterations in a probabilistic way (25, 26); Therefore, through the current study, we aimed to investigate the association between longitudinal effects of bumetanide on the whole brain structure using voxel-based analysis, white matter changes using TRACULA, and their relations to the cognitive performance indices.
Materials and Methods
Patients with the diagnosis of medically refractory epilepsy entered the study. The criteria were considered according to the International League Against Epilepsy (ILAE), Classification of Epileptic Seizures (27); that defines the resistance state as experiencing at least 1 seizure per month and receiving at least two standard conventional anti-epileptic drugs within a stable regimen Patients excluded if they had any reports of other major neurological or medical comorbidities. Healthy subjects were asked about general medical conditions with emphasizing on head traumas, seizures and neuropsychological disorders regarding themselves or their family members. Less than 6 years of standard education, taking any medication, alcohol or substance use, renal and liver dysfunctions were among the other causes for exclusion. Finally, twelve right-handed, age, gender, and education level matched patients were selected for each group.
Patients monitored 4 months prior to bumetanide administration in order to ensure the steady therapeutic doses and effects. Subsequent to these primary steps, based on observations from our former work (13) bumetanide 2 mg/day was added to the baseline stabilized AEDs. Patients classified as a responder if they had a 50% reduction in the frequency of seizures compared to the baseline (28).
All of the participants or their guardians assigned written informed consent. The study protocol approved by the ethical committee of Tehran University of Medical Sciences and got its' registration code from the Ministry of Health and Medical Education (IRCT201012115368N1). The basic characteristics of the participants are described in Table 1.
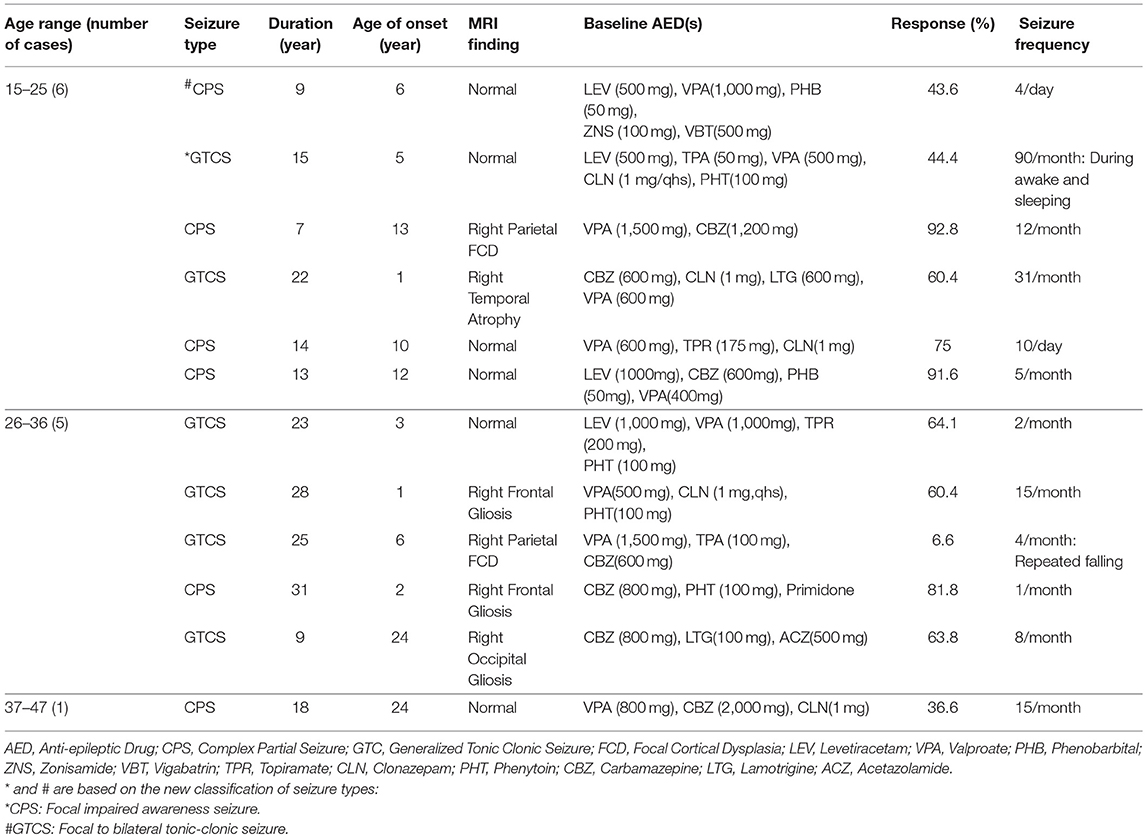
Table 1. Baseline demographics, AEDs and epilepsy characteristics.
MRI Acquisition
MRI scans were acquired from the patients in two time-points; once before adding bumetanide to their stable regimen and the second 6 months after receiving bumetanide. The same scanning procedure run one time for healthy controls. We used a 3.0T Siemens Magneto Tim Trio whole-body scanner (Siemens AG, Erlangen, Germany) with a 32-channel head coil. Anatomical images acquired with a high-resolution, T1-weighted MPRAGE (TR = 1,800, TE = 3.44 ms, flip angle = 7°, FOV = 256 mm, matrix = 256 × 256, voxel size = 1 × 1 × 1 mm). One hundred and seventy six contiguous sagittal slices provided whole-brain coverage. The Diffusion Weighted Imaging obtained using a single-shot spin echo EPI sequence. Whole brain diffusion images received b = 700 s/mm2 with 30 directions. The repetition time (TR) and echo time (TE) were 13 and 101 ms for this image. Extra brain volumes received four no diffusion weighting (b = 0 s/mm2) with opposing phase-encode directions (Anterior-Posterior and opposite). The EPI readout uses the size of 128 × 128 and field of view (FOV) of 256 × 256 mm2 and a slice thickness of 2 mm, isotropic voxels of 2 × 2 × 2 mm3. Sixty eight slices acquired to cover the whole brain. The total acquisition time for imaging was about 10 min.
Diffusion Image Processing
Whole Brain Voxel-Based Analysis
For each subject, all DWI scans with b = 700 concatenated into a single data set and corrected for the subject head motion. Eddy current and EPI distortions also corrected with required B-matrix adjustments. The tensor model fitted to the corrected data and then mean diffusivity (MD) and fractional anisotropy (FA) calculated from the tensor's eigenvalues (29). Data preprocessing performed using Eddy-FSL (30).
Voxel-based analyses (VBA) were performed using statistical parametric mapping 12 (SPM 12). To create study template, B0 images of control subjects normalized to the Montreal Neurological Institute (MNI) EPI template. Estimated parameters applied to all FA and MD images. Then these images averaged and smoothed with 6 mm full-width at half-maximum (FWHM) smoothing filter. Afterward, native FA and MD images of controls and patients in two-time points normalized to the study templates and smoothed with a 6 mm FWHM. The general linear model (GLM) was set up to evaluate group differences (pre-treatment vs. control). The statistical threshold of SPM [The Family Wise Error (FWE)] used for multiple comparisons correction of the voxel at a p < 0.05 level in cluster size ≥20 voxels which were considered as significant. Further on, the mean value of FA and MD in significant areas calculated for longitudinal analysis. Finally, GLM was set up to run paired comparison (t-test) in order to assess other brain regional changes between pre- and post-treatment phases.
Tracts Statistical Analysis
Longitudinal tractography was performed by TRACULA tool in Freesurfer (31). Automatic reconstruction of major white matter (32) tracts done for control and patient groups (pre- and post-treatment). FA and MD averaged over the entire trajectory of 18 pathways for statistical analysis. The tract of interest consisted of: commissural tracts (Forceps Major and Minor), anterior thalamic radiation (ATR), cingulum-angular (infracallosal) bundle (CAB), cingulum- cingulate (supracallosal) bundle (CCG), corticospinal tract (CST), inferior longitudinal fasciculus (33), superior longitudinal fasciculus [temporal part (SLFt), parietal part (SLFp)], and the uncinate fasciculus (UF) in each hemisphere.
Quality Assessment of DTI Data
Since there is a difference in the signal-to-noise ratio (SNR) in diffusion images, we operated our calculations through TRACULA based on the mean of the signal intensity of whole brain images. SNR values averaged for each participant and applied for statistical variability analysis. As the differences in head motion between the study groups could induce false difference diffusion parameters (34). The average of volume-by-volume translation and rotation, the percentage of signal drop-out and also the average of drop-out scores with excessive intensity computed for each subject. Total motion index (TMI) was obtained from the four motion signs and applied as nuisance regressors in group analysis. Total motion index (TMI) calculated for the i-th subject based on the formula that is given by:
where j = 1…,4 indexes the four motion measures as mentioned above, xij is the value of the j-th motion measure of the i-th subject. Mj, Qj, and qj are the median, upper quartile, and lower quartile of the j-th motion measure over all subjects who were included in a group comparison (34).
Cognitive Assessment
Spatial working memory test was conducted in two steps. Firstly, two pictures were shown in a sequence of 1 s intervals at different locations on the screen and the number of pictures increased up to seven items in a graded state. Secondly, one picture presented in the middle of the screen and participants should recall the correct location of the middle picture. Each participant's mean reaction time and during the task-accuracy were calculated. Moreover, we examined memory by Stroop test and n-back test. The Stroop Color and Word Test (SCWT) consisted of three conditions: neutral, congruent and incongruent. These assessments illustrated the image processing speed and working memory capacity as parts of the executive functions. Tests were computerized using Psychopy software v.1.84.2 and were used through standard operating procedures.
Outcome Variables
Percentage of changes in seizure frequency was the clinical efficacy index. Seizure frequency calculated according to the following equation:
(Seizure frequency in 1st month+… + Seizure frequency in the nth month)/n
Patients with at least 50% monthly seizure frequency reduction were considered as responders (Table 1).
Statistical Analysis
Comparison between the control group and pre-treatment phase of the patient group done with mann-whitney (non-parametric unpaired t-test). It should be noted that all these analyses corrected for 18 comparisons (reflecting 18 tracts) using Bonferroni correction and the significance level considered <0.002 (P < 0.002). Longitudinal analysis was performed using a linear mixed model in which FA and MD values incorporated in each tract equation as the dependent variables. Being responder or non-responder considered as the between-subject factor while the scan order (Scan-1, Scan-2) and intended hemisphere regarded as within-subject repeated measures. Gender, age, intracranial volume, and TMI considered as the covariates in this analysis. Significant differences in responder group were considered supportive of the study hypothesis. Also, this model determined whether changes in cognitive scores varied in responders, non-responders and over time that bumetanide administered. We calculated FA and MD values of changes between before and after phases of bumetanide administration. Then Spearman correlation analysis applied between them and changes that found through cognitive assessments. P < 0.05 was considered as the significance level. SPSS v23.0 (SPSS Inc., Chicago, Illinois) was used for all the performed analyses.
Results
Quality Assessment
The SNR comparison showed no significant difference between patients in pre-treatment phase vs. control group; P = 0.73, and pre-treatment vs. post-treatment; P = 0.64 (mean ± SDs were as follow: control: 3.85 ± 0.29; pre-treatment: 3.80 ± 0.34; post-treatment: 3.85 ± 0.26). Also, there were no significant differences in TMI between groups in two comparison settings (Table 2).
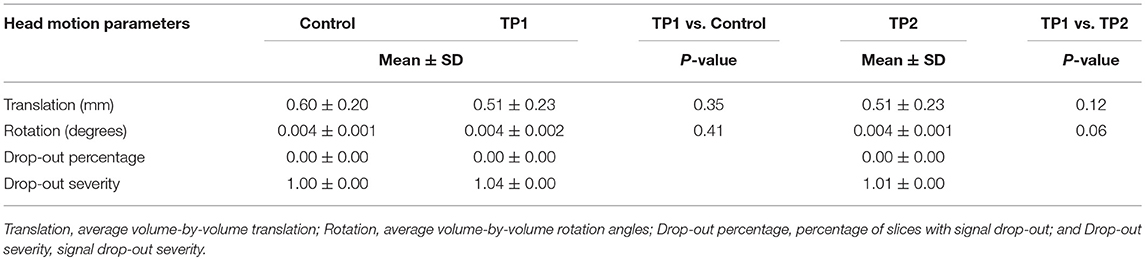
Table 2. Head motion parameters for the patients in pretreatment (TP1), post-treatment (TP2), and controls.
Clinical Response to Bumetanide
The clinical response to the bumetanide add-on therapy defined as more than 50% reduction (35) in seizure frequency after the therapeutic course (calculated seizure frequency during first month of assessment compared to the last month of evaluation). Eight patients (67%) from all twelve subjects that completed 6 month experiment fulfilled this criterion and classified as responders. Two patients among the responders became close to the seizure-free state with more than 90% reduction (91.6 and 92.8%) (Table 1).
Bumetanide Effect on Longitudinal Changes of the Whole Brain
We performed a whole-brain voxel-based analysis using FA and MD maps for the unpaired two-sample t-test in order to run the comparison between patients in the pre-treatment phase and controls. In longitudinal assessment mean value of FA and MD that differed significantly between control and patients applied for subsequent analyses after medication. LMM assessment in responder patients revealed increased FA in the left hippocampus, right cerebellum, and right medial temporal lobe, while MD value reduced in the right occipital and cerebellum. These data suggest that reduction in seizure is accompanied by reversion in diffusion parameters. MNI coordinates, cluster size and Z-values of finding shown in Table 3.
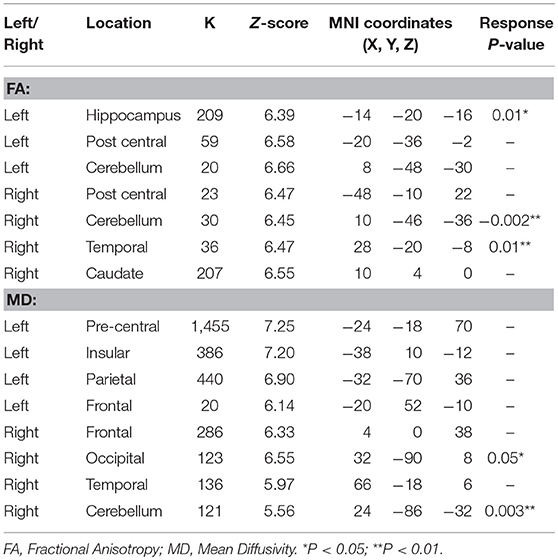
Table 3. Significant changes in DTI parameters after bumetanide administration in regions that found abnormal in pre-treatment vs. control subjects using a correction for multiple comparisons (36) at the cluster level (p < 0.05).
However, the whole brain analyses between pre- and post-treatment phases showed significant increases of FA particularly in the right hippocampus (P = 0.008), the cerebellum (P = 0.02) and in the left parahippocampal gyrus (P = 0.01) independent to the seizure frequency index after treatment (Figure 1).
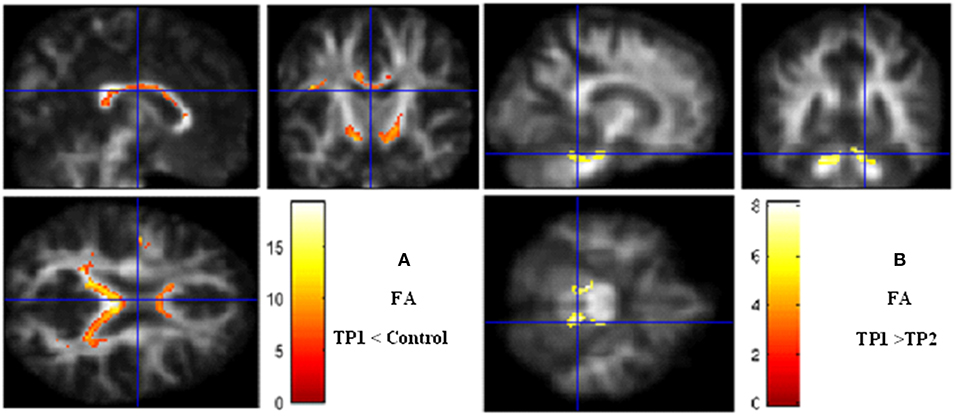
Figure 1. Voxel-based analysis. (A) Fractional anisotropy decrease in TP1 (pretreatment) vs. controls. (B) Fractional anisotropy increases after bumetanide treatment. Significance maps (in red and yellow) overlaid on smooth anisotropy control image. The threshold was set at P < 0.05 (FEW Corrected) and minimum cluster size >5 voxels. Color scale represents t-values. FA, fractional anisotropy; TP, Time Point.
Bumetanide Effect on the Longitudinal Changes of White Matter
We hypothesized that bumetanide would have an influence on changes in DTI indices (FA and MD) of tracts. Based on the longitudinal analyzing of 18 tracts, significant reversal changes found in FA (FA increased) in the UF, ATR, and CST tracts over time that bumetanide administered. Additionally, MD decreased in the SLFt tract (Table 4). The observed changes in the FA and MD parameters following bumetanide administration were statistically significant in the right hemisphere. Based on the conventional MRI data, six of these patients had a lesion in the right side of the brain (data presented in Table 1). It should be noted that the remaining of the patients were MRI negative.
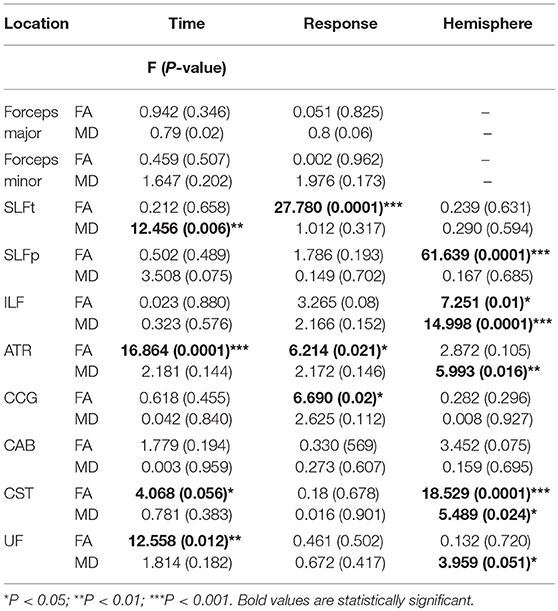
Table 4. The statistical significance of the time, hemisphere and response effects on FA and MD values in tracts of interest for mixed model analyzing regarding age, sex, TMI, and ICV as covariance.
Moreover, our data showed that FA increased in the CCG, ATR, and SLFt which meaningfully correlated with the clinical response (Table 4). Data [Mean (SD)] of FA and MD in control group and pre- and post-bumetanide administration phases in patients [responders (n = 8) and non-responders (n = 4)] presented in Table 5.
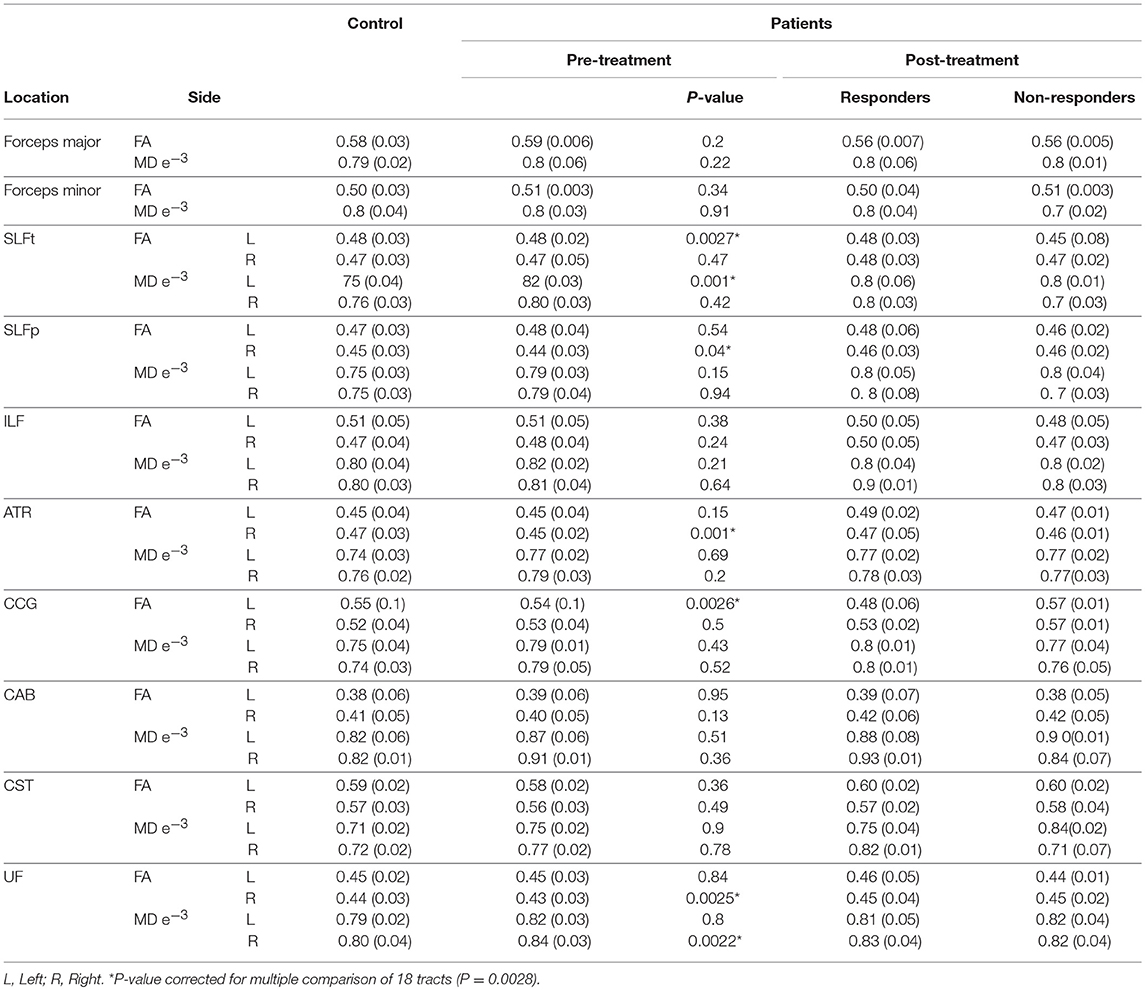
Table 5. FA and MD values [Mean (SD)] in controls; Patients pre-, post- [responders (n = 8), and non-responders (n = 4)] 6 months bumetanide administration.
Bumetanide Effect on the Longitudinal Changes of Cognitive Functions
Cognitive measures of the control group, pre- and post-bumetanide administration phases can be seen in Table 6. The reaction time of patients in neutral, congruent, incongruent conditions, and also the error rates in the Stroop test were significantly higher in the patients compared to the healthy subjects. Increased reaction time, error percent and low performance rate in spatial memory test detected for patients relative to the control group. In addition, the higher reaction time in the N-back test observed in patient group. Following the 6 months bumetanide administration, percentage of errors in the spatial memory test reduced (p-value:0.001) and performance in the spatial memory enhanced (p-value: 0.001) after regarding age and sex as covariates; but no significant changes observed in association with the clinical response. These data suggest that bumetanide affect the memory function independent of the seizure frequency fluctuations.
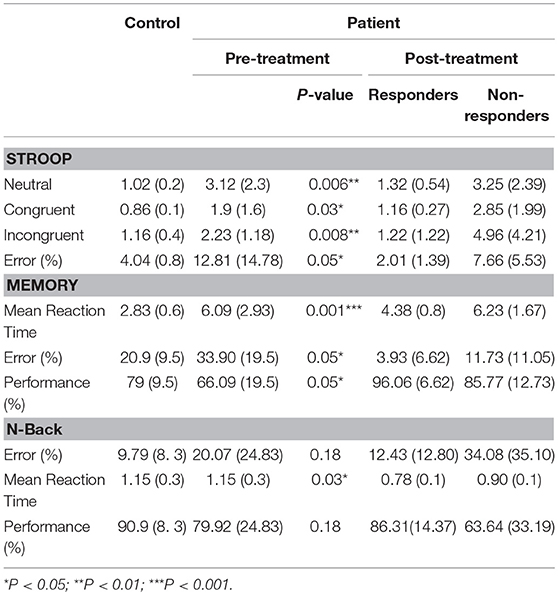
Table 6. Cognitive test scores [Mean (SD)] in controls, Patients pre and post [responders (n = 8) and non-responders (n = 4)] 6 months Bumetanide administration.
Associations Between Cognitive Functions and DTI Changes
Spearman correlation analysis of cognitive functioning and DTI changes revealed a significant relationship between changes in FA, MD, and cognitive indices. Statistically, are markable association observed between FA in left ATR, MD in the right SLFt, and the percentage of the errors in the spatial memory test (Figure 2).
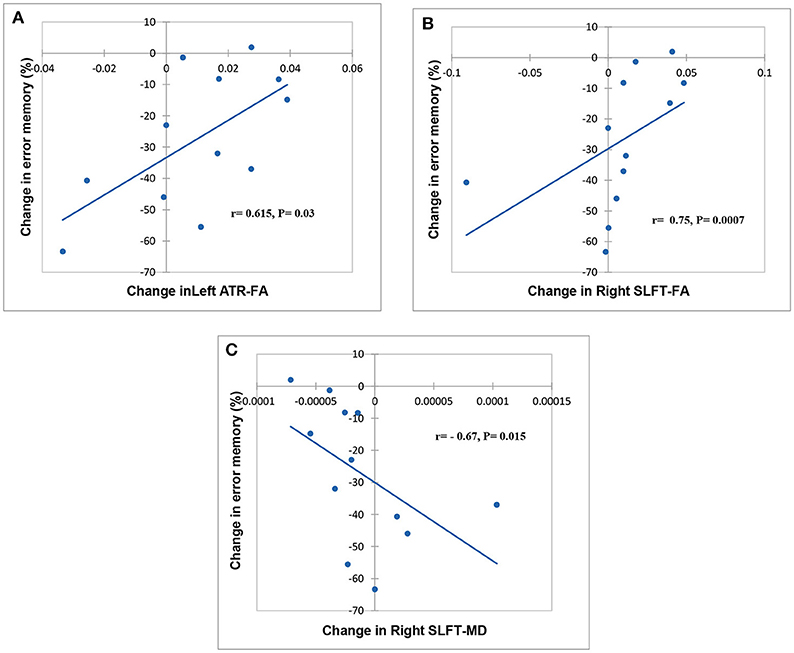
Figure 2. Scatter plot showing a relationship between change related to baseline in FA, MD, and cognitive task. Significant relationships between FA in left ATR, FA, and MD in the right SLFt and % error memory indicating, respectively in (A–C).
Discussion
In this study, we explored the association between brain microstructural abnormalities and different dimensions of the neurocognitive functioning after bumetanide administration in medication-resistant epilepsy. Significant changes in DTI metrics were revealed in different neuronal tracts in patients compared with control subjects and also in pre- and post-treatment phases of the patient group within a 6 month period. Moreover, this analysis successfully provided evidence for the existence of the hypothesized causal link between the indices of cognitive functions including reaction time and errors, and FA or MD values.
Currently provided data showed 67% responsiveness to bumetanide as an add-on therapy. Despite the low concentrations of the bumetanide in the brain following systemic administration (37, 38), recent studies indicated that bumetanide is able to control some aspects of neurological and neuropsychological disorders such as epilepsy (13, 20), schizophrenia (39, 40), Autism (41), and Parkinson disease (42). Previous researches have consistently documented a significant decline in the intracellular concentration of chloride and seizure frequency following the NKCC1 blockade by bumetanide (43–45). We also recently found that bumetanide could reduce the interictal spikes beside seizure frequency in medically-resistant epileptic patients (13). Nevertheless, the exact mechanisms by which bumetanide could control seizure and improve other chronic neurological symptoms are fairly unclear.
Although the combination therapy makes the accurate pharmacological interpretations difficult, it might be noticeable that 10 patients had been receiving different dosages of valproate within their background anticonvulsant regimen which signify the possible positive interactions. Valproate is a broad spectrum anticonvulsant drug that exerts its effects through several ways that could potentially underlie the observed clinical responses and cognitive impacts (46). Besides bearing significant molecular resemblance to GABA, valproate blocks both reuptake and catabolism of GABA (47) that possibly in concert with facilitation properties of bumetanide in restoring the functional polarity of GABAA receptor, increases the overall inhibitory operations of the brain. GABA neurogenesis (48) is another evident mechanism through which valproate might shift the balance toward more inhibition in long term perspective; the conditions that possibly in concert with facilitation properties of bumetanide in restoring the functional polarity of GABAA receptor, increases the overall inhibitory operations of the brain. Moreover, there are considerable pieces of evidence of neurogenesis which is induced by alterations in GABA homeostasis (49). Therefore, additive neurogenesis could be underway specifically when it comes to longer duration of administration.
Six patients had brain lesions while remaining of the cases were MRI negative. There have been works pointing to the increased expression levels of bumetanide-sensitive co-transporter, NKCC1, in hypoxic, edematous or secondary progressive hemorrhagic states in animal models of traumatic brain injuries (50, 51). On the other side, neuroimaging analyses have evidently shown that edema is a predominant component in epileptogenesis activities (52, 53). It might be deduced that bumetanide predominantly affects damaged brain microstructures due to the possible increased levels of expression within these affected areas.
Upgrading the observed correlation between increased FA in the CCG, ATR, and SLFt and better bumetanide response, to a more precise cause and effect model requires a well-controlled study that enables statistical inferences. However, it might be assumed that efficient neuronal connections shift the overall states of the brain toward more stable states and subsequent cognitive and clinical improvements.
In order to provide a framework for understanding the central effects of bumetanide in temporal lobe epilepsy, we investigated microstructural changes in the cerebral white matter. The possible mechanisms underlying TLE include disturbed myelination patterns and alteration of neuronal density (54, 55). After the implementation of the treatment protocol, the white matter voxel-based analysis demonstrated higher FA in the right hippocampus, medial temporal lobe, cerebellum and lower MD in the right occipital lobe and cerebellum. However, the analysis of eighteen tracts showed FA rise in the ATR, SLFt, and CCG. These changes associated with clinical improvement in response to bumetanide, and might reflect the structural reorganization. Our results are in line with previous reports (56, 57). Some reports indicated an acute reduction in MD without changes in FA after the seizure, which is different from the baseline (58). Moreover, studies on post-epilepsy surgery indicated plasticity in distinct areas which is related to microstructural reconstruction (58). Based on present findings, bumetanide could act on the central nervous system through inducing changes in the brain microstructure. According to the functional and structural imaging findings and newer definitions, epilepsy is a disorder of network (59). Presence of different probable patterns of axonal connectivity that could be altered in various disease states necessitates development of novel tools for analysis (60). Revealing quantitative aspects of neuroanatomical structures and associated pathological sequels or cognitive deficits, put the tractography approaches superior to the conventional analysis of MRI findings. The probabilistic nature of TRACULA is also a remarkable side since this property resolves the crossing fibers voxels problems and properly take the uncertainty component into account (61).
The decline in white matter integrity has been represented by the two key changes: the reduction in FA and enhancement in MD (62). One recently published study in schizophrenia reported the significant predictive role of the microstructural changes for cognitive performance such as attention and executive functions following treatment (63). Our results indicate white matter microstructural changes in SLFt, ATR, and CCG in responder patients. Spearman correlation analysis of cognitive functions and these brain changes indicated the significant relationships between longitudinal MD and FA values and error reduction in the spatial memory test. This would be probable since The SLFt tract connects the frontal, occipital, parietal, and temporal lobes and plays a fundamental role in the memory network (64, 65). The anterior thalamic nuclei (ATN) and their interconnecting fibers are important components of an extended hippocampal circuit for episodic memory (66). It seems that these essential tracts which passing through the temporal lobe and are affected in epileptic syndromes, mainly mediate cognitive processing, and consequently are responsible for the observed dysfunctions. It is highly possible that the bumetanide is exerting its effects through these pathways. While there have been some brain regions that are hallmarks for specific cognitive functions, regarding dynamic nature of the epilepsy which might alter the areas and their underlying connections during the course of the disease, neuroimaging analyses applied for the whole brain to detect potential contributing regions.
In addition to the research-based applications of probabilistic tractography approaches (67), recent pre-surgical assessments are benefiting from progress in neuroimaging analysis. TRACULA is increasingly used by neurosurgeons for more precisely-planned operations (61). However, to the best of our knowledge, this is the first study that has executed a TRACULA-based follow up analysis of one specific medication.
Previous studies indicated that FA value could be an appropriate representative of the white matter constitution (63). We showed that the integrity of white matter in CST and UF altered by bumetanide; that was independent of seizure frequency. However, small sample size and uncontrolled design are the major limitations of the current study, which warrant caution in interpreting the findings.
Finally, one of the mortality related phenomenon of epilepsy is the sudden unexpected death in epilepsy or “SUDEP” that frequently occurs in resistant states. The underlying processes of SUDEP are yet to be clarified but some cardiovascular related mechanisms such as the myocardial atrophy and leucocyte infiltration—due to the catecholamine surge of seizures- have been evidenced through microscopic analyses (68). Due to the possible cardiovascular contribution in SUDEP, drugs that cover both anticonvulsant and cardiac effects may be better candidate AEDs.
Conclusion
In accordance with our findings, there is a wide microstructural distortion in the brain of epileptic patients which might be the cause of the observed abnormalities in associative behavior and cognitive impairments. Adjunctive bumetanide treatment may lead to the microstructural reorganization that mostly affects the epileptic regions; The outcome that could be the underlying contributor for its cognition improving effects.
Author Contributions
ZG designed the experiment, collected data, contributed to the analysis and interpretation of data, and wrote the initial draft of the manuscript. LS contributed to the analysis and writing the manuscript. MO has contributed to data analysis and interpretation. AY contributed to the analysis and interpretation of data. AT designed the experiment and collected data. ES revised the draft of the manuscript. MH was main responsible for hypothesis making, general guidance and project management. The final version of the manuscript was approved by all the authors.
Conflict of Interest Statement
The authors declare that the research was conducted in the absence of any commercial or financial relationships that could be construed as a potential conflict of interest.
References
1. Verrotti A, Filippini M, Matricardi S, Agostinelli MF, Gobbi G. Memory impairment and benign epilepsy with centrotemporal spike (BECTS): a growing suspicion. Brain Cogn. (2014) 84:123–31. doi: 10.1016/j.bandc.2013.11.014
2. Matricardi S, Deleo F, Ragona F, Rinaldi VE, Pelliccia S, Coppola G, et al. Neuropsychological profiles and outcomes in children with new onset frontal lobe epilepsy. Epilepsy Behav. (2016) 55:79–83. doi: 10.1016/j.yebeh.2015.12.006
3. Salehi F, Sharma M, Peters TM, Khan AR. White matter tracts in patients with temporal lobe epilepsy: pre-and postoperative assessment. Cureus. (2017) 9:e1735. doi: 10.7759/cureus.1735
4. Äikiä M, Salmenperä T, Partanen K, Kälviäinen R. Verbal memory in newly diagnosed patients and patients with chronic left temporal lobe epilepsy. Epilepsy Behav. (2001) 2:20–7. doi: 10.1006/ebeh.2000.0140
5. Taylor J, Kolamunnage-Dona R, Marson AG, Smith PE, Aldenkamp AP, Baker GA, et al. Patients with epilepsy: cognitively compromised before the start of antiepileptic drug treatment? Epilepsia. (2010) 51:48–56. doi: 10.1111/j.1528-1167.2009.02195.x
6. Beltramini GC, Cendes F, Yasuda CL. The effects of antiepileptic drugs on cognitive functional magnetic resonance imaging. Q Imaging Med Surg. (2015) 5:238–246. doi: 10.3978/j.issn.2223-4292.2015.01.04
7. Eddy CM, Rickards HE. The cognitive impact of antiepileptic drugs. Ther Adv Neurol Disord. (2011) 4:385–407. doi: 10.1177/1756285611417920
8. Holmes GL. Cognitive impairment in epilepsy: the role of network abnormalities. Epileptic Disord. (2015) 17:101–16. doi: 10.1684/epd.2015.0739
9. Schulte JT, Wierenga CJ, Bruining H. Chloride transporters and GABA polarity in developmental, neurological and psychiatric conditions. Neurosci Biobehav Rev. (2018) 90:260–71. doi: 10.1016/j.neubiorev.2018.05.001
10. Talos DM, Sun H, Kosaras B, Joseph A, Folkerth RD, Poduri A, et al. Altered inhibition in tuberous sclerosis and type IIb cortical dysplasia. Ann Neurol. (2012) 71:539–51. doi: 10.1002/ana.22696
11. Hsu YT, Chang YG, Chen HM, Chern Y. Dysregulations of GABAergic neurotransmission in Huntington's disease brain [abstract]. Mov Disord. (2016) 31:S360.
12. Ben-Ari Y. NKCC1 chloride importer antagonists attenuate many neurological and psychiatric disorders. Trends Neurosci. (2017) 40:536–54. doi: 10.1016/j.tins.2017.07.001
13. Eftekhari S, Mehvari Habibabadi J, Najafi Ziarani M, Hashemi Fesharaki SS, Gharakhani M, Mostafavi H, et al. Bumetanide reduces seizure frequency in patients with temporal lobe epilepsy. Epilepsia. (2013) 54:e9–12. doi: 10.1111/j.1528-1167.2012.03654.x
14. Gharaylou Z, Tafakhori A, Agah E, Aghamollaii V, Kebriaeezadeh A, Hadjighassem M. A preliminary study evaluating the safety and efficacy of bumetanide, an NKCC1 inhibitor, in patients with drug-resistant epilepsy. CNS Drugs. (2019) 33:283–91. doi: 10.1007/s40263-019-00607-5
15. Deidda G, Parrini M, Naskar S, Bozarth IF, Contestabile A, Cancedda L. Reversing excitatory GABA A R signaling restores synaptic plasticity and memory in a mouse model of Down syndrome. Nat Med. (2015) 21:318. doi: 10.1038/nm.3827
16. Stevens RA, Butler BD, Kokane SS, Womack AW, Lin Q. Neonatal inhibition of Na+-K+-2Cl—cotransporter prevents ketamine induced spatial learning and memory impairments. Neurotoxicol Teratol. (2017) 60:82–6. doi: 10.1016/j.ntt.2016.11.001
17. Dargaei Z, Bang JY, Mahadevan V, Khademullah CS, Bedard S, Parfitt GM, et al. Restoring GABAergic inhibition rescues memory deficits in a Huntington's disease mouse model. Proc Natl Acad Sci. (2018) 115:E1618–26. doi: 10.1073/pnas.1716871115
18. Lemonnier E, Villeneuve N, Sonie S, Serret S, Rosier A, Roue M, et al. Effects of bumetanide on neurobehavioral function in children and adolescents with autism spectrum disorders. Transl Psychiatry. (2017) 7:e1056. doi: 10.1038/tp.2017.101
19. Hadjikhani N, Johnels JÅ, Lassalle A, Zürcher NR, Hippolyte L, Gillberg C, et al. Bumetanide for autism: more eye contact, less amygdala activation. Sci Rep. (2018) 8:3602. doi: 10.1038/s41598-018-21958-x
20. Vlaskamp C, Poil S-S, Jansen F, Linkenkaer-Hansen K, Durston S, Oranje B, et al. Bumetanide as a candidate treatment for behavioral problems in tuberous sclerosis complex. Front Neurol. (2017) 8:469. doi: 10.3389/fneur.2017.00469
21. Knake S, Roth C, Belke M, Sonntag J, Kniess T, Krach S, et al. Microstructural white matter changes and their relation to neuropsychological deficits in patients with juvenile myoclonic epilepsy. Epilepsy Behav. (2017) 76:56–62. doi: 10.1016/j.yebeh.2017.08.031.
22. Imfeld A, Oechslin MS, Meyer M, Loenneker T, Jancke L. White matter plasticity in the corticospinal tract of musicians: a diffusion tensor imaging study. Neuroimage. (2009) 46:600–7. doi: 10.1016/j.neuroimage.2009.02.025
23. Ahmadi ME, Hagler D, McDonald CR, Tecoma E, Iragui V, Dale AM, et al. Side matters: diffusion tensor imaging tractography in left and right temporal lobe epilepsy. Am J Neuroradiol. (2009) 30:1740–7. doi: 10.3174/ajnr.A1650
24. Imamura H, Matsumoto R, Takaya S, Nakagawa T, Shimotake A, Kikuchi T, et al. Network specific change in white matter integrity in mesial temporal lobe epilepsy. Epilepsy Res. (2016) 120:65–72. doi: 10.1016/j.eplepsyres.2015.12.003
25. Fjell AM, Sneve MH, Grydeland H, Storsve AB, Walhovd KB. The disconnected brain and executive function decline in aging. Cerebral Cortex. (2016) 27:2303–17. doi: 10.1093/cercor/bhw082
26. Fjell AM, Sneve MH, Grydeland H, Storsve AB, Amlien IK, Yendiki A, et al. Relationship between structural and functional connectivity change across the adult lifespan: a longitudinal investigation. Hum Brain Mapp. (2017) 38:561–73. doi: 10.1002/hbm.23403
27. Kwan P, Arzimanoglou A, Berg AT, Brodie MJ, Allen Hauser W, Mathern G, et al. Definition of drug resistant epilepsy: consensus proposal by the ad hoc task force of the ILAE commission on therapeutic strategies. Epilepsia. (2010) 51:1069–77. doi: 10.1111/j.1528-1167.2009.02397.x
28. Orosz I, McCormick D, Zamponi N, Varadkar S, Feucht M, Parain D, et al. Vagus nerve stimulation for drug-resistant epilepsy: a European long-term study up to 24 months in 347 children. Epilepsia. (2014) 55:1576–84. doi: 10.1111/epi.12762
29. Leemans A, Jones DK. The B-matrix must be rotated when correcting for subject motion in DTI data. Magn Reson Med. (2009) 61:1336–49. doi: 10.1002/mrm.21890
30. Graham MS, Drobnjak I, Zhang H. Realistic simulation of artefacts in diffusion MRI for validating post-processing correction techniques. NeuroImage. (2016) 125:1079–94. doi: 10.1016/j.neuroimage.2015.11.006
31. Yendiki A, Panneck P, Srinivasan P, Stevens A, Zöllei L, Augustinack J, et al. Automated probabilistic reconstruction of white-matter pathways in health and disease using an atlas of the underlying anatomy. Front Neuroinform. (2011) 5:23. doi: 10.3389/fninf.2011.00023
32. Buchsbaum MS, Hollander E, Pallanti S, Rossi NB, Platholi J, Newmark R, et al. Positron emission tomography imaging of risperidone augmentation in serotonin reuptake inhibitor-refractory patients. Neuropsychobiology. (2006) 53:157–68. doi: 10.1159/000093342
33. Berm EJ, de Looff M, Wilffert B, Boersma C, Annemans L, Vegter S, et al. Economic evaluations of pharmacogenetic and pharmacogenomic screening tests: a systematic review. Second update of the literature. PloS ONE. (2016) 11:e0146262. doi: 10.1371/journal.pone.0146262
34. Yendiki A, Koldewyn K, Kakunoori S, Kanwisher N, Fischl B. Spurious group differences due to head motion in a diffusion MRI study. Neuroimage. (2014) 88:79–90. doi: 10.1016/j.neuroimage.2013.11.027
35. Schiller Y, Najjar Y. Quantifying the response to antiepileptic drugs: effect of past treatment history. Neurology. (2008) 70:54–65. doi: 10.1212/01.wnl.0000286959.22040.6e
36. Fewlass DC, Noboa K, Pi-Sunyer FX, Johnston JM, Yan SD, Tezapsidis N. Obesity-related leptin regulates Alzheimer's Aβ. FASEB J. (2004) 18:1870–8. doi: 10.1096/fj.04-2572com
37. Cohen MR, Hinsch E, Vergona R, Ryan J, Kolis SJ, Schwartz MA. A comparative diuretic and tissue distribution study of bumetanide and furosemide in the dog. J Pharmacol Exp Ther. (1976) 197:697–702.
38. Puskarjov M, Kahle KT, Ruusuvuori E, Kaila K. Pharmacotherapeutic targeting of cation-chloride cotransporters in neonatal seizures. Epilepsia. (2014) 55:806–18. doi: 10.1111/epi.12620
39. Lemonnier E, Lazartigues A, Ben-Ari Y. Treating schizophrenia with the diuretic bumetanide: a case report. Clin Neuropharmacol. (2016) 39:115–7. doi: 10.1097/WNF.0000000000000136
40. Rahmanzadeh R, Eftekhari S, Shahbazi A, Khodaei AM, Rahmanzade R, Mehrabi S, et al. Effect of bumetanide, a selective NKCC1 inhibitor, on hallucinations of schizophrenic patients; a double-blind randomized clinical trial. Schizophr Res. (2017) 184:145. doi: 10.1016/j.schres.2016.12.002
41. Canitano R. Mood stabilizers in children and adolescents with autism spectrum disorders. Clin Neuropharmacol. (2015) 38:177–82. doi: 10.1097/WNF.0000000000000096
42. Damier P, Hammond C, Ben-Ari Y. Bumetanide to treat Parkinson disease: a report of 4 cases. Clin Neuropharmacol. (2016) 39:57–9. doi: 10.1097/WNF.0000000000000114
43. Dzhala VI, Talos DM, Sdrulla DA, Brumback AC, Mathews GC, Benke TA, et al. NKCC1 transporter facilitates seizures in the developing brain. Nat Med. (2005) 11:1205. doi: 10.1038/nm1301
44. Kilb W, Sinning A, Luhmann H. Model-specific effects of bumetanide on epileptiform activity in the in-vitro intact hippocampus of the newborn mouse. Neuropharmacology. (2007) 53:524–33. doi: 10.1016/j.neuropharm.2007.06.015
45. Sivakumaran S, Maguire J. Bumetanide reduces seizure progression and the development of pharmacoresistant status epilepticus. Epilepsia. (2016) 57:222–32. doi: 10.1111/epi.13270
46. Rogawski MA, Cavazos JE. Mechanisms of action of antiepileptic drugs. In: Wyllie E, editor. Wyllie's Treatment of Epilepsy: Principles and Practice, 6th ed. New York, NY: Professional Communications, Inc; A Medical Publishing & Communications Company (2015). pp. 522–9.
47. Piplani S, Verma PK, Kumar A. Neuroinformatics analyses reveal GABAt and SSADH as major proteins involved in anticonvulsant activity of valproic acid. Biomed Pharmacother. (2016) 81:402–10. doi: 10.1016/j.biopha.2016.04.036
48. Laeng P, Pitts RL, Lemire AL, Drabik CE, Weiner A, Tang H, et al. The mood stabilizer valproic acid stimulates GABA neurogenesis from rat forebrain stem cells. J Neurochem. (2004) 91:238–51. doi: 10.1111/j.1471-4159.2004.02725.x
49. Ostroumov A, Thomas AM, Kimmey BA, Karsch JS, Doyon WM, Dani JA. Stress increases ethanol self-administration via a shift toward excitatory GABA signaling in the ventral tegmental area. Neuron. (2016) 92:493–504. doi: 10.1016/j.neuron.2016.09.029
50. Foroutan S, Brillault J, Forbush B, O'Donnell ME. Moderate to severe ischemic conditions increase activity and phosphorylation of the cerebral microvascular endothelial cell Na-K-Cl cotransporter. Am J Physiol Cell Physiol. (2005) 289:C1492–501. doi: 10.1152/ajpcell.00257.2005
51. Lam TI, Anderson SE, Glaser N, O'Donnell ME. Bumetanide reduces cerebral edema formation in rats with diabetic ketoacidosis. Diabetes. (2005) 54:510–6. doi: 10.2337/diabetes.54.2.510
52. Briellmann RS, Wellard RM, Jackson GD. Seizure-associated abnormalities in epilepsy: evidence from MR imaging. Epilepsia. (2005) 46:760–6. doi: 10.1111/j.1528-1167.2005.47604.x
53. Nash TE, Pretell EJ, Lescano AG, Bustos JA, Gilman RH, Gonzalez AE, et al. Perilesional brain oedema and seizure activity in patients with calcified neurocysticercosis: a prospective cohort and nested case-control study. Lancet Neurol. (2008) 7:1099–105. doi: 10.1016/S1474-4422(08)70243-6
54. Arfanakis K, Hermann BP, Rogers BP, Carew JD, Seidenberg M, Meyerand ME. Diffusion tensor MRI in temporal lobe epilepsy. Magn Resonan Imaging. (2002) 20:511–9. doi: 10.1016/S0730-725X(02)00509-X
55. Song S-K, Sun S-W, Ju W-K, Lin S-J, Cross AH, Neufeld AH. Diffusion tensor imaging detects and differentiates axon and myelin degeneration in mouse optic nerve after retinal ischemia. Neuroimage. (2003) 20:1714–22. doi: 10.1016/j.neuroimage.2003.07.005
56. Billiet T, Emsell L, Vandenbulcke M, Peeters R, Christiaens D, Leemans A, et al. Recovery from chemotherapy-induced white matter changes in young breast cancer survivors? Brain Imaging Behav. (2018) 12:64–77. doi: 10.1007/s11682-016-9665-8
57. Necus J, Sinha N, Smith FE, Thelwall PE, Flowers CJ, Taylor PN, et al. White matter microstructural properties in bipolar disorder in relationship to the spatial distribution of lithium in the brain. J. Affect. Disord. (2019) 253:224–31. doi: 10.1016/j.jad.2019.04.075
58. Winston GP, Stretton J, Sidhu MK, Symms MR, Duncan JS. Progressive white matter changes following anterior temporal lobe resection for epilepsy. NeuroImage Clin. (2014) 4:190–200. doi: 10.1016/j.nicl.2013.12.004
59. Laufs H. Functional imaging of seizures and epilepsy: evolution from zones to networks. Curr Opin Neurol. (2012) 25:194–200. doi: 10.1097/WCO.0b013e3283515db9
60. Tuladhar AM, Reid AT, Shumskaya E, de Laat KF, van Norden AG, van Dijk EJ, et al. Relationship between white matter hyperintensities, cortical thickness, and cognition. Stroke. (2015) 46:425–32. doi: 10.1161/STROKEAHA.114.007146
61. Kreilkamp BA, Weber B, Richardson MP, Keller SS. Automated tractography in patients with temporal lobe epilepsy using TRActs Constrained by UnderLying Anatomy. (TRACULA). NeuroImage Clin. (2017) 14:67–76. doi: 10.1016/j.nicl.2017.01.003
62. Burzynska AZ, Jiao Y, Knecht AM, Fanning J, Awick EA, Chen T, et al. White matter integrity declined over 6-months, but dance intervention improved integrity of the fornix of older adults. Front Aging Neurosci. (2017) 9:59. doi: 10.3389/fnagi.2017.00059
63. Subramaniam K, Gill J, Fisher M, Mukherjee P, Nagarajan S, Vinogradov S. White matter microstructure predicts cognitive training-induced improvements in attention and executive functioning in schizophrenia. Schizophr Res. (2018) 193:276–83. doi: 10.1016/j.schres.2017.06.062
64. Focke NK, Diederich C, Helms G, Nitsche MA, Lerche H, Paulus W. Idiopathic-generalized epilepsy shows profound white matter diffusion-tensor imaging alterations. Hum Brain Mapp. (2014) 35:3332–42. doi: 10.1002/hbm.22405
65. Whelan CD, Alhusaini S, O'hanlon E, Cheung M, Iyer PM, Meaney JF, et al. White matter alterations in patients with MRI-negative temporal lobe epilepsy and their asymptomatic siblings. Epilepsia. (2015) 56:1551–61. doi: 10.1111/epi.13103
66. Perry BA, Mercer SA, Barnett SC, Lee J, Dalrymple-Alford JC. Anterior thalamic nuclei lesions have a greater impact than mammillothalamic tract lesions on the extended hippocampal system. Hippocampus. (2018) 28:121–35. doi: 10.1002/hipo.22815
67. Han M-R, Han K-M, Kim A, Kang W, Kang Y, Kang J, et al. Whole-exome sequencing identifies variants associated with structural MRI markers in patients with bipolar disorders. J Affect Disord. (2019) 249:159–68. doi: 10.1016/j.jad.2019.02.028
Keywords: bumetanide, drug-resistant epilepsy, GABA, TRACULA, cognitive function
Citation: Gharaylou Z, Shafaghi L, Oghabian MA, Yoonessi A, Tafakhori A, Shahsavand Ananloo E and Hadjighassem M (2019) Longitudinal Effects of Bumetanide on Neuro-Cognitive Functioning in Drug-Resistant Epilepsy. Front. Neurol. 10:483. doi: 10.3389/fneur.2019.00483
Received: 29 January 2019; Accepted: 23 April 2019;
Published: 08 May 2019.
Edited by:
Edoardo Ferlazzo, Università degli Studi Magna Græcia di Catanzaro, ItalyReviewed by:
Dinesh Upadhya, Manipal Academy of Higher Education, IndiaAlberto Verrotti, University of L'Aquila, Italy
Copyright © 2019 Gharaylou, Shafaghi, Oghabian, Yoonessi, Tafakhori, Shahsavand Ananloo and Hadjighassem. This is an open-access article distributed under the terms of the Creative Commons Attribution License (CC BY). The use, distribution or reproduction in other forums is permitted, provided the original author(s) and the copyright owner(s) are credited and that the original publication in this journal is cited, in accordance with accepted academic practice. No use, distribution or reproduction is permitted which does not comply with these terms.
*Correspondence: Mahmoudreza Hadjighassem, bWhhZGppZ2hhc3NlbUB0dW1zLmFjLmly