 Hang Joon Jo1,2,3*
 Daniel L. Kenney-Jung1Irena Balzekas1
 Kirk M. Welker3
 David T. Jones1,3
 Paul E. Croarkin4Eduardo E. Benarroch1
 Gregory A. Worrell1*
- 1Department of Neurology, Mayo Clinic, Rochester, MN, United States
- 2Department of Neurologic Surgery, Mayo Clinic, Rochester, MN, United States
- 3Department of Radiology, Mayo Clinic, Rochester, MN, United States
- 4Department of Psychiatry and Psychology, Mayo Clinic, Rochester, MN, United States
Background: We compared resting-state functional connectivity (RSFC) among limbic and temporal lobe regions between patients with medial temporal lobe epilepsy (mTLE) and healthy control subjects to identify imaging evidence of functional networks related to seizure frequency, age of seizure onset, and duration of epilepsy.
Methods: Twelve patients with drug-resistant, unilateral medial temporal lobe epilepsy and 12 healthy control subjects matched for age, sex, and handedness participated in the imaging experiments. We used network-based statistics to compare functional connectivity graphs in patients with mTLE and healthy controls to investigate the relationship between functional connectivity abnormalities and seizure frequency.
Results: Among mTLE patients, we found functional network abnormalities throughout the limbic system, but primarily in the hemisphere ipsilateral to the seizure focus. The RSFCs between ipsilateral hypothalamus and ventral anterior cingulate cortex and between ipsilateral subiculum and contralateral posterior cingulate cortex were highly correlated with seizure frequency.
Discussion: These findings suggest that in mTLE, changes in limbic networks ipsilateral to the epileptic focus are common. The pathological changes in connectivity between cingulate cortex, hypothalamus and subiculum ipsilateral to the seizure focus were correlated with increased seizure frequency.
Introduction
The limbic system of the brain is a complex network of structurally and functionally linked anatomic regions (1). Among its components are areas in anteromedial temporal lobe including the amygdala, hippocampal complex, and entorhinal cortex, as well as the cingulate cortex. These areas are interconnected with each other via the thalamus (particularly the anterior thalamic and medial dorsal nuclear groups as well as the midline thalamic nuclear group), and project to the hypothalamus and midbrain, and anteromedial temporal lobe. The limbic system is an important component of the systems subserving emotion, behavior, and memory. In patients with medial temporal lobe epilepsy (mTLE), perturbations of the limbic system often result in in debilitating comorbidities and functional impairments in addition to the direct consequences of seizures.
The role of the limbic system in epilepsy is well-described, with mTLE frequently involving limbic structures and the pathological hallmark of hippocampal sclerosis (2–4). The limbic system's physiologic ability to produce and propagate synchronized activity during normal cognition makes the limbic system an ideal environment for the propagation of pathological synchronization during a seizure (5). Given the role of the limbic system in long-term recall and in emotion, it has been postulated that the high prevalence of memory, mood, and affective symptoms among patients with mTLE correlates with a disruption of normal limbic function (5–7).
Networks throughout the brain are altered in epilepsy. Network changes have been associated with cognitive decline, seizure onset zone locations, and surgical outcomes (8, 9). For example, increased thalamic “hubness” (the importance of a node in a network) prior to anterior temporal lobectomy surgery is associated with increased risk of seizure recurrence after surgery (10). Effective connectivity inferred by dynamical causal modeling has suggested that strengthened connectivity between the hippocampus and parahippocampal gyrus is associated with poor seizure control in TLE (11). Despite promising associations between limbic circuitry and clinical features, the contribution of limbic connectivity to actual seizure burden remains unclear.
To identify resting-state functional connectivity (RS FC) features associated with seizure frequency, we assessed limbic and temporal RS FC in mTLE patients and healthy controls. We used network-based statistics to identify functional connectivity abnormalities in the limbic system, and to find a relationship between those abnormalities and seizure frequency. By identifying the networks underlying clinical presentations of epilepsy, we may better target neuromodulatory approaches to the circuit components either potentiating or regulating epileptic networks.
Materials and Methods
Participants and Clinical Scores
Consecutive mTLE patients who underwent comprehensive epilepsy evaluations including EEG monitoring at the Mayo Clinic Epilepsy Center were identified from an epilepsy research database. Twelve patients (five females) with unilateral mTLE (Table 1) and 12 healthy control subjects (Table 2), matched to the mTLE subjects by age, gender, and handedness, were studied. The control subjects were free of neurological and psychological disease. All participants provided written, informed consent in accordance with research protocols approved by the institutional review board of Mayo Clinic. We collected the numbers of seizures per month during the 3 months preceding the MRI scan as a quantitative score of disease burden. Structural MRI data were reviewed for all subjects to assess for neuroradiological abnormalities. A board certified psychiatrist (PEC) retrospectively reviewed all clinical records to ascertain if subjects had a co-occurring psychiatric disorder. In mTLE group, there were 8 subjects with neuroradiological abnormalities and 9 subjects with psychiatric disorders.
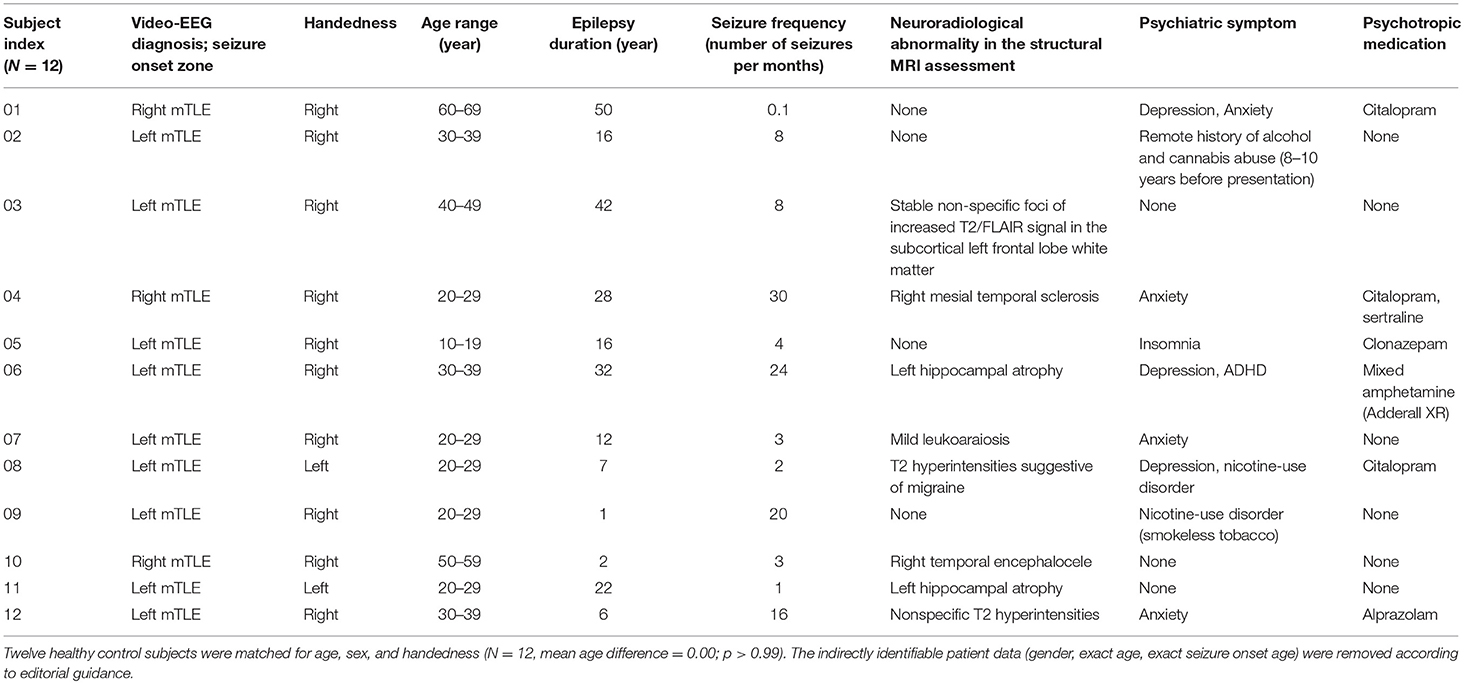
Table 1. Demographic information for participants with medial temporal lobe epilepsy (mTLE).
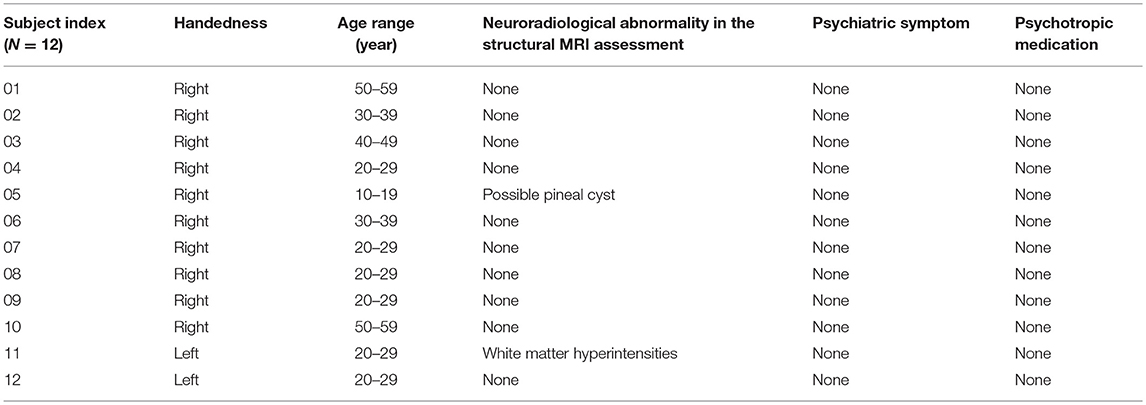
Table 2. Demographic information for healthy control subjects (five females).
Image Acquisition
Anatomical and functional MRI images were acquired in all subjects on a Siemens 3T Magnetom Skyra system using a 32-channel array head coil and tetrahedron-shaped foam pads to minimize head movement. High-resolution structural whole-brain images were acquired using a T1-weighted sequence with 0.5 × 0.5 × 1.2 mm3 resolution, TR = 2.3 s, TI = 0.9 s, TE = 1.96 ms, and FA = 9°. Subjects were instructed to keep their eyes open during which resting-state (RS) functional magnetic resonance imaging (FMRI) data were acquired by using a gradient echo-planar sequence sensitive to blood oxygenation level-dependent contrast with 3.28 × 3.28 × 3.3 mm3 resolution, 50 slices, TR = 2.9 s, TE = 30 ms, FA = 90°, and total acquisition time of 464 s.
Preprocessing of Imaging Data
Preprocessing of all imaging data was conducted using the Analysis of Functional NeuroImages (AFNI) software package (http://afni.nimh.nih.gov). The RS FMRI data were preprocessed and denoised by the standard protocol of the AFNI package (12–14). Using the robust non-linear warping function of the AFNI package, all T1 anatomy data were registered to the MNI152-T1-2009c atlas of the Montreal Neurological Institute and linearly resampled in the 1 mm isocubic grid space. The EPI data were aligned to the T1 images, and then warped to the template brain space along with their T1 images. The registration results for the image data of all subjects were visually inspected for subcortical and cortical brain structures1. Note that the imaging data of three mTLE patients with seizure foci in the right hemisphere were left-right flipped before the preprocessing, to match the ipsi- and contra-lateral concept of the analysis. The terms “ipsilateral” and “contralateral” hemispheres stand, respectively for the hemisphere of seizure onset and the hemisphere opposite the side of seizure onset.
Functional Connectivity Analysis
For the functional network analysis (16, 17), masks for regions-of-interest (ROIs) in the limbic system and temporal lobe structures were defined by multiple atlases (18–21), with reference to existing studies of animal seizure models and human patients (22, 23). The entire list of ROIs and the atlas details are presented in Figure 1A and Table 3. The RS FMRI time series were separately averaged in each ROI mask, and then a Pearson correlation matrix between those was calculated as the network data of each individual subject (by a permutation test for 10,000 iterations with random network extents). A total of 253 RSFCs between ROI pairs were calculated for each subject. The group difference graph between healthy control and mTLE groups were also determined by a two-sample t-test with a threshold level at the family-wise-error-corrected p < 0.01 (16).
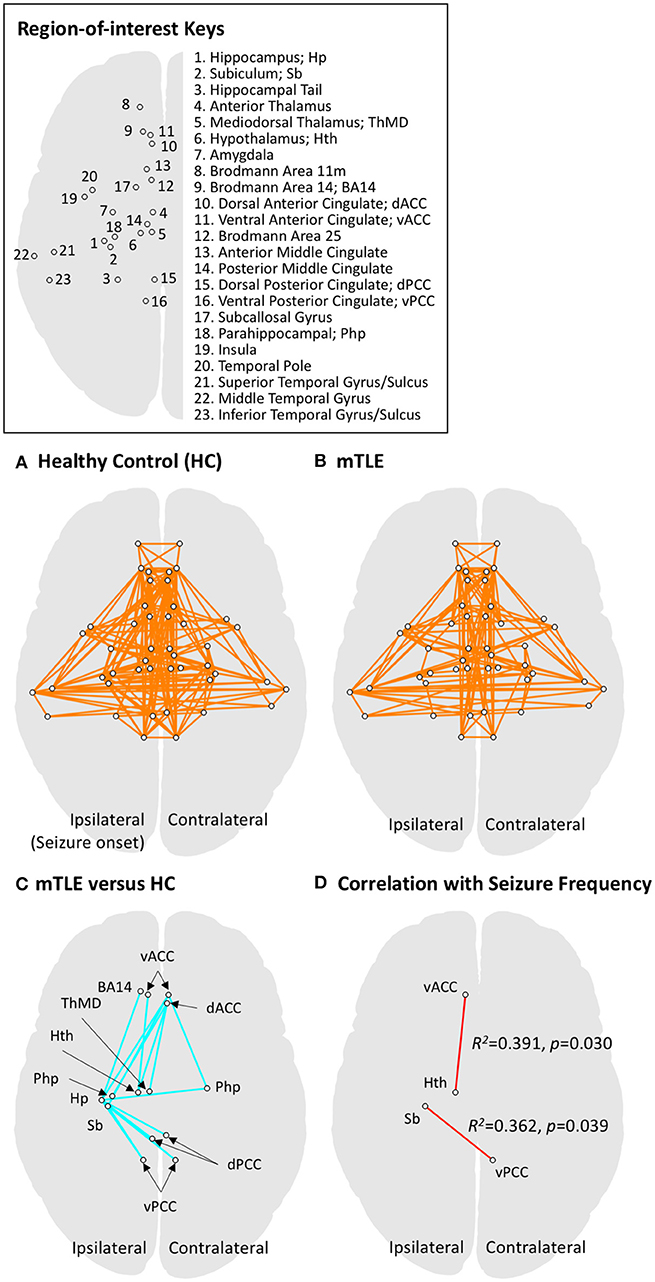
Figure 1. Functional connectivity results for regions of interest (ROIs) in the limbic system and temporal lobe. ROIs in limbic and temporal lobe areas were investigated using network-level analysis (also see Table 3 for details on defining ROIs). (A) The graphical representation of functional networks in limbic and temporal lobe regions for the healthy controls (HC), derived by one-sample t-test to the zero mean with a threshold level at pFWER−corrected < 0.001. Circles connected by a line represent a pair of ROI nodes and their functional connection. Anatomical labels for the nodes (circles) are described in the upper right panel. (B) The graphical representation of functional networks in drug-resistant medial temporal lobe epilepsy (mTLE). The same statistical approach to panel A was applied. The mTLE patients showed decreased limbic functional connectivity relative to the HC group. The functional connectivity among limbic networks and temporal lobe regions, however, showed less change compared to intra-limbic connectivity changes. (C) Group difference between functional networks in HC and mTLE groups. A two-sample t-test was performed with a threshold level at pFWER−corrected < 0.01. The intra-limbic connectivity between ipsilateral hippocampus, subiculum, hypothalamus, mediodorsal thalamus, ventromedial prefrontal cortex (BA14), bilateral parahippocampal gyri, ventral anterior, dorsal and ventral posterior cingulate cortices, and contralateral dorsal anterior cingulate cortex are decreased in the mTLE group. (D) The functional networks significantly correlated with seizure frequency in mTLE patients at a threshold level of p < 0.05. Functional connectivity between ipsilateral ventral anterior cingulate cortex and hypothalamus, and that between ipsilateral subiculum and contralateral ventral posterior cingulate cortex showed significant correlation with seizure frequency. The ROI pairs (circles) in limbic system, showing significant difference in functional connectivity between mTLE and HC groups are also summarized in the Table 4.
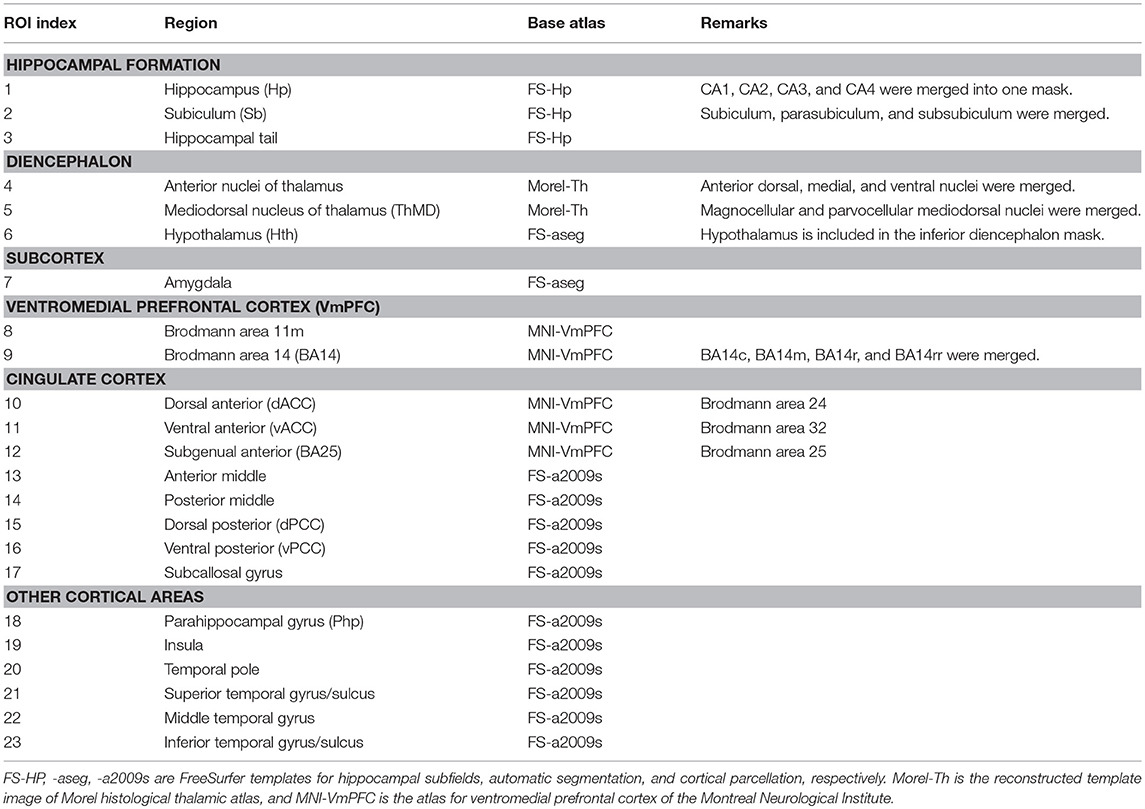
Table 3. Definition of regions-of-interest (ROIs) in limbic structures and seizure-relevant areas for the network-level analysis.
Correlation Analysis With Clinical Scores
We selected ROI pairs with significant group difference in their RSFC, and then performed a linear regression analysis to find correlations between functional connectivity of those selected ROI pairs and the seizure frequency for mTLE patients. R2 values were obtained by the linear regression function of MATLAB (version 2016a, The MathWorks, Inc., Natick, MA.).
Results
Functional Connectivity Difference Between mTLE and Healthy Control Groups
A total of 253 connections between ROI pairs were considered for group comparisons, and significant connectivity at the threshold level of pFWE−corrected < 0.001 was observed in 17 and 13% of the total ROI pairs in the healthy control and mTLE group, respectively (Figures 1A,B). The mTLE patients showed decreased functional connectivity in the 17 ROI pairs of the limbic system, relative to the healthy control group, by a two-sample t-test with the default threshold level of the NBS tool (pFWE−corrected < 0.01). Specifically, the mTLE groups showed diminished intra-limbic connectivity between ipsilateral hippocampus, subiculum, hypothalamus, mediodorsal thalamus, ventromedial prefrontal cortex (BA14), bilateral parahippocampal gyri, ventral anterior, dorsal and ventral posterior cingulate cortices, and contralateral dorsal anterior cingulate cortex (Figures 1C). The functional connectivity between limbic structures and temporal lobe regions showed less change compared to intra-limbic connectivity changes.
Correlations Between RSFC and Clinical Scores
Two out of 17 limbic ROI pairs, had a significant correlation between their RSFCs and seizure frequency at the threshold level of p < 0.05: ipsilateral ventral anterior cingulate cortex and hypothalamus (R2 = 0.391, p = 0.030) and ipsilateral subiculum and contralateral ventral posterior cingulate cortex (R2 = 0.362, p = 0.039) (Figure 1C). The results of group comparisons and their correlation with seizure frequency are summarized in the Table 4 and Figure 1D.
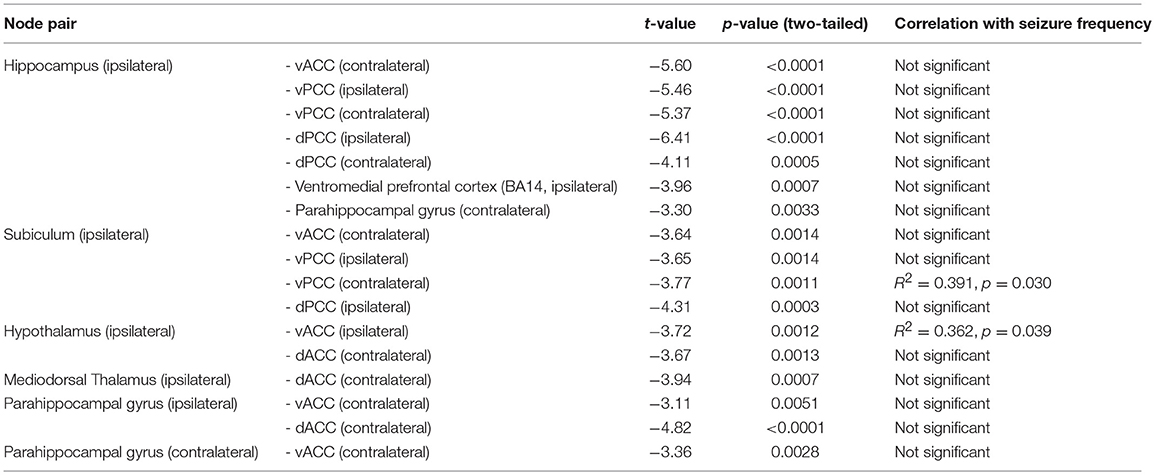
Table 4. The ROI pairs (circles) in limbic system, showing significant difference in functional connectivity between mTLE and HC groups.
Discussion
In this study, we compared RS FC in patients with mTLE and healthy controls. Using network-based statistics, we identified connectivity changes associated with mTLE and with seizure frequency in mTLE. RS FC within the limbic system decreased in mTLE, more so than limbic—temporal connectivity. These network abnormalities primarily affected the hemisphere ipsilateral to the seizure focus. Seizure frequency correlated with RS FC between ipsilateral hypothalamus and ventral anterior cingulate cortex and between ipsilateral subiculum and contralateral posterior cingulate cortex.
Our findings are consistent with the observed decrease in functional connectivity between limbic areas in mTLE patients, which is particularly pronounced in the hemisphere ipsilateral to the seizure focus (22, 23). It is possible that the decrease in functional connectivity reflects underlying limbic pathology in the mTLE group through hypothalamus-to-mediodorsal-thalamus and hippocampus/subiculum-to-cingulate-cortex pathways (24, 25). These changes would be consistent with the affective, memory, and cognitive/behavioral symptoms experienced by mTLE patients (2).
It is also possible that the decrease in limbic RS FC is compensatory. It may be speculated that decreasing functional connectivity ipsilateral to the seizure focus helps limit the participation of the abnormal temporal lobe in limbic circuitry, thereby preserving some measure of normal limbic function. The findings reported here for FMRI connectivity are consistent with studies using intracranial electrocorticography, which show that brain regions generating seizures are functionally isolated from surrounding brain regions (26, 27).
It is unclear why connectivity pairs in the cingulate cortex and hypothalamus and in the cingulate cortex and subiculum emerged as associated with seizure frequency. Previous network studies have focused on the clinical outcome of seizure freedom and not seizure frequency. One study of seizure propagation networks showed that seizure freedom associated with decreased functional connectivity in bilateral midline structures including the precuneus and midcingulate (28). This finding, together with our observation that select cingulate connectivity features are associated with seizure frequency, may implicate midline connectivity as an overall indicator of limbic network health. Importantly, without larger studies pooling subjects with similar disease courses, this proposal is purely speculative.
With the limbic system acting as a centerpoint for a range of cognitive and seizure-related processes, broader network changes may help explain the role of specific limbic regions in epilepsy (29). A pilot study of functional connectivity in deep brain stimulation (DBS) for epilepsy has suggested that patients who respond to DBS at the anterior nucleus of the thalamus have increased thalamic connectivity to the DMN (30). Intrinsic DMN connectivity increases prior to inter-ictal epileptiform discharges in TLE before returning to its baseline, decreased connectivity after the discharge (31). Further study of how paired connectivity features interact with other resting-state functional networks is warranted.
The primary limitation of this study was the small sample size. We did not conduct structured psychiatric interviews for this study and only retrospectively collected psychiatric histories from the medical record. Future efforts building on the present work will include prospective and comprehensive structured psychiatric assessments. A deeper understanding of the cause and nature of limbic connectivity in patients with mTLE may prove important in treating mTLE and the comorbidities associated with limbic network dysfunction. Also, we flipped the EPI data for left-handed subjects, but there are reports showing that mTLE patients have different behaviors regarding to the anatomical and functional features on the laterality (32–34). To observe more details on the laterality of mTLE connectivity, the further investigation with larger cohorts is required.
In conclusion, we identified functional connectivity changes associated with mTLE and cingulate and limbic network connectivity abnormalities that correlated with increased seizure frequency.
Ethics Statement
All participants provided written, informed consent in accordance with research protocols approved by the institutional review board of Mayo Clinic.
Author Contributions
HJ, KW, IB, and GW: design and conceptualization of the study. HJ, DK-J, PC, EB, and GW: analysis and interpretation of the data. HJ, IB, and DK-J: drafting the manuscript for intellectual content. PC, DJ, EB, GW, and IB: revising the manuscript for intellectual content. KW and DJ: major role in the acquisition of data.
Funding
This study was funded by National Institutes of Health (R01 NS092882, UH2-NS95495), Project LQ1605 National Program of Sustainability II (MEYS CR), and European Regional Development Fund - Project FNUSA - ICRC (CZ.1.05/1.1.00/02.0123). PC is supported by the National Institutes of Health under award R01 MH113700. The content of this publication is solely the responsibility of the authors and does not necessarily represent the official views of the National Institutes of Health.
Conflict of Interest Statement
The authors declare that the research was conducted in the absence of any commercial or financial relationships that could be construed as a potential conflict of interest.
Acknowledgments
The Thalamus Atlas is copyrighted by © University of Zurich and ETH Zurich, Axel Krauth, Rémi Blanc, Alejandra Poveda, Daniel Jeanmonod, Anne Morel, Gábor Székely. The authors also acknowledge the Mayo High Performance Research Computing Facility (RCF) at Mayo Clinic in Rochester, MN, for providing computational resources.
Footnotes
1. ^Aside from the visual inspection to assess thalamic atrophy, recent studies using quantitative MRI analyses have reported global as well as segmental thalamic atrophy in TLE [see (15) for review].”
References
1. Papez JW. A proposed mechanism of emotion. 1937. J Neuropsychiatry Clin Neurosci. (1995) 7:103–12. doi: 10.1176/jnp.7.1.103
3. Finegersh A, Avedissian C, Shamim S, Dustin I, Thompson PM, Theodore WH. Bilateral hippocampal atrophy in temporal lobe epilepsy: effect of depressive symptoms and febrile seizures. Epilepsia. (2011) 52:689–97. doi: 10.1111/j.1528-1167.2010.02928.x
4. Blumenfeld H. Impaired consciousness in epilepsy. Lancet Neurol. (2012) 11:814–26. doi: 10.1016/S1474-4422(12)70188-6
5. Jefferys JGR, Jiruska P, De Curtis M, Avoli M. Limbic Network Synchronization and Temporal Lobe Epilepsy. In: Th JL, Noebels M, Avoli MA, Rogawski RW, Olsen AV, Delgado-Escueta, editors. Jasper's Basic Mechanisms of the Epilepsies. Bethesda, MD: National Institutes of Health (2012).
6. Hermann BP, Seidenberg M, Schoenfeld J, Davies K. Neuropsychological characteristics of the syndrome of mesial temporal lobe epilepsy. Arch Neurol. (1997) 54:369–76. doi: 10.1001/archneur.1997.00550160019010
7. Kanner AM. Mood disorder and epilepsy: a neurobiologic perspective of their relationship. Dialogues Clin Neurosci. (2008) 10:39–45. Available online at: https://www.dialogues-cns.org/contents-10-1/
8. Chiang S, Haneef Z. Graph theory findings in the pathophysiology of temporal lobe epilepsy. Clin Neurophysiol. (2014) 125:1295–305. doi: 10.1016/j.clinph.2014.04.004
9. Haneef Z, Chiang S. Clinical correlates of graph theory findings in temporal lobe epilepsy. Seizure. (2014) 23:809–18. doi: 10.1016/j.seizure.2014.07.004
10. He X, Doucet GE, Pustina D, Sperling MR, Sharan AD, Tracy JI. Presurgical thalamic “hubness” predicts surgical outcome in temporal lobe epilepsy. Neurology. (2017) 88:2285–93. doi: 10.1212/WNL.0000000000004035
11. Park C-H, Choi YS, Kim HJ, Chung H-K, Jung A-R, Yoo JH, et al. Interactive effects of seizure frequency and lateralization on intratemporal effective connectivity in temporal lobe epilepsy. Epilepsia. (2018) 59:215–25. doi: 10.1111/epi.13951
12. Jo HJ, Saad ZS, Simmons WK, Milbury LA, Cox RW. Mapping sources of correlation in resting state FMRI, with artifact detection and removal. Neuroimage. (2010) 52:571–82. doi: 10.1016/j.neuroimage.2010.04.246
13. Gotts SJ, Jo HJ, Wallace GL, Saad ZS, Cox RW, Martin A. Two distinct forms of functional lateralization in the human brain. Proc Natl Acad Sci USA. (2013) 110:E3435–44. doi: 10.1073/pnas.1302581110
14. Jo HJ, Gotts SJ, Reynolds RC, Bandettini PA, Martin A, Cox RW, et al. Effective preprocessing procedures virtually eliminate distance-dependent motion artifacts in resting state FMRI. J Appl Mathemat. (2013) 2013:935154. doi: 10.1155/2013/935154
15. Bonilha L, Keller SS. Quantitative MRI in refractory temporal lobe epilepsy: relationship with surgical outcomes. Quant Imaging Med Surg. (2015) 5:204–24. doi: 10.3978/j.issn.2223-4292.2015.01.01
16. Zalesky A, Fornito A, Bullmore ET. Network-based statistic: identifying differences in brain networks. Neuroimage. (2010) 53:1197–207. doi: 10.1016/j.neuroimage.2010.06.041
17. Chiang S, Stern JM, Engel J Jr, Levin HS, Haneef Z. Differences in graph theory functional connectivity in left and right temporal lobe epilepsy. Epilepsy Res. (2014) 108:1770–81. doi: 10.1016/j.eplepsyres.2014.09.023
18. Destrieux C, Fischl B, Dale A, Halgren E. Automatic parcellation of human cortical gyri and sulci using standard anatomical nomenclature. Neuroimage. (2010) 53:1–15. doi: 10.1016/j.neuroimage.2010.06.010
19. Krauth A, Blanc R, Poveda A, Jeanmonod D, Morel A, Szekely G. A mean three-dimensional atlas of the human thalamus: generation from multiple histological data. Neuroimage. (2010) 49:2053–62. doi: 10.1016/j.neuroimage.2009.10.042
20. Mackey S, Petrides M. Architecture and morphology of the human ventromedial prefrontal cortex. Eur J Neurosci. (2014) 40:2777–96. doi: 10.1111/ejn.12654
21. Iglesias JE, Augustinack JC, Nguyen K, Player CM, Player A, Wright M, et al. A computational atlas of the hippocampal formation using ex vivo, ultra-high resolution MRI: application to adaptive segmentation of in vivo MRI. Neuroimage. (2015) 115:117–37. doi: 10.1016/j.neuroimage.2015.04.042
22. Bharath RD, Sinha S, Panda R, Raghavendra K, George L, Chaitanya G, et al. Seizure frequency can alter brain connectivity: evidence from resting-state fMRI. AJNR Am J Neuroradiol. (2015) 36:1890–8. doi: 10.3174/ajnr.A4373
23. Gill RS, Mirsattari SM, Leung LS. Resting state functional network disruptions in a kainic acid model of temporal lobe epilepsy. Neuroimage Clin. (2017) 13:70–81. doi: 10.1016/j.nicl.2016.11.002
24. Bertram EH, Mangan PS, Zhang D, Scott CA, Williamson JM. The midline thalamus: alterations and a potential role in limbic epilepsy. Epilepsia. (2001) 42:967–78. doi: 10.1046/j.1528-1157.2001.042008967.x
25. Maccotta L, He BJ, Snyder AZ, Eisenman LN, Benzinger TL, Ances BM, et al. Impaired and facilitated functional networks in temporal lobe epilepsy. Neuroimage Clin. (2013) 2:862–72. doi: 10.1016/j.nicl.2013.06.011
26. Warren CP, Hu S, Stead M, Brinkmann BH, Bower MR, Worrell GA. Synchrony in normal and focal epileptic brain: the seizure onset zone is functionally disconnected. J Neurophysiol. (2010) 104:3530–9. doi: 10.1152/jn.00368.2010
27. Burns SP, Santaniello S, Yaffe RB, Jouny CC, Crone NE, Bergey GK, et al. Network dynamics of the brain and influence of the epileptic seizure onset zone. Proc Natl Acad Sci USA. (2014) 111:E5321–30. doi: 10.1073/pnas.1401752111
28. Morgan VL, Englot DJ, Rogers BP, Landman BA, Cakir A, Abou-Khalil BW, et al. Magnetic resonance imaging connectivity for the prediction of seizure outcome in temporal lobe epilepsy. Epilepsia. (2017) 58:1251–60. doi: 10.1111/epi.13762
29. Widjaja E, Zamyadi M, Raybaud C, Snead OC, Doesburg SM, Smith ML. Disrupted global and regional structural networks and subnetworks in children with localization-related epilepsy. Am J Neuroradiol. (2015) 36:1362–8. doi: 10.3174/ajnr.A4265
30. Middlebrooks EH, Grewal SS, Stead M, Lundstrom BN, Worrell GA, Van Gompel JJ. Differences in functional connectivity profiles as a predictor of response to anterior thalamic nucleus deep brain stimulation for epilepsy: a hypothesis for the mechanism of action and a potential biomarker for outcomes. Neurosurg Focus. (2018) 45:E7. doi: 10.3171/2018.5.FOCUS18151
31. Lopes R, Moeller F, Besson P, Ogez F, Szurhaj W, Leclerc X, et al. Study on the relationships between intrinsic functional connectivity of the default mode network and transient epileptic activity. Front Neurol. (2014) 5:201. doi: 10.3389/fneur.2014.00201
32. Bonilha L, Rorden C, Halford JJ, Eckert M, Appenzeller S, Cendes F, et al. Asymmetrical extra-hippocampal grey matter loss related to hippocampal atrophy in patients with medial temporal lobe epilepsy. J Neurol Neurosurg Psychiatr. (2007) 78:286–94. doi: 10.1136/jnnp.2006.103994
33. Besson P, Dinkelacker V, Valabregue R, Thivard L, Leclerc X, Baulac M, et al. Structural connectivity differences in left and right temporal lobe epilepsy. Neuroimage. (2014) 100:135–44. doi: 10.1016/j.neuroimage.2014.04.071
Keywords: medial temporal lobe epilepsy, partial seizure, functional magnetic resonance imaging, network-based statistics, limbic system
Citation: Jo HJ, Kenney-Jung DL, Balzekas I, Welker KM, Jones DT, Croarkin PE, Benarroch EE and Worrell GA (2019) Relationship Between Seizure Frequency and Functional Abnormalities in Limbic Network of Medial Temporal Lobe Epilepsy. Front. Neurol. 10:488. doi: 10.3389/fneur.2019.00488
Received: 06 November 2018; Accepted: 23 April 2019;
Published: 08 May 2019.
Edited by:
Andrea Romigi, Mediterranean Neurological Institute (IRCCS), ItalyReviewed by:
Marino M. Bianchin, Federal University of Rio Grande do Sul, BrazilLuiz Eduardo Betting, São Paulo State University, Brazil
Copyright © 2019 Jo, Kenney-Jung, Balzekas, Welker, Jones, Croarkin, Benarroch and Worrell. This is an open-access article distributed under the terms of the Creative Commons Attribution License (CC BY). The use, distribution or reproduction in other forums is permitted, provided the original author(s) and the copyright owner(s) are credited and that the original publication in this journal is cited, in accordance with accepted academic practice. No use, distribution or reproduction is permitted which does not comply with these terms.
*Correspondence: Hang Joon Jo, am8uaGFuZ0BtYXlvLmVkdQ==
Gregory A. Worrell, d29ycmVsbC5ncmVnb3J5QG1heW8uZWR1