 Manuel Blesa1*
 Paola Galdi1
 Gemma Sullivan1
 Emily N. Wheater1
 David Q. Stoye1Gillian J. Lamb1Alan J. Quigley2Michael J. Thrippleton3,4
 Mark E. Bastin3
 James P. Boardman1,3
- 1MRC Centre for Reproductive Health, University of Edinburgh, Edinburgh, United Kingdom
- 2Department of Radiology, Royal Hospital for Sick Children, Edinburgh, United Kingdom
- 3Centre for Clinical Brain Sciences, University of Edinburgh, Edinburgh, United Kingdom
- 4Edinburgh Imaging, University of Edinburgh, Edinburgh, United Kingdom
Preterm birth is closely associated with cognitive impairment and generalized dysconnectivity of neural networks inferred from water diffusion MRI (dMRI) metrics. Peak width of skeletonized mean diffusivity (PSMD) is a metric derived from histogram analysis of mean diffusivity across the white matter skeleton, and it is a useful biomarker of generalized dysconnectivity and cognition in adulthood. We calculated PSMD and five other histogram based metrics derived from diffusion tensor imaging (DTI) and neurite orientation and dispersion imaging (NODDI) in the newborn, and evaluated their accuracy as biomarkers of microstructural brain white matter alterations associated with preterm birth. One hundred and thirty five neonates (76 preterm, 59 term) underwent 3T MRI at term equivalent age. There were group differences in peak width of skeletonized mean, axial, and radial diffusivities (PSMD, PSAD, PSRD), orientation dispersion index (PSODI) and neurite dispersion index (PSNDI), all p < 10−4. PSFA did not differ between groups. PSNDI was the best classifier of gestational age at birth with an accuracy of 81±10%, followed by PSMD, which had 77±9% accuracy. Models built on both NODDI metrics, and on all dMRI metrics combined, did not outperform the model based on PSNDI alone. We conclude that histogram based analyses of DTI and NODDI parameters are promising new image markers for investigating diffuse changes in brain connectivity in early life.
1. Introduction
Preterm birth is closely associated with a phenotype that includes cognitive impairment in childhood and cerebral white matter disease. White matter disease is apparent as diffuse changes in signal intensity on conventional MRI (1, 2), and alterations in diffusion MRI parameters based on the diffusion tensor [fractional anisotropy (FA), and mean, axial, and radial diffusivities, (MD, AD, RD)], and more recently, metrics based on biophysical models, such as neurite orientation and dispersion imaging (NODDI) (3, 4). These metrics have proven useful for making inferences about microstructural alteration of white matter that characterizes dysmaturity associated with preterm birth, for investigating upstream pathways to typical / atypical brain development, and for studying the anatomical bases of subsequent cognitive function in early life (5–13). However, deriving whole brain estimations of these parameters is often computationally expensive, there are uncertainties about which metric or combination of metrics best captures generalized white matter disease associated with preterm birth, and which is likely to be most useful for prognosis.
Peak width of skeletonized mean diffusivity (PSMD) is associated with processing speed—a foundational competence of cognition—in patients with small cerebral vessel disease, patients with Alzheimer's disease, healthy adults, and with a broader set of cognitive impairment (14, 15). In addition, it is a marker of widespread white matter tissue damage in multiple sclerosis (16). It works by calculating the width of the histogram of mean diffusivity of the skeletonized white matter (WM) tracts, thereby largely eliminating cerebrospinal fluid (CSF) contamination and focusing on the core of the main WM tracts. The framework is readily extensible to other DTI metrics (FA, RD, and AD) and to NODDI metrics.
Peak width of skeletonized DTI and NODDI metrics have potential to be useful biomarkers of preterm brain dysmaturation because several are known to be altered throughout white matter in association with preterm birth. Specifically, low FA and increased MD occur throughout the white matter in preterm infants at term equivalent age compared with term-born infants (4, 17–20), and NDI at term equivalent age it is negatively correlated with gestational age at birth (8). Additional advantages are that this framework is fully automated, only requires a single diffusion MRI acquisition, is computationally inexpensive, and has high inter-scanner reproducibility so could be used in clinical settings and for multi-center clinical trials (14).
In this work, we first optimized the PSMD pipeline described by Baykara et al. (14) for application to neonatal data in order to calculate values for PS- MD, FA, RD, AD, NDI, and ODI in early life. Next, based on the generalized dysconnectivity phenotype associated with preterm birth, we tested the hypothesis that infants born preterm would have differences in one or more of the histogram based metrics compared with infants born at term. Finally, we investigated the utility of these metrics by studying their relationship with gestational age at birth and testing their predictive ability in a classification task to discriminate between preterm and term brain images.
2. Methods
2.1. Participants and Data Acquisition
Participants were recruited as part of a longitudinal study designed to investigate the effects of preterm birth on brain structure and long term outcome (www.tebc.ed.ac.uk) (21). One hundred and thirty-five neonates underwent MRI at term equivalent age at the Edinburgh Imaging Facility: Royal Infirmary of Edinburgh, University of Edinburgh, UK.
A Siemens MAGNETOM Prisma 3 T MRI clinical scanner (Siemens Healthcare Erlangen, Germany) and 16-channel phased-array pediatric head coil were used to acquire: 3D T2-weighted SPACE (T2w) (voxel size = 1 mm isotropic) with TE 409 ms and TR 3,200 ms; and axial dMRI. dMRI was acquired in two separate acquisitions: the first acquisition consisted of 8 baseline volumes (b = 0 s/mm2 [b0]) and 64 volumes with b = 750 s/mm2, the second consisted of 8 b0, 3 volumes with b = 200 s/mm2, 6 volumes with b = 500 s/mm2 and 64 volumes with b = 2,500 s/mm2; an optimal angular coverage for the sampling scheme was applied (22). In addition, an acquisition of 3 b0 volumes with an inverse phase encoding direction was performed. All dMRI images were acquired using single-shot spin-echo echo planar imaging (EPI) with 2-fold simultaneous multislice and 2-fold in-plane parallel imaging acceleration and 2 mm isotropic voxels; all three diffusion acquisitions had the same parameters (TR/TE 3,400/78.0 ms). Images affected by motion artifact were re-acquired multiple times as required; dMRI acquisitions were repeated if signal loss was seen in 3 or more volumes.
Infants were fed and wrapped and allowed to sleep naturally in the scanner. Pulse oximetry, electrocardiography and temperature were monitored. Flexible earplugs and neonatal earmuffs (MiniMuffs, Natus) were used for acoustic protection. All scans were supervised by a doctor or nurse trained in neonatal resuscitation. Structural images were reported by an experienced pediatric radiologist (A.J.Q.) using the system described in Leuchter et al. (23), the exclusion criteria were the evidence of focal parenchymal injury (post-hemorrhagic ventricular dilatation, porencephalic cyst or cystic periventricular leukomalacia), or central nervous system malformation.
2.2. Data Pre-processing
All DICOM (Digital Imaging and Communication On Medicine) image files (dMRI and sMRI) were converted to the NIFTI (Neuroimaging Informatics Technology Initiative) format (24). Diffusion MRI processing was performed as follows: for each subject the two dMRI acquisitions were first concatenated and then denoised using a Marchenko-Pastur-PCA-based algorithm (25–27); eddy current, head movement and EPI geometric distortions were corrected using outlier replacement and slice-to-volume registration (28–32); bias field inhomogeneity correction was performed by calculating the bias field of the mean b0 volume and applying the correction to all the volumes (33). From the diffusion images we calculated the tensor (FA, MD, AD, and RD) and the NODDI (intracellular volume fraction [NDI] and the overall orientation dispersion index [ODITOT]) maps (3, 34–36).
2.3. Atlas Construction
Images from 50 term born infants were used to create a multi-modality template (including T1w, T2w, FA, and tensor templates in addition to different parcellation schemes and tissue probability maps) using established methods (37). The final atlas is the Edinburgh Neonatal Atlas 50 (ENA50) (38). Prior to template creation, the structural images were processed using the minimal processing pipeline of the developing human connectome project (39, 40). To obtain the parcellation schemes, different neonatal atlases were registered to the T2w (38, 41–45). The mean b0 of each subject was co-registered to the T2w (46) and the inverse transformation was used to move all the maps to diffusion space (label maps, T1w and T2w).
The template was constructed using DTI-TK. In summary, it performs white alignment using a non-parametric, highly deformable, diffeomorphic registration method that incrementally estimates the displacement field using a tensor-based registration formulation (37). The resulting transformations were then applied to all the modalities. The final templates were obtained by averaging all the images of the same modality registered to the template space. For the parcellation maps, majority voting was used (47).
2.4. Peak Width of Skeletonized Water Diffusion MRI Derived Maps Calculation
All the subjects were registered to the tensor atlas using DTI-TK (48, 49). The tensor derived maps of each subject were calculated after registration and the NODDI metrics were propagated using the computed transformation. Then, the main skeleton of the FA template was created (50) by thresholding at 0.15, and individual FA maps were projected into this skeleton. Driven by the FA, the rest of the maps were projected onto the WM skeleton.
A custom mask was created by editing the skeleton mask to remove CSF and GM contaminated areas, and removing tracts passing through the cerebellum, the brainstem and the subcortical GM areas using ITK-Snap (51), using as a reference the custom mask created by Baykara et al. (14). The resulting skeletonized maps were then multiplied by the custom mask. Finally, the peak width of the histogram of values computed within the skeletonized maps was calculated as the difference between the 95th and 5th percentiles (14).
A brief overview of the full pipeline can be seen in Figure 1.
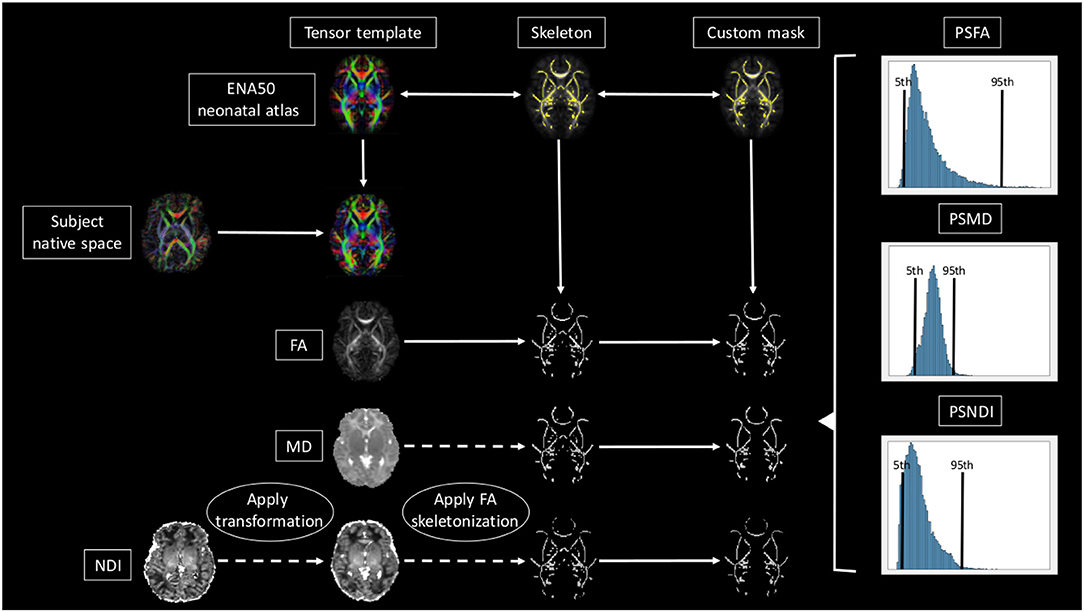
Figure 1. Overview of the full pipeline. For simplicity only NDI, MD, and FA are shown. The subject is registered to the ENA50 using a tensor registration. Then the DTI derived maps are generated and the transformation applied to the NODDI maps. Using FA as a conductor, the images are skeletonized, and finally, all images are multiplied by the custom mask.
2.5. Statistical Analysis
In the following analyses, metrics were adjusted for age a scan by fitting a liner model of each metric on GA at scan and retaining the residuals. We report Pearson's correlations between each of the residualized metrics and GA at birth in the whole sample. A D'Agostino and Pearson's test was used to assess the normality of the residualized imaging metrics. Group comparisons of residualized PS-MD, AD, RD, FA, NDI, and ODI were made using two-sample t-test for normally distributed variables and the Mann-Whitney U test for variables that did not have a normal distribution. Reported p-values were adjusted for the false discovery rate (FDR) using the Benjamini–Hochberg procedure. We then used the residualized metrics as predictors in a logistic regression model to discriminate between preterm and term born infants. We compared the performance of each metric individually and of three multivariate models including all the metrics, only DTI metrics and only NODDI metrics, respectively. We measured classification accuracy using a 30-repeated 10-fold cross validation, meaning that in each of 30 repetitions data are randomly split in 10-folds of which one in turn is used as a test set to assess the generalization ability of the model trained on the remaining 9-folds. Folds were stratified to preserve the proportion of term and preterm subjects of the whole sample. Accuracy was computed as the percentage of correctly classified subjects across folds and repetitions.
3. Results
Table 1 shows summary statistics of demographic characteristics of the study group.
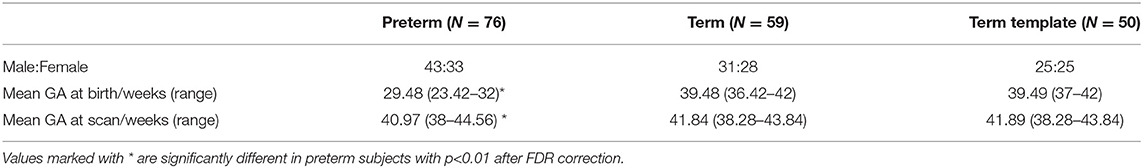
Table 1. Demographic characteristics of the study group.
Table 2 shows the median, 25th and 75th percentiles, minimum and maximum values for each of the six histogram based metrics grouped by term and preterm categories, and Table 3 shows the mean 5th and 95th percentiles for the original metrics separated by group. Figure 2 shows the variation of each histogram based metric with respect to GA at birth and correlations between the metrics and GA at birth are reported in Table 4, together with results of group comparisons. With the exception of PSFA, all metrics were correlated with GA at birth (p < 0.01) and showed group differences in the term vs. preterm comparison (p < 0.01).
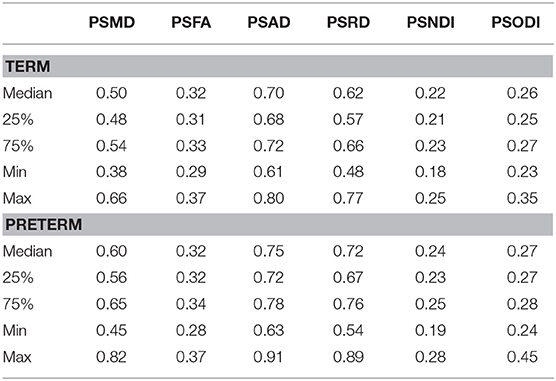
Table 2. Summary statistics for all metrics.
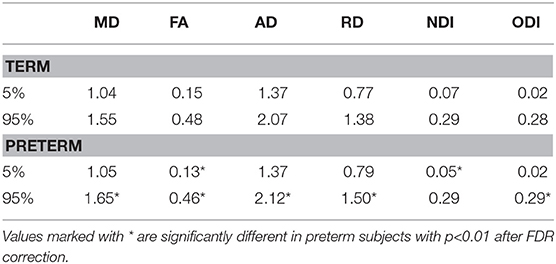
Table 3. Mean 5th and 95th percentiles of imaging metrics in preterm and term groups.
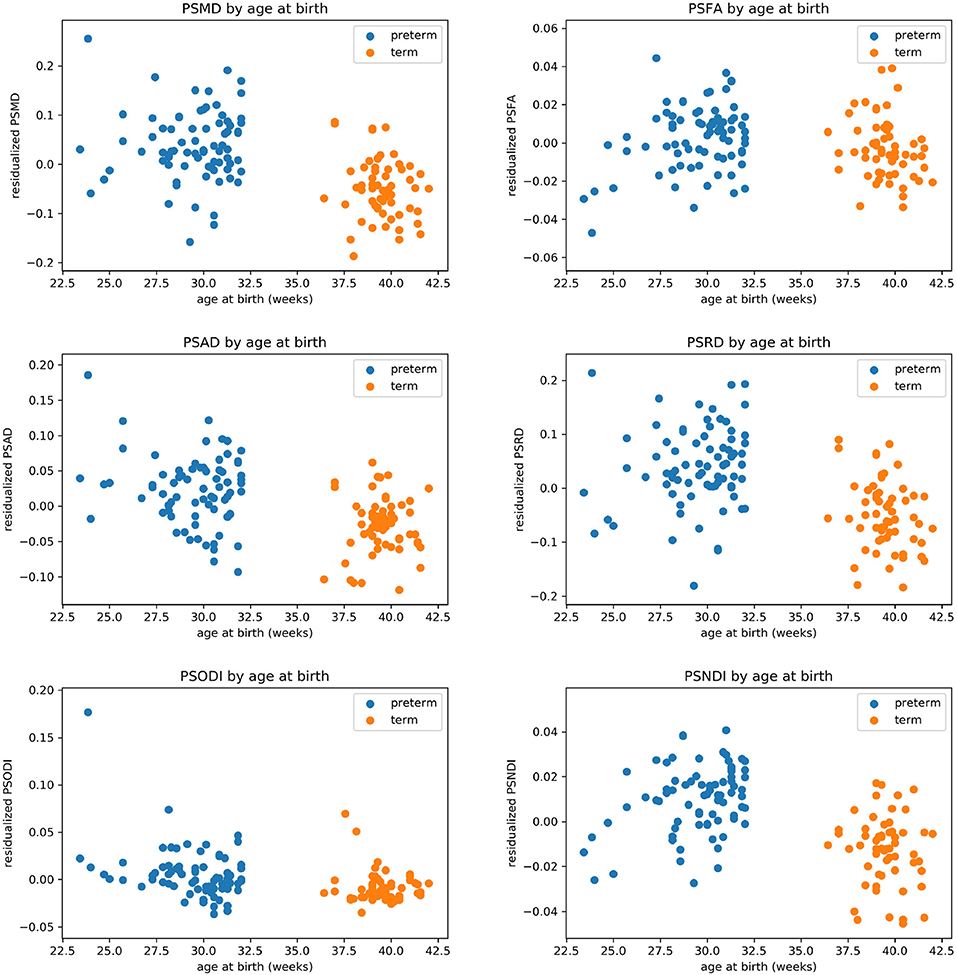
Figure 2. Scatter plots showing the relationship between each of the metric and gestational age at birth.
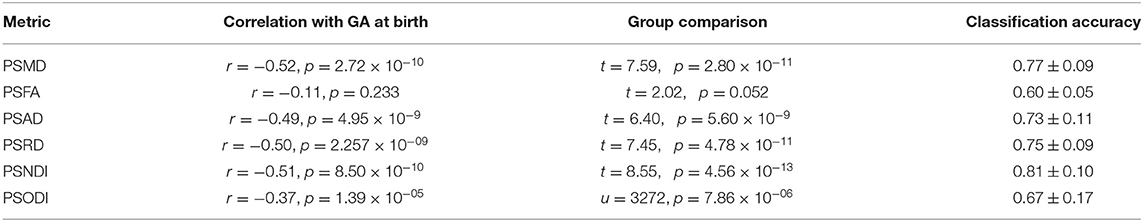
Table 4. Results for the correlation with GA and the classification task.
Table 4 reports the cross-validation accuracy of each metric in the classification task (term vs. preterm). Four out of six metrics achieved at least 70% accuracy, with the exception of PSFA (60±5%) and PSODI (67±17%). PSMD and PSNDI obtained the best results among the DTI and NODDI metrics, respectively. Combining the metrics in a multivariate model increased only slightly the prediction accuracy: using all DTI metrics: 79±9% accuracy; using all NODDI metrics: 81±7% accuracy; using all metrics: 79±7% accuracy.
4. Discussion
We developed a pipeline for calculating peak width of skeletonized diffusion MRI derived metrics of the developing brain, and we show that five of these histogram based markers detect generalized white matter microstructural alteration associated with preterm birth. Calculation of these image markers is fully automated and computationally inexpensive, so peak width of skeletonized water diffusion metrics could have high value for research designed to investigate generalized dysconnectivity phenotypes in early life.
The NODDI and tensor derived metrics have been applied to different populations including healthy and aging adults (52, 53), patients with amyotrophic lateral sclerosis and Alzheimer's disease patients (54, 55), and to preclinical models (56, 57). In the neonatal MRI field, tensor derived metrics have been widely used to study the effects of prematurity on the brain (5), and several other factors, such as chronic lung disease, nutrition, prenatal drug exposure, among others (11, 13, 19, 58). In recent years NODDI metrics have been applied to neonatal data because of the added inference they offer with respect to microstructural organization and characteristics (59). They have revealed new insights into cortical maturation in perinatal life, and identified dysmaturation in newborns with congenital heart disease (59, 60). Recently, the tensor derived and NODDI metrics have been used together in integrated approaches, such as morphometric similarity networks (12, 61), but to our knowledge, this is the first time that DTI and NODDI metrics have been used within the peak width skeletonized framework for studying the developing brain.
We found that all the PS metrics with exception of the PSFA were higher for preterm infants at term equivalent age compared with values calculated from infants born at full term, meaning that the range of values was wider for the preterm population. However, the behavior of the metrics was different, which enables an inference about underlying tissue microstructure. For example MD has the same 5th percentile in term and preterm infants at term equivalent age but the 95th percentile is much higher in preterm group, whereas for NDI the opposite is true: both groups have the same 95th percentile, but the 5th percentile is much lower in preterm infants. Taken together, the metrics indicate higher variability in water content (toward higher values) and in intra-axonal volume (toward lower values) in preterm infant. This is consistent with lower myelination in preterm infants and/or less coherent WM organization (62), which is suggested by an overall higher PSODI for the preterm population. For RD the values in 95th and 5th percentile are higher in preterm than term, but the difference is much more accentuated in the 95th percentile, in agreement with PSMD. Increased PSAD in preterm infants at term equivalent age is consistent with altered axonal integrity, which is a feature of white matter disease in preterm infants. PSFA was the only metric that did not show a significant difference between groups, although there was a histogram shift (Table 3) such that term infants do have higher mean FA across the skeleton, which is a consistent finding across studies (4).
All the metrics, with exception of the PSFA and PSODI, achieved high accuracy (≥70%) in the classification task of preterm vs. term brain images. PSMD and PSNDI performed with greatest accuracy (Table 3), and this was not enhanced by combining multiple features in the same model. Different methods for preterm vs. term classification have been proposed with varying accuracy: 80% (63) or 92% (12). However, previous methods usually require long acquisitions and/or complicated processing frameworks. The main advantage of the histogram based framework is that it is possible to calculate measures from standard diffusion MRI acquisition and with relatively simple processing, making it suitable for large scale multi-site studies (14).
Application of histogram based methods to neonatal data required some modifications to the original framework proposed by Baykara et al. First, we optimized the method to operate in a specific neonatal space, as opposed to the MNI152 co-ordinate system (64). For doing this, a neonatal template was created (ENA50) and used as a common space for the whole process. The registration method was also changed: the original method uses FNIRT (65) because it is based in the main TBSS framework (50). Due the nature of the tensor-based neonatal atlas, we are able to use a tensor-based registration (48, 49) with a three-step registration, adding a rigid step at the beginning (19). This method has been shown to improve the alignment of WM tracts in neonatal data (10, 19, 66). One of the main advantages of the proposed framework, is that due to the multi-modal nature of the ENA50 (FA, T1-weighted, T2-weighted and tensor templates) the pipeline can be easily modified to change the registration process for any of the available intensity-based algorithms (41, 65, 67–69).
Histogram based analyses of DTI and NODDI metrics offer tractable markers that could be used to investigate generalized white matter connectivity in other neonatal populations at risk of atypical brain development and the extensible nature of the framework means that it could be applied to other myelin sensitive metrics not derived from diffusion, such as T1w/T2w (70) or g-ratio (71). Future work could investigate the utility of histogram based metrics for assessing the impact of perinatal exposures and co-morbidities on brain tissue development, and their predictive value for cognitive and behavioral outcomes in children at risk of impairment. Furthermore, their possible utility in clinical settings, providing summary information about WM microstructure from MRI datasets acquired on different scanners, and as potential biomarkers in neuroprotection trials should be evaluated.
5. Conclusion
In this work, we introduce an age-specific pipeline for calculation of peak width of skeletonized MD, RD, AD, FA, NDI, and ODI of the neonatal brain. We found that these histogram based metrics, which represent generalized water content, myelination, and complexity of dendrites and axons across the WM skeleton, are altered in association with preterm birth. PSMD and PSNDI appear to be the most promising biomarkers due to their relative ease of computation compared with other methods, and their comparable accuracy.
Data Availability Statement
The atlas with templates can be found at https://git.ecdf.ed.ac.uk/jbrl/ena and the code necessary to calculate histogram based metrics is at https://git.ecdf.ed.ac.uk/jbrl/psmd. Reasonable requests for original image data will be considered through the BRAINS governance process: www.brainsimagebank.ac.uk (72).
Ethics Statement
The studies involving human participants were reviewed and approved by UK National Research Ethics Service. Written informed consent to participate in this study was provided by the participants' legal guardian/next of kin.
Author Contributions
MB and PG designed the experiments and wrote the first draft of the manuscript. MB processed the data. PG did the statistical analyses. GS, DS, GL, AQ, and MT acquired the data. EW contributed to the analysis of data. JB and MEB provided help with the interpretation and wrote the manuscript. All authors revised and commented on the manuscript.
Funding
This work was supported by Theirworld (www.theirworld.org). MT was supported by NHS Lothian Research and Development Office. The work was undertaken in the MRC Centre for Reproductive Health, which was funded by MRC Centre Grant (MRC G1002033).
Conflict of Interest
The authors declare that the research was conducted in the absence of any commercial or financial relationships that could be construed as a potential conflict of interest.
Acknowledgments
Participants were scanned in the University of Edinburgh Imaging Research MRI Facility at the Royal Infirmary of Edinburgh which was established with funding from The Wellcome Trust, Dunhill Medical Trust, Edinburgh and Lothians Research Foundation, Theirworld, The Muir Maxwell Trust, and other sources.
Individual parcellated templates and structural MRI images from the M-CRIB atlas (45) were supplied by the Murdoch Children's Research Institute.
We were grateful to the families who consented to take part in the study and to all the University's imaging research staff for providing the infant scanning.
References
1. Dyet LE, Kennea N, Counsell SJ, Maalouf EF, Ajayi-Obe M, Duggan PJ, et al. Natural history of brain lesions in extremely preterm infants studied with serial magnetic resonance imaging from birth and neurodevelopmental assessment. Pediatrics. (2006) 118:536–48. doi: 10.1542/peds.2005-1866
2. Woodward LJ, Anderson PJ, Austin NC, Howard K, Inder TE. Neonatal MRI to predict neurodevelopmental outcomes in preterm infants. N Engl J Med. (2006) 355:685–94. doi: 10.1056/NEJMoa053792
3. Zhang H, Schneider T, Wheeler-Kingshott CA, Alexander DC. NODDI: practical in vivo neurite orientation dispersion and density imaging of the human brain. Neuroimage. (2012) 61:1000–16. doi: 10.1016/j.neuroimage.2012.03.072
4. Pecheva D, Kelly C, Kimpton J, Bonthrone A, Batalle D, Zhang H, et al. Recent advances in diffusion neuroimaging: applications in the developing preterm brain. F1000Res. (2018) 7:F1000 Faculty Rev-1326. doi: 10.12688/f1000research.15073.1
5. Counsell SJ, Edwards AD, Chew ATM, Cowan FM, Boardman JP, Allsop JM, et al. Specific relations between neurodevelopmental abilities and white matter microstructure in children born preterm. Brain. (2008) 131:3201–8. doi: 10.1093/brain/awn268
6. van Kooij BJM, van Pul C, Benders MJNL, van Haastert IC, de Vries LS, Groenendaal F. Fiber tracking at term displays gender differences regarding cognitive and motor outcome at 2 years of age in preterm infants. Pediatr Res. (2011) 70:626–32. doi: 10.1203/PDR.0b013e318232a963
7. Anblagan D, Pataky R, Evans MJ, Telford EJ, Serag A, Sparrow S, et al. Association between preterm brain injury and exposure to chorioamnionitis during fetal life. Sci Rep. (2016) 6:37932. doi: 10.1038/srep37932
8. Batalle D, Hughes EJ, Zhang H, Tournier JD, Tusor N, et al. Early development of structural networks and the impact of prematurity on brain connectivity. Neuroimage. (2017) 149:379–92. doi: 10.1016/j.neuroimage.2017.01.065
9. Telford EJ, Cox SR, Fletcher-Watson S, Anblagan D, Sparrow S, Pataky R, et al. A latent measure explains substantial variance in white matter microstructure across the newborn human brain. Brain Struct Funct. (2017) 222:4023–33. doi: 10.1007/s00429-017-1455-6
10. Barnett ML, Tusor N, Ball G, Chew A, Falconer S, Aljabar P, et al. Exploring the multiple-hit hypothesis of preterm white matter damage using diffusion MRI. Neuroimage Clin. (2018) 17:596–606. doi: 10.1016/j.nicl.2017.11.017
11. Blesa M, Sullivan G, Anblagan D, Telford EJ, Quigley AJ, Sparrow SA, et al. Early breast milk exposure modifies brain connectivity in preterm infants. Neuroimage. (2019) 184:431–9. doi: 10.1016/j.neuroimage.2018.09.045
12. Galdi P, Blesa M, Stoye DQ, Sullivan G, Lamb GJ, Quigley AJ, et al. Neonatal morphometric similarity mapping for predicting brain age and characterizing neuroanatomic variation associated with preterm birth. Neuroimage Clin. (2020) 25:102195. doi: 10.1016/j.nicl.2020.102195
13. Boardman JP, Counsell SJ. Factors associated with atypical brain development in preterm infants: insights from magnetic resonance imaging. Neuropathol Appl Neurobiol. (2019). doi: 10.1111/nan.12589
14. Baykara E, Gesierich B, Adam R, Tuladhar AM, Biesbroek JM, Koek HL, et al. A novel imaging marker for small vessel disease based on skeletonization of white matter tracts and diffusion histograms. Ann Neurol. (2016) 80:581–92. doi: 10.1002/ana.24758
15. Deary IJ, Ritchie SJ, Muñoz Maniega S, Cox SR, Valdés Hernández MC, Luciano M, et al. Brain peak width of skeletonized mean diffusivity (PSMD) and cognitive function in later life. Front Psychiatry. (2019) 10:524. doi: 10.3389/fpsyt.2019.00524
16. Vinciguerra C, Giorgio A, Zhang J, Donato ID, Stromillo ML, Brocci RT, et al. Peak width of skeletonized mean diffusivity (PSMD) as marker of widespread white matter tissue damage in multiple sclerosis. Mult Scler Relat Disord. (2019) 27:294–7. doi: 10.1016/j.msard.2018.11.011
17. Partridge SC, Mukherjee P, Henry RG, Miller SP, Berman JI, Jin H, et al. Diffusion tensor imaging: serial quantitation of white matter tract maturity in premature newborns. Neuroimage. (2004) 22:1302–14. doi: 10.1016/j.neuroimage.2004.02.038
18. Anjari M, Srinivasan L, Allsop JM, Hajnal JV, Rutherford MA, Edwards AD, et al. Diffusion tensor imaging with tract-based spatial statistics reveals local white matter abnormalities in preterm infants. Neuroimage. (2007) 35:1021–7. doi: 10.1016/j.neuroimage.2007.01.035
19. Ball G, Counsell SJ, Anjari M, Merchant N, Arichi T, Doria V, et al. An optimised tract-based spatial statistics protocol for neonates: applications to prematurity and chronic lung disease. Neuroimage. (2010) 53:94–102. doi: 10.1016/j.neuroimage.2010.05.055
20. Thompson DK, Inder TE, Faggian N, Johnston L, Warfield SK, Anderson PJ, et al. Characterization of the corpus callosum in very preterm and full-term infants utilizing MRI. Neuroimage. (2011) 55:479–90. doi: 10.1016/j.neuroimage.2010.12.025
21. Boardman JP, Hall J, Thrippleton MJ, Reynolds RM, Bogaert D, Davidson DJ, et al. Impact of preterm birth on brain development and long-term outcome: protocol for a cohort study in Scotland. BMJ open. (2020) 10:e035854.
22. Caruyer E, Lenglet C, Sapiro G, Deriche R. Design of multishell sampling schemes with uniform coverage in diffusion MRI. Magn Reson Med. (2013) 69:1534–40. doi: 10.1002/mrm.24736
23. Leuchter RHV, Gui L, Poncet A, Hagmann C, Lodygensky GA, Martin E, et al. Association between early administration of high-dose erythropoietin in preterm infants and brain MRI abnormality at term-equivalent age. JAMA. (2014) 312:817–24. doi: 10.1001/jama.2014.9645
24. Li X, Morgan PS, Ashburner J, Smith J, Rorden C. The first step for neuroimaging data analysis: DICOM to NIfTI conversion. J Neurosci Methods. (2016) 264:47–56. doi: 10.1016/j.jneumeth.2016.03.001
25. Veraart J, Fieremans E, Novikov DS. Diffusion MRI noise mapping using random matrix theory. Magn Reson Med. (2016) 76:1582–93. doi: 10.1002/mrm.26059
26. Veraart J, Novikov DS, Christiaens D, Ades-aron B, Sijbers J, Fieremans E. Denoising of diffusion MRI using random matrix theory. Neuroimage. (2016) 142:394–406. doi: 10.1016/j.neuroimage.2016.08.016
27. Tournier JD, Smith RE, Raffelt DA, Tabbara R, Dhollander T, Pietsch M, et al. MRtrix3: a fast, flexible and open software framework for medical image processing and visualisation. NeuroImage. (2019) 202:116137. doi: 10.1101/551739
28. Andersson JLR, Skare S, Ashburner J. How to correct susceptibility distortions in spin-echo echo-planar images: application to diffusion tensor imaging. Neuroimage. (2003) 20:870–88. doi: 10.1016/S1053-8119(03)00336-7
29. Smith SM, Jenkinson M, Woolrich MW, Beckmann CF, Behrens TEJ, Johansen-Berg H, et al. Advances in functional and structural MR image analysis and implementation as FSL. Neuroimage. (2004) 23:S208–19. doi: 10.1016/j.neuroimage.2004.07.051
30. Andersson JLR, Sotiropoulos SN. An integrated approach to correction for off-resonance effects and subject movement in diffusion MR imaging. Neuroimage. (2016) 125:1063–78. doi: 10.1016/j.neuroimage.2015.10.019
31. Andersson JLR, Graham MS, Zsoldos E, Sotiropoulos SN. Incorporating outlier detection and replacement into a non-parametric framework for movement and distortion correction of diffusion MR images. Neuroimage. (2016) 141:556–72. doi: 10.1016/j.neuroimage.2016.06.058
32. Andersson JLR, Graham MS, Drobnjak I, Zhang H, Filippini N, Bastiani M. Towards a comprehensive framework for movement and distortion correction of diffusion MR images: within volume movement. Neuroimage. (2017) 152:450–66. doi: 10.1016/j.neuroimage.2017.02.085
33. Tustison NJ, Avants BB, Cook PA, Zheng Y, Egan A, Yushkevich PA, et al. N4ITK: improved N3 bias correction. IEEE Trans Med Imaging. (2010) 29:1310–20. doi: 10.1109/TMI.2010.2046908
34. Basser PJ, Pierpaoli C. Microstructural and physiological features of tissues elucidated by quantitative-diffusion-tensor MRI. J Magn Reson. (2011) 213:560–70. doi: 10.1016/j.jmr.2011.09.022
35. Tariq M, Schneider T, Alexander DC, Wheeler-Kingshott CAG, Zhang H. Bingham-NODDI: mapping anisotropic orientation dispersion of neurites using diffusion MRI. Neuroimage. (2016) 133:207–23. doi: 10.1016/j.neuroimage.2016.01.046
36. Hernandez-Fernandez M, Reguly I, Jbabdi S, Giles M, Smith S, Sotiropoulos SN. Using GPUs to accelerate computational diffusion MRI: from microstructure estimation to tractography and connectomes. Neuroimage. (2019) 188:598–615. doi: 10.1016/j.neuroimage.2018.12.015
37. Zhang H, Yushkevich PA, Rueckert D, Gee JC. Unbiased white matter atlas construction using diffusion tensor images. In: Ayache N, Ourselin S, Maeder A, editors. Medical Image Computing and Computer-Assisted Intervention-MICCAI 2007. Berlin; Heidelberg: Springer Berlin Heidelberg (2007). p. 211–8.
38. Blesa M, Serag A, Wilkinson AG, Anblagan D, Telford EJ, Pataky R, et al. Parcellation of the healthy neonatal brain into 107 regions using atlas propagation through intermediate time points in childhood. Front Neurosci. (2016) 10:220. doi: 10.3389/fnins.2016.00220
39. Makropoulos A, Aljabar P, Wright R, Hüning B, Merchant N, et al. Regional growth and atlasing of the developing human brain. Neuroimage. (2016) 125:456–78. doi: 10.1016/j.neuroimage.2015.10.047
40. Makropoulos A, Robinson EC, Schuh A, Wright R, Fitzgibbon S, et al. The developing human connectome project: a minimal processing pipeline for neonatal cortical surface reconstruction. Neuroimage. (2018) 173:88–112. doi: 10.1016/j.neuroimage.2018.01.054
41. Avants BB, Epstein CL, Grossman M, Gee JC. Symmetric diffeomorphic image registration with cross-correlation: Evaluating automated labeling of elderly and neurodegenerative brain. Med Image Anal. (2008) 12:26–41. doi: 10.1016/j.media.2007.06.004
42. Shi F, Yap PT, Wu G, Jia H, Gilmore JH, Lin W, et al. Infant brain atlases from neonates to 1- and 2-year-olds. PLoS ONE. (2011) 6:e18746. doi: 10.1371/journal.pone.0018746
43. Oishi K, Mori S, Donohue PK, Ernst T, Anderson L, Buchthal S, et al. Multi-contrast human neonatal brain atlas: application to normal neonate development analysis. Neuroimage. (2011) 56:8–20. doi: 10.1016/j.neuroimage.2011.01.051
44. Wang H, Suh JW, Das SR, Pluta JB, Craige C, Yushkevich PA. Multi-atlas segmentation with joint label fusion. IEEE Trans Pattern Anal Mach Intell. (2013) 35:611–23. doi: 10.1109/TPAMI.2012.143
45. Alexander B, Murray AL, Loh WY, Matthews LG, Adamson C, Beare R, et al. A new neonatal cortical and subcortical brain atlas: the Melbourne Children's Regional Infant Brain (M-CRIB) atlas. Neuroimage. (2017) 147:841–51. doi: 10.1016/j.neuroimage.2016.09.068
46. Greve DN, Fischl B. Accurate and robust brain image alignment using boundary-based registration. Neuroimage. (2009) 48:63–72. doi: 10.1016/j.neuroimage.2009.06.060
47. Heckemann RA, Hajnal JV, Aljabar P, Rueckert D, Hammers A. Automatic anatomical brain MRI segmentation combining label propagation and decision fusion. Neuroimage. (2006) 33:115–26. doi: 10.1016/j.neuroimage.2006.05.061
48. Zhang H, Yushkevich PA, Alexander DC, Gee JC. Deformable registration of diffusion tensor MR images with explicit orientation optimization. Med Image Anal. (2006) 10:764–85. doi: 10.1016/j.media.2006.06.004
49. Zhang H, Avants BB, Yushkevich PA, Woo JH, Wang S, McCluskey LF, et al. High-dimensional spatial normalization of diffusion tensor images improves the detection of white matter differences: an example study using amyotrophic lateral sclerosis. IEEE Trans Med Imaging. (2007) 26:1585–97. doi: 10.1109/TMI.2007.906784
50. Smith SM, Jenkinson M, Johansen-Berg H, Rueckert D, Nichols TE, Mackay CE, et al. Tract-based spatial statistics: voxelwise analysis of multi-subject diffusion data. Neuroimage. (2006) 31:1487–505. doi: 10.1016/j.neuroimage.2006.02.024
51. Yushkevich PA, Piven J, Cody Hazlett H, Gimpel Smith R, Ho S, Gee JC, et al. User-guided 3D active contour segmentation of anatomical structures: significantly improved efficiency and reliability. Neuroimage. (2006) 31:1116–28. doi: 10.1016/j.neuroimage.2006.01.015
52. Cox SR, Ritchie SJ, Tucker-Drob EM, Liewald DC, Hagenaars SP, Davies G, et al. Ageing and brain white matter structure in 3,513 UK biobank participants. Nat Commun. (2016) 7:13629. doi: 10.1038/ncomms13629
53. Kodiweera C, Alexander AL, Harezlak J, McAllister TW, Wu YC. Age effects and sex differences in human brain white matter of young to middle-aged adults: a DTI, NODDI, and q-space study. Neuroimage. (2016) 128:180–92. doi: 10.1016/j.neuroimage.2015.12.033
54. Wen Q, Mustafi SM, Li J, Risacher SL, Tallman E, Brown SA, et al. White matter alterations in early-stage Alzheimer's disease: a tract-specific study. Alzheimers Dement. (2019) 11:576–87. doi: 10.1016/j.dadm.2019.06.003
55. Broad RJ, Gabel MC, Dowell NG, Schwartzman DJ, Seth AK, Zhang H, et al. Neurite orientation and dispersion density imaging (NODDI) detects cortical and corticospinal tract degeneration in ALS. J Neurol Neurosurg Psychiatry. (2019) 90:404–11. doi: 10.1136/jnnp-2018-318830
56. Colgan N, Siow B, O'Callaghan JM, Harrison IF, Wells JA, Holmes HE, et al. Application of neurite orientation dispersion and density imaging (NODDI) to a tau pathology model of Alzheimer's disease. Neuroimage. (2016) 125:739–44. doi: 10.1016/j.neuroimage.2015.10.043
57. Yi SY, Barnett BR, Torres-Velázquez M, Zhang Y, Hurley SA, Rowley PA, et al. Detecting microglial density with quantitative multi-compartment diffusion MRI. Front Neurosci. (2019) 13:81. doi: 10.3389/fnins.2019.00081
58. Monnelly VJ, Anblagan D, Quigley A, Cabez MB, Cooper ES, Mactier H, et al. Prenatal methadone exposure is associated with altered neonatal brain development. Neuroimage Clin. (2018) 18:9–14. doi: 10.1016/j.nicl.2017.12.033
59. Batalle D, O'Muircheartaigh J, Makropoulos A, Kelly CJ, Dimitrova R, Hughes EJ, et al. Different patterns of cortical maturation before and after 38 weeks gestational age demonstrated by diffusion MRI in vivo. Neuroimage. (2019) 185:764–75. doi: 10.1016/j.neuroimage.2018.05.046
60. Kelly CJ, Christiaens D, Batalle D, Makropoulos A, Cordero-Grande L, Steinweg JK, et al. Abnormal microstructural development of the cerebral cortex in neonates with congenital heart disease is associated with impaired cerebral oxygen delivery. J Am Heart Assoc. (2019) 8:e009893. doi: 10.1161/JAHA.118.009893
61. Fenchel D, Dimitrova R, Seidlitz J, Robinson EC, Batalle D, Hutter J, et al. Development of microstructural and morphological cortical profiles in the neonatal brain. bioRxiv. (2020). Available online at: https://www.biorxiv.org/content/early/2020/01/16/2020.01.14.906206
62. Hinojosa-Rodríguez M, Harmony T, Carrillo-Prado C, Horn JDV, Irimia A, Torgerson C, et al. Clinical neuroimaging in the preterm infant: diagnosis and prognosis. Neuroimage Clin. (2017) 16:355–68. doi: 10.1016/j.nicl.2017.08.015
63. Ball G, Aljabar P, Arichi T, Tusor N, Cox D, Merchant N, et al. Machine-learning to characterise neonatal functional connectivity in the preterm brain. Neuroimage. (2016) 124:267–75. doi: 10.1016/j.neuroimage.2015.08.055
64. Grabner G, Janke AL, Budge MM, Smith D, Pruessner J, Collins DL. Symmetric atlasing and model based segmentation: an application to the hippocampus in older adults. In: Larsen R, Nielsen M, Sporring J, editors. Medical Image Computing and Computer-Assisted Intervention-MICCAI 2006. Berlin; Heidelberg: Springer Berlin Heidelberg (2006). p. 58–66.
65. Andersson JLR, Jenkinson M, Smith S. High resolution nonlinear registration with simultaneous modelling of intensities. bioRxiv. (2019). Available online at: https://www.biorxiv.org/content/early/2019/05/22/646802
66. Bach M, Laun FB, Leemans A, Tax CMW, Biessels GJ, Stieltjes B, et al. Methodological considerations on tract-based spatial statistics (TBSS). Neuroimage. (2014) 100:358–69. doi: 10.1016/j.neuroimage.2014.06.021
67. Rueckert D, Sonoda LI, Hayes C, Hill DLG, Leach MO, Hawkes DJ. Nonrigid registration using free-form deformations: application to breast MR images. IEEE Trans Med Imaging. (1999) 18:712–21. doi: 10.1109/42.796284
68. Klein A, Andersson J, Ardekani BA, Ashburner J, Avants B, Chiang MC, et al. Evaluation of 14 nonlinear deformation algorithms applied to human brain MRI registration. Neuroimage. (2009) 46:786–802. doi: 10.1016/j.neuroimage.2008.12.037
69. Ou Y, Sotiras A, Paragios N, Davatzikos C. DRAMMS: deformable registration via attribute matching and mutual-saliency weighting. Med Image Anal. (2011) 15:622–39. doi: 10.1016/j.media.2010.07.002
70. Glasser MF, Van Essen DC. Mapping human cortical areas in vivo based on myelin content as revealed by T1- and T2-weighted MRI. J Neurosci. (2011) 31:11597–616. doi: 10.1523/JNEUROSCI.2180-11.2011
71. Stikov N, Campbell JSW, Stroh T, Lavelée M, Frey S, Novek J, et al. In vivo histology of the myelin g-ratio with magnetic resonance imaging. Neuroimage. (2015) 118:397–405. doi: 10.1016/j.neuroimage.2015.05.023
Keywords: diffusion MRI, PSMD, preterm, neonate, NODDI, DTI
Citation: Blesa M, Galdi P, Sullivan G, Wheater EN, Stoye DQ, Lamb GJ, Quigley AJ, Thrippleton MJ, Bastin ME and Boardman JP (2020) Peak Width of Skeletonized Water Diffusion MRI in the Neonatal Brain. Front. Neurol. 11:235. doi: 10.3389/fneur.2020.00235
Received: 03 December 2019; Accepted: 11 March 2020;
Published: 03 April 2020.
Edited by:
Deirdre M. Murray, University College Cork, IrelandReviewed by:
Daniel Edward Lumsden, Guy's and St. Thomas' NHS Foundation Trust, United KingdomDiego Iacono, Biomedical Research Institute of New Jersey, United States
Copyright © 2020 Blesa, Galdi, Sullivan, Wheater, Stoye, Lamb, Quigley, Thrippleton, Bastin and Boardman. This is an open-access article distributed under the terms of the Creative Commons Attribution License (CC BY). The use, distribution or reproduction in other forums is permitted, provided the original author(s) and the copyright owner(s) are credited and that the original publication in this journal is cited, in accordance with accepted academic practice. No use, distribution or reproduction is permitted which does not comply with these terms.
*Correspondence: Manuel Blesa, bWFudWVsLmJsZXNhQGVkLmFjLnVr