 Rongrong Chen1†Keer Wang1†
 Jie Yu1†Derek Howard2
 Leon French2
 Zhong Chen3,4
 Chengping Wen1*
 Zhenghao Xu1*
- 1Institute of Traditional Chinese Medicine Clinical Basic Medicine, School of Basic Medical Science, Zhejiang Chinese Medical University, Hangzhou, China
- 2Krembil Centre for Neuroinformatics, Centre for Addiction and Mental Health, Toronto, ON, Canada
- 3Zhejiang Chinese Medical University, Hangzhou, China
- 4Key Laboratory of Medical Neurobiology of National Health Commission and Chinese Academy of Medical Sciences, Institute of Pharmacology and Toxicology, College of Pharmaceutical Sciences, Zhejiang University, Hangzhou, China
By engaging angiotensin-converting enzyme 2 (ACE2 or Ace2), the novel pathogenic severe acute respiratory syndrome coronavirus 2 (SARS-CoV-2) invades host cells and affects many organs, including the brain. However, the distribution of ACE2 in the brain is still obscure. Here, we investigated the ACE2 expression in the brain by analyzing data from publicly available brain transcriptome databases. According to our spatial distribution analysis, ACE2 was relatively highly expressed in some brain locations, such as the choroid plexus and paraventricular nuclei of the thalamus. According to cell-type distribution analysis, nuclear expression of ACE2 was found in many neurons (both excitatory and inhibitory neurons) and some non-neuron cells (mainly astrocytes, oligodendrocytes, and endothelial cells) in the human middle temporal gyrus and posterior cingulate cortex. A few ACE2-expressing nuclei were found in a hippocampal dataset, and none were detected in the prefrontal cortex. Except for the additional high expression of Ace2 in the olfactory bulb areas for spatial distribution as well as in the pericytes and endothelial cells for cell-type distribution, the distribution of Ace2 in the mouse brain was similar to that in the human brain. Thus, our results reveal an outline of ACE2/Ace2 distribution in the human and mouse brains, which indicates that the brain infection of SARS-CoV-2 may be capable of inducing central nervous system symptoms in coronavirus disease 2019 (COVID-19) patients. Potential species differences should be considered when using mouse models to study the neurological effects of SARS-CoV-2 infection.
Introduction
Since December 2019, much attention has focused on the novel severe acute respiratory syndrome coronavirus 2 (SARS-CoV-2) and the related coronavirus disease 2019 (COVID-19) pandemic, which is rapidly spreading around the world and results in a global health emergency (1). In addition to atypical pneumonia, the central nervous system (CNS) symptoms of COVID-19 patients have been observed in the clinic (2). According to a recent retrospective case series study, 53 out of 214 (24.8%) COVID-19 patients had CNS symptoms, including dizziness, headache, impaired consciousness, acute cerebrovascular disease, ataxia, and epilepsy (3). More importantly, it has been found that SARS-CoV, a previously reported similar coronavirus, spreads into the brain after it was cleared from the lung in mice, which could be more concealment than that in the lung (4). Recently, Puelles et al. found that SARS-CoV-2 has an organotropism beyond the respiratory tract, including the kidneys, liver, heart, and brain (5). Thus, it is necessary and urgent to study the CNS infection of SARS-CoV-2.
Angiotensin-converting enzyme 2 (ACE2 or Ace2) has been identified as a key entry receptor for novel pathogenic SARS-CoV-2 invasion, similar to previous SARS-CoV (6). By binding of the spike protein to ACE2, SARS-CoV-2 and SARS-CoV could invade host cells in human organs (7, 8). However, the distribution of ACE2 in the brain is still obscure and even inconsistent. In 2004, Hamming et al. found that ACE2 may be expressed only in the endothelium and vascular smooth muscle cells in the human brain tissue (9). However, some recent studies found that the human endothelial cells expressed low or undetectable levels of ACE2 (10, 11). On the other hand, a previous study has reported that Ace2 could be expressed in the mouse neuron cells, which may contribute to the development of hypertension (12); however, in another neurocytometry study, Ace2 is a potential marker for non-neurons in the zinc-fixed mouse brain cortical section (13). Thus, further clarifying the brain tissue distribution of ACE2 may help to bring to light the CNS infection of the novel SARS-CoV-2 and previous SARS-CoV.
Here, we investigated the distribution of ACE2 in the brain by analyzing publicly available brain transcriptome databases. These databases, such as those produced by the Allen Institute for Brain Science, offer an extremely valuable source of genomic data, whose processing and interpretation may facilitate translational research (14, 15). We revealed an uneven spatial and cell-type distribution of ACE2 in the human and mouse brains.
Methods
Brain Transcriptome Databases
As listed in Table 1, 10 publicly available brain transcriptome databases that can be accessed without specialized computational expertise were used. All these databases offer extremely valuable sources of genomic data freely for academic and other non-commercial purposes. Except for the Single Cell Portal database (https://singlecell.broadinstitute.org), some of these databases have been also introduced in a recent review study (27). All databases and datasets were appropriately used and cited according to their citation policy, license, or terms of use.
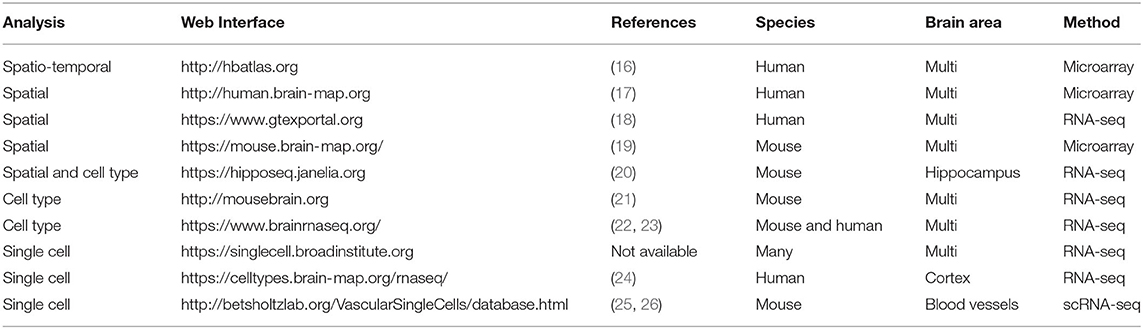
Table 1. The database used for the current study.
Analysis of the Spatial Distribution of ACE2 in the Human Brain
Three databases, including Allen Human Brain Atlas database (http://human.brain-map.org), Human Brain Transcriptome database (https://hbatlas.org), and GTEx Portal database (https://www.gtexportal.org), were used to analyze the spatial distribution of ACE2 in the human brain.
Cell-Type Distribution of ACE2 in the Human Brain
Three single-cell sequencing databases, including Single Cell Portal database (https://singlecell.broadinstitute.org, single-cell sequencing), Allen Cell Types database (http://celltypes.brain-map.org, single-cell sequencing), and Brain RNA-Seq database from Barres labs (https://www.brainrnaseq.org/, RNA-seq of cell types isolated from the human brain), were used. The summary of the included datasets for the human brain is shown in Table 2.
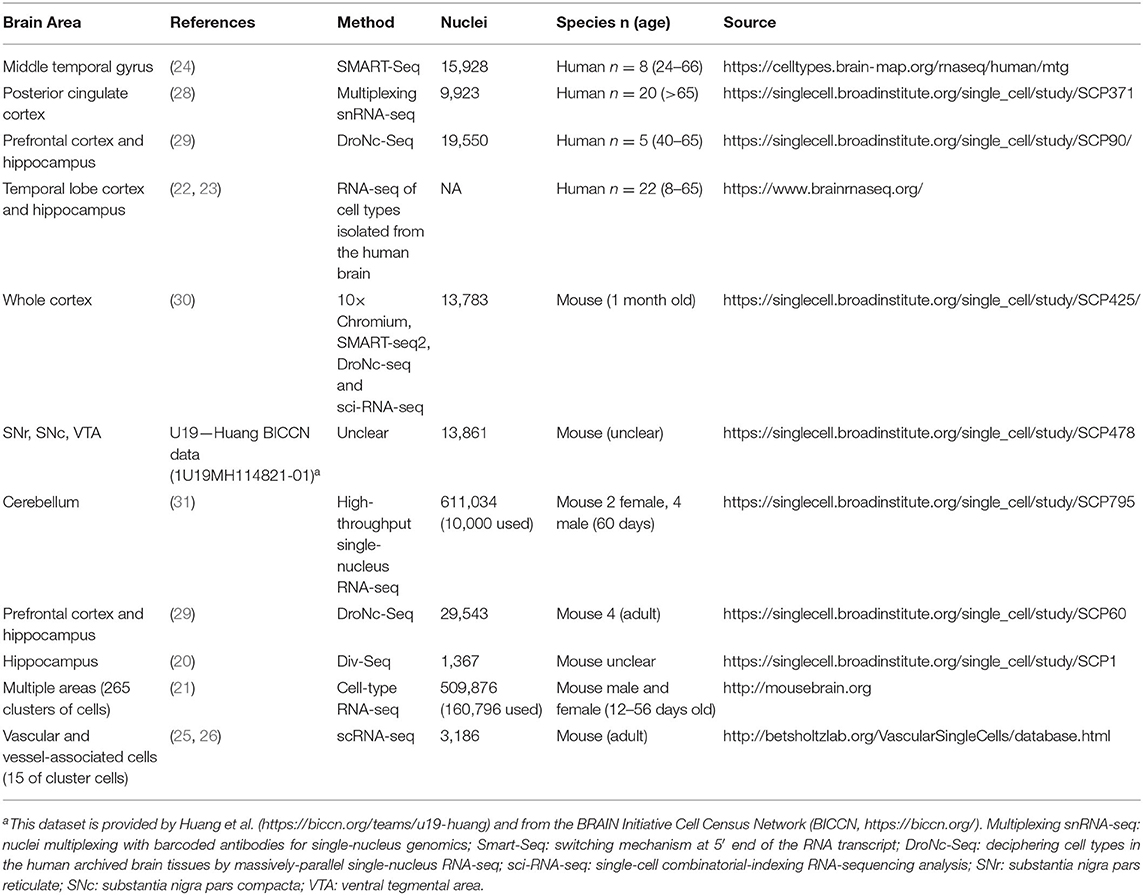
Table 2. Summary of cell-type or single-cell sequencing databases for the human and mouse brains.
Spatial and Cell-Type Distribution of Ace2 in the Mouse Brain
Allen Mouse Brain Atlas database (http://mouse.brain-map.org) was used to analyze the general spatial distribution of Ace2 in the mouse brain. The hippocampus RNA-seq Atlas database (https://hipposeq.janelia.org/), Single Cell Portal database, Mouse Brain Atlas database (http://mousebrain.org), Brain RNA-Seq database from Barres lab (https://www.brainrnaseq.org/), and Brain vascular single-cell database from Betsholtz lab were used for cell-type distribution of Ace2 in the mouse brain. The summary of the used five single-cell sequencing datasets is also shown in Table 2.
Data Processing and Statistical Analysis
Datasets were independently searched and analyzed by two authors (RC and JY), and any disagreements were discussed and resolved by consensus with the corresponding author (ZX). The data from the Allen Human Brain Atlas database and Allen Cell Types database were exported to Microsoft Excel 2017 and GraphPad Prism 6.0 for further analysis. ACE2 expression data from the Allen Human and Mouse Brain Atlas databases were imported to Brain Explorer 2.0 software to get visualization. The data from the other databases were analyzed online. Where applicable, data are expressed as median or mean. Interquartile range (IQR), 95% CI, range, and/or all sample points were also provided if possible.
Positive of expression criterion: (1) to minimize false positive of expression as previous studies (32, 33), a gene with calculate counts per million (CPM), transcripts per million (TPM), unique molecular identifier (UMI) count, or fragments per kilobase million (FPKM) >1 were considered to be positive, which also is the same as log10 (CPM), log10 (TPM), or log10 (UMI) ≥0 as well as log10 (CPM + 1), log10 (TPM + 1), and log10 (UMI + 1) ≥0.3; (2) besides, as a z score being >2 corresponds to a p-value <0.05, a z score of ACE2 expression >2 was considered as high ACE2 expression in the Allen Human Brain Atlas database.
Results
The General Expression of ACE2 in the Human Brain
According to the GTEx Portal database, the general expression of ACE2 was extremely low but not none in the brain according to our positive of expression criterion (Figure 1A). Excepted for the lung (38 out of 578, positive rate of 6.57%), the positive samples were also found in the amygdala (1 out of 152, 0.65%), anterior cingulate cortex (2 out of 176, 1.14%), caudate (3 out of 246, 1.22%), cortex (1 out of 255, 0.39%), frontal cortex (2 out of 209, 0.96%), hippocampus (4 out of 197, 2.03%), hypothalamus (3 out of 202, 1.49%), nucleus accumbens (NAc; 1 out of 246, 0.41%), putamen (1 out of 205, 0.48%), spinal cord (cervical c-1, 4 out of 159, 2.52%), and substantial nigra (5 out of 139, 3.60%), but none in the cerebellum (0 out of 241) and cerebellar hemisphere (0 out of 215).
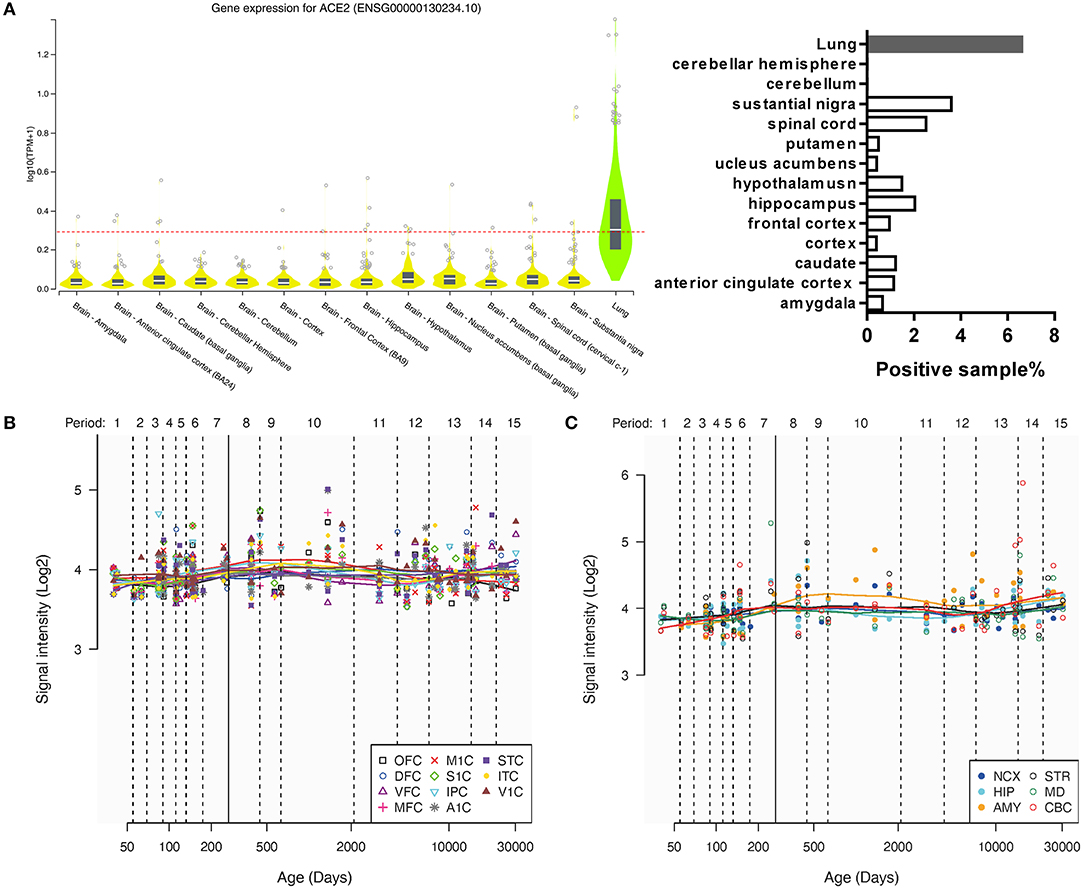
Figure 1. The general expression of ACE2 in different human brain areas. (A) The expression of ACE2 in different human brain areas and the lung according to the GTEx Portal database (18). The dotted line means log10(CPM + 1) = 0.3, which means a threshold of the positive sample (>0.3 could be positive). (B,C) Change of intensity of ACE2 expression with age in different human brain areas according to the Human Brain Transcriptome database. Data are expressed as median, interquartile range (IQR), and all sample points in (A), whereas data are expressed as mean and all sample points in (B,C).
In addition, according to the Human Brain Transcriptome database, the general expression of ACE2 was also similar among the cortex and other brain regions, which may not change a lot with age (Figures 1B,C).
Two-Spatial Distribution of ACE2 in the Human Brain
By providing slice images, the Allen Human Brain Atlas may prove a more detailed spatial distribution of ACE2 in the human brain than the GTEx Portal database and Human Brain Transcriptome database. Two microarray datasets using the different probes of ACE2 (A_23_P252981, CUST_16267_PI416261804) were collected from the Allen Human Brain Atlas database (http://human.brain-map.org/microarray/search). To provide a relatively systematic analysis of the Allen Human Brain Atlas database, we analyzed the data as both separated datasets and pooled them together. By analyzing the z score and intensity of ACE2 expression as two separated datasets, we found that 6 brain areas had high ACE2 expression (with a maximal z score of ACE2 expression >2.0) in both probe datasets, 15 brain areas had high ACE2 expression only in probe 1 dataset, and 9 brain areas had high ACE2 expression only in probe 2 dataset (Figures 2A,B).
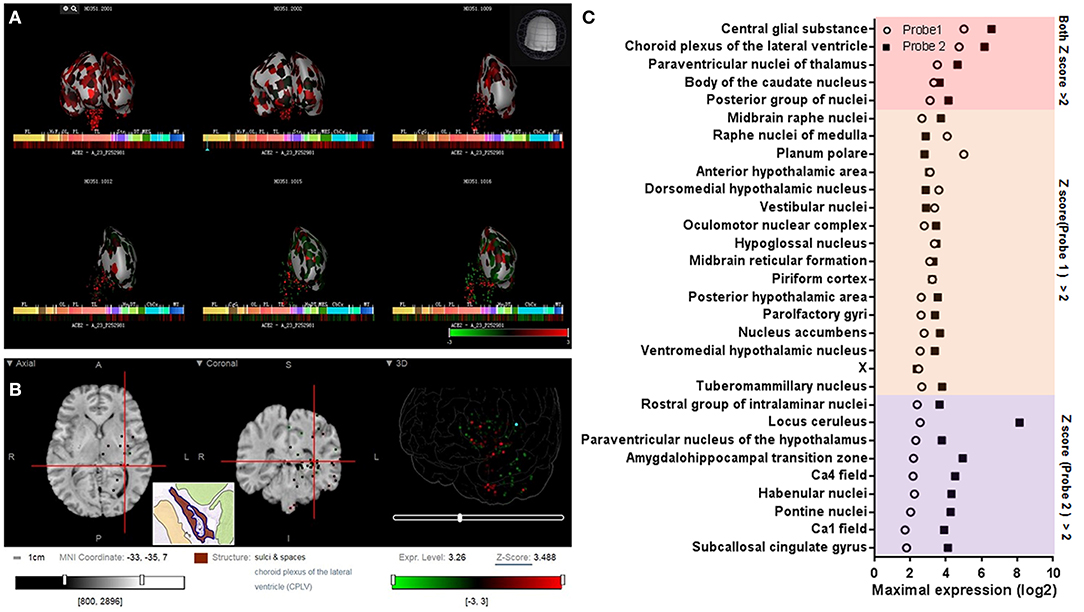
Figure 2. Spatial distribution of ACE2 in the human brain according to the Allen Human Brain Atlas. (A) 3D view of the expression of ACE2 in different human brain areas based on the data of probe A_23_P252981 (probe 1). (B) Planar view of the expression of ACE2 in the choroid plexus of the lateral ventricle. The inset shows a sampled area of the choroid plexus of the lateral ventricle (the dark area in the inset). (C) Log2 intensity of ACE2 expression in the 30 brain areas with a z score >2.0 in at least one probe dataset (probe 1: A_23_P252981; probe 2: CUST_16267_PI416261804). All data were generated from the Allen Human Brain Atlas (http://human.brain-map.org/microarray/search). Images in (A,B) were directly from the Allen Human Brain Atlas (© 2010 Allen Institute for Brain Science, Allen Human Brain Atlas, available from: http://human.brain-map.org).
To further visualize the spatial distribution of ACE2 expression and minimize the influences of the use of two different probes (such as the difference of detective sensitivity), we pooled the expression value of the two datasets and found 23 brain areas with a z score >1.0 and four of them with a z score >2.0 (Figure 3A). The spatial distribution of ACE2 expression in the human brain according to the pooled expression data is shown in Figure 3B.
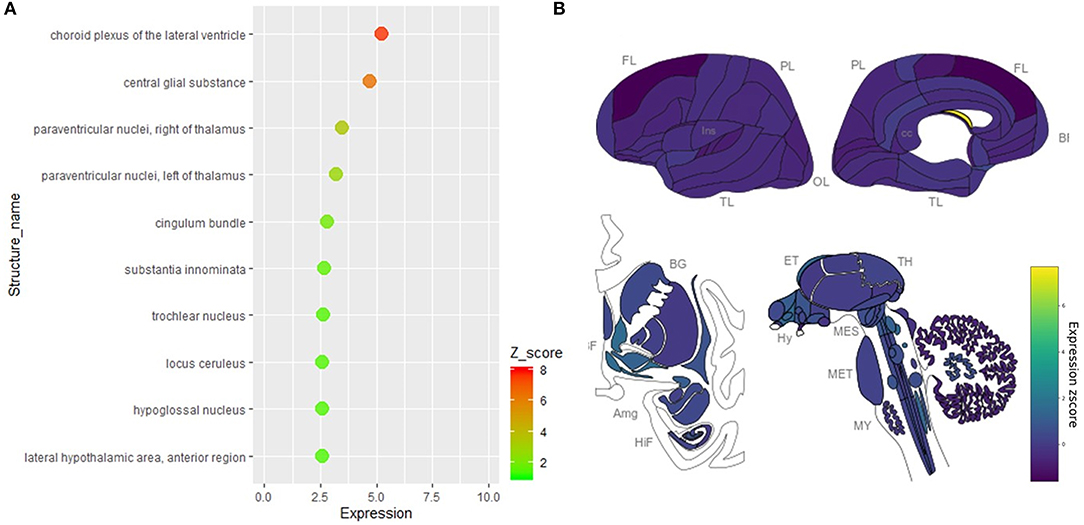
Figure 3. Spatial distribution of ACE2 in the human brain according to the pooled data of the Allen Human Brain Atlas. (A) The expression intensity and z score of ACE2 in the top 10 brain areas of the pooled expression data of the two probes. (B) The distribution view of ACE2 expression in the human brain according to the pooled expression data of the two probes. Original data are available from the Allen Human Brain Atlas (http://human.brain-map.org/microarray/search). Brain region abbreviations: FL, frontal lobe; PL, parietal lobe; TL, temporal lobe; OL, occipital lobe; BF, basal forebrain; BG, basal ganglia; AmG, amygdala; HiF, hippocampal formation; EP, epithalamus; TH, thalamus; Hy, hypothalamus; MES, mesencephalon; MET, metencephalon; MY, myelencephalon.
Cell-Type Distribution of ACE2 in the Human Brain
We further collected and analyzed single-cell sequencing data, which may provide all mRNAs present in every single cell of the tested brain tissue. By analyzing the single-cell sequencing data of the human middle temporal gyrus (https://celltypes.brain-map.org/rnaseq/human/mtg), human posterior cingulate cortex (https://singlecell.broadinstitute.org/single_cell/study/SCP371), and archived human prefrontal cortex (PFC) and hippocampus samples (https://singlecell.broadinstitute.org/single_cell/study/SCP90/), the expression of ACE2 is relatively high in the human middle temporal gyrus (a total of 2.00% of the ACE2 positive cells, 309 out of 15,603) and posterior cingulate cortex (a total of 1.38% of the ACE2 positive cells, 133 out of 9,635) samples, but it is very low in the archived human PFC (no ACE2 positive cells) and hippocampus samples (a total of 0.21% of the ACE2 positive cells, 2 out of 9,530). Besides, according to the Brain RNA-Seq database from Barres lab, we also found no expression of ACE2 in all kinds of cell subtypes that were isolated from the human anterior temporal lobe cortex and hippocampus (Supplementary Figure 1).
For the cell types, most of the ACE2 positive cells were neurons in both the human middle temporal gyrus and the posterior cingulate cortex, especially excitatory neurons (72.1% for the middle temporal gyrus and 66.1% for the posterior cingulate cortex, Figures 4A,B) and interneurons (22.4% for the middle temporal gyrus and 9.8% for the posterior cingulate cortex, Figures 4A,B). The ACE2 positive percentage of excitatory neurons was also the highest among cell types (2.14% for the middle temporal gyrus and 2.18% for the posterior cingulate cortex, Figure 4C). The details of the cell-type distribution of ACE2 in the human brain are shown in Supplementary Figures 2, 3.
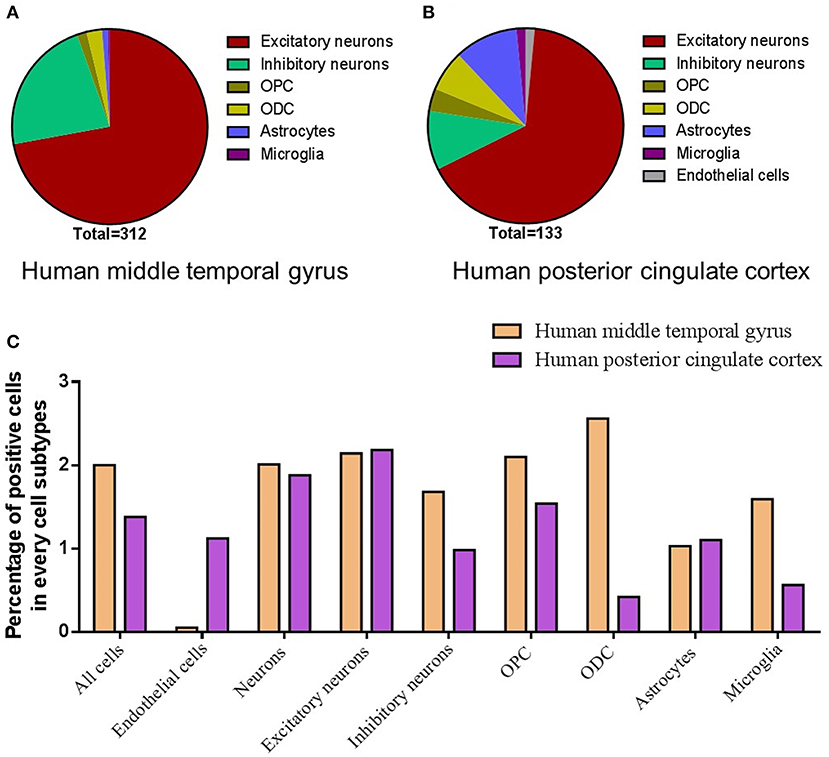
Figure 4. Cell-type distribution of ACE2 in the human brain. (A) The cell-type proportion of the total positive cells in the human middle temporal gyrus. (B) The cell-type proportion of the total positive cells in the human posterior cingulate cortex. (C) The percentage of positive cells in different cell subtypes in the human middle temporal gyrus and posterior cingulate cortex. Original data are from https://celltypes.brain-map.org/rnaseq/human/mtg and https://singlecell.broadinstitute.org.
Spatial and Cell-Type Distribution of Ace2 in the Mouse Brain
As shown in Figure 5, we additionally analyzed the spatial distribution of Ace2 in the mouse brain based on the Allen Mouse Brain Atlas (http://mouse.brain-map.org/gene/show/45849). Similar to the human brain, we found that the Ace2 expression is relatively high in the choroid plexus of the lateral ventricle, substantia nigra pars reticulata (SNr), and some cortical areas (such as the piriform cortex). We additionally found that the ACE2 expression is also relatively high in the olfactory bulb, whereas it was very low in the hippocampal areas.
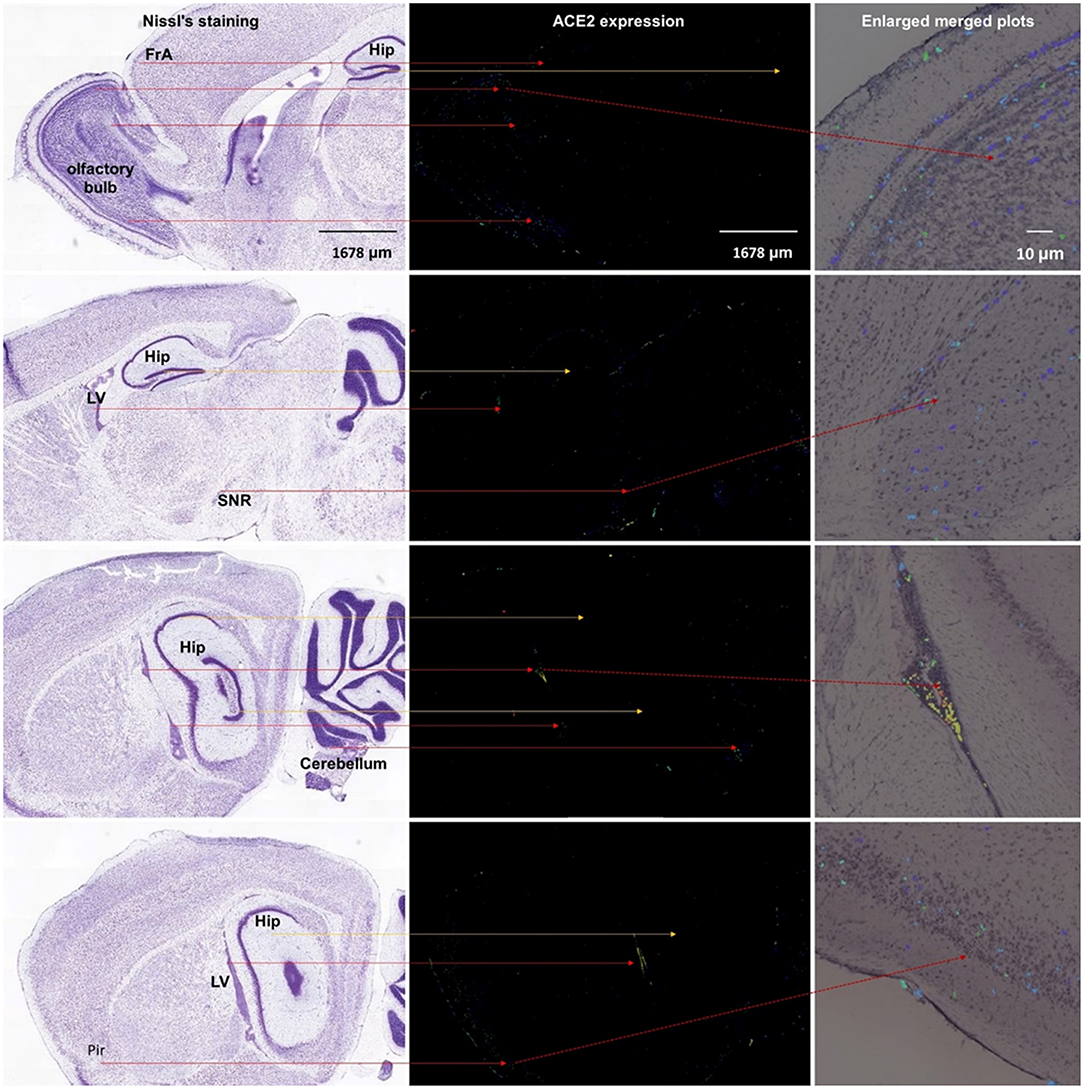
Figure 5. Spatial distribution of ACE2 in the mouse brain. The left column means the Nissl staining of mouse brain slice, the middle column means the ACE2 expression by antisense, and the right column means the enlarged merged plots from the Brain Explorer 2.0 software. Hip, hippocampus; LV, lateral ventricle; SNR, substantia nigra pars reticulate; Pir, piriform cortex. All images are from the Allen Mouse Brain Atlas (© 2004 Allen Institute for Brain Science, Allen Mouse Brain Atlas, available from https://mouse.brain-map.org/).
We further analyze the single-cell sequencing data of the multiple mouse cortex (https://singlecell.broadinstitute.org/single_cell/study/SCP425/); archived mouse brain samples (https://singlecell.broadinstitute.org/single_cell/study/SCP60); mouse hippocampus (https://singlecell.broadinstitute.org/single_cell/study/SCP1); substantia nigra pars reticulate (SNr), substantia nigra pars compacta (SNc), and ventral tegmental area (VTA) areas (https://singlecell.broadinstitute.org/single_cell/study/SCP478); and cerebellum (https://singlecell.broadinstitute.org/single_cell/study/SCP795). Similar to human data, the expression of Ace2 is relatively high in the multiple mouse cortex samples (a total of 0.84% of the Ace2 positive cells, 84 out of 10,000), but it is relatively low in the mixed mouse PFC and hippocampus samples (a total of 0.28% of the Ace2 positive cells, 38 out of 13,313) and the mouse hippocampus samples (a total of 0.1% of the Ace2 positive cells, 2 out of 1,188). Besides, the expression of Ace2 is also found in 0.68% of the cell in the mixed SNr, SNc, and VTA areas as well as 0.52% in the cerebellum.
For the cell-type distribution, different from human brain data, the Ace2 positive rate of the endothelial cells was the highest among different cell types in the mouse brain, including the multiple mouse cortex; mixed PFC and hippocampus; mixed SNr, SNc, and VTA areas; and cerebellum (Figure 6A). Similar to human brain data, the Ace2 positive rate of the neurons was also very high among different cell types in the mouse brain, including the multiple cortex (48.8%); mixed PFC and hippocampus (15%); mixed SNr, SNc, and VTA areas (10.5%); and cerebellum (7.69%) (Figure 6A). The details of the cell-type distribution of Ace2 in the mouse brain are shown in Supplementary Figure 4. Similarly, in a comprehensive atlas of the mouse nervous system, of the 265 cell clusters, 4 had an expression z score >2 (3 pericyte clusters and 1 cluster of arterial endothelial cells, Figure 6B). According to the Brain RNA-Seq database from Barres lab, Ace2 was also highly expressed in the endothelial cells in the mouse brain (Supplementary Figure 1). Besides, according to the vascular single-cell transcriptions database from Betsholtz labs (Supplementary Figure 5), we further found: (1) ACE2 was only expressed in one kind of the endothelial cells in the brain vascular and (2) the expression level of ACE2 in the endothelial cells was much lower than that in the pericytes, smooth muscle cells, vascular fibroblast-like cells, and brain vascular.
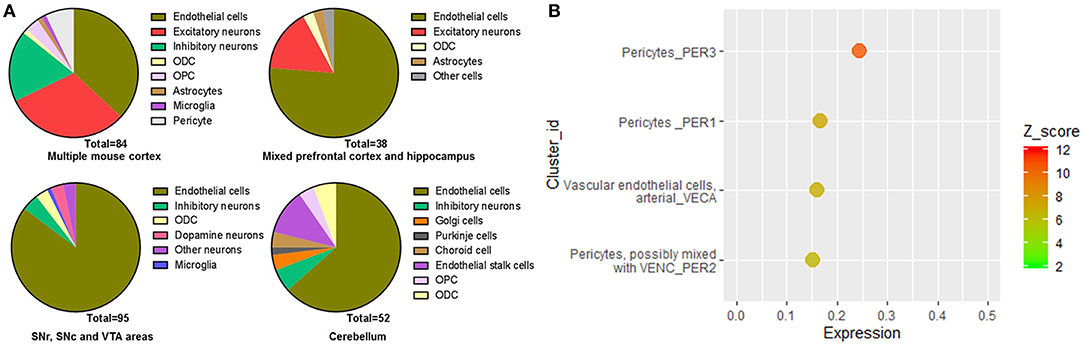
Figure 6. Cell-type distribution of Ace2 in the mice brain. (A) Cell-type distribution of Ace2 according to the Single Cell Portal database (https://singlecell.broadinstitute.org/). (B) Top cell-type cluster expression of Ace2 according to the Mouse Brain Atlas database (http://mousebrain.org).
As the inconsistent results were found in the hippocampus based on the single-cell sequencing, we additionally analyzed the expression of Ace2 in a cell-type sequencing database of the mouse hippocampus, the Hippocampus RNA-seq Atlas database (https://hipposeq.janelia.org). As shown in Supplementary Figure 6, (1) Ace2 expression was only found in the intermediate and ventral areas of the hippocampus with a mean FPKM <1; (2) Ace2 expression was found in the ventral pyramidal cells but not in the dorsal CA1 pyramidal cells, dorsal CA3 pyramidal cells, dorsal CA2 pyramidal cells, dorsal DG granule cells, dorsal DG mossy cells, ventral CA3 pyramidal cells, and ventral DG granule cells; (3) Ace2 expression was not found in parvalbumin (PV)-positive or somatostatin (SST)-positive interneurons in the hippocampus; and (4) Ace2 expression was not found in any neurons that project to the postsubiculum, NAc, or amygdala.
Discussion
ACE2 is an important entry receptor for SARS-CoV-2 and SARS-CoV infecting host organs (6). Though the infection of SARS-COV in the brain was reported in the past (34, 35), the distribution of ACE2 in the brain is still unclear. Here, we mainly found: (1) the expression of ACE2 was relatively high in several specific brain areas in human; (2) the expression of ACE2 was mainly located in many neurons (both excitatory and inhibitory neurons) in the human middle temporal gyrus and posterior cingulate cortex, but it was undetectable in the human PFC and very low in the human hippocampus; and (3) except for the additional expression of Ace2 in the olfactory bulb areas for spatial distribution and the pericytes and endothelial cells for cell-type distribution analysis, the main distribution map of Ace2 in the mouse brain was similar to that in human. Thus, our results revealed an outline of ACE2 or Ace2 distribution in the human and mouse brains, which supports the hypothesis that SARS-CoV-2 is capable to infect the brain and lead to CNS symptoms in COVID-19 patients (36). Our results indicate a heterogeneous distribution of ACE2 in different brain areas and cell types, which should be considered in further related studies.
SARS-CoV-2 shares a 77.2% amino acid identity, 72.8% sequence identity, and high structural similarity to previous SARS-CoV (37, 38). Similar to SARS-CoV, experimental affinity measurements show a high affinity of the receptor-binding domain of SARS-CoV-2 and ACE2 (37, 39). According to the GTEx Portal database, we found: (1) the total expression in the brain was much lower than that in the lung and (2) however, ACE2 positive samples were found in many brain areas, especially in the substantial nigra that the ACE2 positive sample rate was almost comparable to that in the lung. According to the Human Brain Transcriptome database, the total expression of ACE2 seems not to change with age. Moreover, according to the Allen Brain Atlas, six brain areas had relatively high expression of ACE2, especially four brain areas had high expression of ACE2 in the pooled data. Some of these high ACE2 expression brain nuclei are very important for normal brain functions, such as the paraventricular nuclei of the thalamus (involved in the control of wakefulness, feeding, appetitive motivation, drug addiction, regulation of stress and negative emotional behavior, and epilepsy) (40, 41), the raphe nuclei (the main serotoninergic nuclei in the brain) (42), and tuberomammillary nucleus (the main histaminergic nuclei in the brain) (43). Therefore, our results highlight the importance of spatial distribution rather than the overall expression of ACE2 in the brain. These results may provide some clues for further study on the brain infection of SARS-CoV-2 in COVID-19 patients and suggest that SARS-CoV-2 may result in serious CNS symptoms in COVID-19 patients (if it would infect these important brain areas by binding ACE2). Brain imaging and long-term follow-up may be required to confirm the possibility of SARS-CoV-2 brain infection and the following brain disorders in COVID-19 patients.
The routes or pathways for SARS-CoV and novel SARS-CoV-2 entering the brain are still unclear. According to experiments in mice transgenic for human ACE2, intranasal administration of SARS-CoV may enter the brain through the olfactory nerves (44). Consistent with this, we found that the expression of ACE2 in the olfactory bulb is higher than that in most other cortexes (Figure 3). In the human brain, we also found that the piriform cortex, a brain area directly connected with the olfactory bulb, had high ACE2 expression. Though no ACE2 expression data of the olfactory bulb in humans were available, our results indirectly support the hypothesis that SARS-CoV-2 might enter the human brain through the olfactory nerves. Recently, Meinhardt et al. found the olfactory transmucosal SARS-CoV-2 invasion as a port of CNS entry in individuals with COVID-19, which supports our finding (45).
On the other hand, we additionally found high ACE2 expression (z score >5) in the central glial substance and choroid plexus of the lateral ventricle in the human brain. Relatively high expression of ACE2 in the choroid plexus of the lateral ventricle was also found in the mouse brain in the current study. The central glial substance refers to an area of gray matter surrounding the central canal, which carries the cerebrospinal fluid (CSF) and helps to transport nutrients to the spinal cord (46). Besides, the choroid plexus of the ventricles is an important brain area for the generation of the CSF (47), the main location of the blood–CSF barrier (48), and serves as a crucial gateway for immune cells entering the brain (49). Recently, SARS-CoV-2 has also been found in CSF samples from a 56-year-old COVID-19 patient by genetic sequencing in China (http://www.ecns.cn/news/society/2020-03-05/detail-ifzuhesu4119860.shtml). SARS-CoV-2 may also infect the brain of a 24-year-old male patient (33). Thus, our results suggest that the high expression of ACE2 in the central glial substance and ventricles may provide another potential pathway for SARS-CoV-2 or SARS-CoV entering the CSF and/or spreading around the brain. This idea has been further confirmed by two recent studies, which found that SARS-CoV-2 infects the brain choroid plexus in human brain organoids (50, 51).
Single-nucleus RNA-seq provides a high resolution of cellular gene expression of each cell (52). According to the single-nucleus RNA-seq data, we further found that ACE2 was located in many neurons (especially excitatory neurons) and some non-neuron cells [especially astrocytes and oligodendrocytes (ODCs)] in both the posterior cingulate cortex and the middle temporal gyrus. The highest number of ACE2 positive cells was in the excitatory neurons, which may be projection neurons that make up many important brain networks. For example, excitatory neurons in the posterior cingulate cortex may project dense connections to the hippocampal formation and parahippocampal cortex, which are related to emotion and memory (53). On the other hand, the percentage of positive cells in some inhibitory neuron subtypes was comparable compared with excitatory neurons, though the total positive cell number of inhibitory neurons is lower than excitatory neurons. Inhibitory neurons are crucial for normal brain function (54). For example, the neurons in the SNr are mainly inhibitory gamma-aminobutyric acid (GABAergic) neurons, which is one important note in the neural circuits that contribute to epilepsy (41). Besides, we also found that some dopaminergic neurons and cerebellar cells in the mouse brain are also ACE2 positive. Thus, our results may help to explain the previous finding that SARS-CoV particles are mainly located in the neurons in the brain samples from SARS patients (34) and suggest that SARS-CoV-2 may also invade many neurons in the human brain and hence contribute to the CNS symptoms in COVID-19 patients.
In addition, single-nucleus RNA-seq showed that the expression of ACE2 was very low in both the endothelial cells and the pericytes from the human brain, whereas the expression of Ace2 was high in the endothelial cells and the pericytes in the mouse brain. According to RNA-seq of isolated subtype cells from the human and mouse brains, we also found that the expression of Ace2 was high in the mouse endothelial cells, but that of ACE2 was none in the human endothelial cells. Of note, previous microarray data show ACE2 expressed in the human endothelium (9), which is mainly a single layer of squamous endothelial cells. One possible reason for these differences might be that most blood vessels were excluded from the tested human brain tissues, whereas they were hard to be removed and left in the mouse brain tissues. However, some recent studies found that the human vascular endothelial cells do not express ACE2 or express relatively low levels of ACE2 (10, 11). Besides, according to the vascular single-cell transcriptions database from Betsholtz labs, the expression of Ace2 only found in one subtype of the vascular endothelial cells in the mouse brain and its level was also very low. On the contrary, the expression of Ace2 in the pericytes is very high in the mouse brain according to the database from Betsholtz labs. Thus, these results taken together suggest: (1) blood vessels may not be the main source of ACE2 expressed endothelial cells in mice; (2) the heterogeneity of ACE2 or Ace2 distribution in the subtypes of the endothelial cells or pericytes may exist in both the human and mouse brains; and (3) such a potential difference between humans and mice should be noted when using mouse models for the SARS-CoV-2 study. Further studies are need to confirm the ACE2 distribution in the specific types of the endothelial cells or pericytes (such as these nonvascular endothelial cells or pericytes in the cerebral lymphatic or ventricles), which may help SARS-CoV-2 to enter the brain and contribute to the cerebrovascular events in COVID-19 patients (55–57).
Conclusions
Our results reveal an outline of ACE2 or Ace2 distribution in the human and mouse brains, which indicates that the brain infection of SARS-CoV-2 might be capable to infect the brain and result in CNS symptoms in COVID-19 patients. The finding of high ACE2 expression in the central glial substance and brain ventricles suggests two potential novel routes for SARS-CoV-2 entering the CSF and/or spreading around the brain. A summary schematic figure is shown in Figure 7. In addition, the differences of ACE2/Ace2 distribution between humans and mice may be also useful to further “bench to bedside” translational studies regarding SARS-CoV-2. Our results may help to bring light to the brain infection of the present novel SARS-CoV-2 and previous SARS-CoV. Further studies are warranted to confirm our results and related predictions.
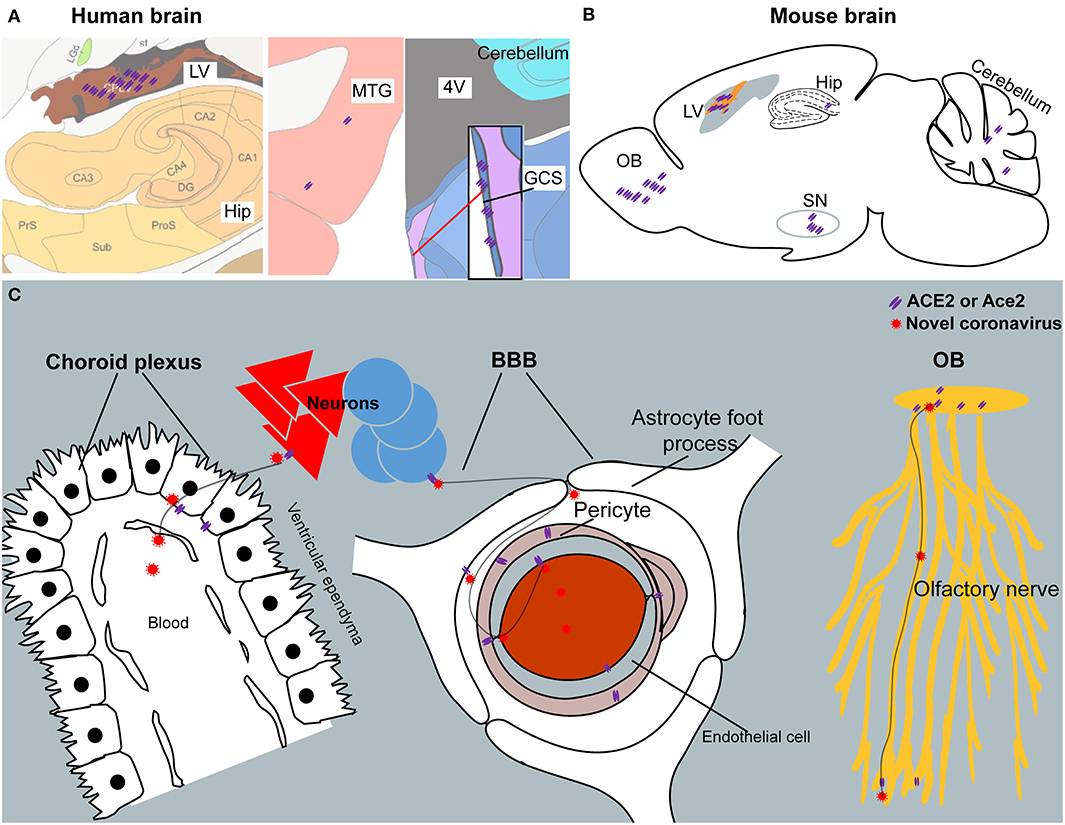
Figure 7. The summary schematic figure. (A) The distribution of ACE2 in the choroid plexus of the lateral ventricle (LV), hippocampus (Hip), middle temporal gyrus (MTG), and central glial substance (CGS) in the human brain. Pictures are modified from the human brain atlas (http://atlas.brain-map.org/) of the Allen Brain Atlas. (B) Representative ACE2 expression in the olfactory bulb (OB), choroid plexus of the lateral ventricle (LV), hippocampus (Hip), substantia nigra (SN), and cerebellum in the mouse brain. (C) Three potential routes for SARS-CoV-2 entering the CSF and/or spreading around the brain. Another potential route for SARS-CoV-2 entering the CSF from the CGS is not listed because of limited information regarding this brain area.
Data Availability Statement
The original contributions presented in the study are included in the article/Supplementary Material, further inquiries can be directed to the corresponding author/s.
Ethics Statement
Ethical review and approval was not required for the study on human participants in accordance with the local legislation and institutional requirements. Written informed consent for participation was not required for this study in accordance with the national legislation and the institutional requirements. Ethical review and approval was not required for the animal study because we just used publicly available brain transcriptome databases.
Author Contributions
ZX and CW designed the study. RC, KW, and JY performed the search and analysis. DH and LF contributed to the data analysis for Figures 1, 2. ZX and KW checked the analyzed data. ZX wrote the manuscript in consultation with JY, ZC, CW, DH, and LF. All authors contributed to the article and approved the submitted version.
Funding
This work was funded by the Natural Science Foundation of Zhejiang Province (LEZ20H190001) and the National Natural Science Foundation of China (81673623) and partly supported by the Foundation of Zhejiang Chinese Medical University (Q2019Y02 and ZYX2018002).
Conflict of Interest
The authors declare that the research was conducted in the absence of any commercial or financial relationships that could be construed as a potential conflict of interest.
Acknowledgments
We would like to thank the Allen Institute for Brain Science (https://alleninstitute.org/), BRAIN Initiative Cell Census Network (BICCN, https://biccn.org/), Brain RNA-Seq database (https://www.brainrnaseq.org/), Brain vascular single-cell database (http://betsholtzlab.org/VascularSingleCells/database.html), GTExportal database (https://www.gtexportal.org), Hippocampus RNA-seq Atlas database (https://hipposeq.janelia.org/), Human Brain Transcriptome (http://hbatlas.org), Human Brain Transcriptome database (https://hbatlas.org), Mouse Brain atlas (http://mousebrain.org), and Single Cell Portal database (https://singlecell.broadinstitute.org).
Supplementary Material
The Supplementary Material for this article can be found online at: https://www.frontiersin.org/articles/10.3389/fneur.2020.573095/full#supplementary-material
References
1. Liu Y, Eggo RM, Kucharski AJ. Secondary attack rate and superspreading events for SARS-CoV-2. Lancet. (2020) 395:e47. doi: 10.1016/S0140-6736(20)30462-1
2. Li YC, Bai WZ, Hashikawa T. The neuroinvasive potential of SARS-CoV2 may play a role in the respiratory failure of COVID-19 patients. J. Med. Virol. (2020) 92:552–5. doi: 10.1002/jmv.25728
3. Mao L, Wang M, Chen S, He Q, Chang J, Hong C, et al. Neurological manifestations of hospitalized patients with COVID-19 in Wuhan, China: a retrospective case series study. medRxiv 2020.2002.2022.20026500 (2020). doi: 10.2139/ssrn.3544840
4. Glass WG, Subbarao K, Murphy B, Murphy PM. Mechanisms of host defense following severe acute respiratory syndrome-coronavirus (SARS-CoV) pulmonary infection of mice. J. Immunol. (2004) 173:4030–9. doi: 10.4049/jimmunol.173.6.4030
5. Puelles VG, Lutgehetmann M, Lindenmeyer MT, Sperhake JP, Wong MN, Allweiss L, et al. Multiorgan and renal tropism of SARS-CoV-2. N. Engl. J. Med. (2020) 383:590–2. doi: 10.1056/NEJMc2011400
6. Hoffmann M, Kleine-Weber H, Schroeder S, Kruger N, Herrler T, Erichsen S, et al. SARS-CoV-2 cell entry depends on ACE2 and TMPRSS2 and is blocked by a clinically proven protease inhibitor. Cell. (2020) 181:271–80.e8 doi: 10.1016/j.cell.2020.02.052
7. Walls AC, Park YJ, Tortorici MA, Wall A, McGuire AT, Veesler D. Structure, function, and antigenicity of the SARS-CoV-2 spike glycoprotein. Cell. (2020) 183:1735. doi: 10.1016/j.cell.2020.11.032
8. Yan R, Zhang Y, Li Y, Xia L, Guo Y, Zhou Q. Structural basis for the recognition of the SARS-CoV-2 by full-length human ACE2. Science. (2020) 367:1444–8. doi: 10.1126/science.abb2762
9. Hamming I, Timens W, Bulthuis ML, Lely AT, Navis G, van Goor H. Tissue distribution of ACE2 protein, the functional receptor for SARS coronavirus. A first step in understanding SARS pathogenesis. J. Pathol. (2004) 203:631–7. doi: 10.1002/path.1570
10. Ahmetaj-Shala B, Peacock TP, Baillon L, Swann OC, Gashaw H, Barclay WS, et al. Resistance of endothelial cells to SARS-CoV-2 infection in vitro. bioRxiv 2020.2011.2008.372581 (2020). doi: 10.1101/2020.11.08.372581
11. He L, Mäe MA, Muhl L, Sun Y, Pietilä R, Nahar K, Vázquez Liébanas E, et al. Pericyte-specific vascular expression of SARS-CoV-2 receptor ACE2 – implications for microvascular inflammation and hypercoagulopathy in COVID-19. bioRxiv 2020.2005.2011.088500 (2020). doi: 10.1101/2020.05.11.088500
12. Xia H, Sriramula S, Chhabra KH, Lazartigues E. Brain angiotensin-converting enzyme type 2 shedding contributes to the development of neurogenic hypertension. Circ. Res. (2013) 113:1087–96. doi: 10.1161/CIRCRESAHA.113.301811
13. Martin D, Xu J, Porretta C, Nichols CD. Neurocytometry: flow cytometric sorting of specific neuronal populations from human and rodent brain. ACS Chem. Neurosci. (2017) 8:356–67. doi: 10.1021/acschemneuro.6b00374
14. Kalafatakis K, Giannakeas N, Lightman SL, Charalampopoulos I, Russell GM, Tsipouras M, et al. Utilization of the allen gene expression atlas to gain further insight into glucocorticoid physiology in the adult mouse brain. Neurosci. Lett. (2019) 706:194–200. doi: 10.1016/j.neulet.2019.05.020
15. Kalafatakis I, Kalafatakis K, Tsimpolis A, Giannakeas N, Tsipouras M, Tzallas A, et al. Using the Allen gene expression atlas of the adult mouse brain to gain further insight into the physiological significance of TAG-1/Contactin-2. Brain Struct. Funct. (2020) 225:2045–56. doi: 10.1007/s00429-020-02108-4
16. Johnson MB, Kawasawa YI, Mason CE, Krsnik Z, Coppola G, Bogdanovic D, et al. Functional and evolutionary insights into human brain development through global transcriptome analysis. Neuron. (2009) 62:494–509. doi: 10.1016/j.neuron.2009.03.027
17. Hawrylycz MJ, Lein ES, Guillozet-Bongaarts AL, Shen EH, Ng L, Miller JA, et al. An anatomically comprehensive atlas of the adult human brain transcriptome. Nature. (2012) 489:391–9. doi: 10.1038/nature11405
18. GTEx Consortium. Human genomics. The Genotype-Tissue Expression (GTEx) pilot analysis: multitissue gene regulation in humans. Science. (2015) 348:648–60. doi: 10.1126/science.1262110
19. Lein ES, Hawrylycz MJ, Ao N, Ayres M, Bensinger A, Bernard A, et al. Genome-wide atlas of gene expression in the adult mouse brain. Nature. (2007) 445:168–76. doi: 10.1038/nature05453
20. Cembrowski MS, Wang L, Sugino K, Shields BC, Spruston N. Hipposeq: a comprehensive RNA-seq database of gene expression in hippocampal principal neurons. elife. (2016) 5:e14997. doi: 10.7554/eLife.14997.028
21. Zeisel A, Hochgerner H, Lonnerberg P, Johnsson A, Memic F, van der Zwan J, et al. Molecular architecture of the mouse nervous system. Cell. (2018) 174:999–1014.e1022. doi: 10.1016/j.cell.2018.06.021
22. Zhang Y, Chen K, Sloan SA, Bennett ML, Scholze AR, O'Keeffe S, et al. An RNA-sequencing transcriptome and splicing database of glia, neurons, and vascular cells of the cerebral cortex. J. Neurosci. (2014) 34:11929–47. doi: 10.1523/JNEUROSCI.1860-14.2014
23. Zhang Y, Sloan SA, Clarke LE, Caneda C, Plaza CA, Blumenthal PD, et al. Purification and characterization of progenitor and mature human astrocytes reveals transcriptional and functional differences with mouse. Neuron. (2016) 89:37–53. doi: 10.1016/j.neuron.2015.11.013
24. Tasic B, Menon V, Nguyen TN, Kim TK, Jarsky T, Yao Z, et al. Adult mouse cortical cell taxonomy revealed by single cell transcriptomics. Nat. Neurosci. (2016) 19:335–46. doi: 10.1038/nn.4216
25. Vanlandewijck M, He L, Mäe MA, Andrae J, Ando K, Del Gaudio F, et al. A molecular atlas of cell types and zonation in the brain vasculature. Nature. (2018) 554:475–80. doi: 10.1038/nature25739
26. He L, Vanlandewijck M. Single-cell RNA sequencing of mouse brain and lung vascular and vessel-associated cell types. Sci. Data. (2018) 5:180160. doi: 10.1038/sdata.2018.160
27. Keil JM, Qalieh A, Kwan KY. Brain transcriptome databases: a user's guide. J. Neurosci. (2018) 38:2399–412. doi: 10.1523/JNEUROSCI.1930-17.2018
28. Gaublomme JT, Li B, McCabe C, Knecht A, Yang Y, Drokhlyansky E, et al. Nuclei multiplexing with barcoded antibodies for single-nucleus genomics. Nat. Commun. (2019) 10:2907. doi: 10.1038/s41467-019-10756-2
29. Habib N, Avraham-Davidi I, Basu A, Burks T, Shekhar K, Hofree M, et al. Massively parallel single-nucleus RNA-seq with DroNc-seq. Nat. Methods. (2017) 14:955–8. doi: 10.1038/nmeth.4407
30. Ding J, Adiconis X, Simmons SK, Kowalczyk MS, Hession CC, Marjanovic ND, et al. Systematic comparative analysis of single cell RNA-sequencing methods. bioRxiv. (2019). doi: 10.1101/632216
31. Kozareva V, Martin C, Osorno T, Rudolph S, Guo C, Vanderburg C, et al. A transcriptomic atlas of the mouse cerebellum reveals regional specializations and novel cell types. bioRxiv 2020.2003.2004.976407 (2020). doi: 10.1101/2020.03.04.976407
32. Gonzalez-Castellano I, Manfrin C, Pallavicini A, Martinez-Lage A. De novo gonad transcriptome analysis of the common littoral shrimp Palaemon serratus: novel insights into sex-related genes. BMC Genomics. (2019) 20:757. doi: 10.1186/s12864-019-6157-4
33. Moriguchi T, Harii N, Goto J, Harada D, Sugawara H, Takamino J, et al. A first case of meningitis/encephalitis associated with SARS-Coronavirus-2. Int. J. Infect. Dis. (2020) 94:55–8. doi: 10.1016/j.ijid.2020.03.062
34. Gu J, Gong E, Zhang B, Zheng J, Gao Z, Zhong Y, et al. Multiple organ infection and the pathogenesis of SARS. J. Exp. Med. (2005) 202:415–24. doi: 10.1084/jem.20050828
35. Xu J, Zhong S, Liu J, Li L, Li Y, Wu X, et al. Detection of severe acute respiratory syndrome coronavirus in the brain: potential role of the chemokine mig in pathogenesis. Clin. Infect. Dis. (2005) 41:1089–96. doi: 10.1086/444461
36. Kabbani N, Olds JL. Does COVID19 infect the brain? If so, smokers might be at a higher risk. Mol. Pharmacol. (2020) 97:351–3. doi: 10.1124/molpharm.120.000014
37. Brielle ES, Schneidman-Duhovny D, Linial M. The SARS-CoV-2 exerts a distinctive strategy for interacting with the ACE2 human receptor. bioRxiv 2020.2003.2010.986398 (2020). doi: 10.1101/2020.03.10.986398
38. Wu F, Zhao S, Yu B, Chen YM, Wang W, Song ZG, et al. A new coronavirus associated with human respiratory disease in China. Nature. (2020) 579:265–9. doi: 10.1038/s41586-020-2008-3
39. Lu R, Zhao X, Li J, Niu P, Yang B, Wu H, et al. Genomic characterisation and epidemiology of 2019 novel coronavirus: implications for virus origins and receptor binding. Lancet. (2020) 395:565–74. doi: 10.1016/S0140-6736(20)30251-8
40. Ren S, Wang Y, Yue F, Cheng X, Dang R, Qiao Q, et al. The paraventricular thalamus is a critical thalamic area for wakefulness. Science. (2018) 362:429–34. doi: 10.1126/science.aat2512
41. Chen B, Xu C, Wang Y, Lin W, Wang Y, Chen L, et al. A disinhibitory nigra-parafascicular pathway amplifies seizure in temporal lobe epilepsy. Nat. Commun. (2020) 11:923. doi: 10.1038/s41467-020-14648-8
42. Oikonomou G, Altermatt M, Zhang RW, Coughlin GM, Montz C, Gradinaru V, et al. The serotonergic raphe promote sleep in zebrafish and mice. Neuron. (2019) 103:686–701.e688. doi: 10.1016/j.neuron.2019.05.038
43. Hu W, Chen Z. The roles of histamine and its receptor ligands in central nervous system disorders: an update. Pharmacol. Ther. (2017) 175:116–32. doi: 10.1016/j.pharmthera.2017.02.039
44. Netland J, Meyerholz DK, Moore S, Cassell M, Perlman S. Severe acute respiratory syndrome coronavirus infection causes neuronal death in the absence of encephalitis in mice transgenic for human ACE2. J. Virol. (2008) 82:7264–75. doi: 10.1128/JVI.00737-08
45. Meinhardt J, Radke J, Dittmayer C, Franz J, Thomas C, Mothes R, et al. Olfactory transmucosal SARS-CoV-2 invasion as a port of central nervous system entry in individuals with COVID-19. Nat. Neurosci. (2020). doi: 10.1038/s41593-020-00758-5. [Epub ahead of print].
46. Thouvenin O, Keiser L, Cantaut-Belarif Y, Carbo-Tano M, Verweij F, Jurisch-Yaksi N, et al. Origin and role of the cerebrospinal fluid bidirectional flow in the central canal. elife. (2020) 9:e47699. doi: 10.7554/eLife.47699
47. Lun MP, Monuki ES, Lehtinen MK. Development and functions of the choroid plexus-cerebrospinal fluid system. Nat. Rev. Neurosci. (2015) 16:445–57. doi: 10.1038/nrn3921
48. Ghersi-Egea JF, Strazielle N, Catala M, Silva-Vargas V, Doetsch F, Engelhardt B. Molecular anatomy and functions of the choroidal blood-cerebrospinal fluid barrier in health and disease. Acta Neuropathol. (2018) 135:337–61. doi: 10.1007/s00401-018-1807-1
49. Valente LA, Begg LR, Filiano AJ. Updating neuroimmune targets in central nervous system dysfunction. Trends Pharmacol. Sci. (2019) 40:482–94. doi: 10.1016/j.tips.2019.04.013
50. Jacob F, Pather SR, Huang WK, Zhang F, Wong SZH, Zhou H, et al. Human pluripotent stem cell-derived neural cells and brain organoids reveal SARS-CoV-2 neurotropism predominates in choroid plexus epithelium. Cell Stem Cell. (2020) 27:937–50.e9. doi: 10.1016/j.stem.2020.09.016
51. Pellegrini L, Albecka A, Mallery DL, Kellner MJ, Paul D, Carter AP, et al. SARS-CoV-2 infects the brain choroid plexus and disrupts the blood-CSF barrier in human brain organoids. Cell Stem Cell. (2020) 27:951–61.e5. doi: 10.1016/j.stem.2020.10.001
52. Grun D, van Oudenaarden A. Design and analysis of single-cell sequencing experiments. Cell. (2015) 163:799–810. doi: 10.1016/j.cell.2015.10.039
53. Leech R, Sharp DJ. The role of the posterior cingulate cortex in cognition and disease. Brain. (2014) 137(Pt 1):12–32. doi: 10.1093/brain/awt162
54. Cardin JA. Inhibitory interneurons regulate temporal precision and correlations in cortical circuits. Trends Neurosci. (2018) 41:689–700. doi: 10.1016/j.tins.2018.07.015
55. Daneman R, Zhou L, Kebede AA, Barres BA. Pericytes are required for blood-brain barrier integrity during embryogenesis. Nature. (2010) 468:562–6. doi: 10.1038/nature09513
56. Sweeney MD, Ayyadurai S, Zlokovic BV. Pericytes of the neurovascular unit: key functions and signaling pathways. Nat. Neurosci. (2016) 19:771–83. doi: 10.1038/nn.4288
Keywords: angiotensin-converting enzyme 2, ACE2, brain, SARS-coronavirus 2, COVID-19
Citation: Chen R, Wang K, Yu J, Howard D, French L, Chen Z, Wen C and Xu Z (2021) The Spatial and Cell-Type Distribution of SARS-CoV-2 Receptor ACE2 in the Human and Mouse Brains. Front. Neurol. 11:573095. doi: 10.3389/fneur.2020.573095
Received: 25 June 2020; Accepted: 14 December 2020;
Published: 20 January 2021.
Edited by:
Torben Moos, Aalborg University, DenmarkReviewed by:
Konstantinos Kalafatakis, University of Ioannina, GreeceKasper Bendix Johnsen, Technical University of Denmark, Denmark
Copyright © 2021 Chen, Wang, Yu, Howard, French, Chen, Wen and Xu. This is an open-access article distributed under the terms of the Creative Commons Attribution License (CC BY). The use, distribution or reproduction in other forums is permitted, provided the original author(s) and the copyright owner(s) are credited and that the original publication in this journal is cited, in accordance with accepted academic practice. No use, distribution or reproduction is permitted which does not comply with these terms.
*Correspondence: Chengping Wen, d2VuZ2NwQDE2My5jb20=; Zhenghao Xu, eHV6aGVuZ2hhb0B6Y211LmVkdS5jbg==; orcid.org/0000-0003-0033-525X
†These authors have contributed equally to this work