 Filippo Mandelli1,2,3,4*
 Corina Nüesch1,3,4,5
 Yuancheng Zhang1
 Florian Halbeisen6Stefan Schären1,3,4
 Annegret Mündermann1,3,4,5
 Cordula Netzer1,3,4
- 1Department of Spine Surgery, University Hospital Basel, Basel, Switzerland
- 2Department of Orthopaedics, University Children's Hospital Basel, Basel, Switzerland
- 3Department of Biomedical Engineering, University of Basel, Basel, Switzerland
- 4Department of Clinical Research, University of Basel, Basel, Switzerland
- 5Department of Orthopaedics and Traumatology, University Hospital Basel, Basel, Switzerland
- 6Institute for Clinical Epidemiology and Biostatistics, University Hospital Basel, Basel, Switzerland
Objective: Fatty infiltration of paraspinal muscle is associated with spinal disorders. It can be assessed qualitatively (i.e., Goutallier classification) and quantitatively using image processing software. The aims of this study were to compare paraspinal muscle fatty infiltration as assessed using the Goutallier classification vs. quantitative magnetic resonance images (MRI) measurements and to investigate the association between anthropometric parameters and paraspinal muscle morphology and fatty infiltration in patients with symptomatic lumbar spinal stenosis (LSS).
Methods: Patients affected by symptomatic LSS scheduled for surgery with available MRI of the lumbar spine were included in this retrospective cross-sectional study. Fatty infiltration at each lumbar level was rated qualitatively according to the Goutallier classification and quantified based on the cross-sectional area (CSA) of the paraspinal muscle, of its lean fraction (LeanCSA), and the ratio between LeanCSA and CSA and the CSA relative to the CSA of vertebral body (RCSA). Considering the muscle as a single unit, overall fatty infiltration according to Goutallier, overall CSA, LeanCSA, LeanCSA/CSA, and RCSA were computed as averages (aGoutallier, aCSA, aLeanCSA, aLeanCSA/aCSA, and aRCSA). Associations among parameters were assessed using Spearman's respective Pearson's correlation coefficients.
Results: Eighteen patients, with a mean age of 71.3 years, were included. aGoutallier correlated strongly with aLeanCSA and aLeanCSA/aCSA (R = −0.673 and R = −0.754, both P < 0.001). There was a very strong correlation between values of the left and right sides for CSA (R = 0.956, P < 0.001), LeanCSA (R = 0.900, P < 0.001), and LeanCSA/CSA (R = 0.827, P < 0.001) at all levels. Among all anthropometric measurements, paraspinal muscle CSA correlated the most with height (left: R = 0.737, P < 0.001; right: R = 0.700, P < 0.001), while there was a moderate correlation between vertebral body CSA and paraspinal muscle CSA (left: R = 0.448, P < 0.001; right: R = 0.454, P < 0.001). Paraspinal muscle CSA correlated moderately with body mass index (BMI; left: R = 0.423, P < 0.001; right: R = 0.436, P < 0.001), and there was no significant correlation between aLeanCSA or aLeanCSA/CSA and BMI.
Conclusions: The Goutallier classification is a reliable yet efficient tool for assessing fatty infiltration of paraspinal muscles in patients with symptomatic LSS. We suggest taking body height as a reference for normalization in future studies assessing paraspinal muscle atrophy and fatty infiltration.
Introduction
Muscle impairment is an important component of spinal disorders. In fact, muscle dysfunction can be considered both a cause and a consequence of low back pain (LBP) (1)—for instance, several studies have shown an association between fatty infiltration and the reduced cross-sectional area (CSA) of paraspinal muscles with chronic LBP (2–7). Moreover, fatty degeneration may lead to functional limitations such as deterioration of balance and alignment of the spine (8, 9). However, to date, the contribution of compromised muscles to pain in spinal pathologies, such as facet arthropathy, disc degeneration, spinal stenosis, or deformity, is unclear. Paraspinal muscle fatty degeneration and atrophy have been reported in patients with LBP and disc herniation (10–13) or degenerative lumbar flat back (14). In patients with disc herniation, muscle infiltration may be asymmetric and more pronounced on one side than the other (15). Moreover, greater fatty infiltration in muscles such as multifidus, longissimus, and psoas correlates with poorer functional outcomes with an even stronger relation in persons with a history of LBP (16). Similarly, patients with lumbar spinal stenosis (LSS) or symptomatic LSS (sLSS) show increased muscle atrophy and fatty infiltration (17). LSS is one of the most frequent spinal disorders and the most common reason for spine surgery in the population aged above 65 years (18). While there are several studies investigating the correlation of muscle composition and morphology in patients with LBP, to date, evidence for this relationship in patients with LSS is lacking.
Fatty degeneration of the multifidus and reduced CSA of the psoas muscles have been associated with a lower functional performance in terms of higher scores on the Oswestry Disability Index (ODI) (19–21). In addition, a reduced CSA of the multifidus may predispose patients to worse outcome after surgery for sLSS (22). Moreover, the relation between CSA of paraspinal muscles and anthropometric parameters has been explored. The results of previous studies are inconclusive, where some studies did not observe a significant association between paraspinal muscle CSA and body height or body mass (23–25), while others reported a greater paraspinal CSA in taller and heavier persons (26).
Magnetic resonance imaging (MRI) facilitates the detailed investigation of the lumbar spine and the estimation of the morphology and composition of paraspinal muscles, including multifidus and erector spinae (longissimus and iliocostalis). These assessments can be performed in a qualitative or in a quantitative way. The Goutallier classification is a visual grading system to qualitatively assess fatty infiltration (27–30). Initially proposed for grading fatty degeneration of the rotator cuff muscles on computer tomography, the Goutallier classification has been expanded to MRI and to the evaluation of other muscles, including back muscles (6, 31, 32). Moreover, there is evidence of positive correlations between Goutallier grades and the severity of disc degeneration as well as age (33). Previous studies have shown a substantial to excellent intraobserver and a good interobserver reliability (32, 33) as well as a significant positive correlation of Goutallier grades, with the percentage of fat in the multifidus muscle measured in a quantitative way (32). Although the Goutallier classification is simple to apply and a useful tool for clinicians when evaluating their patients, it has the disadvantages of qualitative measurements and ordinal scales. This classification depends on the experience of the assessor and is reported on an ordinal scale with five discrete levels. In contrast, the quantitative MRI measurements of paraspinal muscles overcome such limitations by being objective and continuous measures. However, these quantitative measures are more time consuming and hence more suitable for research rather than clinical settings. To date, data on comparisons between qualitative and quantitative assessments of paraspinal muscle fatty infiltration and their association with patient characteristics in patients with sLSS are lacking. The aims of this study were to compare paraspinal muscle fatty infiltration as assessed using the Goutallier classification vs. quantitative MRI measurements, assess asymmetry in muscle degeneration, and investigate the association between anthropometric parameters and paraspinal muscle morphology and fatty infiltration in patients with sLSS.
Materials and Methods
This single center cross-sectional study was approved by the regional ethics committee and conducted in accordance with the Declaration of Helsinki. All enrolled patients provided written informed consent.
Study Cohort
Patients with a diagnosis of sLSS scheduled for decompressive surgery at the University Hospital Basel from April 2019 to August 2020 were screened for this study. The participants were recruited in the context of a larger clinical research project, and eligible patients were informed about the study after admission to the hospital on the preoperative day. The inclusion criteria were as follows: diagnosed sLSS and availability of MR images of the lumbar spine from L1 to S1. The exclusion criteria were the following: prior surgery of the lumbar spine, additional pathologies that influence the mobility of the pelvis (such as internal fixation of the sacro-iliac joint or hip disorders affecting the gait), use of walking aids, and inability to provide informed consent. Age, sex, body mass, body height, and body mass index (BMI) were recorded. The level of LBP of the participants and the extent to which the pain impacts their daily activities and social life were estimated using the validated German version of the standardized questionnaire ODI (34, 35). The ODI comprises 10 self-administered items describing the pain and limitations experienced when performing daily activities: pain intensity, personal care, lifting, walking, sitting, standing, sleeping, sexual life, social life, and traveling. The resulting score ranges from 0 (no impact) to 100 (bed-bound and extremely limited).
Lumbar MRI
All patients received MRI of the lumbar spine for clinical purposes. All MRI examinations included at least a sagittal T1- or T2-weighted sequence that was used to define the corresponding axial cut to be measured and an axial T2-weighted sequence to perform the qualitative and quantitative measurement of muscle morphology and composition. The MR images were obtained at our clinic (Prisma 3T, Siemens Healthineers, Erlangen, Germany) or provided by external providers at first consultation.
Qualitative Assessment of Paraspinal Muscle Fatty Infiltration
A qualitative assessment of paraspinal muscle fatty infiltration was performed using the Goutallier classification system (27). Accordingly, the muscle composition of the paraspinal muscles multifidus and longissimus on MRI was classified independently by two readers (FM and YZ) into five different grades based on the visually assessed fat/muscle ratio at each disc level from L1/L2 to L5/S1 (five segments in total; Figure 1). The inter-reader reliability was 0.701 (Cohens Kappa, P < 0.001). In case of disagreement between assessments, consensus was reached by a third reader (CNe). The grades range from grade 0—no visible fatty infiltration to grade 4—more than 50% of fat within the muscle. Overall qualitative fatty infiltration was computed as average Goutallier (aGoutallier) of all segments because fatty infiltration measured at each segment presumably affects the function of the entire muscle.
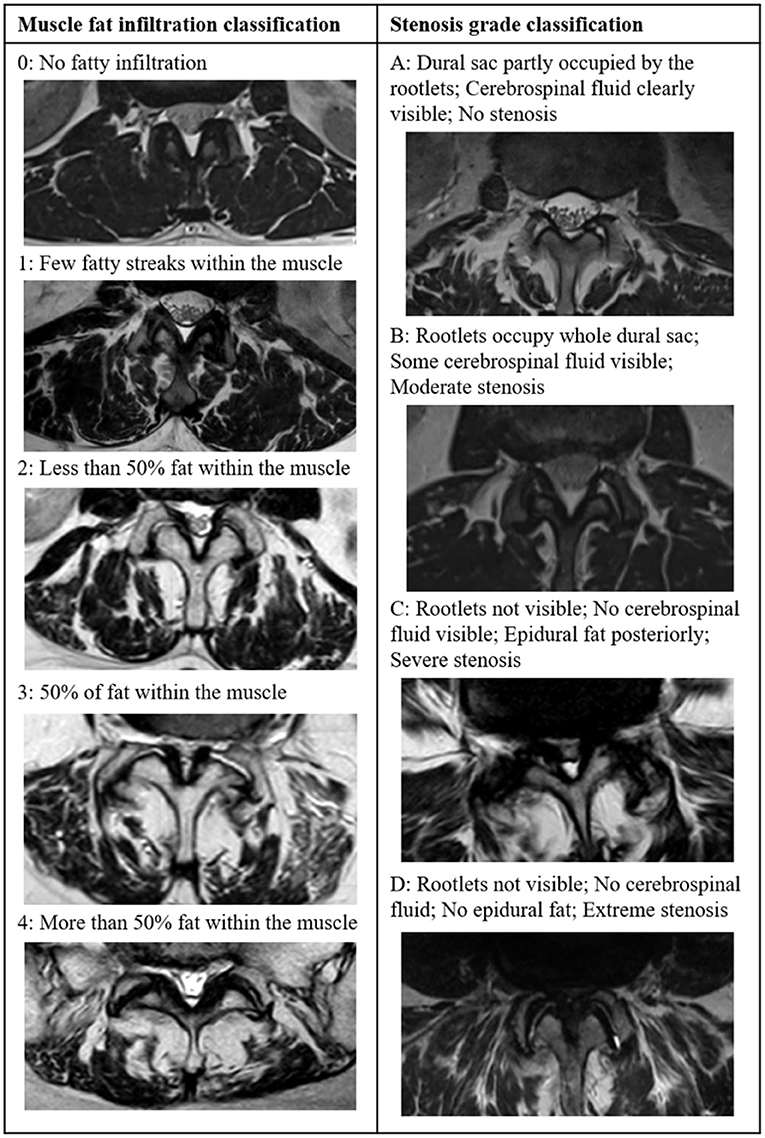
Figure 1. T2-weighted axial images showing the grading of fatty infiltration of paraspinal muscles according to the Goutallier classification (left) (27) and grading of lumbar spinal stenosis according to the Schizas classifications (right) (36).
Quantitative Assessment of Paraspinal Muscle Fatty Infiltration
The quantitative assessment of paraspinal muscle fatty infiltration was performed using ImageJ image analysis software (version 1.52t, National Institutes of Health, Bethesda, Maryland) according to Fortin et al. (20, 37). ImageJ has been used in previous studies to assess fatty infiltration in MRI series of the lumbar spine (20, 32, 38, 39) and has shown a good intra- and interobserver reliability (37). Measurements of paraspinal muscle fatty infiltration were performed independently by two assessors (FM and YZ). A T2-weighted axial image was selected at each vertebral body level in the center of the body itself as identified on the sagittal-view image. For L1 to L5, we measured the CSA of the paraspinal muscles on each side, including the multifidus and the erector spinae (longissimus and iliocostalis) muscles, and the CSA of the vertebral body. The inter-reader reliability was very high [intraclass correlation coefficient, ICC (95% confidence interval)]—CSA: 0.939 (0.917, 0.955) and vertebral body CSA: 0.894 (0.722, 0.944). The relative CSA (RCSA) was defined as the ratio between muscle CSA and vertebral body CSA and calculated for each level and side. Thresholding of grayscale for lean muscle was repeated for each level, and each image was segmented according to the specific threshold (Figure 2). The CSA of lean muscle in the region of interest was defined as LeanCSA and measured on each side. The inter-reader reliability of LeanCSA was ICC (95% confidence interval)—LeanCSA: 0.959 (0.944, 0.970). The ratio of LeanCSA to the paraspinal muscle CSA was defined as functional CSA (LeanCSA/CSA), represented as percent of muscle CSA and calculated for each level and side. The overall CSA, RCSA, and LeanCSA were computed as average CSA (aCSA), average RCSA (aRCSA), and average LeanCSA (aLeanCSA) across all levels, considering the muscle as a single unit for each side. The total muscle CSA, total RCSA, and total LeanCSA at each level were calculated as the sum of the left and right muscle CSA, RCSA, and LeanCSA, respectively. Overall LeanCSA/CSA was computed as average LeanCSA/CSA (aLeanCSA/aCSA) of all segments and both sides.
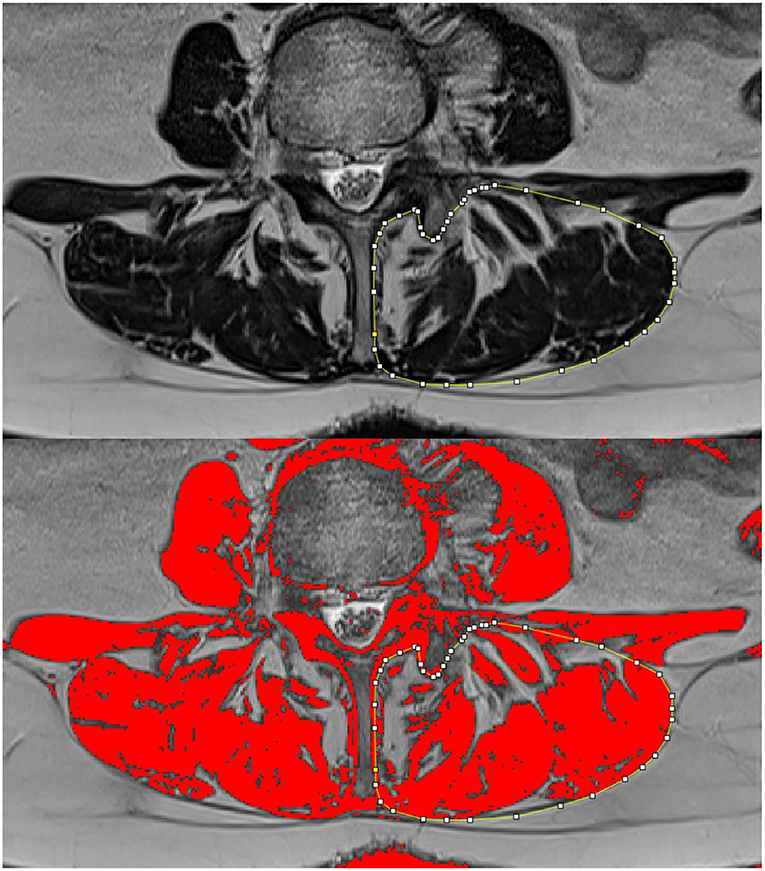
Figure 2. Using the ImageJ analysis software, the left paraspinal muscles are contoured and the cross-sectional area is measured (top); after thresholding, the lean muscle is represented in red, and its area (LeanCSA) is measured (bottom).
Radiological Assessment of Severity of Spinal Stenosis
We graded the severity of the spinal stenosis according to the Schizas classification (36). The grading system is based on cerebral spine fluid/rootlet ratio on axial T2 images and consists of seven grades (A1, A2, A3, A4, B, C, and D) of stenosis (Figure 2). The severity of stenosis was assessed for each lumbar level addressed during the scheduled surgery and carried out by one reader (FM). The number of levels with stenosis and the highest severity of stenosis were determined and used in the analysis. A1 to A4 grades were grouped into a single group A.
Statistical Analysis
Statistical analyses were performed in SPSS Statistics, version 27 (IBM Corporation, Armonk, New York, USA). All data were checked for normality using the Kolmogorov–Smirnov test. The descriptive statistics for normally distributed parameters were performed using mean and one standard deviation (SD) and for all others as median and interquartile range (IQR). Differences in CSA, RCSA, LeanCSA, and LeanCSA/CSA between levels were identified for each side using analysis of variance (ANOVA) for repeated measures, with levels as within-subject factor, and upon significant results, t-tests for dependent samples were performed as post-hoc tests for comparisons between pairs of levels. The associations between continuous and normally distributed parameters were detected using Pearson's correlation coefficient. The associations between or with ordinal (Goutallier grade) and/or not normally distributed parameters were detected using Spearman's correlation coefficient. All correlations were performed separately for each side, except for correlations between parameters describing average muscle atrophy and fatty infiltration where the combined values for both sides were included. Correlations were considered very weak for 0 ≤ |R| < 0.2, weak for 0.2 ≤ |R| < 0.4, moderate for 0.4 ≤ |R| < 0.6, strong for 0.6 ≤ |R| < 0.8, and very strong for 0.8 ≤ |R| ≤ 1.0 (40). The significance level for all tests was set a priori to 0.05.
Results
Patient Characteristics
Eighteen patients with a mean age of 71.3 years (SD: 8.4) were included. The proportion of male patients was 45% (eight of 18 patients). The mean body mass was 75.8 kg (SD: 15.0). The mean height was 167.1 cm (SD: 8.6). The mean BMI of all patients was 27.0 kg/m2 (SD: 3.9). The mean ODI score was 28.7 (SD: 13.5). The highest severity of LSS across all levels was grade B in four (22.2%) patients, grade C in 12 (66.7%) patients, and grade D in two (11.1%) patients. None of the patients had the highest stenosis severity grade A.
Qualitative Assessment of Paraspinal Muscle Fatty Infiltration
The median fatty infiltration according to the Goutallier classification system among all levels in all patients was 2.0 (IQR: 1.0–3.0). Figure 3 shows the Goutallier grade at each level. The mean aGoutallier of all patients was 1.7 (SD: 0.6).
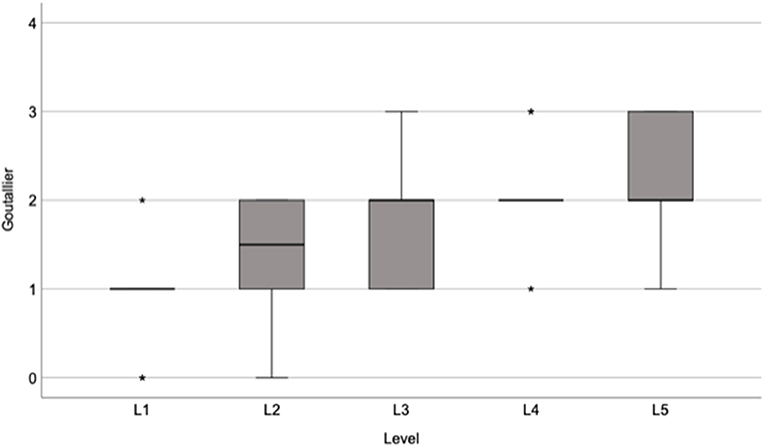
Figure 3. Box plot showing the median and interquartile range of Goutallier grades at each level of the lumbar spine.
Quantitative Assessment of Paraspinal Muscles
The MR images of two subjects did not include an axial cut of the L1 level; data at this level for 16 of the 18 patients were included. The sum of the left and right total aCSA of the paraspinal muscles was 54.2 cm2 (SD: 9.3), with the highest total paraspinal muscle CSA value of 58.0 cm2 (SD: 9.9) at the L3 level and the lowest value of 45.4 cm2 (SD: 20.0) at the L1 level (Figure 4). The statistically significant differences in paraspinal muscle CSA between levels are indicated in Figure 4. The total aRCSA was 4.4 (SD: 0.7), with the highest total (sum of left and right) RCSA value of 4.5 (SD: 0.7) at L2 level, although the differences between levels were not statistically significant (Figure 4). The total aLeanCSA was 27.7 cm2 (SD: 10.0), with the highest total (sum of left and right) LeanCSA value of 30.9 cm2 (SD: 10.9) at L2 and the lowest value of 22.8 cm2 (SD: 8.2) at L5 (Figure 4). The statistically significant differences in LeanCSA between levels are indicated in Figure 4. The total aLeanCSA/aCSA was 50.2% (SD: 12.0%), where the values decreased from L1 to L5, with the highest value of 57.8% (SD: 12.6%) at L1 and the lowest value of 42.2% (SD: 13.3%) at L5 (Figure 4). The statistically significant differences in LeanCSA/CSA between levels are indicated in Figure 4.
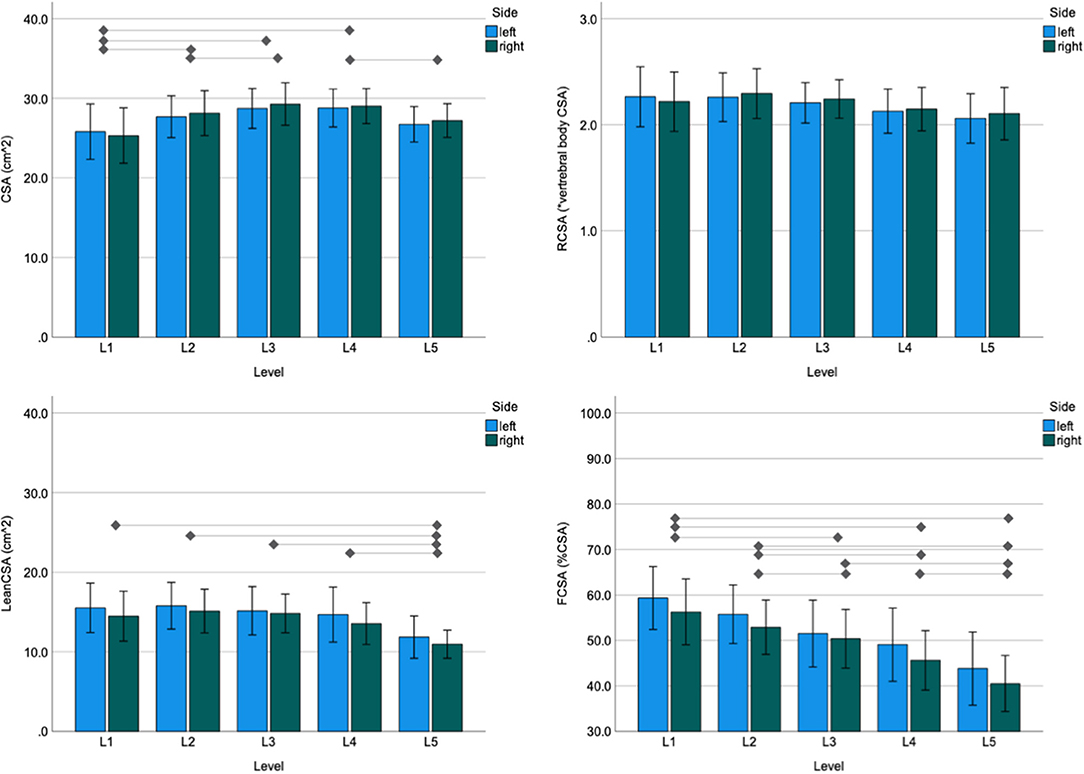
Figure 4. Mean and 95% confidence interval of the paraspinal cross-sectional area (CSA; top left), relative CSA (RCSA; top right), lean muscle cross-sectional area (LeanCSA; bottom left), and the ratio of LeanCSA/CSA and CSA (LeanCSA/CSA; bottom right) for the left and right sides at each level of the lumbar spine. The horizontal lines indicate significant differences between levels. Because significant results of paired comparisons were observed for both sides for each indicated pair, horizontal bars represent differences for both sides (t-test for paired samples, P < 0.05).
Association Between Qualitative and Quantitative Measures of Fatty Infiltration
There was a moderate correlation between the Goutallier classification system and LeanCSA across all levels, both for the left and right sides (left: R = −0.520, P < 0.001; right: R = −0.497, P < 0.001; Figure 5). There was a strong correlation between Goutallier grades and LeanCSA/CSA across all levels on both sides (left: R = −0.643, P < 0.001; right: R = −0.604, P < 0.001; Figure 5). Across both sides, aGoutallier correlated strongly with aLeanCSA and aLeanCSA/aCSA (R = −0.673 and R = −0.754, both P < 0.001) (Supplementary Figure 1). There was a very strong correlation between the values of the left and right sides for CSA (R = 0.956, P < 0.001), LeanCSA (R = 0.900, P < 0.001), and LeanCSA/CSA (R = 0.827, P < 0.001) considering all levels (Figure 6).
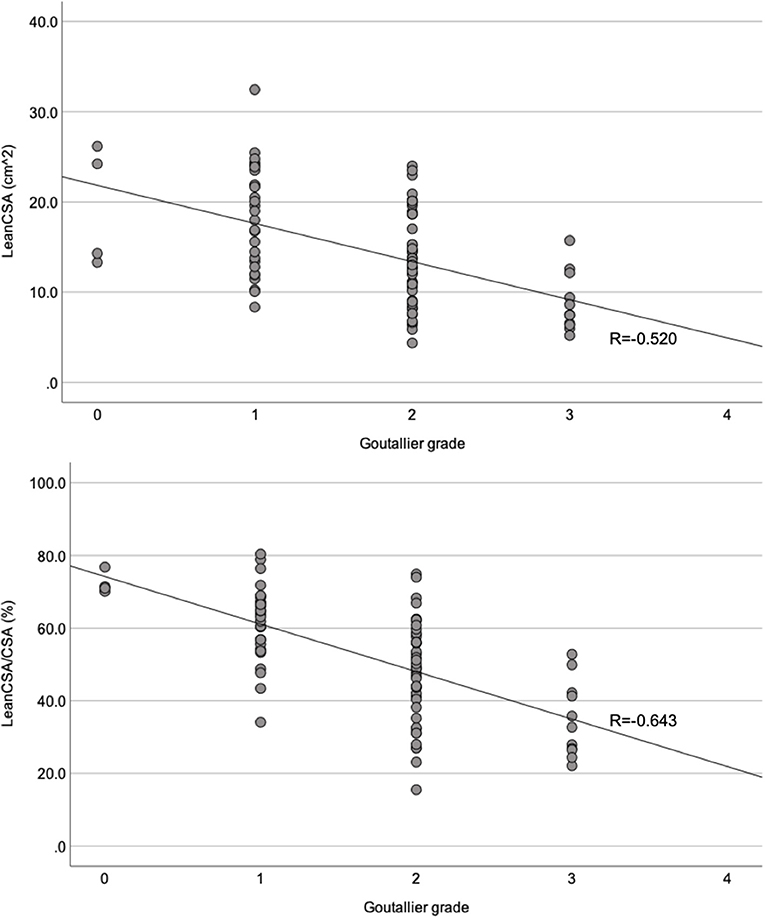
Figure 5. Scatter plots comparing the Goutallier grade for the paraspinal muscles with the lean muscle cross-sectional area (LeanCSA; top) and the ratio between LeanCSA and paraspinal muscle cross-sectional area (LeanCSA/CSA; bottom) of the left side. R, Spearman's correlation coefficient.
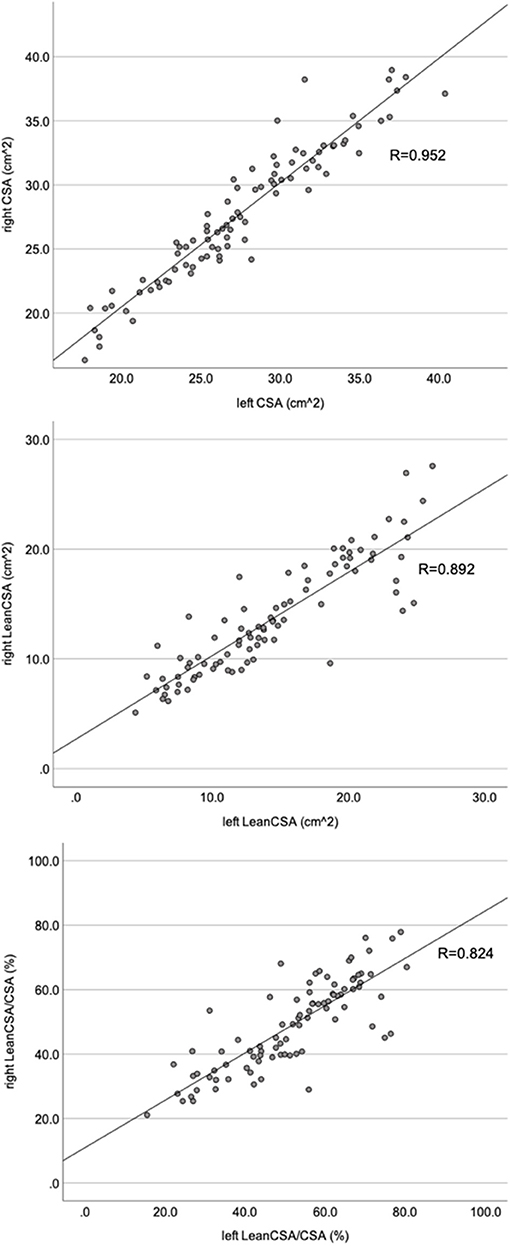
Figure 6. Scatter plots comparing the left and right sides of the paraspinal muscle cross-sectional area (CSA; top), lean muscle cross-sectional area (LeanCSA; middle) and the ratio between LeanCSA and the paraspinal muscle cross-sectional area (LeanCSA/CSA; bottom). R, Pearson's correlation coefficient.
Association Between MRI Measurements and Morphometric Parameters
There was a strong correlation between paraspinal muscle CSA and body height (left: R = 0.737, P < 0.001; right: R = 0.700, P < 0.001) and between LeanCSA and body height (left: R = 0.648, P < 0.001; right: R = 0.612, P < 0.001). There was a weak to moderate correlation between LeanCSA/CSA and body height (left: R = 0.442, P < 0.001; right: R = 0.340, P = 0.001). The Goutallier grade correlated weakly with body height (R = −0.219, P = 0.039). There was a moderate correlation between vertebral body CSA and body height (R = 0.536, P < 0.001). The paraspinal muscle CSA correlated moderately with the BMI (left: R = 0.423, P < 0.001; right: R = 0.436, P < 0.001), and there was no significant correlation between LeanCSA or LeanCSA/CSA and BMI. None of the parameters describing fatty infiltration correlated with age in this cohort.
We observed a moderate correlation between vertebral body CSA and paraspinal muscle CSA (left: R = 0.448, P < 0.001; right: R = 0.454, P < 0.001). The vertebral body CSA showed no significant correlation with LeanCSA or LeanCSA/CSA.
Discussion
The aims of this study were to compare paraspinal muscle fatty infiltration as assessed using the Goutallier classification vs. quantitative MRI measurements and to investigate the association between anthropometric parameters and paraspinal muscle morphology and fatty infiltration in patients with sLSS. We observed a moderate to strong correlation between the Goutallier classification system of muscle fatty infiltration and the quantitative assessment of the LeanCSA and lean fraction of the paraspinal muscle CSA, named as LeanCSA/CSA. Moreover, paraspinal muscle morphology and fatty infiltration correlated strongly with body height. These results support the value of assessing fatty infiltration at all levels in the lumbar region and the importance of considering the stature of a patient when interpreting fatty infiltration in the context of LSS.
Patients with higher Goutallier grades had lower LeanCSA and LeanCSA/CSA, representing smaller absolute and relative lean muscle CSA. Similarly, Battaglia et al. reported a strong to very strong correlation for MR images of 25 randomly selected subjects between Goutallier grades and mean percent fat value measured with the same method as in our study (32). Though, to date, the role of fatty infiltration and atrophy of paraspinal muscles is not clear, there is evidence of their association with LBP—for instance, Kjaer et al. found that fatty infiltration of the multifidus muscle was strongly associated with LBP (5). These results are consistent with those of Goubert et al., who found a positive correlation of fatty infiltration with chronic LBP (4). Other authors investigated the association of muscle morphology and composition with spinal disorders. Yanik et al. reported a significant increase in fatty infiltration in individuals affected by disc herniation (6), and this was corroborated by other studies (15, 41). Yarjanian et al. found a reduced functional CSA of paraspinal muscles in patients with sLSS compared to asymptomatic individuals; however, the difference was not significant when compared to subjects with chronic LBP without evidence of LSS (17). Overall, the evidence for the relation of back muscle to spinal disorders emphasizes the importance for clinicians to regularly evaluate the morphology of paraspinal muscles on the MR images of patients. However, quantitatively measuring paraspinal muscle CSA and lean fraction is time consuming and hence not feasible in the clinical setting. Our results showed that fatty atrophy, assessed using the Goutallier classification system, strongly correlates with quantitative measures and thus—despite being a qualitative measure—is a good and, most importantly, efficient method for evaluating the degeneration of paraspinal muscles in sLSS.
The quantitative measures of paraspinal muscle morphology and fatty infiltration CSA, LeanCSA, and LeanCSA/CSA correlated strongly between the left and right sides across all levels of the lumbar spine. We interpret this as a sign of symmetry in muscle morphology and degeneration. However, because we did not record data on the laterality of symptoms nor of spinal stenosis, we cannot exclude that, in case of asymmetric symptoms or spinal stenosis, an asymmetric muscle degeneration may be observed. In fact, in a study on patients affected by disc herniation, Battié et al. reported greater fatty infiltration in the multifidus muscle on the side of the radicular compression at the level below the herniation, although the total paraspinal muscle CSA was greater on the affected side (15). In another study on patients with symptomatic posterolateral disc herniation at L4 and L5, Fortin et al. did not observe an asymmetry of the multifidus but of the erector spinae muscle, with smaller CSA and greater fatty infiltration on the affected side both of the multifidus muscle and the erector spinae muscle (41). The mechanism of these findings seems to be related to abnormal muscle activation as a result of the altered neural signal (42). Conversely, we did not observe any significant asymmetry of the paraspinal muscles. While we did not assess a possible laterality of symptoms and laterality, we would have only been able to detect a systematic laterality of all patients, which was not the scope of this study. Another possible explanation for this discrepancy is that LSS and its symptoms are more commonly bilateral compared to disc herniation. Nevertheless, further investigation is needed to support this statement.
Fatty infiltration generally increased from cranial to caudal, with the highest value at L5. This result confirms previous studies by Kjaer et al. (5) and Lee et al. (14), who showed that L4 and L5 are the segments most affected by fatty infiltration. In our study, both LeanCSA and LeanCSA/CSA differed significantly between L5 and all other levels. One possible explanation is that most degenerative spinal processes involve the segments L4/L5 and L5/S1 (43), but there is a lack of evidence regarding a causal link between fatty atrophy of paraspinal muscles and spinal disorders. Furthermore, Lee et al. (14) observed an increasing fatty infiltration toward the more caudal levels in 10 healthy volunteers. Kjaer et al. (5) found that the lowest lumbar levels had the greatest signs of fatty infiltration regardless of age in adults and adolescents with a history of LBP. These results suggest that the most caudal lumbar levels are physiologically more prone to fatty infiltration even in young and healthy individuals. Spinal pathologies known to be more frequent at these levels and to be associated with an increase in fatty infiltration of the back muscles may further exaggerate the difference in muscle composition between the cranial and caudal portions of the paraspinal muscles.
Our secondary aim was to determine the association between quantitative measurements of paraspinal muscle morphology and fatty infiltration and anthropometric parameters. We found that CSA and LeanCSA had a strong and LeanCSA/CSA had a weak correlation with body height. The results of previous studies on this association are inconclusive—for instance, our results confirm those reported by Gibbons et al., who observed a positive correlation between the CSA of paraspinal muscles and body height, body mass, and BMI in a large sample of male monozygotic twins (130 subjects) (26). In contrast, two smaller studies by Wood et al. (25) and McGill et al. (23) (13 and 26, respectively) did not find any significant association of CSA with body height, body mass, or BMI in persons with various suspected injuries and diseases. Moreover, Reid et al. reported that greater body height was not a predictor of larger CSA (24). Biomechanically, an association of CSA with body height is intuitive because the greater a person is, the greater are the moment arms of the forces generated by the weight of the upper torso, arms, and head relative to the lumbar spine area during daily activities. Frequently, the paraspinal total and lean CSA are normalized to the vertebral body or intervertebral disc CSA (19, 44–47). It is interesting to note that, in our study, both overall CSA and LeanCSA correlated more strongly with body height than with vertebral CSA (strong vs. moderate correlation). Although we consider the vertebral body or the disc as reasonable choice of reference for reducing the bias of differences in anthropometric measures between persons, our results suggest that body height greatly influences paraspinal muscle CSA and should hence be used for normalization.
In our study, only CSA, but not LeanCSA or LeanCSA/CSA, correlated with BMI. This result is consistent with the study by Kjaer et al. (5) who did not find BMI to have an influence on the amount of fatty infiltration in the paraspinal muscles. Moreover, Gibbons et al. (26) found that a greater BMI was a predictor of greater CSA, and Kalichman et al. (48) reported a negative correlation between muscle density on CT scan and BMI. Our results show that people with higher BMI are not prone to greater fatty infiltration of paraspinal muscles, possibly because stronger muscles are required to account for the larger body weight in obese persons when stabilizing the spine. These observations suggest that the higher levels of fatty infiltration of paraspinal muscles are likely not related to obesity but rather to the degenerative process of the muscle itself or to the spinal disorder affecting the patient.
The main strength of our study is the measurement of qualitative and quantitative parameters of paraspinal muscles at each level of the lumbar spine regardless of the level of stenosis. Despite the evidence that fatty infiltration is greater between L4 and S1 and given the anatomy and function of the erector spinae and multifidus muscles, we believe that these entire muscles should be considered as a single unit. Hence, we introduced global qualitative and quantitative parameters for assessing fatty atrophy of the entire paraspinal muscle unit which aGoutallier and aLeanCSA defined as the average of the respective parameters across all levels. The main limitation of our study is the small sample size, and thus we could not correct for multiple testing. However, while this study can be considered a proof-of-principle investigation, the strong correlations and clear differences observed in our study suggest that these results should hold true when investigated in larger samples. Moreover, we included only individuals affected by sLSS and scheduled for surgery. Similar analyses should be conducted in patients with less severe LSS or who were treated conservatively and in age-matched healthy controls to elucidate the role of muscle atrophy and fatty infiltration in the etiology of the disease and the effects of different treatments on these parameters. The MR images were either obtained at our clinic or transferred by external providers. While using the same make and model for all measurements may have provided even better results, we intended to conduct this study in a real-world environment. In other words, if the same make and model had been used for all patients, the generalizability of the data to other MRI systems would have been unknown/limited. In contrast, our data showed strong correlations despite the different make and models of the MRI systems used, suggesting that the agreement between the assessments is robust regarding the specific MRI system, making our result even more relevant in a clinical context. Finally, while the quantitative method employed here has shown good interobserver and excellent intraobserver reliability, the accuracy of the thresholding procedure has yet to be confirmed with MRI sequences based on chemical shift (Dixon) or spectroscopy. Nonetheless, the sequence used here is a standard clinical sequence, and extracting information on fatty infiltration in standard clinical sequences is relevant especially in cases where Dixon sequences are not available.
Conclusion
The correlation of the Goutallier classification with the quantitative assessment of fatty infiltration of paraspinal muscles suggests that clinicians should consider this classification as an efficient tool for evaluating paraspinal muscle fatty infiltration. Nonetheless, this qualitative measure does not consider muscle morphology, which may add insight into the role that paraspinal muscle status plays in the etiology of LSS. Because paraspinal muscle CSA correlates with body height, we suggest taking body height as a reference for normalization in future studies assessing paraspinal muscle atrophy and fatty infiltration.
Data Availability Statement
The raw data supporting the conclusions of this article will be made available by the authors, without undue reservation.
Ethics Statement
The studies involving human participants were reviewed and approved by Ethikkommission Nordwest- und Zentralschweiz (EKNZ). The patients/participants provided their written informed consent to participate in this study.
Author Contributions
FM: conceptual study design, data collection and processing, and manuscript writing. CNü: conceptual study design, patient recruitment, data collection and processing, statistical analysis, and manuscript review. YZ: data compilation and manuscript review. FH: statistical analysis and manuscript review. SS: conceptual study design and manuscript review. AM: conceptual study design, data analysis, statistical analysis, and manuscript writing and review. CNe: conceptual study design, patient recruitment, and manuscript review. All authors contributed to the article and approved the submitted version.
Funding
This study was funded by the Department of Spinal Surgery and the Department of Orthopaedics and Traumatology of the University Hospital Basel, Switzerland.
Conflict of Interest
The authors declare that the research was conducted in the absence of any commercial or financial relationships that could be construed as a potential conflict of interest.
Publisher's Note
All claims expressed in this article are solely those of the authors and do not necessarily represent those of their affiliated organizations, or those of the publisher, the editors and the reviewers. Any product that may be evaluated in this article, or claim that may be made by its manufacturer, is not guaranteed or endorsed by the publisher.
Supplementary Material
The Supplementary Material for this article can be found online at: https://www.frontiersin.org/articles/10.3389/fneur.2021.656487/full#supplementary-material
Supplementary Figure 1. Scatter plots comparing the average Goutallier grade across all levels (aGoutallier) with the average lean muscle cross-sectional area (aLeanCSA; top) and the ratio between average LeanCSA and average paraspinal muscle cross-sectional area (aLeanCSA/aCSA; bottom). R, Pearson's correlation coefficient.
References
1. Lee J-H, Hoshino Y, Nakamura K, Kariya Y, Saita K, Ito K. Trunk muscle weakness as a risk factor for low back pain: a 5-year prospective study. Spine. (1999) 24:54–57. doi: 10.1097/00007632-199901010-00013
2. Belavý DL, Armbrecht G, Richardson CA, Felsenberg D, Hides JA. Muscle atrophy and changes in spinal morphology: is the lumbar spine vulnerable after prolonged bed-rest? Spine. (2011) 36:137–45. doi: 10.1097/BRS.0b013e3181cc93e8
3. Kalichman L, Carmeli E, Been E. The association between imaging parameters of the paraspinal muscles, spinal degeneration, and low back pain. BioMed Res Int. (2017) 2017:1–14. doi: 10.1155/2017/2562957
4. Goubert D, De Pauw R, Meeus M, Willems T, Cagnie B, Schouppe S, et al. Lumbar muscle structure and function in chronic versus recurrent low back pain: a cross-sectional study. Spine J. (2017) 17:1285–96. doi: 10.1016/j.spinee.2017.04.025
5. Kjaer P, Bendix T, Sorensen JS, Korsholm L, Leboeuf-Yde C. Are MRI-defined fat infiltrations in the multifidus muscles associated with low back pain? BMC Med. (2007) 5:2. doi: 10.1186/1741-7015-5-2
6. Yanik B, Keyik B, Conkbayir I. Fatty degeneration of multifidus muscle in patients with chronic low back pain and in asymptomatic volunteers: quantification with chemical shift magnetic resonance imaging. Skeletal Radiol. (2013) 42:771–8. doi: 10.1007/s00256-012-1545-8
7. Kalichman L, Kim DH, Li L, Guermazi A, Hunter DJ. Computed tomography-evaluated features of spinal degeneration: prevalence, intercorrelation, and association with self-reported low back pain. Spine J. (2010) 10:200–8. doi: 10.1016/j.spinee.2009.10.018
8. Masaki M, Ikezoe T, Fukumoto Y, Minami S, Tsukagoshi R, Sakuma K, et al. Association of sagittal spinal alignment with thickness and echo intensity of lumbar back muscles in middle-aged and elderly women. Arch Gerontol Geriatr. (2015) 61:197–201. doi: 10.1016/j.archger.2015.05.010
9. Jun HS, Kim JH, Ahn JH, Chang IB, Song JH, Kim TH, et al. The effect of lumbar spinal muscle on spinal sagittal alignment. Neurosurgery. (2016) 1:847–55. doi: 10.1227/NEU.0000000000001269
10. Barker KL, Shamley DR, Jackson D. Changes in the cross-sectional area of multifidus and psoas in patients with unilateral back pain: the relationship to pain and disability. Spine. (2004) 29:E515–9. doi: 10.1097/01.brs.0000144405.11661.eb
11. Ploumis A, Michailidis N, Christodoulou P, Kalaitzoglou I, Gouvas G, Beris A. Ipsilateral atrophy of paraspinal and psoas muscle in unilateral back pain patients with monosegmental degenerative disc disease. Br J Radiol. (2011) 84:709–13. doi: 10.1259/bjr/58136533
12. Hyun JK, Lee JY, Lee SJ, Jeon JY. Asymmetric atrophy of multifidus muscle in patients with unilateral lumbosacral radiculopathy. Spine. (2007) 32:E598–602. doi: 10.1097/BRS.0b013e318155837b
13. Kim WH, Lee S-H, Lee DY. Changes in the cross-sectional area of multifidus and psoas in unilateral sciatica caused by lumbar disc herniation. J Korean Neurosurg Soc. (2011) 50:201. doi: 10.3340/jkns.2011.50.3.201
14. Lee JC, Cha JG, Kim Y, Kim YI, Shin BJ. Quantitative analysis of back muscle degeneration in the patients with the degenerative lumbar flat back using a digital image analysis: comparison with the normal controls. Spine. (2008) 33:318–25. doi: 10.1097/BRS.0b013e318162458f
15. Battié MC, Niemelainen R, Gibbons LE, Dhillon S. Is level- and side-specific multifidus asymmetry a marker for lumbar disc pathology? Spine J. (2012) 12:932–9. doi: 10.1016/j.spinee.2012.08.020
16. Hicks GE, Simonsick EM, Harris TB, Newman AB, Weiner DK, Nevitt MA, et al. Trunk muscle composition as a predictor of reduced functional capacity in the health, aging and body composition study: the moderating role of back pain. J Gerontol A Biol Sci Med Sci. (2005) 60:1420–4. doi: 10.1093/gerona/60.11.1420
17. Yarjanian JA, Fetzer A, Yamakawa KS, Tong HC, Smuck M, Haig A. Correlation of paraspinal atrophy and denervation in back pain and spinal stenosis relative to asymptomatic controls. PM R. (2013) 5:39–44. doi: 10.1016/j.pmrj.2012.08.017
18. Deyo RA, Gray DT, Kreuter W, Mirza S, Martin BI. United States trends in lumbar fusion surgery for degenerative conditions. Spine. (2005) 30:1441–5; discussion 1446–7. doi: 10.1097/01.brs.0000166503.37969.8a
19. Chen YY, Pao JL, Liaw CK, Hsu WL, Yang RS. Image changes of paraspinal muscles and clinical correlations in patients with unilateral lumbar spinal stenosis. Eur Spine J. (2014) 23:999–1006. doi: 10.1007/s00586-013-3148-z
20. Fortin M, Lazáry À, Varga PP, Battié MC. Association between paraspinal muscle morphology, clinical symptoms and functional status in patients with lumbar spinal stenosis. Eur Spine J. (2017) 26:2543–51. doi: 10.1007/s00586-017-5228-y
21. Wang W, Sun Z, Li W, Chen Z. The effect of paraspinal muscle on functional status and recovery in patients with lumbar spinal stenosis. J Orthop Surg Res. (2020) 15:235. doi: 10.1186/s13018-020-01751-1
22. Zotti MGT, Boas FV, Clifton T, Piche M, Yoon WW, Freeman BJC. Does pre-operative magnetic resonance imaging of the lumbar multifidus muscle predict clinical outcomes following lumbar spinal decompression for symptomatic spinal stenosis? Eur Spine J. (2017) 26:2589–97. doi: 10.1007/s00586-017-4986-x
23. McGill SM, Patt N, Norman RW. Measurement of the trunk musculature of active males using CT scan radiography: implications for force and moment generating capacity about the L4/L5 joint. J Biomech. (1988) 21:329–41. doi: 10.1016/0021-9290(88)90262-X
24. Reid JG, Costigan PA, Comrie W. Prediction of trunk muscle areas and moment arms by use of anthropometric measures. Spine. (1987) 12:273–5. doi: 10.1097/00007632-198704000-00015
25. Wood S, Pearsall DJ, Ross R, Reid JG. Trunk muscle parameters determined from MRI for lean to obese males. Clin Biomech. (1996) 11:139–44. doi: 10.1016/0268-0033(95)00018-6
26. Gibbons LE, Videman T, Battié MC, Kaprio J. Determinants of paraspinal muscle cross-sectional area in male monozygotic twins. Phys Ther. (1998) 78:602–10; discussion 611–2. doi: 10.1093/ptj/78.6.602
27. Goutallier D, Postel JM, Bernageau J, Lavau L, Voisin MC. Fatty muscle degeneration in cuff ruptures. Pre- and postoperative evaluation by CT scan. Clin Orthop Relat Res. (1994):78–83. doi: 10.1097/00003086-199407000-00014
28. Oh JH, Kim SH, Choi J-A, Kim Y, Oh CH. Reliability of the grading system for fatty degeneration of rotator cuff muscles. Clin Orthop Relat Res. (2010) 468:1558–64. doi: 10.1007/s11999-009-0818-6
29. Slabaugh MA, Friel NA, Karas V, Romeo AA, Verma NN, Cole BJ. Interobserver and intraobserver reliability of the Goutallier classification using magnetic resonance imaging: proposal of a simplified classification system to increase reliability. Am J Sports Med. (2012) 40:1728–34. doi: 10.1177/0363546512452714
30. Lee E, Choi JA, Oh JH, Ahn S, Hong SH, Chai JW, et al. Fatty degeneration of the rotator cuff muscles on pre- and postoperative CT arthrography (CTA): is the Goutallier grading system reliable? Skeletal Radiol. (2013) 42:1259–67. doi: 10.1007/s00256-013-1660-1
31. Engelken F, Wassilew GI, Köhlitz T, Brockhaus S, Hamm B, Perka C, et al. Assessment of fatty degeneration of the gluteal muscles in patients with THA using MRI: reliability and accuracy of the Goutallier and quartile classification systems. J Arthroplasty. (2014) 29:149–53. doi: 10.1016/j.arth.2013.04.045
32. Battaglia PJ, Maeda Y, Welk A, Hough B, Kettner N. Reliability of the Goutallier classification in quantifying muscle fatty degeneration in the lumbar multifidus using magnetic resonance imaging. J Manipulative Physiol Ther. (2014) 37:190–7. doi: 10.1016/j.jmpt.2013.12.010
33. Tamai K, Chen J, Stone M, Arakelyan A, Paholpak P, Nakamura H, et al. The evaluation of lumbar paraspinal muscle quantity and quality using the Goutallier classification and lumbar indentation value. Eur Spine J. (2018) 27:1005–12. doi: 10.1007/s00586-018-5485-4
34. Fairbank JC, Pynsent PB. The oswestry disability index. Spine. (2000) 25:2940–52; discussion 2952. doi: 10.1097/00007632-200011150-00017
35. Mannion AF, Junge A, Fairbank JC, Dvorak J, Grob D. Development of a German version of the Oswestry Disability Index. Part 1: cross-cultural adaptation, reliability, and validity. Eur Spine J. (2006) 15:55–65. doi: 10.1007/s00586-004-0815-0
36. Schizas C, Theumann N, Burn A, Tansey R, Wardlaw D, Smith FW, et al. Qualitative grading of severity of lumbar spinal stenosis based on the morphology of the dural sac on magnetic resonance images. Spine. (2010) 35:1919–24. doi: 10.1097/BRS.0b013e3181d359bd
37. Fortin M, Battie MC. Quantitative paraspinal muscle measurements: inter-software reliability and agreement using OsiriX and ImageJ. Phys Ther. (2012) 92:853–64. doi: 10.2522/ptj.20110380
38. Ranson CA, Burnett AF, Kerslake R, Batt ME, O'Sullivan PB. An investigation into the use of MR imaging to determine the functional cross sectional area of lumbar paraspinal muscles. Eur Spine J. (2006) 15:764–73. doi: 10.1007/s00586-005-0909-3
39. Fortin M, Omidyeganeh M, Battie MC, Ahmad O, Rivaz H. Evaluation of an automated thresholding algorithm for the quantification of paraspinal muscle composition from MRI images. Biomed Eng Online. (2017) 16:61. doi: 10.1186/s12938-017-0350-y
41. Fortin M, Lazáry À, Varga PP, McCall I, Battié MC. Paraspinal muscle asymmetry and fat infiltration in patients with symptomatic disc herniation. Eur Spine J. (2016) 25:1452–9. doi: 10.1007/s00586-016-4503-7
42. Hodges P, Holm AK, Hansson T, Holm S. Rapid atrophy of the lumbar multifidus follows experimental disc or nerve root injury. Spine. (2006) 31:2926–33. doi: 10.1097/01.brs.0000248453.51165.0b
43. Saleem S, Aslam HM, Rehmani MA, Raees A, Alvi AA, Ashraf J. Lumbar disc degenerative disease: disc degeneration symptoms and magnetic resonance image findings. Asian Spine J. (2013) 7:322–34. doi: 10.4184/asj.2013.7.4.322
44. Leng J, Han G, Zeng Y, Chen Z, Li W. The effect of paraspinal muscle degeneration on distal pedicle screw loosening following corrective surgery for degenerative lumbar scoliosis. Spine. (2020) 45:590–8. doi: 10.1097/BRS.0000000000003336
45. Kim JY, Ryu DS, Paik HK, Ahn SS, Kang MS, Kim KH, et al. Paraspinal muscle, facet joint, and disc problems: risk factors for adjacent segment degeneration after lumbar fusion. Spine J. (2016) 16:867–75. doi: 10.1016/j.spinee.2016.03.010
46. Xia W, Fu H, Zhu Z, Liu C, Wang K, Xu S, et al. Association between back muscle degeneration and spinal-pelvic parameters in patients with degenerative spinal kyphosis. BMC Musculoskelet Disord. (2019) 20:454. doi: 10.1186/s12891-019-2837-0
47. Urrutia J, Besa P, Lobos D, Campos M, Arrieta C, Andia M, et al. Lumbar paraspinal muscle fat infiltration is independently associated with sex, age, and inter-vertebral disc degeneration in symptomatic patients. Skeletal Radiol. (2018) 47:955–61. doi: 10.1007/s00256-018-2880-1
Keywords: paraspinal muscles fatty infiltration, muscle fatty infiltration, Goutallier, paraspinal cross-sectional area, paraspinal muscles morphology
Citation: Mandelli F, Nüesch C, Zhang Y, Halbeisen F, Schären S, Mündermann A and Netzer C (2021) Assessing Fatty Infiltration of Paraspinal Muscles in Patients With Lumbar Spinal Stenosis: Goutallier Classification and Quantitative MRI Measurements. Front. Neurol. 12:656487. doi: 10.3389/fneur.2021.656487
Received: 20 January 2021; Accepted: 23 July 2021;
Published: 03 September 2021.
Edited by:
Jordi Diaz-Manera, University of Newcastle, United KingdomReviewed by:
Anna Pichiecchio, Neurological Institute Foundation Casimiro Mondino (IRCCS), ItalyBahar Shahidi, University of California, San Diego, United States
Rafael Menezes-Reis, Federal University of Amazonas, Brazil
Copyright © 2021 Mandelli, Nüesch, Zhang, Halbeisen, Schären, Mündermann and Netzer. This is an open-access article distributed under the terms of the Creative Commons Attribution License (CC BY). The use, distribution or reproduction in other forums is permitted, provided the original author(s) and the copyright owner(s) are credited and that the original publication in this journal is cited, in accordance with accepted academic practice. No use, distribution or reproduction is permitted which does not comply with these terms.
*Correspondence: Filippo Mandelli, ZmlsaXBwby5tYW5kZWxsaUB1c2IuY2g=