Abstract
Huntington's disease (HD) is an autosomal-dominant inherited neurodegenerative disorder that is caused by expansion of a CAG-repeat tract in the huntingtin gene and characterized by motor impairment, cognitive decline, and neuropsychiatric disturbances. Neuropathological studies show that disease progression follows a characteristic pattern of brain atrophy, beginning in the basal ganglia structures. The HD Regulatory Science Consortium (HD-RSC) brings together diverse stakeholders in the HD community—biopharmaceutical industry, academia, nonprofit, and patient advocacy organizations—to define and address regulatory needs to accelerate HD therapeutic development. Here, the Biomarker Working Group of the HD-RSC summarizes the cross-sectional evidence indicating that regional brain volumes, as measured by volumetric magnetic resonance imaging, are reduced in HD and are correlated with disease characteristics. We also evaluate the relationship between imaging measures and clinical change, their longitudinal change characteristics, and within-individual longitudinal associations of imaging with disease progression. This analysis will be valuable in assessing pharmacodynamics in clinical trials and supporting clinical outcome assessments to evaluate treatment effects on neurodegeneration.
Introduction
Huntington's disease (HD) is an autosomal-dominant inherited neurodegenerative disorder characterized by motor impairment, cognitive decline, and neuropsychiatric disturbances. The causative mutation is an expansion of a CAG-triplet repeat in the huntingtin (HTT) gene above a threshold that leads to cumulative toxicity driven by mutant huntingtin (mHTT) protein (1). HD is a continuous biological process and individuals experience variable rates of disease progression and constellations of symptoms.
Clinically, HD is diagnosed when a characteristic motor syndrome is recognized in the context of a known HD family history. Confirmatory genetic testing is typically obtained, particularly when the family history is equivocal. “Clinical motor diagnosis” in research usually equates to a clinician's rating of diagnostic confidence level (DCL) of “4” (on the 0–4 scale) on the Unified Huntington's Disease Rating Scale (UHDRS).
Categorical descriptors of disease stages are widely used in research, and most commonly to date the term “premanifest” has been applied to individuals with a CAG expansion who have not yet reached the criteria for HD clinical motor diagnosis and “manifest” to those with a clinical motor diagnosis. This terminology has been substituted throughout this review with more precise descriptions, but for consistency with the published literature we have kept these terms in some figures. Prior to the appearance of motor signs there are many detectable neurodegenerative, clinical, and functional changes that have been described in multiple studies (2–5). Neuropathological studies indicate that HD progression is accompanied by a characteristic pattern of brain atrophy, with the earliest and most dramatic changes evident in the basal ganglia, specifically the caudate and putamen1 (i.e., dorsal striatum) (6, 7). CAG age product (CAP) score provides an index of the length and severity of an individual's exposure to the effects of the mHTT gene and has proven to be a good predictor of pathology in the brains of HD patients at autopsy (8, 9).
The Huntington's Disease Regulatory Science Consortium (HD-RSC) is an initiative led by the Critical Path Institute and CHDI Foundation that currently has 37 member organizations from industry, academia, nonprofit organizations, and patient advocacy groups, as well as iterative participation from global regulatory agencies. The HD-RSC's overall aim is to create and advance drug development tools for regulatory endorsement that will accelerate the development of novel therapeutics for HD. Under the aegis of the HD-RSC, the imaging sub-team of the Biomarker Working Group was tasked with reviewing the available evidence linking regional brain volumetric magnetic resonance imaging (vMRI) measurements (the most relevant being those from the caudate and putamen) to the biological and clinical characteristics of HD, with a view toward assessing the utility of vMRI in HD clinical research (10). This sub-team is also preparing a manuscript discussing recommendations for the optimized use of vMRI in HD clinical research.
Here, we summarize cross-sectional associations between vMRI measures and clinical-genetic disease characteristics to underscore the face validity of these imaging measures. We also evaluate the relationship of vMRI measures with subsequent clinical change, their longitudinal change characteristics, and within-individual longitudinal associations of vMRI with disease progression. Ultimately, this longitudinal imaging data from interventional trials can help assess pharmacodynamics as well as support clinical outcomes to assess treatment effects on neurodegeneration.
Regional Brain Volumes are Reduced in Huntington's Disease
Notably, striatal volume loss in HD correlates with both neuronal cell loss and CAG-repeat length, as well as age at clinical motor diagnosis (6, 9, 11–14). This signature volume loss can be detected and tracked longitudinally in vivo using vMRI methods, as reported for several large observational studies such as PREDICT-HD (15–17), TRACK-HD (2–4, 18) and IMAGE-HD (19, 20) (Figure 1; see also Supplementary Material), as well as smaller investigations (21–23). Significantly reduced striatal volume is detectable more than 20 years prior to clinical motor diagnosis, whereas losses in other brain structures are more apparent in later disease stages (8, 24–27).
Figure 1

Overview of the disease progression heterogeneity for imaging studies with publicly available datasets (IMAGE-HD, PREDICT-HD, and TRACK-HD/Track-On HD) displaying the relative proportion of participants within each study (y-axis) by participant CAP score (x-axis). A single CAP score was computed for each participant using the age at enrollment in that study. The density plots are colored by study and separated by HD clinical diagnosis status (upper panel: individuals with expanded CAG repeats before clinical motor diagnosis; lower panel: individuals with HD clinical motor diagnosis). The TRACK-HD and Track-On HD had overlapping populations, and study sites, and were combined.
Imaging studies in the 1990s demonstrated that reduced striatal volumes were detectable in vivo in the early stages of clinically-diagnosed HD (21, 23), and such volume loss has since been identified in individuals up to 24 years before clinical motor diagnosis (4, 22). Overall, the relationship between brain volume and age at clinical diagnosis appears monotonic, with smaller striatal volumes associated with decreasing time to estimated diagnosis and with increasing CAP score (9, 28) (Figures 2A,B). At the time of clinical motor diagnosis, striatal volumes are markedly reduced compared to age-matched normal volumes [e.g., caudate: 52–70% loss; putamen: 43–67% loss; nucleus accumbens: 59–60% loss (29, 30)].
Figure 2
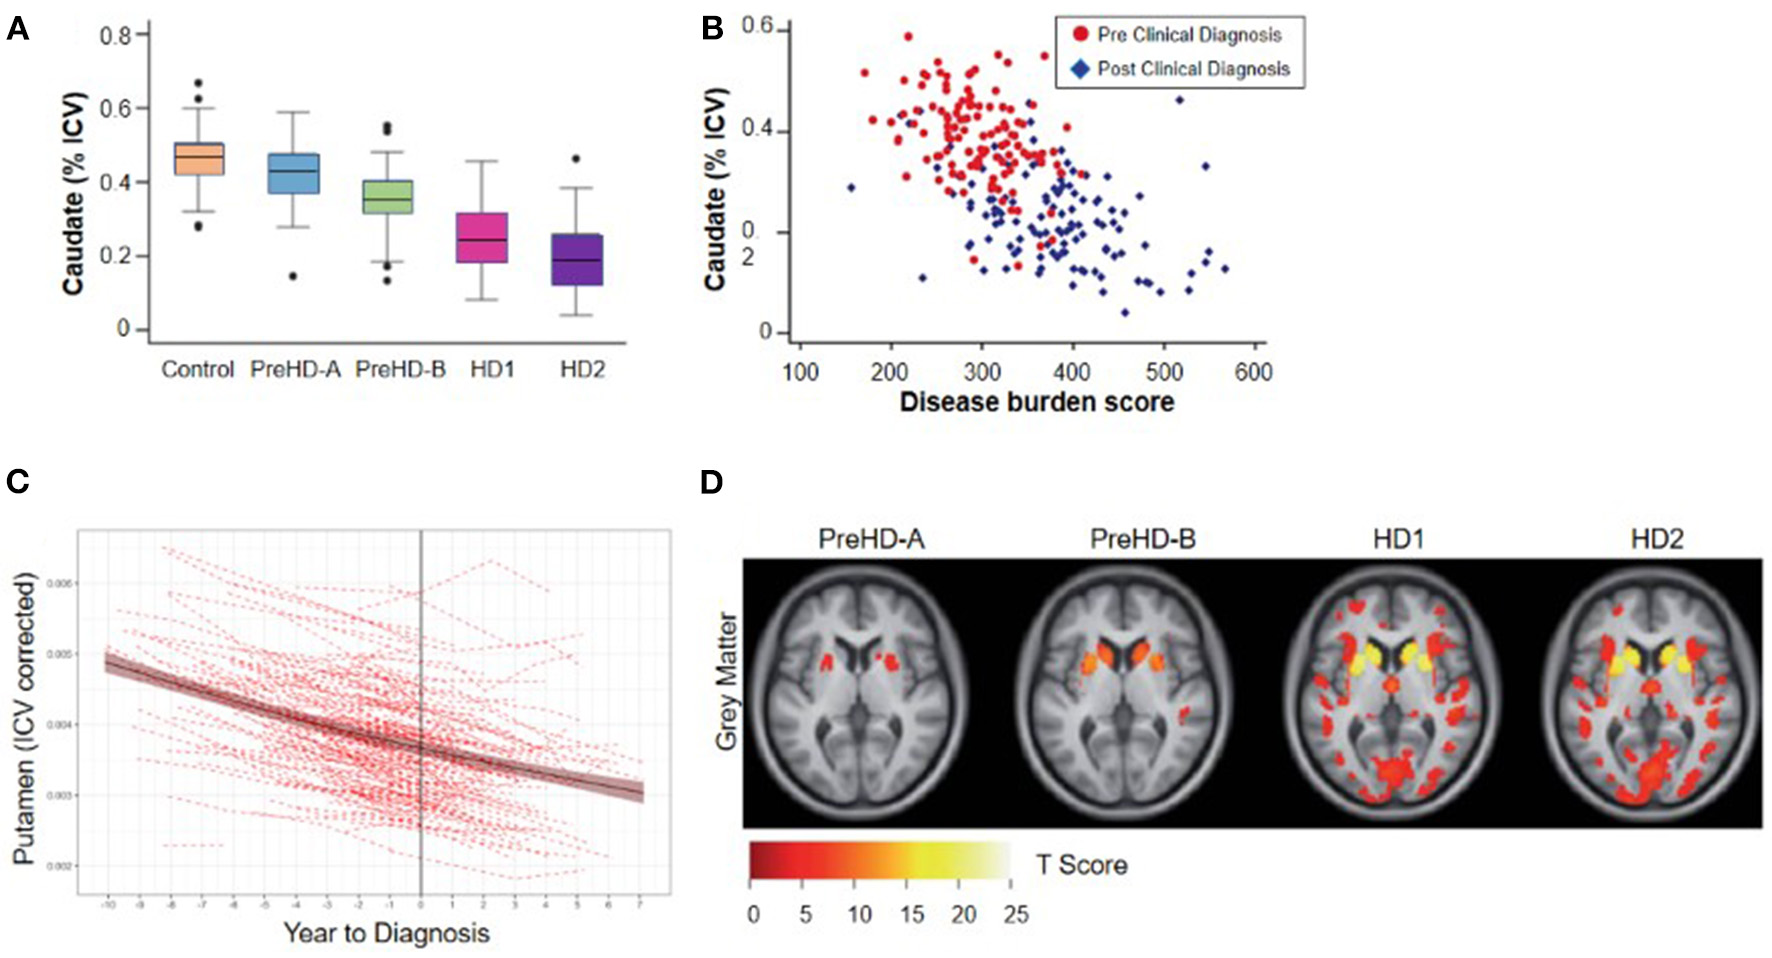
Cross-sectional relationship between regional brain volume loss from vMRI and disease progression. (A) Regional volume analysis shows a monotonic decrease in caudate volume as a function of TRACK-HD cohort. The group of individuals without clinical motor diagnosis at baseline were divided at the median into PreHD-A (further from predicted diagnosis) and PreHD-B (nearer to predicted diagnosis). HD1: participants with a clinical motor diagnosis and TFC 11-13; HD2: participants with a clinical motor diagnosis and TFC 7-10. (B) Regional volume analysis shows an inverse correlation with disease burden score [age*(CAG length-35.5)] over all groups of participants; similar results were found for putamen and whole striatum (4). (C) Trajectory of putamen volume for N = 225 participants who received a clinical motor diagnosis during PREDICT-HD. Shown are the individual dashed empirical curves and the solid fitted spline curve with the 95% confidence interval. The vertical line indicates the year of clinical motor diagnosis (set to year = 0). (D) Whole-brain VBM analysis of baseline data from the TRACK-HD shows that the strongest differences from controls are concentrated in the striatum including the caudate. The figure displays statistical parametric maps of gray matter differences in each group compared with controls with the data adjusted for age, sex, study site and intracranial volume. Results are corrected for multiple comparisons using familywise error at the p < 0.05 level (4).
While regional brain volume losses in the caudate and putamen can be detected many years prior to the onset of motor symptoms, loss in cortical regions becomes more widespread after clinical motor diagnosis (17, 22, 30–36) (Figures 2C,D). Nevertheless, thinning of the cortical gray matter can be detected prior to the onset of motor symptoms, even after correction for putamen and caudate volume loss (4, 37). This cortical gray matter loss is apparent in occipital, motor, dorsomedial prefrontal and parietal cortices, and becomes more pronounced with more advanced disease (4, 38). Moreover, cerebral white matter volume is reduced early in the disease [CAP score (9)> 250; TMS < 5] and continues to decrease with disease progression (4). Collectively, these findings have enabled a qualitative understanding of the regional patterns and trajectories of brain atrophy, and their relationship to clinical symptoms (Figure 3).
Figure 3

Hypothetical model of trajectories of (A) clinical and (B) vMRI measures of HD progression [modified from Ross et al. (8)]. This qualitative representation is based on observations across two observational study cohorts (PREDICT-HD and TRACK-HD) and provides a conceptual illustration for quantitative trajectory models but has not yet been experimentally confirmed.
Relationships Between Brain Volume Measurements and Clinical Outcome Measures
Numerous studies have demonstrated significant cross-sectional associations in HD between brain volume loss and clinical outcome measures of both motor and cognitive function. For example, in a study of individuals with expanded CAG repeats before clinical motor diagnosis, regional brain volumes correlated with both subtle motor impairments (speeded tapping and UHDRS-derived scales) and cognitive impairments (39), despite the reduced sensitivity of available clinical instruments in this population. Overall, caudate, putamen, and globus pallidus volumes had the strongest correlations with different clinical outcome measures (Table 1).
Table 1
| Motor ( N = 504) | Cognitive ( N = 486) | Functional ( N = 516) | |||||||||||
|---|---|---|---|---|---|---|---|---|---|---|---|---|---|
| Speeded tapping | UHDRS total motor | UHDRS oculomotor | UHDRS bradykinesia | UHDRS chorea | UHDRS dystonia | Symbol-digit modalities | Hopkins verbal learning | Emotion recognition | Self-paced timing | Letter-number sequencing | Total functional capacity | Functional assessment scale | |
| Putamen | −0.42 | −0.27 | −0.18 | −0.22 | −0.22 | 0.33 | 0.23 | 0.31 | 0.32 | 0.15 | |||
| Caudate | −0.42 | −0.29 | −0.2 | −0.25 | −0.21 | 0.31 | 0.33 | 0.33 | 0.32 | 0.2 | |||
| Globus pallidus | −0.36 | −0.3 | −0.2 | −0.24 | −0.27 | 0.35 | 0.29 | 0.33 | 0.34 | 0.18 | |||
| Thalamus | −0.14 | 0.12 | |||||||||||
| Nucleus accumbens | −0.2 | −0.14 | −0.13 | 0.13 | 0.15 | ||||||||
| Hippocampus | |||||||||||||
| Frontal white | −0.15 | −0.15 | −0.12 | −0.16 | |||||||||
| Parietal white | −0.21 | −0.12 | −0.17 | 0.23 | 0.16 | 0.18 | 0.13 | ||||||
| Occipital white | −0.13 | 0.19 | 0.13 | ||||||||||
| Temporal white | −0.13 | −0.17 | 0.12 | ||||||||||
| Frontal gray | |||||||||||||
| Parietal gray | |||||||||||||
| Occipital gray | |||||||||||||
| Frontal gray | |||||||||||||
Cross-sectional partial correlations between regional brain volumes and clinical outcome measures in individuals prior to clinical motor diagnosis, after removing the effect of age, sex, and years of education, obtained from an analysis of the PREDICT-HD study (39).
Only correlations that remained statistically significant following false discovery rate multiplicity correction are shown. The directionality of the associations was such that smaller tissue volumes were associated with greater impairment (higher scores on motor tasks, lower scores on cognitive tasks). Significant positive correlations are highlighted in a red color scale, significant negative correlations in a blue color scale, and darker shades are associated with stronger correlation coefficients.
In clinically-diagnosed HD participants (with Total Functional Capacity (TFC) ≥ 11), volumetric (manual segmentation-based) and whole-brain voxel-based morphometry (VBM) analyses revealed correlations (p ≤ 0.05) between performance across motor (Purdue pegboard®, UHDRS-TMS, Hand-arm test), cognitive (Symbol Digit Modalities Test), and everyday functioning (TFC) domains, and both caudate volume and VBM-measured tissue concentration (32). For the putamen and the globus pallidus, both volume and tissue concentration only correlated (p ≤ 0.05) with performance on two of the motor assessments (Purdue pegboard®, UHDRS-TMS), and thalamus tissue concentration, but not volume, showed correlations (p ≤ 0.05) with performance on the Purdue pegboard®, UHDRS-TMS, TFC, and Symbol Digit Modalities Test (32). Another VBM study (40) found inverse correlations (partial, corrected for age and CAG-repeat length) for the UHDRS-TMS with tissue concentration in regions localized in the caudate nuclei (left r = −0.68, p = 0.00001; right r = −0.65, p = 0.0001) and adjacent internal capsule (left and right r = −0.72, p = 0.00001), as well as in the occipital lobes (left r = −0.72, p = 0.00001; right r = −0.65, p = 0.0001), cerebellum (left r = −0.67, p = 0.0001; right r = −0.60, p = 0.0001) and lower brainstem (r = −0.72, p = 0.00001). Correlations of regional brain volumetric losses with more specific measures of motor function have also been reported, including finger tapping (41), oculomotor function (42), and variability in tongue force (42).
There is considerable evidence that cognitive function is also affected early in the course of HD progression, with reduced volumetric changes correlating with declines in cognitive performance (18, 43, 44). For example, although both putamen and caudate volumes in individuals before clinical motor diagnosis were found correlated with cognitive measures that have a motor output component, caudate volumes correlated more strongly than putamen volumes with measures of verbal learning and letter-number sequencing, tasks that require executive control (39) (see Table 1). The role for striatal volume loss, particularly in the caudate, in executive functional impairment is corroborated by a VBM analysis that found correlations between the caudate [showing the most significant differences between clinically-diagnosed HD (with average UHDRS-TMS = 15.7) and age-matched control participants] and executive dysfunction on three different measures (Tower of Hanoi: r = 0.647, p < 0.001; STROOP: r = 0.503, p < 0.01; modified Wisconsin Card Sorting Test: r = 0.452, p < 0.05) (45). In the involvement of the globus pallidus in HD motor, cognitive and behavioral symptoms has so far received less attention in the vMRI literature than the caudate and the putamen, but has recently been reviewed elsewhere in the context of neuropathology (46).
As mHTT aggregates predominantly accumulate in the cortex, which is highly interconnected with the striatum (47, 48), cortical degeneration is also likely to contribute to the presentation of HD signs and symptoms. Frontal lobe volume loss generally correlates with poorer performance on tests of executive function, but can also predict other types of cognitive dysfunction (44, 49). Total frontal lobe volume, including frontal lobe gray and white matter volumes, was found to be significantly reduced in moderately-affected clinically-diagnosed individuals (mean composite UHDRS score of 123.5) but not in those who were mildly affected (mean composite UHDRS score of 66.6), suggesting that frontal lobe degeneration occurs later in the disease process (50). Table 2 highlights some of the cross-sectional correlations from the literature that have been observed between distinct areas of neurodegeneration and measures of cognitive and motor function.
Table 2
| Study | Participants (Relative to clinical diagnosis) | Area of neurodegeneration | Correlated functional domain/measure |
|---|---|---|---|
| Douaud et al. (32) | Clinically diagnosed HD | Caudate (indicated by both manual segmentations and VBM) | Motor (Purdue pegboard®, UHDRS-TMS, Hand-arm test), cognitive (Symbol Digit Modalities Test), everyday functioning (TFC) |
| Douaud et al. (32) | Clinically diagnosed HD | Putamen, globus pallidus (indicated by both manual segmentations and VBM) | Motor (Purdue pegboard®, UHDRS-TMS) |
| Jech et al. (40) | Clinically diagnosed HD | Caudate, internal capsule, occipital lobes, cerebellum, brainstem (VBM) | Motor (UHDRS-TMS) |
| Bechtel et al. (41) | Before HD clinical motor diagnosis, Clinically diagnosed HD | Caudate, putamen, superior temporal, precentral, internal/external capsule, subgyral frontal white matter (VBM); Occipital, parietal, and primary motor cortical thickness | Finger tapping (variability of tap durations and inter-onset intervals) |
| Scahill et al. (42) | Before HD clinical motor diagnosis, Clinically diagnosed HD | Striatal, occipital (VBM) | Quantitative motor (tongue force), oculomotor (anti-saccade error rate) |
| Starkstein et al. (44) | Clinically diagnosed HD | Caudate, frontal, and left sylvian cistern atrophy | Memory/speed-of-processing (based on factor analysis of neuropsychological test scores) |
| Peinemann et al. (45) | Clinically diagnosed HD | Caudate (VBM) | Executive function (Tower of Hanoi, STROOP, modified Wisconsin Card Sorting Test) |
| Bäckman et al. (49) | Clinically diagnosed HD | Frontal region volume | Memory, executive function (Trail Making Test—part B, Rey-Osterrieth Complex Figure—memory, Word Recall, Perseverative Errors) |
| Aylward et al. (50) | Clinically diagnosed HD | Frontal lobe volume, frontal lobe gray and white matter volume | General cognitive functioning (Mini Mental State Examination, general verbal and spatial ability)–the correlations did not survive correction for overall brain volume loss |
Areas of neurodegeneration and their correlations with functional domains/measures.
While the data summarized in this section support a role for striatal volume loss in executive and motor dysfunction, it is unlikely that structural degradation of these regions is the sole contributor given the shared variance and distributed nature of brain function. From a functional perspective, the caudate is implicated in supporting executive function as well as goal-directed actions and reward prediction. Regarding the well-known role of the basal ganglia in sensorimotor function, the caudate and putamen both play a role in the regulation of movement (51–53). However, the caudate may also contribute to volitional movements through the excitation of schemas and goals needed to successfully execute an action, while the putamen is particularly implicated in stimulus-action responses or the habit-based preparation and execution of actions (54, 55). That the two structures primarily subserve different aspects of sensorimotor function could explain why vMRI measurements from each may most strongly correlate with different cognitive and motor outcome measures, or may correlate with some, but not other, measures within these domains. The differential correlations observed between brain structures—such as the caudate or putamen—and clinical/functional measures across different HD stages may reflect that while both change with disease progression, they do so differentially. While these cross-sectional associations build confidence that vMRI markers have a neuroanatomically-based relationship to HD progression and thereby contribute to their face validity, understanding within-individual longitudinal relationships is particularly important (see section MRI Brain Volume Measurements Have Robust Longitudinal Change Characteristics).
Brain Volume Measurements Predict Subsequent Clinical Progression
The value of HD prognostic biomarkers is in their ability to accurately predict, at the individual level, either the occurrence of clinical motor diagnosis, the rate of disease progression, or other relevant milestones in the disease course. There is evidence that striatal volumes correlate with CAG-repeat length and that vMRI metrics can provide additional prognostic power (56). For example, TRACK-HD illustrated that baseline caudate, putamen, and gray matter volume provided additional predictive value (beyond age and CAG-repeat length) for clinical progression (3), defined in this study as an increased TMS score of five points or more, any TFC decline, or a new DCL score of 4; baseline measures also predicted subsequent decline in TFC score in individuals with clinical diagnosis. TRACK-HD also investigated baseline voxel-wise gray matter to identify individuals (before or after clinical diagnosis) at higher risk of 4-year motor deterioration and revealed a pattern, primarily localized in the inferior caudate, that increased the cross-validated prognostic accuracy by 13% (75% to 88%) compared to using baseline clinical and genetic metrics alone (57). Furthermore, an early analysis of PREDICT-HD showed that baseline caudate volume predicted clinical motor diagnosis within 2 years with 100% accuracy (58). Subsequently, a 12-year analysis assessed the ability of 40 mixed predictors, including imaging, motor, and cognitive measures, to predict time to CAG-adjusted age of clinical motor diagnosis. In this joint model of longitudinal and survival data, the strongest predictors of clinical motor diagnosis (16) (beyond CAG-repeat length and age) in each domain were TMS (motor), putamen volume (imaging), and Stroop word test (cognitive).
Further evidence to support caudate volume as a robust predictor of HD clinical motor diagnosis comes from a recent study (59) that used a multivariate machine learning approach in combination with permutation modeling to determine the potential of three types of MRI biomarkers (subcortical region volumes, cortical thickness, and resting-state functional connectivity) to identify individuals who were within 5 years of clinical motor diagnosis. An approach combining brain function and structure into a “polymarker” was reported to best distinguish between individuals who reached clinical motor diagnosis and those who did not. However, subcortical volumes alone had high accuracy for this classification (88%). The caudate, in particular, was highlighted by the authors as a strong predictor of motor diagnosis in clinical practice. In conclusion, there is considerable evidence indicating that vMRI can enhance predictive accuracy.
MRI Brain Volume Measurements Have Robust Longitudinal Change Characteristics
Desirable characteristics for a biomarker of treatment response include an effect size for rate of change sufficient to detect a treatment-induced modification with a sample size smaller than that needed for standard clinical outcome measures. Observational studies have shown that vMRI measures have very good longitudinal performance characteristics in populations both before and after HD clinical motor diagnosis on a timescale typical for Phase 2 or 3 trials (1–2 years). The rate of longitudinal volume loss in the caudate and putamen has consistently been found to be higher in individuals with expanded CAG repeats than in matched controls, and to be more pronounced when both CAP score increases and functional capacity decreases (3, 18–20). Consistent with this, IMAGE-HD showed that longitudinal volume change in the caudate was the only measure among a range of multi-modal imaging features (including diffusion MRI) that discriminated between groups across different disease stages (i.e., far from clinical motor diagnosis [>15 years], close to diagnosis [ <15 years], and after diagnosis) (19). Estimates of annualized rates of volume loss in clinically-diagnosed participants (TFC ≥ 7) vary between 2 and 4% for the caudate and between 1 and 3% for the putamen (25, 60). Moreover, longitudinal data from PREDICT-HD showed that rates of volume loss in participants' putamen prior to clinical motor diagnosis were slightly higher than the rates of volume loss in the caudate, although both structures showed significantly elevated rates of change compared with controls, even in those furthest from expected clinical motor diagnosis (61). TRACK-HD (2) showed that at the most advanced disease stage studied (7 ≤ TFC ≤ 10) the caudate was approaching a constant rate of decline, and that annualized rates of change were consistent and stable over the 12-, 24-, and 36-month follow-up periods at both the group and individual levels (Figure 4).
Figure 4
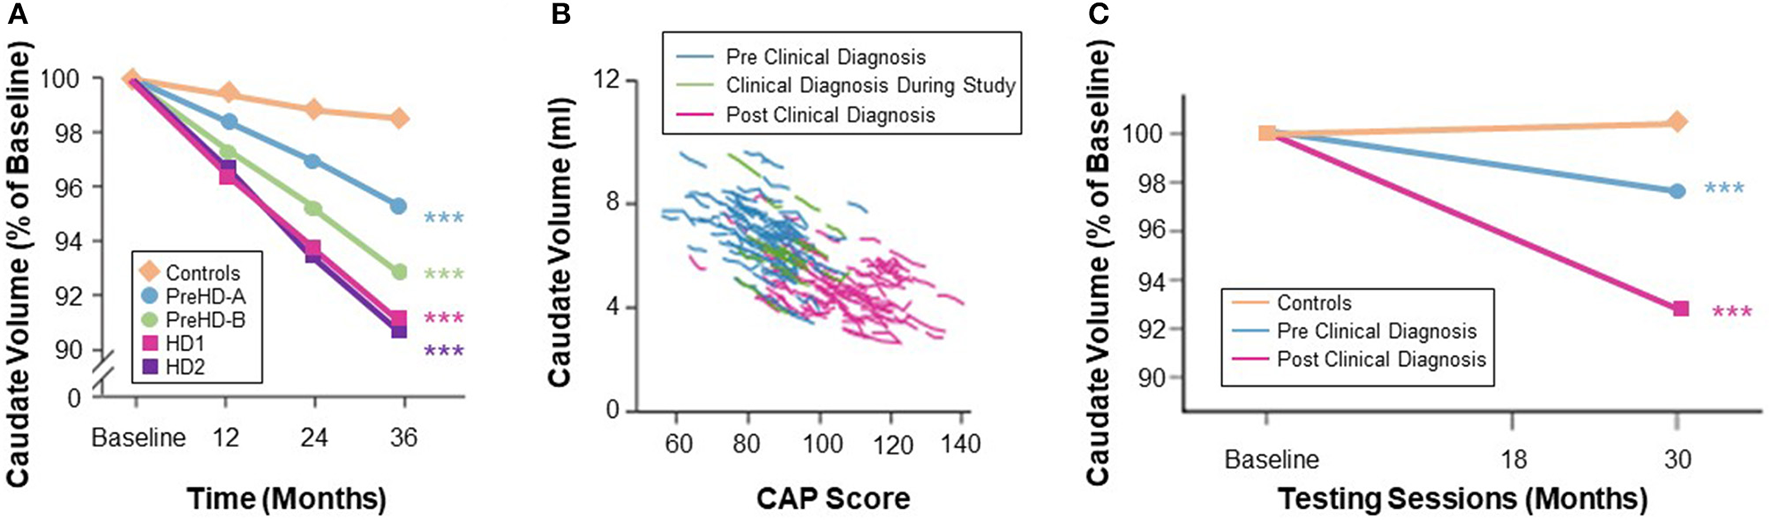
(A) Quantification of caudate volume loss in the TRACK-HD study showed near monotonic change from baseline to 12- and 24-month follow-up across the disease spectrum, with the rate of change increasing after clinical motor diagnosis (3). (B) Change in caudate volume with CAP score from TRACK-HD data (8). (C) Longer follow-up in the IMAGE-HD study also showed a greater degree of longitudinal change in the caudate volume in individuals with a clinical motor diagnosis (20).
Effect sizes for longitudinal change in caudate and putamen volumes have been consistently reported as larger than those for clinical outcome measures (15). Although many factors may influence these results—such as genetic and environmental modulators, image segmentation algorithm, statistical model, follow-up duration, sample size, and inclusion criteria—the effect size of caudate volume loss has been consistently reported as larger than that of putamen volume loss (3). IMAGE-HD similarly shows statistically greater longitudinal change, relative to controls, over 30 months for the caudate than the putamen both in participants before clinical motor diagnosis (UHDRS-TMS ≤ 5) and after clinical motor diagnosis (UHDRS-TMS > 5) (20). The PADDINGTON study examined longitudinal changes relative to healthy controls in clinically-diagnosed individuals (TFC ≥ 11) over shorter time intervals (i.e., 6, 9, and 15 months) and also found vMRI effect sizes to be larger than for clinical instruments and larger for the caudate than the putamen at each time interval (5) (Figure 5). Despite the differential changes between caudate and putamen, within-individual rates of striatal volume loss (both caudate and putamen) appear to decline linearly across participants regardless of clinical motor diagnosis status, but are more pronounced in individuals with a higher CAG-repeat length (8).
Figure 5

Representative longitudinal effect sizes (average change relative to standard deviation of the change) and their 95% confidence intervals for different time intervals in two observational studies [PADDINGTON (5) and TRACK-HD (3)]. Note that in the PADDINGTON study, the 9-month interval was the change between imaging at 6 and 15 months. The clinical status of the PADDINGTON population depicted here was primarily HD1 [N = 61 in total at baseline, of which N = 56 HD1 (TFC 11-13), N = 4 HD2 (TFC 7-10), and N = 1 HD3 (TFC 3-6); overall mean (SD) TFC was 11.7 (1.5)], and the TRACK-HD population was HD1 (N = 45 with TFC 11-13, 24-month follow-up).
TRACK-HD, PREDICT-HD, and IMAGE-HD also provide a wealth of evidence for change over time in regions outside the striatum in individuals both before (2, 3, 62) and after (2, 3, 20) clinical motor diagnosis, with effect sizes equal to or greater than those for clinical instruments. Whole-brain volume loss, total white- and gray-matter volume losses, and increased ventricular volume reflect generalized cortical atrophy and degradation of white matter that structurally connects distinct brain regions. Voxel-wise analyses have also identified increasing losses of gray matter volume in the occipital, parietal, frontal and insular cortices as the disease advances (2, 63). A recent dynamic modeling approach that used 6 years of TRACK-HD and Track-On HD data revealed a temporal sequence of regional changes around the time of clinical motor diagnosis that involves not only the caudate and putamen but also cortical regions, including sensorimotor areas (64).
These robust longitudinal-change characteristics translate into attractive sample size estimates to detect putative treatment effects when using vMRI metrics as response biomarkers (3, 5, 65). Table 3 shows the estimated sample sizes per arm required to detect the specified change in a vMRI metric derived from power calculations from TRACK-HD and PADDINGTON data. Although in some cases the confidence intervals overlap, the sample sizes are all smaller than those required for clinical outcome measures obtained in the same studies. A systematic analysis of statistical powering considerations using TRACK-HD data concluded that whole-brain and caudate vMRI measures were substantially better powered than standard clinical outcome measures used in clinical trials (TMS and TFC), needing approximately one sixth of the sample size to detect the same degree of slowing (65). Stratification and adjustment for different covariates—such as age and CAG-repeat length (and their interaction), expected time to clinical motor diagnosis and baseline value, inclusion of scans at intermediate timepoints, and trial length—were all considered.
Table 3
| Length | Study | Reference | Detection | Shoulson-Fahn disease stage | Sample size [95% CI] |
|---|---|---|---|---|---|
| 1 year | TRACK-HD | Frost et al. (65) | 20% slowing of rate of whole-brain atrophy | TFC 11-13 & TFC 7-10 | 636 [454, 1,001] |
| 1 year | TRACK-HD | Frost et al. (65) | 40% slowing of rate of whole-brain atrophy | TFC 11-13 & TFC 7-10 | 159 [114, 251] |
| 2 years | TRACK-HD | Frost et al. (65) | 20% slowing of rate of whole-brain atrophy | TFC 11-13 & TFC 7-10 | 289 [211, 435] |
| 2 years | TRACK-HD | Frost et al. (65) | 40% slowing of rate of whole-brain atrophy | TFC 11-13 & TFC 7-10 | 73 [53, 109] |
| 3 years | TRACK-HD | Frost et al. (65) | 20% slowing of rate of whole-brain atrophy | TFC 11-13 & TFC 7-10 | 225 [158, 355] |
| 3 years | TRACK-HD | Frost et al. (65) | 40% slowing of rate of whole-brain atrophy | TFC 11-13 & TFC 7-10 | 57 [40, 89] |
| 1 year | TRACK-HD | Frost et al. (65) | 20% slowing of rate of caudate atrophy | TFC 11-13 & TFC 7-10 | 484 [363, 777] |
| 1 year | TRACK-HD | Frost et al. (65) | 40% slowing of rate of caudate atrophy | TFC 11-13 & TFC 7-10 | 121 [91–195] |
| 2 years | TRACK-HD | Frost et al. (65) | 20% slowing of rate of caudate atrophy | TFC 11-13 & TFC 7-10 | 197 [145, 350] |
| 2 years | TRACK-HD | Frost et al. (65) | 40% slowing of rate of caudate atrophy | TFC 11-13 & TFC 7-10 | 50 [37, 90] |
| 3 years | TRACK-HD | Frost et al. (65) | 20% slowing of rate of caudate atrophy | TFC 11-13 & TFC 7-10 | 144 [98, 284] |
| 3 years | TRACK-HD | Frost et al. (65) | 40% slowing of rate of caudate atrophy | TFC 11-13 & TFC 7-10 | 36 [25, 71] |
| 6-month | PADDINGTON | Hobbs et al. (5) | 50% slowing of rate of ventricular expansion | TFC ≥ 11 | 134 [64, 495] |
| 9-month | PADDINGTON | Hobbs et al. (5) | 50% slowing of rate of ventricular expansion | TFC ≥ 11 | 98 [51, 275] |
| 15-month | PADDINGTON | Hobbs et al. (5) | 50% slowing of rate of ventricular expansion | TFC ≥ 11 | 80 [48, 186] |
| 6-month | PADDINGTON | Hobbs et al. (5) | 50% slowing of rate of caudate atrophy | TFC ≥ 11 | 173 [81, 652] |
| 9-month | PADDINGTON | Hobbs et al. (5) | 50% slowing of rate of caudate atrophy | TFC ≥ 11 | 207 [87, 801] |
| 15-month | PADDINGTON | Hobbs et al. (5) | 50% slowing of rate of caudate atrophy | TFC ≥ 11 | 59 [30, 153] |
Relationships Between Longitudinal Change in Both Regional Brain Volumes and Clinical Outcome Measures
A biomarker closely associated with HD progression would be expected to exhibit measurable longitudinal change that correlates with changes in clinical instruments reflecting key aspects of the disease. Given that many clinical and imaging measures are associated with HD progression, these analyses should statistically control for CAP score and potentially other confounds such as study site, sex, and education. Such associations should be demonstrable in observational studies and, in interventional trials, a treatment-induced change in the biomarker would ideally be statistically associated with a concomitant change in the clinical marker(s). Moreover, it is important to understand which regional vMRI markers are associated with which clinical instruments in order to interpret treatment-induced effects (or lack thereof) appropriately. In principle, the robust longitudinal measurement characteristics of vMRI are well-suited to demonstrating such associations; however, the relatively greater variability in clinical instruments is likely to be the limiting factor, especially early in the disease course when the overall rate of change is slow.
Overall, the evidence from observational studies relating change in clinical outcomes to change in vMRI metrics appears sparser than the cross-sectional relationships described earlier, with the strongest longitudinal relationships relating rates of brain volume loss to changes in cognitive and composite measures rather than purely motor measures (2, 19, 20, 64, 66) (Figure 6). For example, these studies have revealed relatively weak longitudinal associations between change in vMRI and change in UHDRS-TMS over a typical clinical trial time frame (1–2 years), despite the presence of a significant cross-sectional relationship between them. This finding may reflect that: longer follow-up time is needed for such a relationship to become apparent; the cross-sectional analyses capture larger temporal gaps between groups at different disease stages than the shorter time frames analyzed; group differences are easier to capture than individual progression curves; there is limited statistical power due to measurement variability and small sample sizes; and/or there are complex biological links between regional volume loss and outward presentation of HD clinical signs.
Figure 6

The TRACK-HD study showed (A) relatively weak and selective correlations between changes in vMRI metrics and changes in clinical outcomes over a 12-month interval (2). Partial correlations across participants with and without a clinical motor diagnosis, controlled for age, sex, education, and study site, nominally significant at p < 0.05 are shown. The IMAGE-HD study showed (B) that 30-month change in caudate volume is significantly correlated with 30-month change in reaction time (RT) during performance of a cognitive task that required shifting response set (SRS) (20) (i.e., greater volume loss was associated with longer reaction times [RTs]).
Conclusions
Published reports and observational study datasets provide a promising evidentiary base for the utility of vMRI-based biomarkers in future HD interventional trials. However, the interpretability of vMRI-based biomarkers would be improved with a more complete understanding of how longitudinal change in vMRI metrics relates to change in clinical instruments on the timescale of typical clinical trials. An important next step will be to prospectively test the generalizability and robustness of the described longitudinal findings—particularly using more precise quantitative estimates of these relationships—across different datasets and image acquisition/analysis protocols. To be feasible, consensus for standardized practices for the use of vMRI in HD clinical research is necessary and will ultimately strengthen the interpretability of vMRI results. Recommendations to optimize the use of vMRI in HD clinical trials are discussed in another manuscript being prepared by this HD-RSC Biomarker Working Group, with a view to reaching consensus for best practice. Together, these actions will provide the HD research community with clear expectations for the use of vMRI in interventional trials.
Huntington's Disease Regulatory Science Consortium Coordinating Committee
Varun Aggarwal, Shazia Ali, Irina Antonijevic, Astri Arnesen, Nazem Atassi, Brian Beers, Beth Belluscio, Limor Ben Har, Angele Benard, Caroline Benn, Brian Bettencourt, Anu Bhattacharyya, Robi Blumenstein, Beth Borowsky, Bret Bostwick, Jackson Burton, Angelika Caputo, David Cooper, Brad Elmer, Rebecca Evans, Andrew Feigen, Terrence Fisher, Rebecca Fuller, Emily Gantman, Danielle Gartner, Michal Geva, Nellie Georgiou-Karistianis, Sandra Gonzalez, Adam Good, Mark Gordon, Jaya Goyal, Michael Hayden, Priyantha Herath, Steve Hersch, Jianying Hu, Elise Kayson, Eileen Koski, Bernhard Landwehrmeyer, Michelle Lax, Blair Leavitt, Dorothy Leong, Oren Levy, Enchi Liu, Jeff Long, Doug Macdonald, Jacqueline Major, Lahar Mehta, Tiago Mestre, Eric Miller, Christian Mueller, Catherine O'Riordan, Jennifer Panagoulias, Mike Panzara, Anne Pedata, Jennifer Petrillo-Billet, Dave Podskalny, Alisha Reader, Shelly Redman, Ralf Reilmann, Klaus Romero, Christopher Ross, Anne Rosser, Cristina Sampaio, Jan Samzelius, Scott Schobel, Adam Schwarz, Sudhir Sivakumaran, Jennie Socha, Glenn Stebbins, Julie Stout, Sarah Tabrizi, Emily Turner, Charles Venuto, Louise Vetter, Vissia Viglietta, Sarah Wahlstrom Helgren, Beth White, Ed Wild, George Yohrling, Maurice Zauderer.
Publisher's Note
All claims expressed in this article are solely those of the authors and do not necessarily represent those of their affiliated organizations, or those of the publisher, the editors and the reviewers. Any product that may be evaluated in this article, or claim that may be made by its manufacturer, is not guaranteed or endorsed by the publisher.
Statements
Author contributions
KMK, AJS, APM and NG-K conceptualized the manuscript. KMK, AJS, ECT, DP, MFG, APM, RIS, and NG-K performed the literature search. KMK, AJS, ECT, DP, ECG, APM, RIS, and NG-K drafted the manuscript. All authors contributed to the article and approved the submitted version.
Acknowledgments
The authors acknowledge critical reviewers of this manuscript prior to submission, in particular Tiago Mestre, Simon Noble, Michael Panzara, Cristina Sampaio, Sudhir Sivakumaran, and Sarah Tabrizi, along with other members of the full HD-RSC Coordinating Committee. The HD-RSC is funded by CHDI Foundation, a nonprofit biomedical research organization exclusively dedicated to collaboratively developing therapeutics for Huntington's disease. The studies cited in this manuscript would not be possible without the vital contribution of the research participants and their families.
Conflict of interest
KMK and RJ are full-time employees of IXICO. AJS is a full-time employee and shareholder of Takeda Pharmaceuticals, Ltd. DP and ECG are employed by CHDI Management to provide advisory services to CHDI Foundation. MFG is a full-time employee of Teva Pharmaceuticals. APM is a full-time employee of Wave Life Sciences, Ltd. RIS provides consultancy for IXICO. The remaining authors declare that the research was conducted in the absence of any other commercial or financial relationships that could be construed as a potential conflict of interest.
Supplementary material
The Supplementary Material for this article can be found online at: https://www.frontiersin.org/articles/10.3389/fneur.2021.712555/full#supplementary-material
Footnotes
1.^ Consistent with the convention in the HD literature, in this article we will use the terms “striatum” or “striatal” as umbrella terms to refer to the dorsal striatal regions caudate and putamen.
References
1.
MacDonald ME Ambrose CM Duyao MP Myers RH Lin C Srinidhi L et al . A novel gene containing a trinucleotide repeat that is expanded and unstable on Huntington's disease chromosomes. Cell. (1993) 72:971–83. 10.1016/0092-8674(93)90585-E
2.
Tabrizi SJ Scahill RI Durr A Roos RA Leavitt BR Jones R et al . Biological and clinical changes in premanifest and early stage Huntington's disease in the TRACK-HD study: the 12-month longitudinal analysis. Lancet Neurol. (2011) 10:31–42. 10.1016/S1474-4422(10)70276-3
3.
Tabrizi SJ Reilmann R Roos RAC Durr A Leavitt B Owen G et al . Potential endpoints for clinical trials in premanifest and early Huntington's disease in the TRACK-HD study: analysis of 24 month observational data. Lancet Neurol. (2012) 11:42–53. 10.1016/S1474-4422(11)70263-0
4.
Tabrizi SJ Langbehn DR Leavitt BR Roos RA Durr A Craufurd D et al . Biological and clinical manifestations of Huntington's disease in the longitudinal TRACK-HD study: cross-sectional analysis of baseline data. Lancet Neurol. (2009) 8:791–801. 10.1016/S1474-4422(09)70170-X
5.
Hobbs NZ Farmer RE Rees EM Cole JH Haider S Malone IB et al . Short-interval observational data to inform clinical trial design in Huntington's disease. J Neurol Neurosurg Psychiatry. (2015) 86:1291–8. 10.1136/jnnp-2014-309768
6.
Vonsattel J-P Myers RH Stevens TJ Ferrante RJ Bird ED Richardson EP . Neuropathological Classification of Huntington's Disease. J Neuropathol Exp Neurol. (1985) 44:559–77. 10.1097/00005072-198511000-00003
7.
Reiner A Dragatsis I Dietrich P . Genetics and neuropathology of Huntington's disease. Int Rev Neurobiol. (2011) 98:325–72. 10.1016/B978-0-12-381328-2.00014-6
8.
Ross CA Aylward EH Wild EJ Langbehn DR Long JD Warner JH et al . Huntington disease: natural history, biomarkers and prospects for therapeutics. Nat Rev Neurol. (2014) 10:204–16. 10.1038/nrneurol.2014.24
9.
Penney JB Vonsattel J-PP Macdonald ME Gusella JF Myers RH . CAG repeat number governs the development rate of pathology in Huntington's disease. Ann Neurol. (1997) 41:689–92. 10.1002/ana.410410521
10.
Klöppel S Henley SM Hobbs NZ Wolf RC Kassubek J Tabrizi SJ et al . Magnetic resonance imaging of Huntington's disease: preparing for clinical trials. Neuroscience. (2009) 164:205–19. 10.1016/j.neuroscience.2009.01.045
11.
Furtado S Suchowersky O . Huntington's disease: recent advances in diagnosis and management. Can J Neurol Sci. (1995) 22:5–12. 10.1017/S0317167100040427
12.
Thu DCV Oorschot DE Tippett LJ Nana AL Hogg VM Synek BJ et al . Cell loss in the motor and cingulate cortex correlates with symptomatology in Huntington's disease. Brain. (2010) 133:1094–110. 10.1093/brain/awq047
13.
de la Monte SM Vonsattel J-P Richardson EP . Morphometric demonstration of atrophic changes in the cerebral cortex, white matter, and neostriatum in Huntington's disease. J Neuropathol Exp Neurol. (1988) 47:516–25. 10.1097/00005072-198809000-00003
14.
Halliday GMM McRitchie DAA Macdonald V Double KLL Trent RJJ McCusker E . Regional specificity of brain atrophy in Huntington's disease. Exp Neurol. (1998) 154:663–72. 10.1006/exnr.1998.6919
15.
Paulsen JS Nopoulos PC Aylward E Ross CA Johnson H Magnotta VA et al . Striatal and white matter predictors of estimated diagnosis for Huntington disease. Brain Res Bull. (2010) 82:201–7. 10.1016/j.brainresbull.2010.04.003
16.
Paulsen JS Long JD Ross CA Harrington DL Erwin CJ Williams JK et al . Prediction of manifest Huntington's disease with clinical and imaging measures: a prospective observational study. Lancet Neurol. (2014) 13:1193–201. 10.1016/S1474-4422(14)70238-8
17.
Paulsen JS Hayden M Stout JC Langbehn DR Aylward E Ross CA et al . Preparing for Preventive Clinical Trials. Arch Neurol. (2006) 63:883. 10.1001/archneur.63.6.883
18.
Tabrizi SJ Scahill RI Owen G Durr A Leavitt BR Roos RA et al . Predictors of phenotypic progression and disease onset in premanifest and early-stage Huntington's disease in the TRACK-HD study: analysis of 36-month observational data. Lancet Neurol. (2013) 12(7). 10.1016/S1474-4422(13)70088-7
19.
Domínguez JF Egan GF Gray MA Poudel GR Churchyard A Chua P et al . Multi-Modal neuroimaging in premanifest and early Huntington's disease: 18 month longitudinal data from the IMAGE-HD study. PLoS ONE. (2013) 8:e74131. 10.1371/journal.pone.0074131
20.
Domínguez JF Stout JC Poudel G Churchyard A Chua P Egan GF et al . Multimodal imaging biomarkers in premanifest and early Huntington's disease: 30-month IMAGE-HD data. Br J Psychiatry. (2016) 208:571–8. 10.1192/bjp.bp.114.156588
21.
Harris GJ Pearlson GD Peyser CE Aylward EH Roberts J Barta PE et al . Putamen volume reduction on magnetic resonance imaging exceeds caudate changes in mild Huntington's disease. Ann Neurol. (1992) 31:69–75. 10.1002/ana.410310113
22.
Paulsen JS Magnotta VA Mikos AE Paulson HL Penziner E Andreasen NC et al . Brain structure in preclinical Huntington's disease. Biol Psychiatry. (2006) 59:57–63. 10.1016/j.biopsych.2005.06.003
23.
Harris GJ Aylward EH Peyser CE Pearlson GD Brandt J Roberts-Twillie JV et al . Single photon emission computed tomographic blood flow and magnetic resonance volume imaging of basal ganglia in Huntington's disease. Arch Neurol. (1996) 53:316–24. 10.1001/archneur.1996.00550040044013
24.
Bates GP Dorsey R Gusella JF Hayden MR Kay C Leavitt BR et al . Huntington disease. Nat Rev Dis Prim. (2015) 1:15005. 10.1038/nrdp.2015.5
25.
Georgiou-Karistianis N Scahill R Tabrizi SJ Squitieri F Aylward E . Structural MRI in Huntington's disease and recommendations for its potential use in clinical trials. Neurosci Biobehav Rev. (2013) 37:480–90. 10.1016/j.neubiorev.2013.01.022
26.
McColgan P Tabrizi SJ . Huntington's disease: a clinical review. Eur J Neurol. (2018) 25:24–34. 10.1111/ene.13413
27.
Scahill RI Andre R Tabrizi SJ Aylward EH . Structural imaging in premanifest and manifest Huntington disease. In: Handbook of Clinical Neurology. Elsevier (2017). p. 247–61.
28.
Langbehn DR Stout JC Gregory S Mills JA Durr A Leavitt BR et al . Association of CAG repeats with long-term progression in Huntington disease. JAMA Neurol. (2019) 76:1375. 10.1001/jamaneurol.2019.2368
29.
van den Bogaard SJA Dumas EM Acharya TP Johnson H Langbehn DR Scahill RI et al . Early atrophy of pallidum and accumbens nucleus in Huntington's disease. J Neurol. (2011) 258:412–20. 10.1007/s00415-010-5768-0
30.
Aylward EH Sparks BF Field KM Yallapragada V Shpritz BD Rosenblatt A et al . Onset and rate of striatal atrophy in preclinical Huntington disease. Neurology. (2004) 63:66–72. 10.1212/01.WNL.0000132965.14653.D1
31.
Aylward EH Brandt J Codori AM Mangus RS Barta PE Harris GJ . Reduced basal ganglia volume associated with the gene for Huntington's disease in asymptomatic at-risk persons. Neurology. (1994) 44:823–8. 10.1212/WNL.44.5.823
32.
Douaud G Gaura V Ribeiro M-J Lethimonnier F Maroy R Verny C et al . Distribution of grey matter atrophy in Huntington's disease patients: a combined ROI-based and voxel-based morphometric study. Neuroimage. (2006) 32:1562–75. 10.1016/j.neuroimage.2006.05.057
33.
Mühlau M Weindl A Wohlschläger AM Gaser C Städtler M Valet M et al . Voxel-based morphometry indicates relative preservation of the limbic prefrontal cortex in early Huntington disease. J Neural Transm. (2007) 114:367–72. 10.1007/s00702-006-0571-x
34.
Rosas HD Liu AK Hersch S Glessner M Ferrante RJ Salat DH et al . Regional and progressive thinning of the cortical ribbon in Huntington's disease. Neurology. (2002) 58:695–701. 10.1212/WNL.58.5.695
35.
Lambrecq V Langbour N Guehl D Bioulac B Burbaud P Rotge J-Y . Evolution of brain gray matter loss in Huntington's disease: a meta-analysis. Eur J Neurol. (2013) 20:315–21. 10.1111/j.1468-1331.2012.03854.x
36.
Wijeratne PA Young AL Oxtoby NP Marinescu RV Firth NC Johnson EB et al . An image-based model of brain volume biomarker changes in Huntington's disease. Ann Clin Transl Neurol. (2018) 5:570–82. 10.1002/acn3.558
37.
Rosas HD Hevelone ND Zaleta AK Greve DN Salat DH Fischl B . Regional cortical thinning in preclinical Huntington disease and its relationship to cognition. Neurology. (2005) 65:745–7. 10.1212/01.wnl.0000174432.87383.87
38.
Rosas HD Salat DH Lee SY Zaleta AK Pappu V Fischl B et al . Cerebral cortex and the clinical expression of Huntington's disease: complexity and heterogeneity. Brain. (2008) 131(Pt 4):1057–68. 10.1093/brain/awn025
39.
Aylward EH Harrington DL Mills JA Nopoulos PC Ross CA Long JD et al . Regional atrophy associated with cognitive and motor function in prodromal Huntington disease. J Huntingtons Dis. (2013) 2:477–89. 10.3233/JHD-130076
40.
Jech R Klempír J Vymazal J Židovská J Klempírová O RuŽička E et al . Variation of selective gray and white matter atrophy in Huntington's disease. Mov Disord. (2007) 22:1783–9. 10.1002/mds.21620
41.
Bechtel N Scahill RI Rosas HD Acharya T van den Bogaard SJA Jauffret C et al . Tapping linked to function and structure in premanifest and symptomatic Huntington disease. Neurology. (2010) 75:2150–60. 10.1212/WNL.0b013e3182020123
42.
Scahill RI Hobbs NZ Say MJ Bechtel N Henley SMD Hyare H et al . Clinical impairment in premanifest and early Huntington's disease is associated with regionally specific atrophy. Hum Brain Mapp. (2013) 34:519–29.
43.
Campodonico JR Aylward E Codori AM Young C Krafft L Magdalinski M et al . When does Huntington's disease begin?J Int Neuropsychol Soc. (1998) 4:467–73. 10.1017/S1355617798455061
44.
Starkstein SE Brandt J Bylsma F Peyser C Folstein M Folstein SE . Neuropsychological correlates of brain atrophy in Huntington's disease: a magnetic resonance imaging study. Neuroradiology. (1992) 34:487–9. 10.1007/BF00598956
45.
Peinemann A Schuller S Pohl C Jahn T Weindl A Kassubek J . Executive dysfunction in early stages of Huntington's disease is associated with striatal and insular atrophy: a neuropsychological and voxel-based morphometric study. J Neurol Sci. (2005) 239:11–9. 10.1016/j.jns.2005.07.007
46.
Singh-Bains MK Waldvogel HJ Faull RL . The role of the human globus pallidus in Huntington's disease. Brain Pathol. (2016) 26:741–51. 10.1111/bpa.12429
47.
Leh SE Ptito A Chakravarty MM Strafella AP . Fronto-striatal connections in the human brain: a probabilistic diffusion tractography study. Neurosci Lett. (2007) 419:113–8. 10.1016/j.neulet.2007.04.049
48.
Cummings JL . Frontal-subcortical circuits and human behavior. Arch Neurol. (1993) 50:873–80. 10.1001/archneur.1993.00540080076020
49.
Bäckman L Robins-Wahlin TB Lundin A Ginovart N Farde L . Cognitive deficits in Huntington's disease are predicted by dopaminergic PET markers and brain volumes. Brain. (1997) 120:2207–17. 10.1093/brain/120.12.2207
50.
Aylward EH Anderson NB Bylsma FW Wagster MV Barta PE Sherr M et al . Frontal lobe volume in patients with Huntington's disease. Neurology. (1998) 50:252–8. 10.1212/WNL.50.1.252
51.
Bonelli RM Cummings JL . Frontal-subcortical circuitry and behavior. Dialogues Clin Neurosci. (2007) 9:141–51. 10.31887/DCNS.2007.9.2/rbonelli
52.
Fettes P Schulze L Downar J . Cortico-striatal-thalamic loop circuits of the orbitofrontal cortex: promising therapeutic targets in psychiatric illness. Front Syst Neurosci. (2017) 11:25. 10.3389/fnsys.2017.00025
53.
Alexander GE DeLong MR Strick PL . Parallel organization of functionally segregated circuits linking basal ganglia and cortex. Annu Rev Neurosci. (1986) 9:357–81. 10.1146/annurev.ne.09.030186.002041
54.
Haruno M Kawato M . Different neural correlates of reward expectation and reward expectation error in the putamen and caudate nucleus during stimulus-action-reward association learning. J Neurophysiol. (2006) 95:948–59. 10.1152/jn.00382.2005
55.
Grahn JA Parkinson JA Owen AM . The cognitive functions of the caudate nucleus. Prog Neurobiol. (2008) 86:141–55. 10.1016/j.pneurobio.2008.09.004
56.
Rosas HD Goodman J Chen YI Jenkins BG Kennedy DN Makris N et al . Striatal volume loss in HD as measured by MRI and the influence of CAG repeat. Neurology. (2001) 57:1025–8. 10.1212/WNL.57.6.1025
57.
Castro E Polosecki P Rish I Pustina D Warner JH Wood A et al . Baseline multimodal information predicts future motor impairment in premanifest Huntington's disease. NeuroImage Clin. (2018) 19:443–53. 10.1016/j.nicl.2018.05.008
58.
Aylward EH Liu D Nopoulos PC Ross CA Pierson RK Mills JA et al . Striatal volume contributes to the prediction of onset of Huntington disease in incident cases. Biol Psychiatry. (2012) 71:822–8. 10.1016/j.biopsych.2011.07.030
59.
Mason SL Daws RE Soreq E Johnson EB Scahill RI Tabrizi SJ et al . Predicting clinical diagnosis in Huntington's disease: an imaging polymarker. Ann Neurol. (2018) 83:532–43. 10.1002/ana.25171
60.
Coppen EM van der Grond J Hafkemeijer A Rombouts SARB Roos RAC . Early grey matter changes in structural covariance networks in Huntington's disease. NeuroImage Clin. (2016) 12:806–14. 10.1016/j.nicl.2016.10.009
61.
Paulsen JS Long JD Johnson HJ Aylward EH Ross CA Williams JK et al . Clinical and biomarker changes in premanifest Huntington disease show trial feasibility: a decade of the PREDICT-HD study. Front Aging Neurosci. (2014) 6:78. 10.3389/fnagi.2014.00078
62.
Aylward EH Nopoulos PC Ross CA Langbehn DR Pierson RK Mills JA et al . Longitudinal change in regional brain volumes in prodromal Huntington disease. J Neurol Neurosurg Psychiatry. (2011) 82:405–10. 10.1136/jnnp.2010.208264
63.
Ruocco HH Bonilha L Li LM Lopes-Cendes I Cendes F . Longitudinal analysis of regional grey matter loss in Huntington disease: effects of the length of the expanded CAG repeat. J Neurol Neurosurg Psychiatry. (2008) 79:130–5. 10.1136/jnnp.2007.116244
64.
Johnson EB Ziegler G Penny W Rees G Tabrizi SJ Scahill RI et al . Dynamics of cortical degeneration over a decade in Huntington's disease. bioRxiv. (2019) 537977. 10.1101/537977
65.
Frost C Mulick A Scahill RI Owen G Aylward E Leavitt BR et al . Design optimization for clinical trials in early-stage manifest Huntington's disease. Mov Disord. (2017) 32:1610–9. 10.1002/mds.27122
66.
Schobel SA Palermo G Auinger P Long JD Ma S Khwaja OS et al . Motor, cognitive, and functional declines contribute to a single progressive factor in early HD. Neurology. (2017) 89:2495–502. 10.1212/WNL.0000000000004743
Summary
Keywords
Huntington's disease, neurodegenerative, biomarkers, neuroimaging, volumetric MRI, C-Path
Citation
Kinnunen KM, Schwarz AJ, Turner EC, Pustina D, Gantman EC, Gordon MF, Joules R, Mullin AP, Scahill RI, Georgiou-Karistianis N and The Huntington's Disease Regulatory Science Consortium (HD-RSC) (2021) Volumetric MRI-Based Biomarkers in Huntington's Disease: An Evidentiary Review. Front. Neurol. 12:712555. doi: 10.3389/fneur.2021.712555
Received
20 May 2021
Accepted
10 August 2021
Published
21 September 2021
Volume
12 - 2021
Edited by
Clevio Nobrega, University of Algarve, Portugal
Reviewed by
Jocelyne Caboche, Centre National de la Recherche Scientifique (CNRS), France; Paula Dietrich, University of Tennessee Health Science Center (UTHSC), United States
Updates
Copyright
© 2021 Kinnunen, Schwarz, Turner, Pustina, Gantman, Gordon, Joules, Mullin, Scahill, Georgiou-Karistianis and The Huntington's Disease Regulatory Science Consortium (HD-RSC).
This is an open-access article distributed under the terms of the Creative Commons Attribution License (CC BY). The use, distribution or reproduction in other forums is permitted, provided the original author(s) and the copyright owner(s) are credited and that the original publication in this journal is cited, in accordance with accepted academic practice. No use, distribution or reproduction is permitted which does not comply with these terms.
*Correspondence: Nellie Georgiou-Karistianis nellie.georgiou-karistianis@monash.edu
This article was submitted to Dementia and Neurodegenerative Diseases, a section of the journal Frontiers in Neurology
Disclaimer
All claims expressed in this article are solely those of the authors and do not necessarily represent those of their affiliated organizations, or those of the publisher, the editors and the reviewers. Any product that may be evaluated in this article or claim that may be made by its manufacturer is not guaranteed or endorsed by the publisher.