 Weike Liu1
 Jing Xu1Huajing Song2,3Chunju Zhang2,3Yanli Yao2,3
 Hua Zhang2,3
 Yue-Chun Li1*
 Zhendong Liu2,3*
- 1Department of Cardiology, Second Affiliated Hospital and Yuying Children's Hospital of Wenzhou Medical University, Wenzhou, China
- 2Department of Cardiology, Shandong Provincial Hospital Affiliated to Shandong First Medical University, Jinan, China
- 3School of Basic Medicine, Shandong First Medical University and Shandong Academy of Medical Sciences, Jinan, China
Objective: Small and dense low-density lipoprotein (sdLDL) elevation may be among the most sensitive early biomarkers for nascent cardiovascular disease. This study, therefore, investigated the association between visit-to-visit changes in sdLDL and cerebral small vessel disease (CSVD) progression in older individuals, and the influence of Apolipoprotein E (APOE) genotype on this association.
Methods: Between April 2007 and July 2009, 1,143 participants ≥60 years old were recruited from the Shandong region of China, and sdLDL was measured at baseline and at each follow-up visit. White matter hyperintensities (WMHs), lacunes, microbleeds, and enlarged perivascular spaces (EPVSs) were assessed by magnetic resonance imaging. The APOE genotype was determined and participants were stratified as ε4-positive or ε4-negative.
Results: During an average follow-up of 86.0 months, 225 participants (19.7%) developed WMH progression, 193 (16.9%) lacune progression, 170 (14.9%) microbleed progression, and 185 (16.2%) EPVS progression. Compared with patients in the first (lowest) tertile of visit-to-visit mean sdLDL, those in the second and third tertiles demonstrated significantly greater risks of WMH progression (53.5 and 105.3% higher), lacune progression (53.3 and 60.8%), microbleed progression (47.2 and 127.6%), and EPVS progression (54.0 and 135.0%) after adjustment for confounders (all adjusted P values for trends <0.001). Compared with patients in the first tertile of visit-to-visit sdLDL SD, those in the second and third tertiles also demonstrated significantly greater risks of WMH progression (49.9% and 143.6%), lacune progression (75.3 and 178.0%), microbleed progression (12.7 and 64.7%), and EPVS progression (41.7 and 114.6%) after adjustment (all P < 0.001). There were significant and positive visit-to-visit mean sdLDL × visit-to-visit sdLDL SD, visit-to-visit mean sdLD×ε4-positive, visit-to-visit sdLDL SD×ε4-positive, and visit-to-visit mean sdLDL×visit-to-visit sdLDL SD×ε4-positive interactions influencing CSVD progression after confounder adjustment (all P < 0.05).
Conclusion: Large and variable visit-to-visit changes in sdLDL are independent predictors of aggressive CSVD progression, and this association is strongly influenced by APOE ε4 allele genotype.
Introduction
Cerebral small vessel disease (CSVD) is a major contributor to stroke and dementia in older individuals (1, 2). Indeed, CSVD is implicated in 25%−30% of strokes and up to 45% of dementia cases. The MRI hallmarks of CSVD are well-established, namely, white matter hyperintensities (WMHs), lacunes, microbleeds, and enlarged perivascular spaces (EPVSs) (1–3). Nonetheless, the exact etiology of CSVD is not fully understood, which has impeded the development of effective strategies for prevention and control (4).
Elevated serum low-density lipoprotein cholesterol (LDL-C) is widely regarded as the primary risk factor for macroangiopathic cardiovascular diseases, including myocardial infarction and stroke (5, 6), and several guidelines recommend LDL-C-lowering medication as the primary preventive therapy (7–9). However, the efficacy of LDL-C-lowering medications, such as statins, on CSVD progression is still controversial (10–14), possibly due to the paucity of data on the associations between various LDL-C fractions and CSVDs (15).
Low-density lipoprotein cholesterol particles are heterogeneous and fractionated based on size and density into large buoyant and small dense particles (16, 17). The small dense particles, constituting the so-called small and dense low-density lipoprotein (sdLDL) fraction, are more atherogenic than the large buoyant particles due to greater susceptibility to oxidation, higher cell membrane permeability, and reduced affinity for the LDL receptor (17, 18). Therefore, sdLDL has been suggested as a sensitive predictive biomarker for the early diagnosis of cardiovascular diseases, particularly atherosclerosis (17, 19–21). However, the association between sdLDL and CSVD progression remains unclear. In this study, our major objective was to investigate the association between CSVD progression and visit-to-visit changes in mean sdLDL among older individuals.
Methods
Study Participants and Design
To clarify the role of sdLDL in CSVD progression, 1,143 participants aged ≥60 years old were recruited between April 2007 and July 2009 from the Shandong area of China for a prospective and population-based cohort study (identifier at www.chictr.org.cn/, ChiCTR–EOC−17013598) (10, 22). The exclusion criteria were as follows: history of stroke/transient ischemic attack, Alzheimer's disease, Parkinson's disease, schizophrenia, seizures, claustrophobia, bipolar disorder, myocardial infarction, congestive heart failure, liver and renal diseases, dialysis treatment, drug and alcohol abuse, malignancy, contraindications to MRI, less than two annual sdLDL measurements and one brain MRI assessments during follow-up, and unwilling to provide informed consent.
The research ethics committee of the Institute of Basic Medicine, Shandong Academy of Medical Sciences, Shandong, China approved the study protocol. Each participant provided informed written consent and the study was conducted in compliance with the Declaration of Helsinki.
Follow-UP
As previously described (10, 22), participants were examined at six-month intervals after the baseline measurements with the help of family physicians. Demographic and clinical characteristics including current medications such as antidyslipidemic, antihypertensive, antidiabetic, and antiplatelet drugs were recorded at every clinical visit. Total cholesterol (TCHO), triglyceride, high-density lipoprotein cholesterol (HDL-C), LDL-C, sdLDL, and fasting plasma glucose were assessed at baseline and at annual follow-up visits. After corresponding sdLDL assessments, respectively, white matter hyperintensities, lacunes, microbleeds, and EPVS were determined by MRI at baseline (2007–2009) and at three subsequent visits during the periods 2009–2012, 2013–2015, and 2016–2018.
Measurements of Visit-to-Visit Mean and Variation in SdLDL
Venous blood samples were collected from each participant in the morning after overnight fasting. Blood plasma and mononuclear cells were separated and stored at −80°C for lipid assessment and APOE genotype determination, respectively. Plasma TCHO, triglycerides, HDL-C, LDL-C, and glucose were assessed using routine laboratory methods and sdLDL was determined using an sdLDL “Seiken” kit (Denka Seiken Co. Ltd, Tokyo, Japan) and Hitachi 7600 automatic biochemical analyzer (Hitachi, Japan) (23, 24). The participants received at least two annual sdLDL measurements during follow-up. The mean and SD in sdLDL of each participant were estimated from these serial sdLDL measurements.
Brain MRI Assessment
Neuroimaging markers for CSVD were assessed on 3.0-Tesla scanners (GE Medical Systems, Pittsburgh, PA, USA; GE Systems, Milwaukee, WI, USA; or Siemens Medical, Erlangen, Germany) using protocols described previously (11, 22). Briefly, scans were acquired using T1-weighted 3-dimensional magnetization-prepared rapid gradient echo, T2-weighted 3-dimensional fast spin-echo, fluid-attenuated inversion recover (FLAIR), and T2*-weighted gradient-echo sequences. Montreal Neurological Institute templates were applied to normalize MRIs and then spatial transformation matrices were obtained. The International Consortium for Brain Mapping template for East Asian Brains was used to correct for differences in individual MRI features during the normalization. Images were then smoothed and the variability in local anatomy among subjects was minimized using a Gaussian filter.
White matter hyperintensities volume was computed from periventricular regions (frontal, parietal, occipital, and temporal), subcortical regions (frontal, parietal, occipital, and temporal), basal ganglia, and infratentorial regions on segmented T2-weighted and FLAIR axial images using FreeSurfer. The WMH-to-intracranial volume (ICV) ratio ([WMH (ml)/total intracranial volume (ml)] × 100%) was calculated to normalize individual WMH volumes. Volumetric analysis was conducted using the brain extraction tool of the FSL software package (FMRIB Software Library, Oxford, UK, www.fmrib.ox.ac.uk/fsl, version 4.19). The individual WMH pattern was graded on FLAIR images according to the Fazekas scale as none, punctuate, early confluent, and confluent.
Lacunes, microbleeds, and EPVSs were determined according to the diagnostic criteria defined in STRIVE v1 (STandards for ReportIng Vascular changes on nEuroimaging version 1). A lacune was defined as a 3–15 mm cavity with cerebrospinal-fluid-like signal intensity involving the white matter, internal capsule, basal ganglia, thalamus, or brain stem on a combination of T1-weighted, T2-weighted, and FLAIR images. Microbleeds in the brain parenchyma were defined on T2*-weighted images as oval or round homogenous and hypointense foci of diameter 2–10 mm. Mimics of microbleeds arising from signal averaging of bone, calcifications, and sulcal vessel signals on T2*-weighted images were systematically distinguished and excluded. Enlarged perivascular spaces were defined as visible fluid-filled spaces adjacent to cerebral vessels on T2-weighted and FLAIR images and distinguished from small lacunes of presumed vascular origin.
Each available scan was rated in a side-by-side fashion by experienced neuroradiologists initially blinded to clinical details, and consensus meetings were held to resolve disagreements among raters. A total of one hundred and forty randomly selected MRI scans were scored first to assess interrater and intrarater reliability. The interrater and intrarater coefficients of variation for WMH volume were 0.94 and 0.92, and the weighted Cohen's kappa values were 0.88 and 0.87 for the Fazekas scale, 0.84 and 0.83 for lacunes, 0.85 and 0.83 for microbleeds, and 0.79 and 0.80 for EPVSs, respectively, indicating good reliability.
Identification of CSVD Progression
The progression of each CSVD neuroimaging hallmark was determined from at least two MRI assessments during follow-up. The WMH progression was assessed by volume change and visual rating. The volume change during the follow-up period was defined as the difference between each successive follow-up WMH volume measurement minus the baseline volume, while the visual rating of absence or presence of progression was assessed using the modified Rotterdam Progression scale (scores of 0 and 1, respectively) (25, 26). For lacunes, microbleeds, and EPVSs, progression was defined as the presence of any new lesions on follow-up scans (presence = 1 and absence = 0) (27). The progression of total CSVD burden was defined as the new incident of coexistence of WMH, lacune, microbleeds, and EPVSs in this study. It was rated as 1 if one of the four markers occurred, and the total score ranged from 1 to 4.
Apolipoprotein E (APOE) Genotyping
All participants were genotyped for the APOE rs429358 and rs7412 single-nucleotide polymorphisms by PCR using the TaqMan genotyping kit (Applied Biosystems, Foster City, CA, USA), forward primer 5'-TTG AAG GCC TAC AAA TCG GAA CTG-3', and reverse primer 5'-CCG GCT GCC CAT CTC CAT CCG-3' (11, 28, 29). Participants with the ε2/ε4, ε3/ε4, or ε4/ε4 genotype were categorized as ε4-positive carriers, while participants with the ε2/ε2, ε2/ε3, or ε3/ε3 genotype were categorized as ε4-negative carriers (11, 28).
Statistical Analysis
Participants were divided into three tertiles of visit-to-visit mean sdLDL and sdLDL SD. Variables are presented as mean (SD), median [interquartile range (IQR)], or number (percentage) as appropriate. The normality of continuous variables was determined using the Kolmogorov–Smirnov test. Mean baseline characteristics were compared among groups by one-way ANOVA with post hoc Bonferroni's correction, Kruskal–Wallis test with post hoc Wilcoxon rank-sum test, or chi-square test as indicated. Differences in the trends of WMH volume and WMH-to-ICV ratio were assessed using a linear mixed model and differences in CSVD progression risk by Kaplan–Meier analysis and log-rank test among groups. The hazard ratio (HR) with 95% CI was estimated using the Cox proportional hazards model. Models were initially adjusted for age and sex (model 1). Model 2 adjusted for smoking; alcohol consumption; the initial body mass index, blood pressure, lipids, and fasting plasma glucose at baseline; the histories of hypertension, diabetes, and dyslipidemia; medications; and the initial WMH volume (for the changes in WMH volume analysis) and WMH-to-ICV ratio (for the changes in WMH fraction analysis) at baseline base on model 1. Model 3 adjusted for visit-to-visit mean sdLDL (for the models grouped by the tertile of variability in sdLDL), variability in sdLDL (for the models grouped by the tertile of visit-to-visit mean sdLDL), and APOE genotype. We also conducted an exploratory investigation on the influences of visit-to-visit mean sdLDL×sdLDL SD, visit-to-visit mean sdLD×APOE ε4 genotype, visit-to-visit sdLDL SD×APOE ε4 genotype, and visit-to-visit mean sdLDL×sdLDL SD×APOE ε4 genotype interactions on CSVD progression. Missing data were imputed using chained equations. All statistical analyses were performed using SPSS v.24.0 (SPSS Inc., Chicago, IL, USA). A P < 0.05 (two-tailed) was considered statistically significant for all tests.
Results
Baseline Characteristics
There were 1,309 initial enrolled individuals at baseline in this study. Among them, 69 failed in less than two annual sdLDL measurements and 51 failed in at least one brain MRI assessment during the follow-up period, and 46 failed to identify APOE genotype. Finally, 1,143 participants were eligible and used for further analyses. Table 1 summarizes the baseline characteristics of the eligible participants, including brain MRI parameters and APOE genotype. Supplementary Figure 1 presents the changes in sdLDL during the follow-up period. The median visit-to-visit mean sdLDL was 0.60 mmol/l [IQR, 0.49–0.72 mmol/l] and the median visit-to-visit sdLDL SD was 0.25 mmol/l [0.17–0.34 mmol/l]. The tertiles of visit-to-visit mean sdLDL were <0.53, 0.53–0.66, and ≥0.67 mmol/l and the tertiles for visit-to-visit sdLDL SD were <0.20, 0.20–0.30, and ≥0.31 mmol/l.
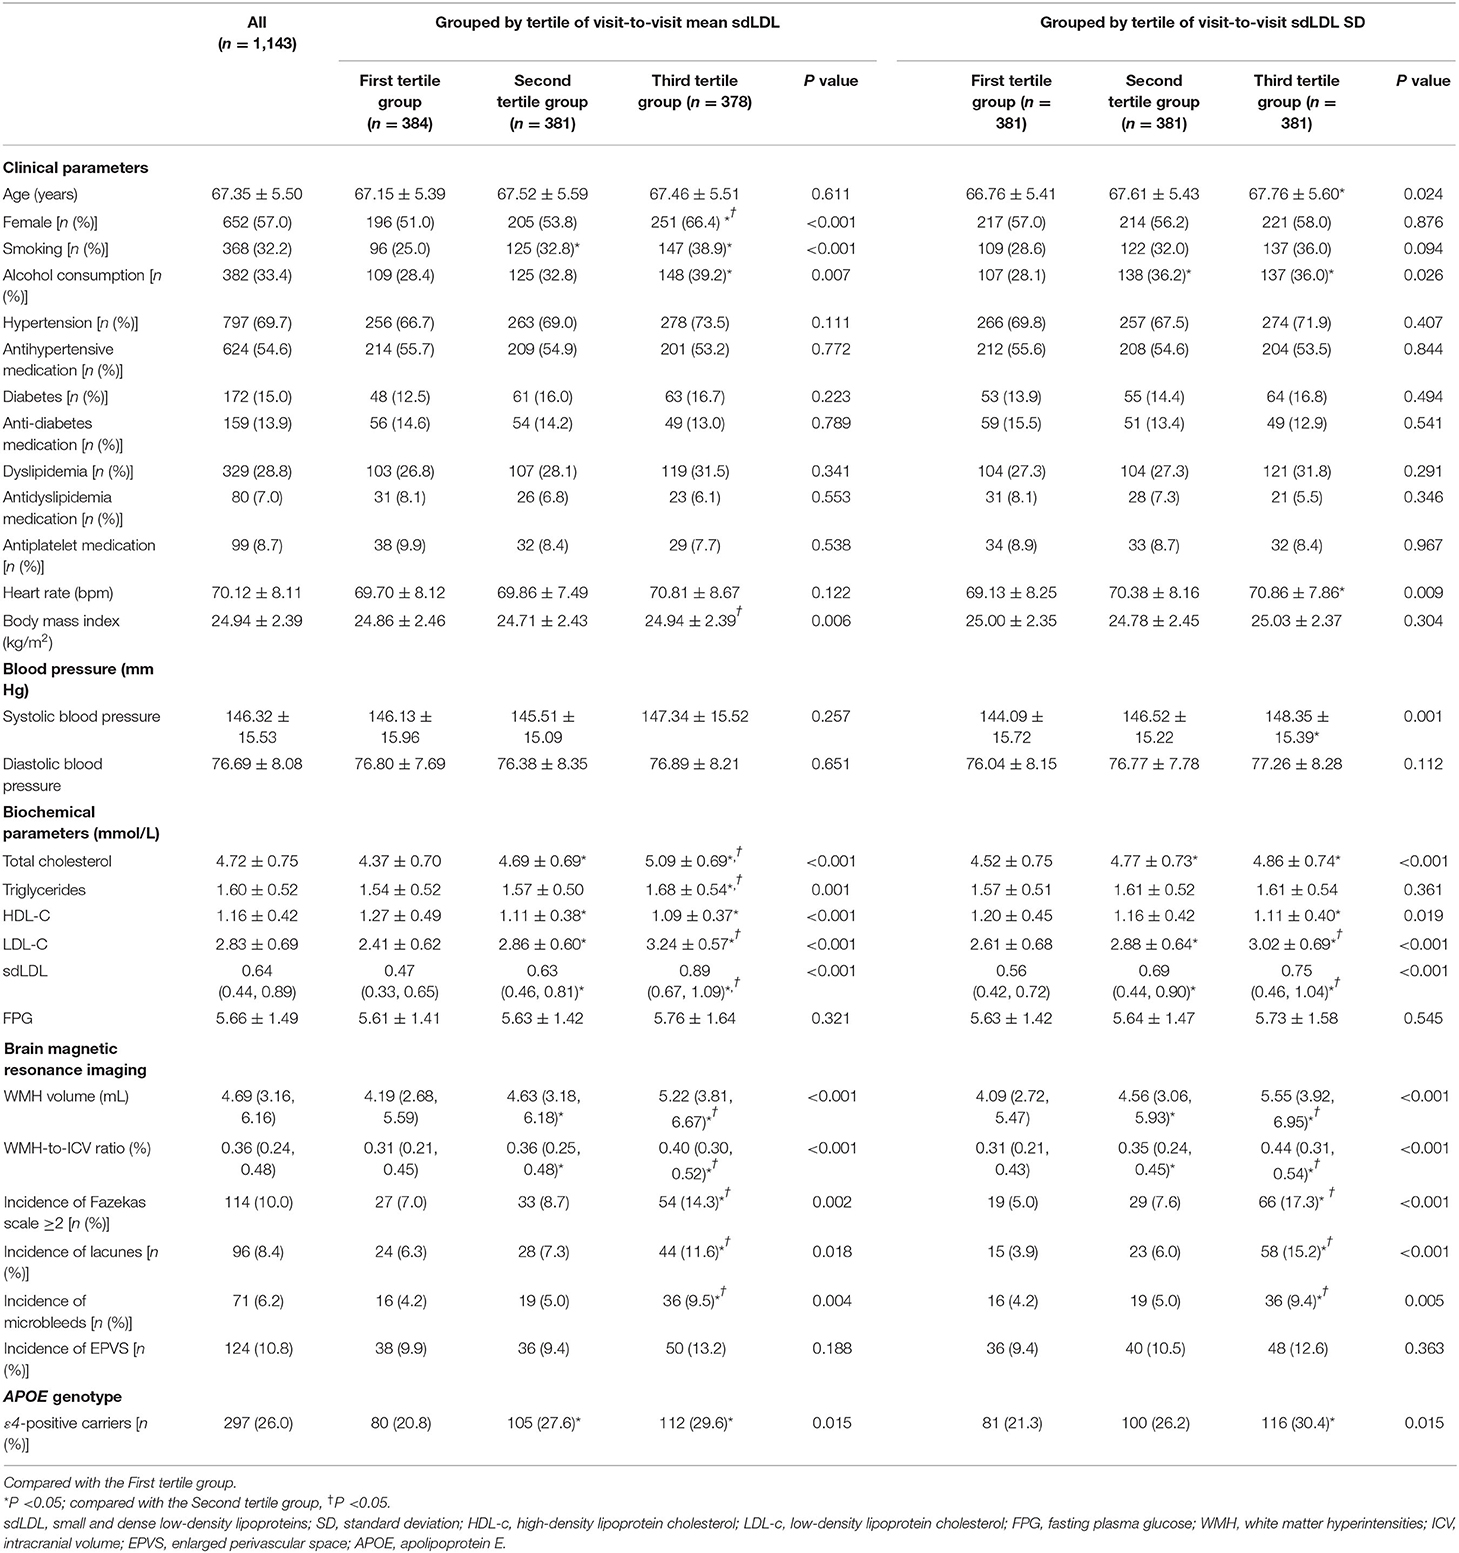
Table 1. Participant demographic and baseline clinical characteristics.
Outcomes
During an average 86.0 [IQR, 84.0–90.0] months of follow-up, WMH volume increased by 1.72 [IQR, 1.44–2.03] ml and WMH-to-ICV ratio by 0.14% [IQR, 0.11%−0.17%]. During follow-up, 225 participants (19.7%) developed WMH progression, 193 (16.9%) lacune progression, 170 (14.9%) microbleed progression, and 185 (16.2%) developed EPVS progression. The average of CSVD new burden was 0.67 (IQR, 0–1).
Contributions of Visit-to-Visit Mean SdLDL to CSVD Progression Risk
To examine the contributions of sdLDL to CSVD progression rise, we first compared the trends in WMH volume and WMH-to-ICV ratio changes and CSVD new burden among visit-to-visit mean sdLDL tertile groups (defined in the previous section) and found that compared to the first tertile group, the second and third groups demonstrated significantly greater increases in WMH volume, WMH-to-ICV ratio, and CSVD new burden (all P < 0.05). Furthermore, increases in WMH volume, WMH-to-ICV ratio, and CSVD new burden were significantly greater in the third tertile group than in the second (all P < 0.05), and these differences remained significant after values were adjusted for confounders including baseline WMH volume and baseline WMH-to-ICV ratio (adjusted P values for trends <0.05, Figure 1 and Supplementary Figure 2). Visit-to-visit increases in mean sdLDL were also associated with greater risks of WMH, lacune, microbleed, and EPVS progression. Compared with the first tertile group, the second and third tertile groups showed significantly greater risks of WMH progression (53.5% and 105.3% greater), lacune progression (53.3% and 60.8%), microbleed progression (47.2% and 127.6%), and EPVS progression (54.0% and 135.0%) (all adjusted P values for trends <0.001). The HRs and 95% CIs resulting from analysis model 3 are provided in Figure 2 and Supplementary Table 1.
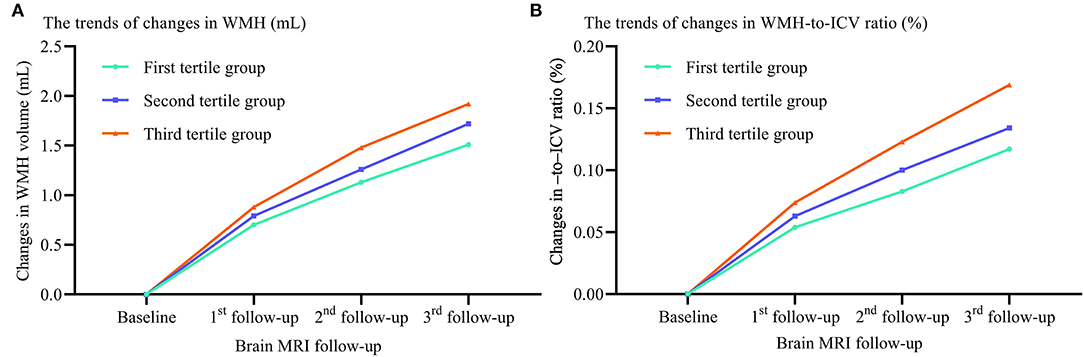
Figure 1. Differences in WMH volume and WMH-to-ICV ratio changes among tertile groups stratified by visit-to-visit mean sdLDL during the follow-up period. (A) Changes in WMH. (B) Changes in WMH-to-ICV ratio. WMH, white matter hyperintensities; ICV, intracranial volume.
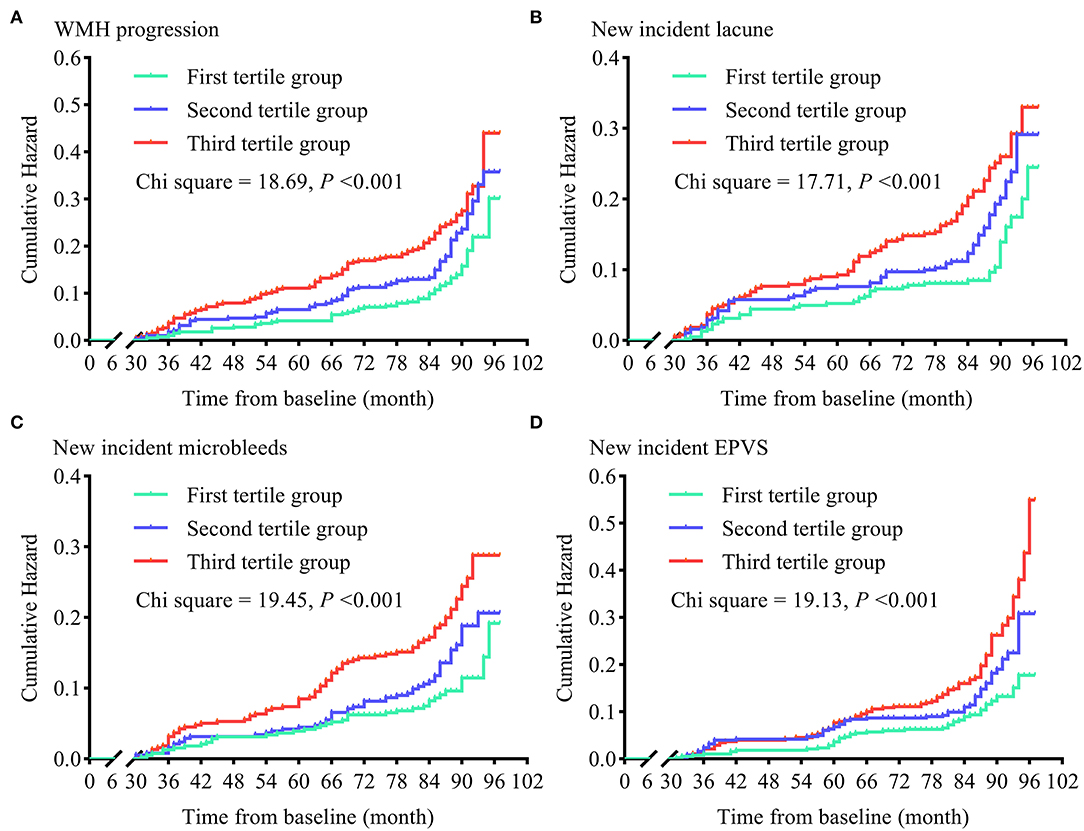
Figure 2. Cumulative hazards of cerebral small vessel disease progression in tertile groups stratified by visit-to-visit mean sdLDL during the follow-up period. (A) Cumulative hazards of WMH progression. (B) Cumulative hazards of new-incident lacunes. (C) Cumulative hazards of new-incident microbleeds. (D) Cumulative hazards of new-incident EPVS. WMH, white matter hyperintensities; EPVS, enlarged perivascular space.
Contributions of Visit-to-Visit SdLDL Variability to CSVD Progression Risk
We also compared the trends in WMH volume and WMH-to-ICV ratio changes and CSVD new burden among tertile groups stratified by the visit-to-visit sdLDL SD, and again found the WMH volume and WMH-to-ICV ratio changes and CSVD new burden were significantly greater in the third tertile group than in the first and second tertile groups, and greater in the second than the first tertile group (all P < 0.05). Furthermore, these differences among tertile groups remained significant after adjustment for confounders including the baseline WMH volume and WMH-to-ICV ratio (all adjusted P values for trend <0.05, Figure 3).
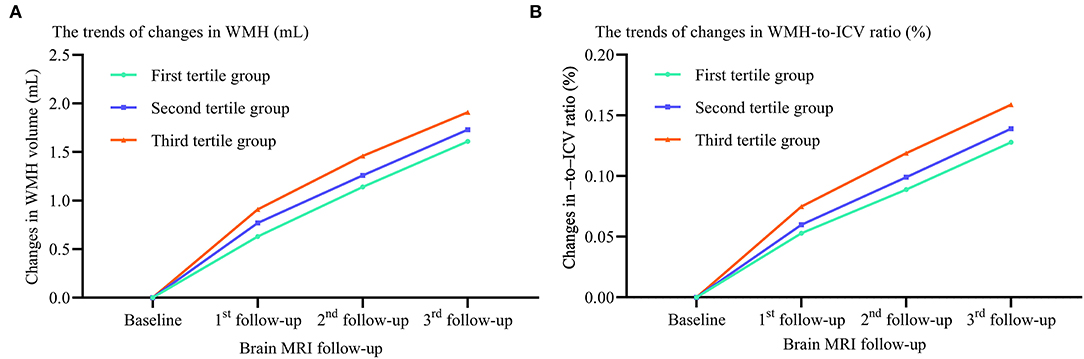
Figure 3. Differences in WMH volume and WMH-to-ICV ratio changes among tertile groups stratified by visit-to-visit sdLDL SD during the follow-up period. (A) Changes in WMH. (B) Changes in WMH-to-ICV ratio. WMH, white matter hyperintensities; ICV, intracranial volume.
Like increased mean sdLDL, greater visit-to-visit sdLDL SD was associated with significantly higher risks of WMH progression (49.9% higher in the second tertile and 143.6% higher in the third tertile group compared with the first), lacune progression (75.3 and 178.0% higher, respectively), microbleed progression (12.7 and 64.7% higher, respectively), and EPVS progression (41.7 and 114.6% higher, respectively), and these increases were still significant after adjustment for confounders (all adjusted P values for trends <0.001). The HRs and 95% CIs resulting from analysis model 3 are provided in Figure 4 and Supplementary Table 1.
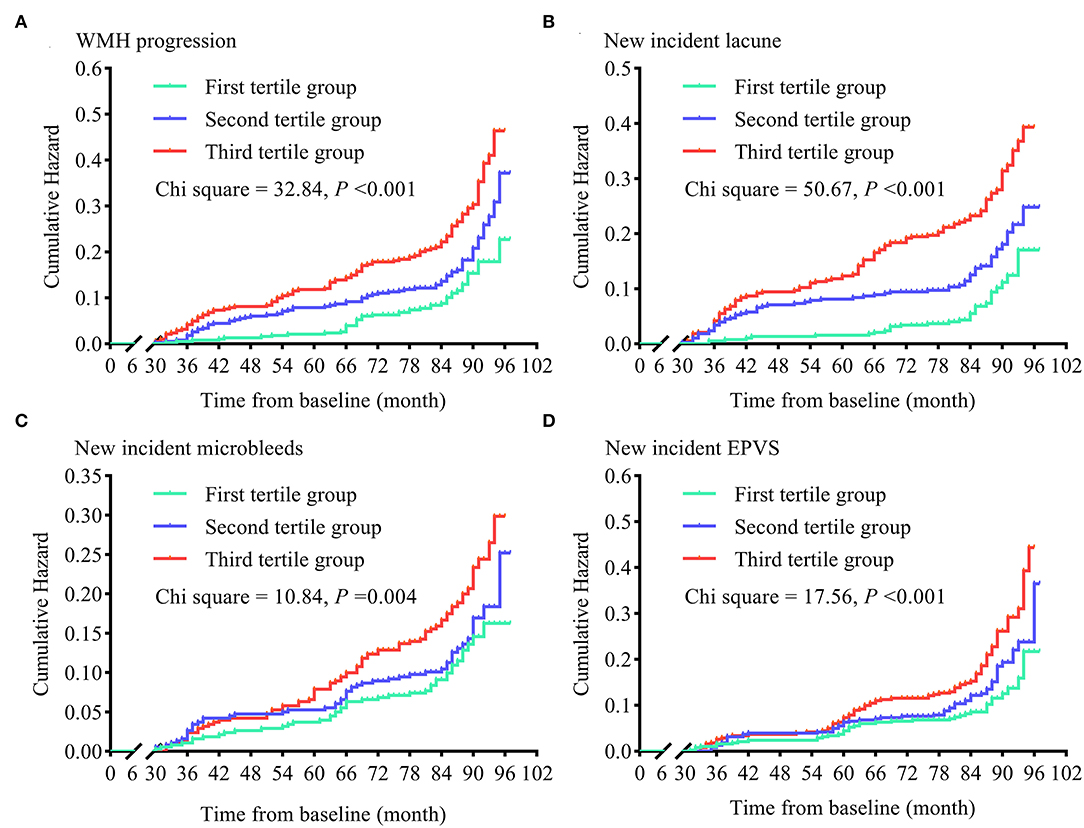
Figure 4. Cumulative hazards of cerebral small vessel disease progression in tertile groups stratified by visit-to-visit sdLDL SD during the follow-up period. (A) Cumulative hazards of WMH progression. (B) Cumulative hazards of new-incident lacunes. (C) Cumulative hazards of new-incident microbleeds. (D) Cumulative hazards of new-incident EPVS. WMH, white matter hyperintensities; EPVS, enlarged perivascular space.
Contributions of Interactions Among Visit-to-Visit Mean SdLDL, Visit-to-Visit SdLDL Variability, and APOE Genotype to CSVD Progression Risk
We also identified significant positive visit-to-visit mean sdLDL×visit-to-visit sdLDL SD, visit-to-visit mean sdLDL×APOE ε4 allele, visit-to-visit sdLDL SD×APOE ε4 allele, and visit-to-visit mean sdLDL×visit-to-visit sdLDL SD×APOE ε4 allele interaction effects on CSVD progression after adjustment for confounders (adjusted P values <0.05). The details are shown in Table 2.
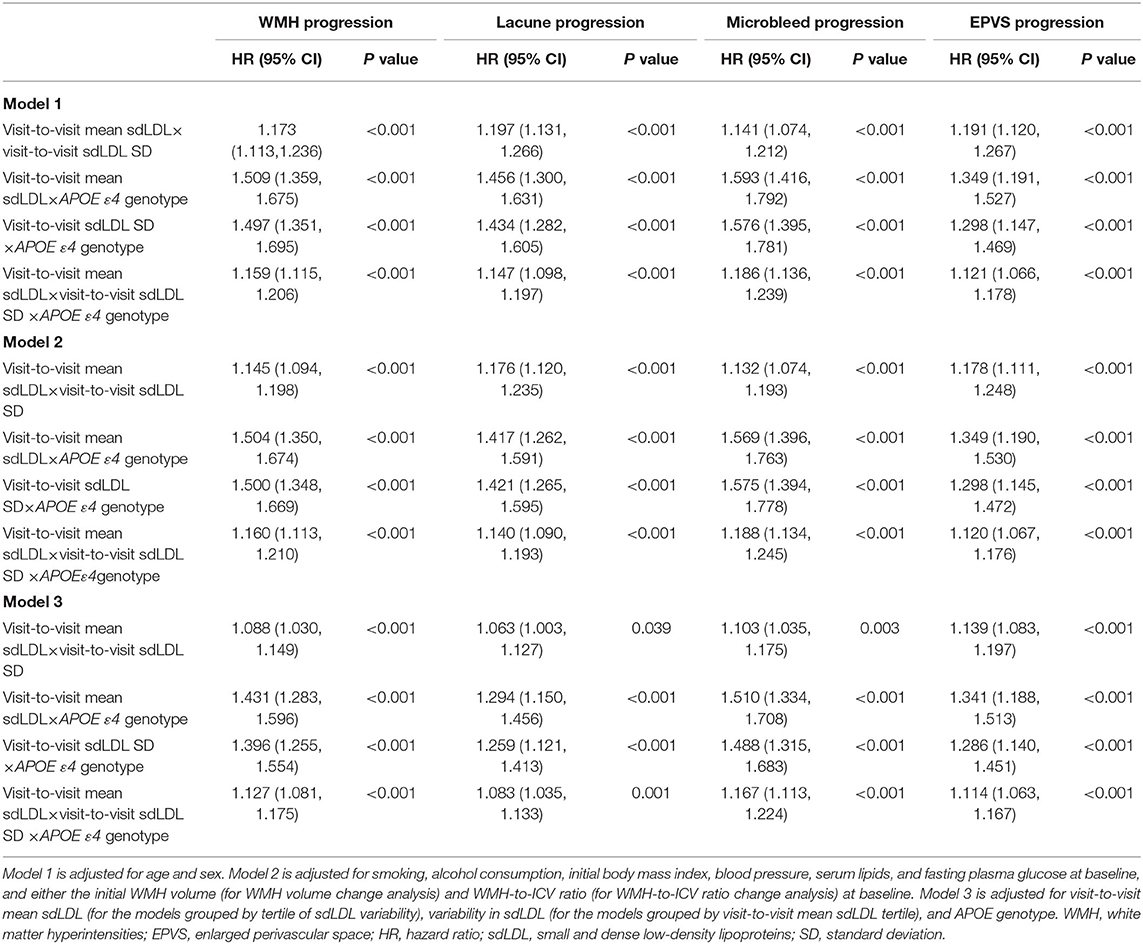
Table 2. Interactions among visit-to-visit mean sdLDL, visit-to-visit sdLDL variability, and APOE genotype influencing cerebral small vessel disease progression.
Discussion
In this prospective longitudinal cohort study, we found that visit-to-visit mean sdLDL and visit-to-visit sdLDL SD were independently associated with the risk of CSVD progression over a mean duration of 86.0 months in older adults. Specifically, greater visit-to-visit mean sdLDL and sdLDL SD predicted more aggressive progression of the CSVD manifestations WMH volume, lacunes, microbleeds, and EPVS. Furthermore, there were significant positive mutual interaction effects of visit-to-visit mean sdLDL and visit-to-visit sdLDL SD and positive interaction effects of both with APOE ε4 genotype on CSVD progression.
The sdLDL faction of LDL is strongly associated with atherosclerotic disease (19, 20, 30, 31), possibly due to the greater susceptibility of sdLDL particles to oxidation, higher cell membrane permeability than other fractions, and lower LDL receptor affinity (17, 18). Several reports have document associations between sdLDL level and both carotid artery intima-media thickness and plaque progression (32–34). The Atherosclerosis Risk in Communities study also found that the risk of coronary artery disease was 1.5-fold higher in individuals with sdLDL in the four quartiles (≥75th percentile) compared to the lowest quartile (20), while a Chinese cohort study with an average 9.5-year follow-up identified sdLDL level as an independent risk factor for major adverse cardiovascular events in hypertensive subjects (24). Here, we extend these findings by demonstrating a significant association of sdLDL with CSVD. To the best of our knowledge, only one previous study has reported an association between sdLDL and a CSVD sign (brain WMH volume) (35) but the cross-sectional design precluded evaluation of an association with disease progression. In the current prospective longitudinal cohort study, we show that long-term sdLDL elevation and greater variability are strongly associated with CSVD progression, particularly in APOE ε4 carriers. We also found that greater visit-to-visit mean sdLDL and sdLDL SD were associated with higher risks of lacune, microbleed, and EPVS progression and WMH volume progression, even after adjustment for multiple confounders including baseline sdLDL, LDL-C, and WMH volume and also lacune, microbleed, and EPVS incidence.
Serum lipid levels and sdLDL levels are influenced by numerous factors, namely, diet, exercise level, medication adherence and dose, season, and mood (18, 36–40). Relationships between high serum LDL-C variability and increased cardiovascular and cerebrovascular disease risks are well established (36, 41–43). Thus, we hypothesized that sdLDL variability would also be closely associated with CSVD progressions, and indeed higher tertile of sdLDL SD predicted WMH, lacune, microbleed, and EPVS progression after adjustment for confounders including visit-to-visit mean sdLDL. In addition, visit-to-visit sdLDL SD interacted synergistically with visit-to-visit mean sdLDL to further increase CSVD risk.
One of the major functions of APOE is to regulate lipid metabolism, especially of TCHO and LDL-C (11, 28, 44). Apolipoprotein E is abundantly expressed in the brain and accumulation on vessel walls is strongly associated with CSVD severity (45–47). Our exploratory analysis showed that the APOE ε4 allele significantly and positively interacted with both higher visit-to-visit mean sdLDL and visit-to-visit sdLDL SD to enhance CSVD progressions risk. Thus, the APOE genotype is an important mediator of the association between serum sdLDL and CSVD progression in older individuals.
The major strengths of this study include the prospective longitudinal cohort design with long-term follow-up and a large sample size. In addition, we examined the effects of both higher long-term mean sdLDL and greater long-term sdLDL variability on CSVD progression and the interaction between these factors and APOE genotype. On the other hand, many critical confounders were not examined, such as lifestyle, diet, season, mood changes, and medication adherence, all of which can significantly influence serum lipid levels and variability (18, 37–40). Second, all participants were of Han ethnicity, so applicability to other ethnicities is uncertain. Third, we did not examine many additional pathogenic factors that could directly influence disease progression or the effects of serum sdLDL, such as oxidative stress, endothelial dysfunction, and inflammatory status.
In conclusion, serum sdLDL level and variation are critical independent and synergistically acting risk factors for CSVD progression in older individuals. Moreover, the APOE genotype strongly influences the association of sdLDL level with CSVD progression. However, further multinational studies involving additional ethnic groups and controlling for factors such as lifestyle, diet, and medication adherence are needed to validate our results.
Data Availability Statement
The original contributions presented in the study are included in the article/Supplementary Material, further inquiries can be directed to the corresponding authors.
Ethics Statement
The studies involving human participants were reviewed and approved by the Research Ethics Committee of the Institute of Basic Medicine, Shandong Academy of Medical Sciences, Shandong, China. The patients/participants provided their written informed consent to participate in this study.
Author Contributions
WL wrote the manuscript with input from all authors. WL, JX, HS, CZ, YY, and HZ were responsible for data collection. WL and HZ performed the statistical analysis. Y-CL and ZL designed and supervised the study, drafting, and editing of the manuscript. All authors contributed to a critical review of the manuscript.
Funding
This work was supported by the National Natural Science Foundation of China (Grant Nos. 81870281, 81670432, and 81973139), the Zhejiang Provincial Natural Science Foundation of China (Grant Nos. LY18H020011 and LQ19H020005), the Key Technology Research and Development Project of Shandong Province (Grant Nos. 2019GSF108079 and 2018GSF118044), the Medical and Health Science and Technology Development Plan Project of Shandong, China (Grant No. 202103010686), and the Innovation Project of Shandong Academy of Medical Sciences, and the Academic Promotion Program of Shandong First Medical University.
Conflict of Interest
The authors declare that the research was conducted in the absence of any commercial or financial relationships that could be construed as a potential conflict of interest.
The reviewer CY declared a shared parent affiliation with the authors HS, CZ, HZ, YY, and ZL to the handling editor at the time of review.
Publisher's Note
All claims expressed in this article are solely those of the authors and do not necessarily represent those of their affiliated organizations, or those of the publisher, the editors and the reviewers. Any product that may be evaluated in this article, or claim that may be made by its manufacturer, is not guaranteed or endorsed by the publisher.
Acknowledgments
The authors thank the participants, family physicians, and nurses involved in this study and all individuals who offered their assistance.
Supplementary Material
The Supplementary Material for this article can be found online at: https://www.frontiersin.org/articles/10.3389/fneur.2022.851735/full#supplementary-material
Abbreviations
APOE, Apolipoprotein E; CSVD, cerebral small vessel disease; EPVS, enlarged perivascular spaces; FLAIR, fluid-attenuated inversion recovery; HDL-C, high-density lipoprotein cholesterol; ICV, intracranial volume; LDL-C, low-density lipoprotein cholesterol; sdLDL, small and dense low-density lipoprotein; TCHO, total cholesterol; WMH, white matter hyperintensities.
References
1. Wardlaw JM, Smith EE, Biessels GJ, Cordonnier C, Fazekas F, Frayne R, et al. STandards for ReportIng Vascular changes on nEuroimaging (STRIVE v1). Neuroimaging standards for research into small vessel disease and its contribution to ageing and neurodegeneration. Lancet Neurol. (2013) 12:822–38. doi: 10.1016/S1474-4422(13)70124-8
2. Wardlaw JM, Smith C, Dichgans M. Mechanisms of sporadic cerebral small vessel disease: insights from neuroimaging. Lancet Neurol. (2013) 12:483–97. doi: 10.1016/S1474-4422(13)70060-7
3. Graff-Radford J, Aakre JA, Knopman DS, Schwarz CG, Flemming KD, Rabinstein AA, et al. Prevalence and heterogeneity of cerebrovascular disease imaging lesions. Mayo Clin Proc. (2020) 95:1195–205. doi: 10.1016/j.mayocp.2020.01.028
4. Georgakis MK, Malik R, Anderson CD, Parhofer KG, Hopewell JC, Dichgans M. Genetic determinants of blood lipids and cerebral small vessel disease: role of high-density lipoprotein cholesterol. Brain. (2020) 143:597–610. doi: 10.1093/brain/awz413
5. National Cholesterol Education Program (NCEP) Expert Panel on Detection, Evaluation, and Treatment of High Blood Cholesterol in Adults (Adult Treatment Panel III). (2002). Third Report of the National Cholesterol Education Program (NCEP) Expert Panel on Detection, Evaluation, and Treatment of High Blood Cholesterol in Adults (Adult Treatment Panel III) final report. Circulation. 106:3143–421. doi: 10.1161/circ.106.25.3143
6. Ference BA, Ginsberg HN, Graham I, Ray KK, Packard CJ, Bruckert E, et al. Low-density lipoproteins cause atherosclerotic cardiovascular disease. 1. Evidence from genetic, epidemiologic, clinical studies. A consensus statement from the European Atherosclerosis Society Consensus Panel. Eur. Heart J. (2017) 38:2459–72. doi: 10.1093/eurheartj/ehx144
7. Arnett DK, Blumenthal RS, Albert MA, Buroker AB, Goldberger ZD, Hahn EJ, et al. 2019 ACC/AHA Guideline on the primary prevention of cardiovascular disease: a report of the American College of Cardiology/American Heart Association Task Force on Clinical Practice Guidelines. Circulation. (2019) 140:e596–646. doi: 10.1161/CIR.0000000000000678
8. Mortensen MB, Nordestgaard BG. Comparison of five major guideline for statin use in primary prevention in a contemporary general population. Ann Intern Med. (2018) 168:85–92. doi: 10.7326/M17-0681
9. US Preventive Services Task Force, Bibbins-Domingo K, Grossman DC, Curry SJ, Davidson KW, Epling JW, et al. Statin use for the primary prevention of cardiovascular disease in adults: US Preventive Services Task Force Recommendation Statement. JAMA. (2016) 316:1997–2007. doi: 10.1001/jama.2016.15450
10. Guo Y, Li Y, Liu X, Cui Y, Zhao Y, Sun S, et al. Assessing the effectiveness of statin therapy for alleviating cerebral small vessel disease progression in people ≥75 years of age. BMC Geriatr. (2020) 20:292. doi: 10.1186/s12877-020-01682-w
11. Ji T, Zhao Y, Wang J, Cui Y, Duan D, Chai Q, et al. Effect of low-dose statins and Apolipoprotein E genotype on cerebral small vessel disease in older hypertensive patients: a subgroup analysis of a randomized clinical trial. J Am Med Dir Assoc. (2018) 19:995–1002.e4. doi: 10.1016/j.jamda.2018.05.025
12. Kim JS. Role of blood lipid levels and lipid-lowering therapy in stroke patients with different levels of cerebral artery diseases: reconsidering recent stroke guidelines. J Stroke. (2021) 23:149–61. doi: 10.5853/jos.2021.01249
13. Sillesen H, Amarenco P, Hennerici MG, Callahan A, Goldstein LB, Zivin J, et al. Atorvastatin reduces the risk of cardiovascular events in patients with carotid atherosclerosis: a secondary analysis of the Stroke Prevention by Aggressive Reduction in Cholesterol Levels (SPARCL) trial. Stroke. (2008) 39:3297–302. doi: 10.1161/STROKEAHA.108.516450
14. Zhang H, Cui Y, Zhao Y, Dong Y, Duan D, Wang J, et al. Effects of sartans and low-dose statins on cerebral white matter hyperintensities and cognitive function in older patients with hypertension: a randomized, double-blind and placebo-controlled clinical trial. Hypertens Res. (2019) 42:717–29. doi: 10.1038/s41440-018-0165-7
15. Mitaki S, Nagai A, Oguro H, Yamaguchi S. Serum Lipid Fractions and Cerebral Microbleeds in a Healthy Japanese Population. Cerebrovasc Dis. (2017) 43:186–91. doi: 10.1159/000456623
16. Hayashi T, Fukui T, Nakanishi N, Yamamoto S, Tomoyasu M, Osamura A, et al. Dapagliflozin decreases small dense low-density lipoprotein-cholesterol and increases high-density lipoprotein 2-cholesterol in patients with type 2 diabetes: comparison with sitagliptin. Cardiovasc Diabetol. (2017) 16:8. doi: 10.1186/s12933-016-0491-5
17. Nakayama A, Morita H, Sato T, Kawahara T, Takeda N, Kato S, et al. Small dense low-density lipoprotein cholesterol is a potential marker for predicting laser treatment for retinopathy in diabetic patients. J Atheroscler Thromb. (2021) 14. doi: 10.21203/rs.3.rs-53274/v1
18. Alizadeh-Fanalou S, Nazarizadeh A, Alian F, Faraji P, Sorori B, Khosravi M. Small dense low-density lipoprotein-lowering agents. Biol Chem. (2020) 401:1101–21. doi: 10.1515/hsz-2019-0426
19. Ai M, Otokozawa S, Asztalos BF, Ito Y, Nakajima K, White CC, et al. Small dense LDL cholesterol and coronary heart disease: results from the Framingham Offspring Study. Clin Chem. (2010) 56:967–76. doi: 10.1373/clinchem.2009.137489
20. Hoogeveen RC, Gaubatz JW, Sun W, Dodge RC, Crosby JR, Jiang J, et al. Small dense low-density lipoprotein-cholesterol concentrations predict risk for coronary heart disease: the Atherosclerosis Risk In Communities (ARIC) study. Aterioscler Thromb Vasc Biol. (2014) 34:1069–77. doi: 10.1161/ATVBAHA.114.303284
21. Ivanova EA, Myasoedova VA, Melnichenko AA, Grechko AV, Orekhov AN. Small dense low-density lipoprotein as biomarker for atherosclerotic diseases. Oxid Med Cell Longev. (2017) 2017:1273042. doi: 10.1155/2017/1273042
22. Zhang H, Cui Y, Zhao Y, Dong Y, Wang J, Duan D, et al. Association of circadian rhythm of blood pressure and cerebral small vessel disease in community-based elderly population. J Gerontol A Biol Sci Med Sci. (2019) 74:1322–30. doi: 10.1093/gerona/gly212
23. Sekimoto T, Koba S, Mori H, Sakai R, Arai T, Yokota Y, et al. Small Dense Low-Density Lipoprotein Cholesterol: A Residual Risk for Rapid Progression of Non-Culprit Coronary Lesion in Patients with Acute Coronary Syndrome. J Atheroscler Thromb. (2021) 28:1161–74. doi: 10.5551/jat.60152
24. Wang X, Wang L, Cao R, Yang X, Xiao W, Zhang Y, et al. Correlation between small and dense low-density lipoprotein cholesterol and cardiovascular events in Beijing community population. J Clin Hypertens (Greenwich). (2021) 23:345–51. doi: 10.1111/jch.14150
25. Gouw AA, van der Flier WM, Fazekas F, van Straiten EC, Pantoni L, Poggesi A, et al. LADIS Study Group. Progression of white matter hyperintensities and incidence of new lacunes over a 3-year period: the Leukoaraiosis and Disability study. Stroke. (2008) 39:1414–20. doi: 10.1161/STROKEAHA.107.498535
26. Prins ND, van Straaten EC, van Dijk EJ, Simoni M, van Schijndel RA, Vrooman HA, et al. Measuring progression of cerebral white matter lesions on MRI: visual rating and volumetrics. Neurology. (2004) 62:1533–9. doi: 10.1212/01.WNL.0000123264.40498.B6
27. Kan CN, Gyanwali B, Hilal S, Ng KP, Venketasubramanian N, Chen CL, et al. Neuropsychiatric correlates of small vessel disease progression in incident cognitive decline: independent and interactive effects. J Alzheimers Dis. (2020) 73:1053–62. doi: 10.3233/JAD-190999
28. Hu W, Li Y, Zhao Y, Dong Y, Cui Y, Sun S, et al. Telmisartan and rosuvastatin synergistically ameliorate dementia and cognitive impairment in older hypertensive patients with Apolipoprotein E genotype. Front Aging Neurosci. (2020) 12:154. doi: 10.3389/fnagi.2020.00154
29. Molinuevo JL, Gramunt N, Gispert JD, Fauria K, Esteller M, Minguillon C, et al. The ALFA project: a research platform to identify early pathophysiological features of Alzheimer's disease. Alzheimers Dement. (2016) 2:82–92. doi: 10.1016/j.trci.2016.02.003
30. Jin JL, Zhang HW, Cao YX, Liu HH, Hua Q, Li YF, et al. Association of small dense low-density lipoprotein with cardiovascular outcome in patients with coronary artery disease and diabetes: a prospective, observational cohort study. Cardiovasc Diabetol. (2020) 19:45. doi: 10.1186/s12933-020-01015-6
31. Tsai MY, Steffen BT, Guan W, McClelland RL, Warnick R, McConnell J, et al. New automated assay of small dense low-density lipoprotein cholesterol identifies risk of coronary heart disease: the multi-ethnic study of atherosclerosis. Arterioscler Thromb Vasc Biol. (2014) 34:196–201. doi: 10.1161/ATVBAHA.113.302401
32. Maeda S, Nakanishi S, Yoneda M, Awaya T, Yamane K, Hirano T, et al. Associations between small dense LDL, HDL subfractions (HDL2, HDL3) and risk of atherosclerosis in Japanese-Americans. J Atheroscler Thromb. (2012) 19:444–52. doi: 10.5551/jat.11445
33. Norata GD, Raselli S, Grigore L, Garlaschelli K, Vianello D, Bertocco S, et al. Small dense LDL and VLDL predict common carotid artery IMT and elicit an inflammatory response in peripheral blood mononuclear and endothelial cells. Atherosclerosis. (2009) 206:556–62. doi: 10.1016/j.atherosclerosis.2009.03.017
34. Qi Y, Liu J, Wang W, Wang M, Zhao F, Sun J, et al. High sdLDL cholesterol can be used to reclassify individuals with low cardiovascular risk for early intervention: findings from the Chinese multi-provincial cohort study. J Atheroscler Thromb. (2019) 27:695–710. doi: 10.5551/jat.49841
35. Hawkins KA, Emadi N, Pearlson GD, Winkler AM, Taylor B, Dulipsingh L, et al. Hyperinsulinemia and elevated systolic blood pressure independently predict white matter hyperintensities with associated cognitive decrement in the middle-aged offspring of dementia patients. Metab Brain Dis. (2017) 32:849–57. doi: 10.1007/s11011-017-9980-9
36. Dong Y, Liu X, Zhao Y, Chai Q, Zhang H, Gao Y, et al. Attenuating the variability of lipids is beneficial for the hypertension management to reduce the cardiovascular morbidity and mortality in older adults. Front Cardiovasc Med. (2021) 8:692773. doi: 10.3389/fcvm.2021.692773
37. Izumida T, Nakamura Y, Sato Y, Ishikawa S. Association among age, gender, menopausal status and small dense low-density lipoprotein cholesterol: a cross-sectional study. BMJ Open. (2021) 11:e041613. doi: 10.1136/bmjopen-2020-041613
38. Rizzo M, Berneis K. Small, dense low-density-lipoproteins and the metabolic syndrome. Diabetes Metab Res Rev. (2007) 23:14–20. doi: 10.1002/dmrr.694
39. Simpson WG. Biomarker variability and cardiovascular disease residual risk. Curr Opin Cardiol. (2019) 34:413–7. doi: 10.1097/HCO.0000000000000627
40. Urahama N, Iguchi G, Shimizu M, Fujihira K, Kobayashi S, Baba H. Smoking and small, dense low-density lipoprotein particles: cross-sectional study. Nicotine Tob Res. (2008) 10:1391–5. doi: 10.1080/14622200802238852
41. Bangalore S, Breazna A, DeMicco DA, Wun CC, Messerli F. H., N. T. T., Steering Committee, and Investigators. Visit-to-visit low-density lipoprotein cholesterol variability and risk of cardiovascular outcomes: insights from the TNT trial. J Am Coll Cardiol. (2015) 65:1539–48. doi: 10.1016/j.jacc.2015.02.017
42. Smit R. A., Trompet S, Sabayan B, le Cessie S, van der Grond J, van Buchem MA, et al. Higher visit-to-visit low-density lipoprotein cholesterol variability is associated with lower cognitive performance, lower cerebral blood flow, and greater white matter hyperintensity load in older subjects. Circulation. (2016) 134:212–21. doi: 10.1161/CIRCULATIONAHA.115.020627
43. Cholesterol Treatment Trialists' (CTT) Collaboration, Baigent C, Blackwell L, Emberson J, Holland LE, Reith C, et al. Efficacy and safety of more intensive lowering of LDL cholesterol: A meta-analysis of data from 170,000 participants in 26 randomised trials. Lancet. (2010) 376:1670–81. doi: 10.1016/S0140-6736(10)61350-5
44. Dergunov AD. Apolipoprotein E genotype as a most significant predictor of lipid response at lipid-lowering therapy: mechanistic and clinical studies. Biomed Pharmacother. (2011) 65:597–603. doi: 10.1016/j.biopha.2011.04.003
45. Lahiri DK. Apolipoprotein E as a target for developing new therapeutics for Alzheimer's disease based on studies from protein, RNA, and regulatory region of the gene. J Mol Neurosci. (2004) 23:225–33. doi: 10.1385/JMN:23:3:225
46. Mahley RW, Huang Y. Apolipoprotein E: from atherosclerosis to Alzheimer's disease and beyond. Curr Opin Lipidol. (1999) 10:207–17. doi: 10.1097/00041433-199906000-00003
47. Utter S, Tamboli IY, Walter J, Upadhaya AR, Birkenmeier G, Pietrzik CU, et al. Cerebral small vessel disease-induced apolipoprotein E leakage is associated with Alzheimer disease and the accumulation of amyloid beta-protein in perivascular astrocytes. J Neuropathol Exp Neurol. (2008) 67:842–56. doi: 10.1097/NEN.0b013e3181836a71
Keywords: lipid, variability, Apolipoprotein E, risk factor, cerebral small vessel disease
Citation: Liu W, Xu J, Song H, Zhang C, Yao Y, Zhang H, Li Y-C and Liu Z (2022) Excessive Visit-to-Visit Small and Dense Low-Density Lipoproteins Elevate Cerebral Small Vessel Disease Progression Risk in the Elderly. Front. Neurol. 13:851735. doi: 10.3389/fneur.2022.851735
Received: 28 January 2022; Accepted: 01 June 2022;
Published: 29 June 2022.
Edited by:
Tao Liu, Hainan General Hospital, ChinaReviewed by:
Cheryl Wellington, University of British Columbia, CanadaHaiqing Song, Capital Medical University, China
Cui Yi, Shandong University, China
Copyright © 2022 Liu, Xu, Song, Zhang, Yao, Zhang, Li and Liu. This is an open-access article distributed under the terms of the Creative Commons Attribution License (CC BY). The use, distribution or reproduction in other forums is permitted, provided the original author(s) and the copyright owner(s) are credited and that the original publication in this journal is cited, in accordance with accepted academic practice. No use, distribution or reproduction is permitted which does not comply with these terms.
*Correspondence: Yue-Chun Li, bGl5dWVjaHVuMTk4MEBzaW5hLmNvbQ==; Zhendong Liu, emhlbmRvbmdsaXU4NzZAMTI2LmNvbQ==