 Amanjyot Singh Sainbhi1*
 Alwyn Gomez2,3
 Logan Froese1
 Trevor Slack1
 Carleen Batson3
 Kevin Y. Stein2
 Dean M. Cordingley4,5
 Arsalan Alizadeh2
 Frederick A. Zeiler1,2,3,6,7
- 1Biomedical Engineering, Faculty of Engineering, University of Manitoba, Winnipeg, MB, Canada
- 2Section of Neurosurgery, Department of Surgery, Rady Faculty of Health Sciences, University of Manitoba, Winnipeg, MB, Canada
- 3Department of Human Anatomy and Cell Science, Rady Faculty of Health Sciences, University of Manitoba, Winnipeg, MB, Canada
- 4Applied Health Sciences Program, Faculty of Kinesiology and Recreation Management, University of Manitoba, Winnipeg, MB, Canada
- 5Pan Am Clinic Foundation, Winnipeg, MB, Canada
- 6Centre on Aging, University of Manitoba, Winnipeg, MB, Canada
- 7Division of Anaesthesia, Department of Medicine, Addenbrooke's Hospital, University of Cambridge, Cambridge, United Kingdom
The process of cerebral vessels regulating constant cerebral blood flow over a wide range of systemic arterial pressures is termed cerebral autoregulation (CA). Static and dynamic autoregulation are two types of CA measurement techniques, with the main difference between these measures relating to the time scale used. Static autoregulation looks at the long-term change in blood pressures, while dynamic autoregulation looks at the immediate change. Techniques that provide regularly updating measures are referred to as continuous, whereas intermittent techniques take a single at point in time. However, a technique being continuous or intermittent is not implied by if the technique measures autoregulation statically or dynamically. This narrative review outlines technical aspects of non-invasive and minimally-invasive modalities along with providing details on the non-invasive and minimally-invasive measurement techniques used for CA assessment. These non-invasive techniques include neuroimaging methods, transcranial Doppler, and near-infrared spectroscopy while the minimally-invasive techniques include positron emission tomography along with magnetic resonance imaging and radiography methods. Further, the advantages and limitations are discussed along with how these methods are used to assess CA. At the end, the clinical considerations regarding these various techniques are highlighted.
Introduction
The physiologic process known as cerebral autoregulation (CA) is the innate ability of the cerebral vessels to maintain a relatively constant cerebral blood flow (CBF) over a wide range of systemic arterial pressures (1, 2). Cerebrovascular reactivity (CVR) is the mechanism behind this process which occurs through the constriction and dilation of cerebral vessels to maintain a constant blood flow (1, 2). The range cerebral perfusion pressure (CPP) or mean arterial pressure (MAP) where the CA has the tendency to remain constant is between the lower and upper limits of autoregulation (LLA & ULA) on a Lassen autoregulatory curve as seen in Figure 1. When CPP/MAP goes below the LLA then the autoregulatory mechanisms are unable to adequately maintain CBF resulting in ischemia and when CPP/MAP goes above the ULA then the autoregulatory mechanisms get overwhelmed which results in hyperemia (1–3). Since CPP requires invasive ICP monitoring to derive, MAP is often used as a surrogate.
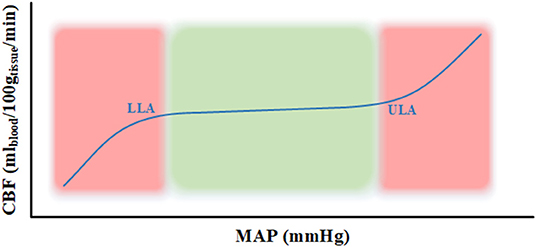
Figure 1. Lassen autoregulatory curve. The curve represents the Lassen autoregulatory curve (3) where the lower limit of autoregulation (LLA) and upper limit of autoregulation (ULA) are appropriately labeled. The part of the curve in the green area represents intact autoregulation and the part in the red area signifies impaired autoregulation. CBF, cerebral blood flow; g, grams; LLA, lower limit of autoregulation; MAP, mean arterial pressure; min, minute; ml, milliliters; mmHg, millimeter of mercury; ULA, upper limit of autoregulation.
There are two types of autoregulation measurement techniques that exists are static and dynamic autoregulation which are depicted in Figure 2. Static autoregulation evaluates CA by looking at spontaneous fluctuations in surrogate measures of pulsatile cerebral blood volume (CBV)/CBF to changes in a driving pressure when both metrics of physiologic measures have reached a steady state. Traditionally, this evaluation is performed under steady-state conditions by taking a measurement of CBV/CBF obtained at baseline CPP/MAP followed by another measurement after manipulating CPP/MAP. Dynamic autoregulation is the approach to assess CA by rapid manipulation of CPP/MAP to compare with CBF during the autoregulatory process or evaluated by using spontaneous oscillations of CPP/MAP with high temporal resolution techniques. The time scale is the main difference where static autoregulation looks at long-term change, from minutes to hours, in blood pressures while dynamic autoregulation looks at the immediate change, within seconds to minutes. Therefore, static measurements cannot address the time in which the change in CVR is achieved while dynamic measurements can, which may be relevant in certain conditions such as head injury (4, 5).
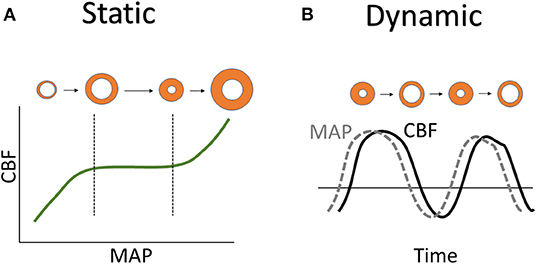
Figure 2. Static vs. dynamic autoregulation. (A) Static autoregulation is shown using Lassen autoregulatory curve with orange circles representing blood vessels state of vasodilation near the LLA and vasoconstriction near the ULA. (B) Dynamic autoregulation is shown by the MAP and CBF curves with orange circles representing the vasodilation and vasoconstriction of blood vessels with time. CBF, cerebral blood flow; LLA, lower limit of autoregulation; MAP, mean arterial pressure; ULA, upper limit of autoregulation.
It should be noted that static vs. dynamic does not mean continuous vs. intermittent since the temporality of these techniques is not within their definitions. Continuous vs. intermittent techniques each play a role in the temporal resolution aspect of CA measurement. Continuous refers to a regularly updating measure, whereas intermittent refers to a single momentary measure or a snapshot at a point in time. Currently, there are various non-/minimally-invasive modalities that are able to assess CA in an intermittent, semi-intermittent, or continuous manner.
The focus of this narrative review is to provide an overview of the technical aspects of each non-invasive and minimally-invasive measurement techniques (i.e., cerebral non-invasive techniques that may require systemic infusions, hence minimally-invasive), highlight advantages and limitations, and look at the details behind the workings of these modalities and the methods used to assess CA. From here on, these techniques are categorized as either high spatial resolution techniques which includes neuroimaging methods or high temporal resolution techniques such as Transcranial Doppler (TCD) and near-infrared spectroscopy (NIRS). Table 1 summarizes all the techniques in the same order, as discussed in this review.
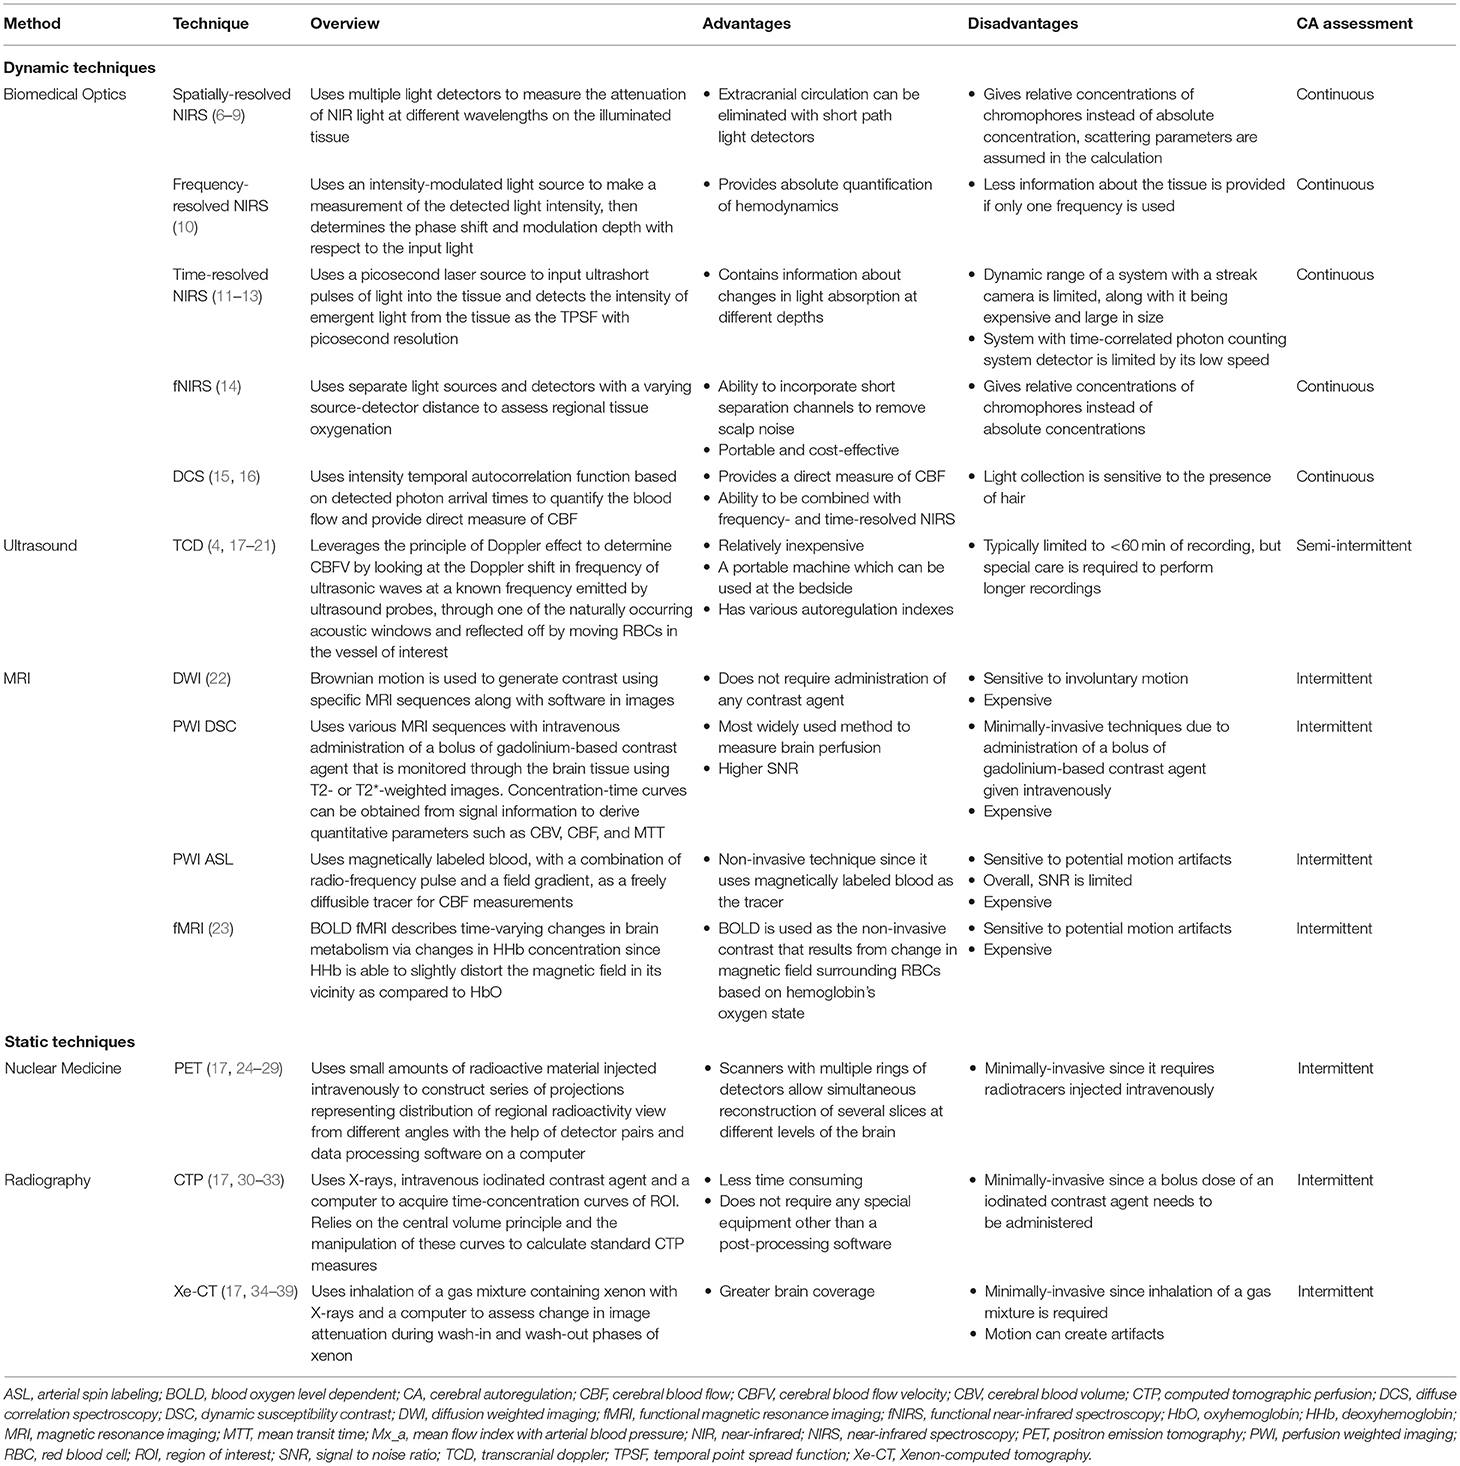
Table 1. Non-/Minimally-invasive cerebral autoregulation techniques summary.
Radiography
Imaging techniques using X-rays, or similar ionizing or non-ionizing radiation to non-invasively view inside various regions of interest (ROI) is known as radiography. Computed tomography (CT) is a modality in medical radiography that uses ionizing radiation in combination with a computer to create images of the ROI. Two techniques that evaluate CBF using radiography are computed tomographic perfusion (CTP) (40, 41) and Xenon-CT (Xe-CT) (41, 42).
Computed Tomographic Perfusion
CTP relies on the central volume principle that relates CBF, CBV, and mean transit time (MTT), as seen in Equation 1. It is conducted by first administering a bolus dose of iodinated contrast agent followed by assessing the transient increase in attenuation proportional to the amount of given contrast agent since there is a linear relationship between contrast agent concentration and attenuation (40). The contrast agent time-concentration curves are generated for arterial, venous, and parenchymal ROI. By manipulating these curves, we can calculate the CTP's standard measures which are CBF, CBV, MTT, and time to peak (TTP) (17, 40, 41, 43). CTP can be used for intermittent static autoregulatory assessment by acquiring two scans. The first scan is obtained as a baseline and then the second scan is obtained after deliberate manipulation of systemic blood pressure that targets a specific CPP/MAP, which is typically 20 mmHg above baseline (17, 30–33). An increase in CBF with an increase in CPP indicates disrupted CA whereas intact autoregulation is depicted by CBF independent of CPP values (17, 33).
Equation 1:
Xenon-CT
Compared to CTP, where CBF is estimated by changes after intravenous iodinated contrast, Xe-CT is based on CT scanning during inhalation of a gas mixture containing ~30% xenon for a total duration ranging from 3 to 6 min (17, 41, 42). By being able to assess the change in image attenuation during wash-in and wash-out phases of xenon with CT and the estimated arterial xenon levels, assumed to be equal to end-tidal levels from xenon detector, the CBF can be calculated using Equation 2 and Equation 3. These two equations are known as the modified Kety-Schmidt equations where Cb(T) is the time-dependent brain xenon concentration, λ is the brain-blood partition coefficient, K is the brain uptake flow rate constant, and Ca(t) is the time-dependent arterial xenon concentration (41–43). With Xe-CT, intermittent static autoregulation can be assessed in a similar manner as done with CTP where a baseline Xe-CT is obtained then Xe-CT is repeated after a target CPP/MAP manipulation is reached (34–39). Similarly, “intact” autoregulation is defined when there is little to no change in CBF during manipulation of CPP/MAP otherwise the autoregulation is considered “impaired.” Since studies have defined varying thresholds, it is not clear which thresholds definitively are associated with autoregulatory dysfunction and which are not (17).
Equation 2:
Equation 3:
CTP studies are less time consuming, and do not require special equipment other than a dedicated post-processing software as compared to Xe-CT studies (41). While Xe-CT has a greater brain coverage since the iodinated contrast material used in CTP has much quicker kinetics (41), Xe-CT has limitation of patient motion which can produce artifacts in the images (43). Both CTP and Xe-CT have been shown to have a good correlation between their results (41). Also, both of them are static measures of autoregulation that are measured intermittently.
Magnetic Resonance Imaging
Magnetic Resonance Imaging (MRI) is a non-invasive medical device that uses powerful magnets, usually 0.5T to 3T, to produce detailed three-dimensional images of the body by using its natural magnetic properties. Hydrogen nuclei are used for imaging purposes due to their abundance in water and fat (44).
To obtain an MRI image of the desired part of the body, it is placed inside an MRI scanner that creates a strong magnetic field using powerful magnets, causing proton's axes in the exposed tissue to align uniformly along the direction of the magnetic field, creating a magnetic vector. With the addition of energy in the form of radio waves, the magnetic vector gets temporarily deflected. The MRI image is created on a greyscale image by plotting intensity of the energy released in the form of radio wave signals by the protons returning to baseline when the radio frequency source is turned off. There are two ways, T1 and T2, that the relaxation of protons is measured. T1 relaxation is the time the magnetic vector takes to return to its resting state andT2 relaxation is measured by the time needed for an axial spin to return to its resting state. The magnetic field can be altered electronically by large gradient electric coils along with varying the applied radio frequencies to isolate different slices of the body (44). CBF can be assessed using MRI techniques such as Diffusion-Weighted Imaging (22, 45), Perfusion-Weighted Imaging (17, 43), and functional MRI (fMRI) (17). These techniques are dynamic measures of autoregulation which are measured intermittently.
Diffusion-Weighted Imaging
A method that uses differences in Brownian motion to generate contrast using specific MRI sequences along with software in images from resulting data is Diffusion-Weighted Weighted Imaging (DWI). Brownian motion is the random movement of water molecules in a medium. In the presence of obstacles, such as cell membranes, the water molecules get confined which restricts the normal free diffusion. A large percentage of the human body is composed of water and in this complex environment, water molecules experience free diffusion and restricted diffusion in extracellular and intracellular environments, respectively (46, 47). An initial validation study has shown that following thigh cuff deflation, the estimated changes in cerebral perfusion using the MRI DWI technique is at least as reliable as the classical TCD technique, which has been viewed as a standard method to assess dynamic CA (22). Also, MRI have been shown to give more consistent measures than TCD (22).
As outlined by Saeed et al. (22) dynamic CA can be assessed using the MRI DWI technique and the imaging series begins when thigh cuffs get inflated 20 mmHg above the peak systolic ABP. Rapid serial acquisition occurs using a gradient-echo echo-planar imaging sequence. After 3 min, the cuffs are rapidly deflated to introduce a transient blood pressure (BP) drop and the procedure would be completed at 4 min. By acquiring 240 multi-slice image sets over 4 min gives the minimum temporal resolution of 1 s. Then visual inspection of movement can occur by playing them in a movie loop after having the dynamic images composed into 4-dimensional sets (3 spatial dimensions and 240 time points) by using a software package designed specifically for processing MRI. The analysis occurs on the four central slices corresponding to the main anatomic areas perfused by the middle cerebral artery (MCA). On each of the four slices, the brain ROI is divided into left and right halves to produce a total of eight regions of interest. Then the change in signal intensity is extracted for each of the eight ROIs over the 240-s time series, and an average of the signal intensity for the four slices is calculated to get the mean intensity time course for the left and right sides of the brain. With the described MRI data acquisition and analysis, it has been shown that following thigh cuff release, MRI intensity changes however, to what extent this is a reliable index of dynamic CA remains to be shown (22).
Compared to the conventional DWI image, an Apparent Diffusion Coefficient (ADC) image, also known as ADC map, allows the magnitude of water diffusion to be quantified (45, 46). ADC scalars, which represents the lowest mean of three contiguous axial sections between the left and right cerebral hemispheres, have been shown to significantly correlate with blood pressure autoregulation in the posterior centrum semiovale, posterior limb of the internal capsule and globus pallidus regions of each cerebral hemisphere in neonates cooled for perinatal hypoxic-ischemic injury (45).
Perfusion-Weighted Imaging
For studying cerebral hemodynamics, Perfusion-Weighted Imaging (PWI) is an established MRI method that gives insights into the perfusion of tissues by blood. The PWI techniques use various MRI sequences with and without the administration of contrast agents to acquire signals that are used to generate perfusion maps with parameters such as CBF, CBV, and MTT with post-processing. The main techniques that come under the PWI method are Dynamic Susceptibility Contrast (DSC), and Arterial Spin Labeling (ASL) (47). With PWI, dynamic autoregulation could be assessed in a similar manner as described in the DWI section where thigh cuffs are inflated to a pressure for couple minutes before the cuffs are rapidly deflated in the last minute, introducing a transient BP drop. The acquisition of slices would be done intermittently for the dynamic autoregulation measure but the assessment of dynamic autoregulation with PWI MRI techniques has not been done.
Dynamic Susceptibility Contrast
The MRI DSC techniques are the most widely used method to measure brain perfusion but are minimally-invasive. They require the administration of a bolus of gadolinium-based contrast agent intravenously, which is monitored through the brain tissue using T2- or T2*-weighted images. From the signal information, concentration-time curves can be obtained to be able to derive important quantitative parameters such as CBV, CBF, and MTT. In general, DSC perfusion achieves a higher signal-to-noise ratio (SNR), allowing images to be at a higher temporal and spatial resolution (47, 48).
Arterial Spin Labeling
The MRI ASL technique uses magnetically labeled blood as an endogenous diffusible tracer for CBF measurements. It is a non-invasive technique since it does not use contrast agents, thus labeling is achieved by inverting the blood magnetization with a combination of radio-frequency pulse and a field gradient in the direction of blood flow (47, 48). The two main types of ASL techniques are continuous ASL and pulsed ASL. In continuous ASL technique, arterial blood water underneath the imaging slab is continuously labeled with prolonged radiofrequency pulse until a steady-state tissue magnetization is reached, whereas pulsed ASL technique is less demanding in the sense that at a single point in time, a short radiofrequency pulse labels arterial blood and it is allowed to distribute to the tissue of interest before imaging is performed. Theoretically, CBV and MTT can be obtained using ASL but these methods are not widely used. The overall SNR of ASL is limited due to sensitivity to potential motion artifacts, but it could be improved with using high-quality and high field strength scanners. Overall, the acquisition times are longer due to the limited SNR and in part, explain the lower utilization of ASL as compared to DSC (48).
Functional MRI
Blood oxygen level dependent (BOLD) functional MRI (fMRI) describes time-varying changes in brain metabolism via changes in deoxyhemoglobin (HHb) concentration. Since fMRI is based on MRI, it can incorporate various types of contrast such as T1 weighting, T2 weighting, etc. without the injection of any radioisotopes. BOLD is known as the contrast which results from a change in magnetic field surrounding the red blood cells (RBCs) based on the oxygen state of the hemoglobin. Oxygenated hemoglobin or oxyhemoglobin (HbO) is almost resistant to magnetism (diamagnetic) hence it is indistinguishable from brain tissue while HHb is more magnetic (paramagnetic) and is able to slightly distort the magnetic field in its vicinity. Hence, the variations in regional tissue oxygenation due to changes in oxygen uptake and altered blood supply caused by local brain activity can be mapped by T2* weighted MRI (47, 49). By utilizing gradient refocused echo (GRE), BOLD fMRI is able to increase T2* contrast (49). It has been proposed that resting-state fMRI, which measures spontaneous low-frequency fluctuations in BOLD signal, looks promising for assessing dynamic CA with high spatial resolution since it has not extended into this domain yet (23).
Positron Emission Tomography
Positron emission tomography (PET) is a type of nuclear medicine imaging, also known as PET imaging or PET scan, which uses small amounts of radioactive material called radiotracers to help diagnose and assess medical conditions. PET imaging requires three components: a positron-emitting isotope (radiotracer), a tomographic imaging system to detect the location along with measure quantity of radiation, and lastly, a mathematical model which is often needed to relate the physiologic process under study to the detected radiation (50, 51). The PET imaging technique is minimally-invasive due to the intravenously injected radiotracers, and since PET utilizes ionizing radiation, it is not entirely benign.
Radiotracers are radioactive molecules, or radionuclides, that do not affect the physiologic process being studied by administering them in small quantities. PET radiotracers can be separated into two broad categories: normal biologic molecules (11C, 13N, 15O) or non-biologic elements that can be attached to organic molecules as radiolabels (18F, 68Ga, 75Br). The half-life of these tracers range from a couple of minutes to a couple of hours, and they decay by positron emission (50, 51).
The second component of PET imaging is the imaging system which consists of a large number of detector pairs to localize and quantify the brain's physiologic processes by using the phenomenon of annihilation radiation. Radionuclides undergo positron emission decay where it emits a positron, a positively charged electron. This emitted positron may travel for a short distance in the tissue, usually a few millimeters depending on the isotope, losing energy before it can encounter an electron. The encounter between the positron and an electron results in annihilation of both and results in the generation of a pair of gamma photons, of equal energy, moving in approximately the opposite direction. These two photons are detected simultaneously by a pair of detectors positioned on either side from the source of annihilation, which allows localization of the radiation's point of source (50).
Using a computer, the data from the detector pairs is used to construct a series of projections that represents the distribution of regional radioactivity viewed from different angles. By combining the projections, a two-dimensional image is produced while a three-dimensional image can be produced with scanners containing multiple rings of detectors, allowing them to generate several reconstructed slices of imaged volume simultaneously where each depicts a different level of the brain (50).
Some of the cerebral physiological factors that can be measured by PET are CBF, CBV, and MTT. Most commonly, 15O-labeled water (O) is used as the intravenous tracer agent to measure CBF by obtaining the emission scans and calculating CBF maps using kinetic models that treat water as a freely diffusible tracer. The measurement of CBV is done in a similar fashion using 15O-labeled carbon monoxide (C15O) as the tracer agent (17, 50). MTT is not directly measured by PET but by the central volume theorem, MTT can be calculated as the ratio of CBV to CBF as seen in Equation 1 or its inverse, which hypothetically is the particle's mean time to pass through the cerebral circulation (50). With the CBF and CBV measurements, PET-based techniques can assess autoregulatory capacity by first obtaining the CBF maps at baseline physiology and after a change in CPP from baseline. With little or no change in CBF/CBV during CPP manipulations, autoregulation is defined as “intact” while an increase in CBF/CBV during CPP elevation is defined as “impaired” autoregulation (17, 24–29). This is a measure of static autoregulation conducted intermittently. PET can be combined with CT to produce special views, and an emerging technology of interest is the combination of PET and MRI techniques.
Transcranial Doppler
Transcranial Doppler (TCD) is a type of ultrasonography that measures CBF velocity (CBFV) in real-time by using the principle of the Doppler effect (5). First observed by Christian Andreas Doppler in the mid-1800's, the Doppler effect is the phenomenon where a soundwave, at a certain frequency, strikes an object in motion and is reflected with a different frequency (52). The echo will be of a higher frequency if the object is moving toward the source of the soundwaves, and the echo will be of a lower frequency if the object is moving away from the source. The Doppler shift is known as the difference of the emitted frequency vs. the reflected soundwave and it is directly proportional to the relative speed of the moving object to the source (18).
The principle of the Doppler effect has been leveraged to determine CBFV by having the TCD ultrasound probes emit an ultrasonic wave at a known frequency through the skull which gets reflected off RBCs in the vessel of interest, producing an echo at a different frequency (5, 18). This Doppler shift in frequency allows for the calculation of the CBFV but not proper CBF although both CBF and CBFV have a linear relationship over physiologic ranges as long as the vessel diameter is constant (18). Due to the cranial cavity being fully encased by the cranial bones in an adult, the ultrasonic signal gets heavily attenuated by the bone tissue resulting in only 6% of the ultrasonic signal reaching the brain (52). To properly insonate the cerebral arteries, there exists naturally occurring thinner areas of bone known as acoustic windows that allow for the best transmission of the TCD signal. The four naturally occurring acoustic windows are transtemporal, transorbital, transforaminal or suboccipital, and submandibular windows. The transtemporal window can be used to study the anterior cerebral arteries, middle cerebral arteries, and posterior cerebral arteries. The transorbital window can be used to examine the ophthalmic artery and cavernous portion of the intracranial carotid artery (ICA). The transforaminal window, also known as the suboccipital window, allows the examination of the basilar artery and vertebral arteries. Finally, the suboccipital window can be used to study the distal ICA (5, 52).
We can get a better understanding of how the ultrasound technology, used in TCD, is based on the Doppler effect by looking at Equation 4, which gives the calculation of the reflector velocity, v, of the moving target. A TCD probe functions by emitting an ultrasonic wave at a known frequency, fo, moving through the tissue at a speed, c, and then receiving the echo. The echo is produced at a different frequency, fe, resulting from the wave reflected off the moving RBCs in the vessel of interest. The Doppler shift, fd, is determined by fd = fe − fo. The velocity is corrected by the Doppler angle or the angle of insonance, θ, which should be <30° to have the maximum degree of error <15% (5, 18, 52). The parameters that can be derived from TCD include flow velocity (FV) and pulsatile index where the FV can be distinctly described as peak systolic flow velocity (FVs), end-diastolic velocity (FVd) and mean velocity (FVm) (18). CA can be assessed using TCD but due to the practical limit of TCD monitoring of less than an hour restricts the TCD based methods to intermittent and semi-intermittent. The TCD-based intermittent methods are such as rate of regulation (RoR), autoregulatory index (ARI), transient hyperemic response testing (THRT) and orthostatic hypotension test (OHT) while the semi-intermittent techniques are mean flow index, systolic flow index and diastolic flow index (17, 18).
Equation 4:
RoR can be calculated from the data obtained by the thigh cuff deflation technique (TCDT) that was first described in 1989. By inflating bilateral thigh cuffs for 2 min and rapidly deflating them, it induces a step decrease in ABP. The time interval is measured until the FV returns to baseline and RoR is calculated by Equation 5, where normal RoR is characterized as 0.2/s (53). The ARI method is built on RoR using a second-order differential model of CA constructed with three physical properties which are the time constant, the damping factor and the autoregulatory gain. The strength of autoregulation is graded on an ordinal scale from zero to nine, where zero corresponds to the total loss of autoregulation and nine corresponds to the hyperactive regulatory response. During the change in MAP, the TCD based FV changes are normalized and compared to model-generated responses corresponding to the 10 grades and the best fit is deemed the ARI. ARI of 4-7 is defined as normal CA, ≤3 corresponds to loss of autoregulation and ≥8 corresponds to hyperactive regulatory response (4). THRT is another method of assessing CA by the compression of the carotid artery in the neck while the ipsilateral MCA is insonated. The carotid artery is released after 3 s of stable reduction in FV, where an adequate reduction is 30–50% in FV and the changes in MCA FV are measured with TCD. CA is suggested to be intact if the overshoot of FV is at least 10% of baseline FVs while overshoot of <10% is suggested to represent impaired CA (19). Another way to reduce CPP is by the rapid change in head position in the Orthostatic hypotension test (OHT). With rapid elevation of a patient's head position under <3 s, a sudden drop in CBFV can be evaluated by the TCD. If the reduction of CBFV as compared to baseline is between 10 and 15% then it is considered normal CA, while a drop in CBFV of >20% indicates disrupted autoregulation (20, 21). Most significant limitation of the intermittent methods is that an eternal perturbation is required to the subject's physiologic parameters to assess CA (18).
Equation 5:
Looking at assessment of more continuous CA using slow wave changes in MAP, these methods work with having a correlation coefficient between some surrogate of CBF and some measure of driving pressure, regularly updated, over an advancing set time window. These correlation coefficients, or indices, have three different variations MAP as a surrogate for driving pressure. These variations are mean flow index with arterial blood pressure (Mx_a), systolic flow index with arterial blood pressure (Sx_a), and diastolic flow index with arterial blood pressure (Dx_a) where FVm, FVs, and FVd are respectively used as their CBF surrogates. All these indices have driving pressure and FV processed with a 10-s moving average filter, and the correlation coefficient is calculated using a 5-min window, updated every 10 s or every minute depending on the recording time length. The values of the index are normalized to values between −1 and +1 where more positive values suggest more dysfunctional CA. These three indices are different than their counterparts, Mx, Sx, and Dx, that use CPP as a surrogate for driving pressure and require the use of invasive intracranial monitoring. Preliminary studies seem to indicate that Mx_a and Sx_a can be used to estimate ICP based indices of CVR such as pressure reactivity index (PRx), although Dx_a showed no significant predictive value (18). Although, early TCD-based works assessed static autoregulation, currently it is commonly used to assess dynamic autoregulation conducted semi-intermittently, since longer recording periods require very special care.
Near-Infrared Spectroscopy
A non-invasive modality based on near-infrared (NIR) light that is gaining traction to assess CA is the near-infrared spectroscopy (NIRS). NIR light is a region of the infrared spectrum where the wavelengths of light ranges from 650 to 950 nm and this region has the lowest amount of light absorbed by water molecules and hemoglobin. Below the range, visible light is strongly absorbed by hemoglobin and above the range, the absorption by water molecules increases significantly (54). To observe blood and tissue oxygenation using NIR light, Modified Beer-Lambert Law (MBLL) is used which describes absorption of light in a multiple scattering medium, such as tissue, where light takes a longer path (11). MBLL is given by Equation 6 where ε is the molar extinction coefficient that gives the absorption of light in the medium, C is the concentration of the medium, d is the optode spacing, DPF is the differential pathlength factor quantifying the additional pathlength attributed to scattering, and G describes the tissue's scattering coefficient with the optode geometry (11, 55).
Equation 6:
NIRS devices contain optical probes that are placed on the scalp to obtain measurements of CBF. The probes contain a combination of transmitter and receivers where the transmitter is used to transmit NIR light into the scalp and the receivers detect the NIR light after it has gone through scattering and absorption. Three main naturally occurring chromophores, or absorbers, of interest are HbO, HHb, and Cytochrome C Oxidase (CCO). The measurements for each chromophore are performed by calculating the change in attenuation with different wavelengths using MBLL.
There are different types of NIRS available that make use of different technologies to provide continuous bedside cerebral physiologic measurements. All of them measure dynamic autoregulation by rapidly manipulating MAP by techniques such as thigh cuff deflation of sit-to-stand and the NIRS data is recorded continuously. We take a look at continuous wave, spatially-resolved, frequency-resolved, time-resolved, diffuse correlation spectroscopy, and functional near-infrared spectroscopy.
Spatially-Resolved NIRS
The spatially-resolved NIRS contains multiple light detectors in a probe that are at different distances from the constant intensity NIR light transmitter. The use of multiple light detectors is able to eliminate the extracranial circulation from the scalp, recorded by short path light detector, from the longer path light detectors which penetrate deeper into the brain tissue. It is able to derive the relative concentrations of HbO and HHb along with estimating mean tissue hemoglobin saturation by measuring the attenuation of NIR light at different wavelengths using the multiple light detectors on the illuminated tissue (56).
Some spatially-resolved NIRS, like NIRO devices, can derive tissue oxygenation index (TOI) and total hemoglobin index (THI) along with relative concentrations of HbO, HHb, and CCO (6). The ratio of HbO to the total tissue hemoglobin (HbT) gives TOI (7) while THI is a surrogate for HbT of the measured tissue and is expressed as arbitrary units since the exact total volume of tissue is not known (6). Like TOI, regional cerebral oxygen saturation (rSO2) is another measure for cerebral tissue oxygenation reported by INVOS devices. However, it is still unclear if THI and rSO2 can be used interchangeably since the proprietary methodologies and assumptions in the calculation of cerebral tissue oxygenation varies between manufacturers (8).
PRx has been validated to accurately detect LLA in animal models (57) and is considered a “gold standard” for continuous bedside assessment of CVR (29) but it requires invasive ICP measure. NIRS based indices of CVR have been developed that substitute NIRS based metrics in place of ICP. These indices are total hemoglobin index (THx), tissue oxygen index (TOx), and cerebral oximetry index (COx) that use the NIRS based metrics THI, TOI, and rSO2, respectively. These NIRS based indices have shown to correlate well with PRx and TCD based indices as found by Smielewski and colleagues in a mixed cohort of 150 patients where 40 patients had severe TBI, 27 patients had subarachnoid hemorrhage (SAH), 60 patients were undergoing cardiopulmonary bypass, and 23 patients had sepsis (9).
Frequency-Resolved NIRS
The frequency-resolved NIRS contains either LED or laser diode as the light source which is intensity-modulated at radio frequencies to provide information on the scattering properties of the medium. These measurements from the detected light intensity of the output light along with the phase shift and modulation depth, with respect to input light, can provide absolute quantification of hemodynamics (58). There exists a linear relationship between frequency and phase shift for the light transmitted through tissues up to 200 MHz but this relationship is not present at higher frequencies (59). Regional cerebral tissue oxygenation (cStO2) can be derived from frequency-resolved NIRS such as INVOS 5100c and FORE-SIGHT. It is challenging to define normal ranges of cStO2 due to the difference in the absolute values between commercial devices (10). These frequency-resolved systems are also referred to as frequency domain, intensity-modulated or phase-resolved systems.
Time-Resolved NIRS
The time-resolved NIRS contains information on the different depths of light absorption since photons from deep tissue paths will arrive later than photons from superficial paths (60). These systems are equipped with a picosecond laser source that generates ultrashort pulses of light into the tissue for detecting temporal point spread function (TPSF) with picosecond resolution, which is the measurement of the intensity of the emergent light from the tissue (11, 12). The ultrafast detectors used in these systems are streak camera giving high temporal resolution or time-correlated photon counting system that provides a wide dynamic range while using cheaper components. Along with detecting TPSF, time-resolved NIRS such as TRS-10 can provide measurements of oxygen saturation (SO2) (13). These time-resolved systems are also referred to as time-domain or time-of-flight systems.
Functional Near-Infrared Spectroscopy
Functional near-infrared spectroscopy (fNIRS) is another non-invasive bedside tool to continuously assess regional tissue oxygenation. Unlike fMRI, fNIRS measures both hemoglobin, HbO and HHb, separately along with being portable and cost-effective. Typically, fNIRS systems use separate light sources and detectors with a source-detector distance ranging from 1.5 to 3.5 cm. In recent years, short separation channels source-detector separation of <1 cm has been incorporated to remove the scalp noise in studies. Also, there has been development of multichannel fNIRS, which increases the spatial resolution of this technology (14).
Diffuse Correlation Spectroscopy
Diffuse Correlation Spectroscopy (DCS) is an emerging optical technique that can provide a direct measure of CBF by quantifying the blood flow using temporal fluctuations of the reflected NIR light (61). These fluctuations are caused by moving RBCs scattering the light that can be quantified by intensity temporal autocorrelation function based on the detected photon arrival times (61, 62). Information about the metabolic rate of oxygen can be determined by pairing DCS with any NIRS system. It has been demonstrated that by combining DCS with frequency-resolved NIRS, we can quantify cerebral tissue oxygen metabolic rate (CMRO2) from the combination of oximetry and flow measures (15). DCS can also be combined with time-resolved NIRS to measure absolute CMRO2 and it has been verified against cerebral venous blood sample derived values of CMRO2 (16). Current limitation of DCS is that the light collection is sensitive to the presence of hair but it can be tackled by the use of many fibers in a single spot (61).
Clinical Considerations
There are numerous considerations that the bedside clinician needs to consider when determining the appropriate modality for monitoring CA. The first is patient safety, as each modality has varying safety profiles. CT and PET-based modalities come with the small, but not insignificant, risk of ionizing radiation, which may lead to DNA damage and ultimately malignancy (63, 64). CTP additionally carries an additional risk as it requires iodinated contrast agents which are nephrotoxic and are a potential anaphylactogenic (65). While MRI-based methods are free from ionizing radiation, some modalities do require the administration of nephrotoxic contrast agents (66). Additionally, the requirement of large magnetic fields in MR imaging makes it unsafe for those with certain implanted medical devices such as pacemakers (67). In the clinical setting, given the lack of availability of portable CT and MRI scanners, these modalities necessitate the transportation of the patient to the machine. This may be tolerated in most but is not without risk in critically ill patients (68).
A number of modalities require the measurement of ICP or its derivative CPP. These methods require the invasive placement of a probe into the cranium, which carries the risk of brain injury through hemorrhage or infection (69). Typically, however, these indices are implemented in situations where ICP monitoring is already indicated, such as moderate and severe traumatic brain injury (TBI), and thus do not present additional risk (70).
Beyond the various surrogates for CBF, modalities that require manipulation of ABP or cerebral hemodynamics might also not be well tolerated by various groups of medically ill patients. The only modalities that entirely avoid risk to the patient are those continuous indices based on TCD or NIRS and ABP for which entirely non-invasive methodologies have been described (71–73).
The second key clinical consideration is the required spatial and temporal resolution required for the monitoring of CA. While imaging-based modalities provide great spatial resolution, they are limited to essentially capturing snapshots of cerebral autoregulatory function. This may be appropriate for the long-term outpatient monitoring of CA recovery following brain injury but does not provide the temporal resolution to potentially guide management in the acute care setting.
Contemporary utilization of CA monitoring in the clinical setting typically relies on continuous or semi-continuous modalities. These modalities provide limited spatial resolution but have a temporal resolution that is much more conducive to informing acute bedside care. They have become more commonly used, in recent years, in the setting of SAH and moderate and severe TBI as prognostic tools (74, 75). Beyond prognostication, these continuous modalities have begun to play a role in the management of critically ill patients. One such example of an invasive modality is the utilization of PRx to derive personalized CPP goals that maximize CA function in critically ill TBI patients. These targets are not only specific to the patient but are updated in real-time, thereby leveraging the high temporal resolution of continuous and semi-continuous modalities (76). Future work may improve the spatial resolution of the continuous modalities by measuring hemispheric CA using TCD or NIRS. Beyond this, the development of full scalp NIRS arrays, like those seen in fNIRS, may bring the spatial resolution of these continuous modulates inline with image-based intermittent methods (77).
A final consideration is the role CA monitoring plays in clinical research. The quantity and quality of data that can be extracted from each modality is important to understand when developing a clinical research project. As previously discussed, the radiographic and PET techniques only assess static autoregulation intermittently. This is ideal for studies that may want to elucidated regional differences in CA function at the steady state in both pathologic and healthy subjects. Given that they often required deliberate modulation of ABP they often have favorable signal-to-noise profiles reducing the number of trials required to identify a true signal. Modalities with high temporal resolution, such as some TCD-based techniques, enable the evaluation of dynamic CA. This is at the expense of spatial resolution as they are often only able to determine hemispheric differences in CA. These modalities can elucidate the rate at which CA acts in a dynamic fashion. Like radiographic/PET modalities, these measures often require induced perturbations in ABP and therefore have good signal-to-noise profiles. Lastly, semi-continuous and continuous modalities, often based on TCD or NIRS measures, allow for the evaluation of the evolution of CA function over long periods of time. As these methods rely on natural fluctuations in ABP they are noisy signal that require long periods of recording. These methods are ideal for studies that hope to examine the evolution of CA over time such as in the setting of aneurysmal SAH and moderate/severe TBI.
Ultimately, each modality has its own strengths and weaknesses. In order to select the most appropriate modality the clinician, or clinician-scientist, must have a thorough understanding of this. An informed selection of modality will improve patient care and enhance further research in this field.
Author Contributions
AS and AG: undertook review and screening of the literature as well as aided in preparing the manuscript. LF, TS, CB, KS, DC, and AA: aided in preparation of the manuscript. FZ: responsible for conceptual development of this article, development of search strategy, undertook screening of the literature, and aided in preparation of the manuscript. All authors contributed to the article and approved the submitted version.
Funding
This study was supported by the Manitoba Public Insurance (MPI) Neuroscience/TBI Research Endowment, the Health Sciences Centre Foundation Winnipeg, and the University of Manitoba Department of Surgery GFT Research Grant program. FZ receives research support from the Manitoba Public Insurance (MPI) Neuroscience/TBI Research Endowment, the Health Sciences Centre Foundation Winnipeg, the United States National Institutes of Health (NIH) through the National Institute of Neurological Disorders and Stroke (NINDS)(Grant #: R03NS114335-01), the Canada Foundation for Innovation (CFI)(Project #: 38583), Research Manitoba (Grant #: 3906), the University of Manitoba VPRI Research Investment Fund (RIF), the University of Manitoba Centre on Aging, and the University of Manitoba Rudy Falk Clinician-Scientist Professorship. AG was supported through the University of Manitoba Clinician Investigator Program, the University of Manitoba Dean's Fellowship, the Manitoba Medical Services Foundation Research and Education Fellowship, and the R. Samuel McLaughlin Research Fellowship. AS was supported through the University of Manitoba, Department of Surgery GFT Research Grant, and the UMGSA Scholarship at the University of Manitoba. LF was supported through the University of Manitoba-Department of Surgery GFT Research Grant, the University of Manitoba–University Research Grant Program (URGP), and the Biomedical Engineering Fellowship Grant at the University of Manitoba. TS was supported through the University of Manitoba-Department of Surgery GFT Research Grant.
Conflict of Interest
DC is affiliated with the Pan Am Clinic Foundation which receives general education and research support from ConMed Linvatec, Ossur, Zimmer Biomet, and Arthrex.
The remaining authors declare that the research was conducted in the absence of any commercial or financial relationships that could be construed as a potential conflict of interest.
Publisher's Note
All claims expressed in this article are solely those of the authors and do not necessarily represent those of their affiliated organizations, or those of the publisher, the editors and the reviewers. Any product that may be evaluated in this article, or claim that may be made by its manufacturer, is not guaranteed or endorsed by the publisher.
References
1. Fog M. The relationship between the blood pressure and the tonic regulation of the pial arteries. J Neurol Psychiatry. (1938) 1:187–97. doi: 10.1136/jnnp.1.3.187
2. Lassen NA. Cerebral blood flow and oxygen consumption in man. Physiol Rev. (1959) 39:183–238. doi: 10.1152/physrev.1959.39.2.183
3. Lassen NA. Control of cerebral circulation in health and disease. Circ Res. (1974) 34:749–60. doi: 10.1161/01.RES.34.6.749
4. Tiecks FP, Lam AM, Aaslid R, Newell DW. Comparison of static and dynamic cerebral autoregulation measurements. Stroke. (1995) 26:1014–9. doi: 10.1161/01.STR.26.6.1014
5. Purkayastha S, Sorond F. Transcranial doppler ultrasound: technique and application. Semin Neurol. (2012) 32:411–20. doi: 10.1055/s-0032-1331812
6. Davies DJ, Su Z, Clancy MT, Lucas SJE, Dehghani H, Logan A, et al. Near-infrared spectroscopy in the monitoring of adult traumatic brain injury: a review. J Neurotrauma. (2015) 32:933–41. doi: 10.1089/neu.2014.3748
7. Suzuki S, Takasaki S, Ozaki T, Kobayashi Y. A Tissue oxygenation monitor using NIR spatially resolved spectroscopy. In: Optical Tomography and Spectroscopy of Tissue III. San Jose, CA: International Society for Optics and Photonics (1999). p. 582–92. doi: 10.1117/12.356862
8. Thavasothy M, Broadhead M, Elwell C, Peters M, Smith M. A comparison of cerebral oxygenation as measured by the NIRO 300 and the INVOS 5100 Near-infrared spectrophotometers. Anaesthesia. (2002) 57:999–1006. doi: 10.1046/j.1365-2044.2002.02826.x
9. Smielewski P, Czosnyka M, Zweifel C, Brady K, Hogue C, Steiner L, et al. Multicentre experience of using ICM+ for investigations of cerebrovascular dynamics with near-infrared spectroscopy. Crit Care. (2010) 14:P348. doi: 10.1186/cc8580
10. Hessel TW, Hyttel-Sorensen S, Greisen G. Cerebral oxygenation after birth – a comparison of INVOS® and FORE-SIGHTTM near-infrared spectroscopy oximeters. Acta Paediatr. (2014) 103:488–93. doi: 10.1111/apa.12567
11. Delpy DT, Cope M, Zee Pvd, Arridge S, Wray S, Wyatt J. Estimation of optical pathlength through tissue from direct time of flight measurement. Phys Med Biol. (1988) 33:1433. doi: 10.1088/0031-9155/33/12/008
12. Chance B, Leigh JS, Miyake H, Smith DS, Nioka S, Greenfeld R, et al. Comparison of time-resolved and -unresolved measurements of deoxyhemoglobin in brain. Proc Natl Acad Sci U S A. (1988) 85:4971–5. doi: 10.1073/pnas.85.14.4971
13. Oda M, Yamashita Y, Nakano T, Suzuki A, Shimizu K, Hirano I, et al. Near-infrared time-resolved spectroscopy system for tissue oxygenation monitor. In: Optical Tomography and Spectroscopy of Tissue III. San Jose, CA: International Society for Optics and Photonics (1999). p. 611–7. doi: 10.1117/12.356809
14. Chen W-L, Wagner J, Heugel N, Sugar J, Lee Y-W, Conant L, et al. Functional near-infrared spectroscopy and its clinical application in the field of neuroscience: advances and future directions. Front Neurosci. (2020) 14:724. doi: 10.3389/fnins.2020.00724
15. Carp SA, Farzam P, Redes N, Hueber DM, Franceschini MA. Combined multi-distance frequency domain and diffuse correlation spectroscopy system with simultaneous data acquisition and real-time analysis. Biomed Opt Express. (2017) 8:3993–4006. doi: 10.1364/BOE.8.003993
16. Verdecchia K, Diop M, Lee T-Y, Lawrence KS. Quantifying the cerebral metabolic rate of oxygen by combining diffuse correlation spectroscopy and time-resolved near-infrared spectroscopy. JBO. (2013) 18:027007. doi: 10.1117/1.JBO.18.2.027007
17. Zeiler FA, Donnelly J, Calviello L, Menon DK, Smielewski P, Czosnyka M. Pressure autoregulation measurement techniques in adult traumatic brain injury, part I: a scoping review of intermittent/semi-intermittent methods. J Neurotrauma. (2017) 34:3207–23. doi: 10.1089/neu.2017.5085
18. Gomez A, Batson C, Froese L, Sainbhi AS, Zeiler FA. Utility of transcranial doppler in moderate and severe traumatic brain injury: a narrative review of cerebral physiologic metrics. J Neurotrauma. (2021) 38:2206–20. doi: 10.1089/neu.2020.7523
19. Giller CA. A bedside test for cerebral autoregulation using transcranial Doppler ultrasound. Acta Neurochir. (1991) 108:7–14. doi: 10.1007/BF01407660
20. Steinmeier R, Hofmann RP, Bauhuf C, Hübner U, Fahlbusch R. Continuous cerebral autoregulation monitoring by cross-correlation analysis. J Neurotrauma. (2002) 19:1127–38. doi: 10.1089/08977150260337949
21. Riberholt CG, Olesen ND, Thing M, Juhl CB, Mehlsen J, Petersen TH. Impaired cerebral autoregulation during head up tilt in patients with severe brain injury. PLoS ONE. (2016) 11:e0154831. doi: 10.1371/journal.pone.0154831
22. Saeed NP, Horsfield MA, Panerai RB, Mistri AK, Robinson TG. Measurement of cerebral blood flow responses to the thigh cuff maneuver: a comparison of TCD with a novel MRI method. J Cereb Blood Flow Metab. (2011) 31:1302–10. doi: 10.1038/jcbfm.2010.225
23. Whittaker JR, Driver ID, Venzi M, Bright MG, Murphy K. Cerebral autoregulation evidenced by synchronized low frequency oscillations in blood pressure and resting-state fMRI. Front Neurosci. (2019) 13:433. doi: 10.3389/fnins.2019.00433
24. Coles JP, Steiner LA, Johnston AJ, Fryer TD, Coleman MR, Smieleweski P, et al. Does induced hypertension reduce cerebral ischaemia within the traumatized human brain? Brain. (2004) 127:2479–90. doi: 10.1093/brain/awh268
25. Czosnyka M, Timofeev I, Smielewski P, Lavinio A, Hutchinson P, Kirkpatrick P, et al. Pressure and flow regulation within the brain – facts, myths and missing links. J Cereb Blood Flow Metab. (2007) 27:BO01–09. doi: 10.1038/jcbfm.2007.100
26. Steiner L, Coles J, Czosnyka M, Minhas P, Fryer T, Aigbirhio F, et al. Cerebrovascular pressure reactivity is related to global cerebral oxygen metabolism after head injury. J Neurol Neurosurg Psychiatry. (2003) 74:765–70. doi: 10.1136/jnnp.74.6.765
27. Steiner LA, Coles JP, Johnston AJ, Chatfield DA, Smielewski P, Fryer TD, et al. Assessment of cerebrovascular autoregulation in head-injured patients. Stroke. (2003) 34:2404–9. doi: 10.1161/01.STR.0000089014.59668.04
28. Steiner LA, Coles JP, Johnston AJ, Czosnyka M, Fryer TD, Smielewski P, et al. Responses of posttraumatic pericontusional cerebral blood flow and blood volume to an Increase in cerebral perfusion pressure. J Cereb Blood Flow Metab. (2003) 23:1371–7. doi: 10.1097/01.WCB.0000090861.67713.10
29. Zweifel C, Lavinio A, Steiner LA, Radolovich D, Smielewski P, Timofeev I, et al. Continuous monitoring of cerebrovascular pressure reactivity in patients with head injury. Neurosurg Focus. (2008) 25:E2. doi: 10.3171/FOC.2008.25.10.E2
30. Peterson E, Chesnut RM. Static autoregulation is intact in majority of patients with severe traumatic brain injury. J Trauma Acute Care Surg. (2009) 67:944–9. doi: 10.1097/TA.0b013e3181ae6e6d
31. Peterson EC, Tozer K, Cohen W, Lam AM, Chesnut RM. 150 rethinking autoregulation in traumatic brain injury: a majority of patients with disruptive dynamic autoregulation do not respond to an elevated cerebral perfusion pressure. Neurosurgery. (2012) 71:E560. doi: 10.1227/01.neu.0000417741.24547.1c
32. Wintermark M, Chiolero R, Van Melle G, Revelly JP, Porchet F, Regli L, et al. Cerebral vascular autoregulation assessed by perfusion-CT in severe head trauma patients. J Neuroradiol. (2006) 33:27–37. doi: 10.1016/S0150-9861(06)77225-X
33. Wintermark M, Chioléro R, van Melle G, Revelly JP, Porchet F, Regli L, et al. Relationship between brain perfusion computed tomography variables and cerebral perfusion pressure in severe head trauma patients*. Crit Care Med. (2004) 32:1579–87. doi: 10.1097/01.CCM.0000130171.08842.72
34. Bouma GJ, Muizelaar JP, Bandoh K, Marmarou A. Blood pressure and intracranial pressure-volume dynamics in severe head injury: relationship with cerebral blood flow. J Neurosurg. (1992) 77:15–9. doi: 10.3171/jns.1992.77.1.0015
35. Chieregato A, Fainardi E, Tanfani A, Sabia G, Martino C, Pascarella R, et al. Induced acute arterial hypertension and regional cerebral flow in intracontusional low density area. In: Kuroiwa T, Baethmann A, Czernicki Z, Hoff JT, Ito U, Katayama Y, et al., editors. Brain Edema XII. Acta Neurochirurgica Supplements. Vienna: Springer (2003). p. 361–5. doi: 10.1007/978-3-7091-0651-8_77
36. Chieregato A, Tanfani A, Compagnone C, Turrini C, Sarpieri F, Ravaldini M, et al. Global cerebral blood flow and CPP after severe head injury: a xenon-CT study. Intensive Care Med. (2007) 33:856–62. doi: 10.1007/s00134-007-0604-4
37. Cold GE, Jensen FT. Cerebral Autoregulation in unconscious patients with brain injury. Acta Anaesthesiol Scand. (1978) 22:270–80. doi: 10.1111/j.1399-6576.1978.tb01301.x
38. Mascia L, Andrews PJD, McKeating EG, Souter MJ, Merrick MV, Piper IR. Cerebral blood flow and metabolism in severe brain injury: the role of pressure autoregulation during cerebral perfusion pressure management. Intensive Care Med. (2000) 26:202–5. doi: 10.1007/s001340050046
39. Ng SCP, Poon WS, Chan MTV, Lam JMK, Lam WWM. Is transcranial doppler ultrasonography (TCD) good enough in determining CO2 reactivity and pressure autoregulation in head-injured patients? In: Czosnyka M, Pickard JD, Kirkpatrick PJ, Smielewski P, Hutchinson P, editors. Intracranial Pressure and Brain Biochemical Monitoring. Acta Neurochirurgica Supplements. Vienna: Springer (2002). p. 125–7. doi: 10.1007/978-3-7091-6738-0_32
40. Hoeffner EG, Case I, Jain R, Gujar SK, Shah GV, Deveikis JP, et al. Cerebral perfusion CT: technique and clinical applications. Radiology. (2004) 231:632–44. doi: 10.1148/radiol.2313021488
41. Wintermark M, Thiran J-P, Maeder P, Schnyder P, Meuli R. Simultaneous Measurement of regional cerebral blood flow by perfusion CT and stable Xenon CT: a validation study. AJNR Am J Neuroradiol. (2001) 22:905–14.
42. Yonas H, Pindzola RR, Johnson DW. Xenon/computed tomography cerebral blood flow and its use in clinical management. Neurosurg Clin N Am. (1996) 7:605–16. doi: 10.1016/S1042-3680(18)30349-8
43. Fantini S, Sassaroli A, Tgavalekos KT, Kornbluth J. Cerebral blood flow and autoregulation: current measurement techniques and prospects for noninvasive optical methods. Neurophotonics. (2016) 3:031411. doi: 10.1117/1.NPh.3.3.031411
45. Tekes A, Poretti A, Scheurkogel MM, Huisman TAGM, Howlett JA, Alqahtani E, et al. Apparent diffusion coefficient scalars correlate with near-infrared spectroscopy markers of cerebrovascular autoregulation in neonates cooled for perinatal hypoxic-ischemic injury. Am J Neuroradiol. (2015) 36:188–93. doi: 10.3174/ajnr.A4083
46. Baliyan V, Das CJ, Sharma R, Gupta AK. Diffusion weighted imaging: technique and applications. World J Radiol. (2016) 8:785–98. doi: 10.4329/wjr.v8.i9.785
47. Holdsworth SJ, Bammer R. Magnetic resonance imaging techniques: fMRI, DWI, and PWI. Semin Neurol. (2008) 28:395–406. doi: 10.1055/s-0028-1083697
48. Essig M, Shiroishi MS, Nguyen TB, Saake M, Provenzale JM, Enterline D, et al. Perfusion MRI: the five most frequently asked technical questions. AJR Am J Roentgenol. (2013) 200:24–34. doi: 10.2214/AJR.12.9543
49. Glover GH. Overview of functional magnetic resonance imaging. Neurosurg Clin N Am. (2011) 22:133–9. doi: 10.1016/j.nec.2010.11.001
50. Derdeyn CP. Positron emission tomography imaging of cerebral ischemia. PET Clin. (2007) 2:35–44. doi: 10.1016/j.cpet.2007.09.004
51. Powers WJ, Raichle ME. Positron emission tomography and its application to the study of cerebrovascular disease in man. Stroke. (1985) 16:361–76. doi: 10.1161/01.STR.16.3.361
52. White H, Venkatesh B. Applications of transcranial Doppler in the ICU: a review. Intensive Care Med. (2006) 32:981–94. doi: 10.1007/s00134-006-0173-y
53. Aaslid R, Lindegaard KF, Sorteberg W, Nornes H. Cerebral autoregulation dynamics in humans. Stroke. (1989) 20:45–52. doi: 10.1161/01.STR.20.1.45
54. Jöbsis FF. Noninvasive, infrared monitoring of cerebral and myocardial oxygen sufficiency and circulatory parameters. Science. (1977) 198:1264–7. doi: 10.1126/science.929199
55. Bakker A, Smith B, Ainslie P, Smith K. Near-infrared spectroscopy. In: Applied Aspects of Ultrasonography in Humans. IntechOpen (2012). p. 65–88. doi: 10.5772/32493
56. Matcher SJ, Kirkpatrick PJ, Nahid K, Cope M, Delpy DT. Absolute quantification methods in tissue near-infrared spectroscopy. In: Optical Tomography, Photon Migration, and Spectroscopy of Tissue and Model Media: Theory, Human Studies, and Instrumentation. San Jose, CA: International Society for Optics and Photonics (1995). p. 486–95. doi: 10.1117/12.209997
57. Lee JK, Kibler KK, Benni PB, Easley RB, Czosnyka, Smielewski P, et al. Cerebrovascular reactivity measured by near-infrared spectroscopy. Stroke. (2009) 40:1820–6. doi: 10.1161/STROKEAHA.108.536094
58. Lakowicz JR, Berndt K. Frequency-domain measurements of photon migration in tissues. Chem Phys Lett. (1990) 166:246–52. doi: 10.1016/0009-2614(90)80024-8
59. Arridge SR, Cope M, Delpy DT. The theoretical basis for the determination of optical pathlengths in tissue: temporal and frequency analysis. Phys Med Biol. (1992) 37:1531. doi: 10.1088/0031-9155/37/7/005
60. Weigl W, Milej D, Janusek D, Wojtkiewicz S, Sawosz P, Kacprzak M, et al. Application of optical methods in the monitoring of traumatic brain injury: a review. J Cereb Blood Flow Metab. (2016) 36:1825–43. doi: 10.1177/0271678X16667953
61. Durduran T, Yodh AG. Diffuse correlation spectroscopy for non-invasive, micro-vascular cerebral blood flow measurement. Neuroimage. (2014) 85:51–63. doi: 10.1016/j.neuroimage.2013.06.017
62. Buckley EM, Parthasarathy AB, Grant PE, Yodh AG, Franceschini MA. Diffuse correlation spectroscopy for measurement of cerebral blood flow: future prospects. Neurophotonics. (2014) 1:011009. doi: 10.1117/1.NPh.1.1.011009
63. Smith-Bindman R, Lipson J, Marcus R, Kim K-P, Mahesh M, Gould R, et al. Radiation dose associated with common computed tomography examinations and the associated lifetime attributable risk of cancer. Arch Intern Med. (2009) 169:2078–86. doi: 10.1001/archinternmed.2009.427
64. Huang B, Law MW-M, Khong P-L. Whole-body PET/CT scanning: estimation of radiation dose and cancer risk. Radiology. (2009) 251:166–74. doi: 10.1148/radiol.2511081300
65. Andreucci M, Solomon R, Tasanarong A. Side effects of radiographic contrast media: pathogenesis, risk factors, and prevention. Biomed Res Int. (2014) 2014:e741018. doi: 10.1155/2014/741018
66. Granata V, Cascella M, Fusco R, dell'Aprovitola N, Catalano O, Filice S, et al. Immediate adverse reactions to gadolinium-based mr contrast media: a retrospective analysis on 10,608 examinations. Biomed Res Int. (2016) 2016:e3918292. doi: 10.1155/2016/3918292
67. Nordbeck P, Ertl G, Ritter O. Magnetic resonance imaging safety in pacemaker and implantable cardioverter defibrillator patients: how far have we come? Eur Heart J. (2015) 36:1505–11. doi: 10.1093/eurheartj/ehv086
68. Ott LK, Hoffman LA, Hravnak M. Intrahospital transport to the radiology department: risk for adverse events, nursing surveillance, utilization of a MET, and practice implications. J Radiol Nurs. (2011) 30:49–54. doi: 10.1016/j.jradnu.2011.02.001
69. Ma R, Rowland D, Judge A, Calisto A, Jayamohan J, Johnson D, et al. Complications following intracranial pressure monitoring in children: a 6-year single-center experience. J Neurosurg Pediatr. (2018) 21:278–83. doi: 10.3171/2017.9.PEDS17360
70. Carney N, Totten AM, O'Reilly C, Ullman JS, Hawryluk GWJ, Bell MJ, et al. Guidelines for the management of severe traumatic brain injury, fourth edition. Neurosurgery. (2017) 80:6–15. doi: 10.1227/NEU.0000000000001432
71. Gomez A, Dian J, Zeiler FA. Continuous and entirely non-invasive method for cerebrovascular reactivity assessment: technique and implications. J Clin Monit Comput. (2021) 35:307–15. doi: 10.1007/s10877-020-00472-4
72. Gomez A, Zeiler FA. Non-invasive continuous cerebrovascular monitoring for subacute bedside and outpatient settings: an important advancement. Neurotrauma Rep. (2021) 2:25–6. doi: 10.1089/neur.2020.0064
73. Gomez A, Dian J, Froese L, Zeiler FA. Near-infrared cerebrovascular reactivity for monitoring cerebral autoregulation and predicting outcomes in moderate to severe traumatic brain injury: proposal for a pilot observational study. JMIR Res Protoc. (2020) 9:e18740. doi: 10.2196/18740
74. Czosnyka M, Czosnyka Z, Smielewski P. Pressure reactivity index: journey through the past 20 years. Acta Neurochir. (2017) 159:2063–5. doi: 10.1007/s00701-017-3310-1
75. Lidington D, Wan H, Bolz S-S. Cerebral autoregulation in subarachnoid hemorrhage. Front Neurol. (2021) 12:688362. doi: 10.3389/fneur.2021.688362
76. Tas J, Beqiri E, van Kaam RC, Czosnyka M, Donnelly J, Haeren RH, et al. Targeting autoregulation-guided cerebral perfusion pressure after traumatic brain injury (COGiTATE): a feasibility randomized controlled clinical trial. J Neurotrauma. (2021) 38:2790–800. doi: 10.1089/neu.2021.0197
77. Gomez A, Sainbhi AS, Froese L, Batson C, Alizadeh A, Mendelson AA, et al. Near infrared spectroscopy for high-temporal resolution cerebral physiome characterization in tbi: a narrative review of techniques, applications, and future directions. Front Pharmacol. (2021) 12:3151. doi: 10.3389/fphar.2021.719501
Keywords: cerebrovascular autoregulation, computed tomography, dynamic autoregulation, magnetic resonance imaging, near-infrared spectroscopy, positron emission tomography, static autoregulation, Transcranial Doppler
Citation: Sainbhi AS, Gomez A, Froese L, Slack T, Batson C, Stein KY, Cordingley DM, Alizadeh A and Zeiler FA (2022) Non-Invasive and Minimally-Invasive Cerebral Autoregulation Assessment: A Narrative Review of Techniques and Implications for Clinical Research. Front. Neurol. 13:872731. doi: 10.3389/fneur.2022.872731
Received: 09 February 2022; Accepted: 30 March 2022;
Published: 26 April 2022.
Edited by:
Frank Anthony Rasulo, University of Brescia, ItalyReviewed by:
Danilo Cardim, University of Texas Southwestern Medical Center, United StatesSandra Magnoni, IRCCS Ca 'Granda Foundation Maggiore Policlinico Hospital, Italy
Copyright © 2022 Sainbhi, Gomez, Froese, Slack, Batson, Stein, Cordingley, Alizadeh and Zeiler. This is an open-access article distributed under the terms of the Creative Commons Attribution License (CC BY). The use, distribution or reproduction in other forums is permitted, provided the original author(s) and the copyright owner(s) are credited and that the original publication in this journal is cited, in accordance with accepted academic practice. No use, distribution or reproduction is permitted which does not comply with these terms.
*Correspondence: Amanjyot Singh Sainbhi, YW1hbmp5b3Qucy5zYWluYmhpQGdtYWlsLmNvbQ==