 Lea Fast1
 Uchralt Temuulen2
 Kersten Villringer2
 Anna Kufner2,3,4
 Huma Fatima Ali5
 Eberhard Siebert6
 Shufan Huo2,4,7
 Sophie K. Piper3,8,9Pia Sophie Sperber2,10,11,12
 Thomas Liman2,7,13,14
 Matthias Endres2,3,4,7,10,13
 Kerstin Ritter1,15*
- 1Charité - Universitätsmedizin Berlin, Corporate Member of Freie Universität Berlin and Humboldt-Universität zu Berlin, Department of Psychiatry and Psychotherapy, Berlin, Germany
- 2Charité - Universitätsmedizin Berlin, Corporate Member of Freie Universität Berlin and Humboldt-Universität zu Berlin, Center for Stroke Research Berlin (CSB), Berlin, Germany
- 3Berlin Institute of Health at Charité - Universitätsmedizin Berlin, Berlin, Germany
- 4Charité - Universitätsmedizin Berlin, Corporate Member of Freie Universität Berlin and Humboldt-Universität zu Berlin, Department of Neurology with Experimental Neurology, Berlin, Germany
- 5Berlin School of Mind and Brain, Humboldt-Universität zu Berlin, Berlin, Germany
- 6Charité - Universitätsmedizin Berlin, Corporate Member of Freie Universität Berlin and Humboldt-Universität zu Berlin, Department of Neuroradiology, Berlin, Germany
- 7German Center for Cardiovascular Research (Deutsches Zentrum für Herz-Kreislauferkrankungen, DZHK), Partner Site Berlin, Berlin, Germany
- 8Charité - Universitätsmedizin Berlin, Corporate Member of Freie Universität Berlin and Humboldt-Universität zu Berlin, Institute of Biometry and Clinical Epidemiology, Berlin, Germany
- 9Charité - Universitätsmedizin Berlin, Corporate Member of Freie Universität Berlin and Humboldt-Universität zu Berlin, Institute of Medical Informatics, Berlin, Germany
- 10Charité - Universitätsmedizin Berlin, Corporate Member of Freie Universität Berlin and Humboldt-Universität zu Berlin, NeuroCure Cluster of Excellence, NeuroCure Clinical Research Center (NCRC), Berlin, Germany
- 11Experimental and Clinical Research Center, A Cooperation Between the Max Delbrück Center for Molecular Medicine in the Helmholtz Association and Charité – Universitätsmedizin Berlin, Berlin, Germany
- 12Max Delbrück Center for Molecular Medicine in the Helmholtz Association (MDC), Berlin, Germany
- 13German Center for Neurodegenerative Diseases (Deutsches Zentrum für Neurodegenerative Erkrankungen, DZNE), Partner Site Berlin, Berlin, Germany
- 14Department of Neurology, Evangelical Hospital Oldenburg, Carl von Ossietzky-University, Oldenburg, Germany
- 15Charité - Universitätsmedizin Berlin, Corporate Member of Freie Universität Berlin and Humboldt-Universität zu Berlin, Bernstein Center for Computational Neuroscience (BCCN), Berlin, Germany
Background: Accurate prediction of clinical outcomes in individual patients following acute stroke is vital for healthcare providers to optimize treatment strategies and plan further patient care. Here, we use advanced machine learning (ML) techniques to systematically compare the prediction of functional recovery, cognitive function, depression, and mortality of first-ever ischemic stroke patients and to identify the leading prognostic factors.
Methods: We predicted clinical outcomes for 307 patients (151 females, 156 males; 68 ± 14 years) from the PROSpective Cohort with Incident Stroke Berlin study using 43 baseline features. Outcomes included modified Rankin Scale (mRS), Barthel Index (BI), Mini-Mental State Examination (MMSE), Modified Telephone Interview for Cognitive Status (TICS-M), Center for Epidemiologic Studies Depression Scale (CES-D) and survival. The ML models included a Support Vector Machine with a linear kernel and a radial basis function kernel as well as a Gradient Boosting Classifier based on repeated 5-fold nested cross-validation. The leading prognostic features were identified using Shapley additive explanations.
Results: The ML models achieved significant prediction performance for mRS at patient discharge and after 1 year, BI and MMSE at patient discharge, TICS-M after 1 and 3 years and CES-D after 1 year. Additionally, we showed that National Institutes of Health Stroke Scale (NIHSS) was the top predictor for most functional recovery outcomes as well as education for cognitive function and depression.
Conclusion: Our machine learning analysis successfully demonstrated the ability to predict clinical outcomes after first-ever ischemic stroke and identified the leading prognostic factors that contribute to this prediction.
1. Introduction
Stroke is the second most common cause of death and a major cause of disability on a worldwide scale (1). It occurs when the blood supply to brain tissue is interrupted by either blockage (ischaemic stroke) or bleeding caused by rupture of cerebral blood vessels (haemorrhagic stroke) ultimately resulting in irreversible neuronal death (2). The incidence of stroke is set to rise due to the demographic shift affecting populations across the globe (3). Thus, it is paramount to identify parameters that can aid in accurate prediction of long-term clinical outcome post-stroke.
In recent years the move toward electronic health records and the application of machine learning (ML) techniques in the medical research field have opened new frontiers of personalized medicine and decision support. The key advantage is that—in contrast to traditional statistical analyses—not only can predictors and biomarkers be identified on a group level, but ML techniques also enable prediction on an individual patient level. In other words, the outcome for a single patients can be predicted by considering a vast array of variables (4). Numerous studies have successfully demonstrated the ability of ML models to predict specific clinical outcomes after stroke with remarkable accuracy and identified leading baseline factors that carry high prognostic value (5–8). Most studies so far have focused on the prediction of the modified Rankin Scale (mRS) (9) as it is the gold standard for determining functional recovery after stroke. While there are some studies investigating the ML-based prediction of the Barthel Index (BI) (10) and Modified Telephone Interview for Cognitive Status (TICS-M) (11), research regarding the Center for Epidemiologic Studies Depression Scale (CES-D) (12) and Mini-Mental State Examination (MMSE) (13) is sparse. In addition, the heterogeneity of ML techniques, clinical outcomes and datasets used in these studies makes it difficult to assess the broader implications of their findings (4).
The primary aim of the present study was therefore to conduct a systematic comparison of ML-based outcome prediction after first-ever ischemic stroke featuring measures of functional recovery (mRS, BI), cognitive function (MMSE, TICS-M), depression (CES-D), and mortality. The analysis was based on three powerful ML models and an array of baseline features including demographic, clinical, serological and MRI variables. As a secondary aim, we set out to identify to the key prognostic markers for each outcome using state-of-the-art visualization techniques.
2. Methods
2.1. Dataset and feature selection
The patients included in these analyses were selected from the PROSpective Cohort with Incident Stroke Berlin (PROSCIS-B) study. Recruitment for this prospective cohort study was conducted over a three-year period starting in March 2010 at the Center for Stroke Research Berlin and Charité University Hospital with a consecutive three-year follow-up period. The study population consists of patients aged 18 years and over with acute first-ever stroke according to the WHO stroke criteria (14). The complete inclusion and exclusion criteria are described in detail on https://clinicaltrials.gov (NTC01363856). The study was approved by the ethics committee of the Charité - Universitätsmedizin Berlin (EA1/218/09) and was conducted in accordance with the Declaration of Helsinki. For the purposes of this exploratory analysis only patients with ischemic stroke and input features with no more than 15% missing values were included.
MRI data was collected after study completion from clinical routine data. In order to quantify the characteristics of the imaging data all acute and chronic stroke lesions were delineated on Diffusion-weighted imaging (DWI) and Fluid-attenuated inversion recovery (FLAIR) sequences, respectively, using MRIcron (15) from the Center for Advanced Brain Imaging (University of South Carolina, Chris Rordan, USA). The delineation and volume extraction for acute and chronic stroke lesions were performed by medical students supervised by two independent expert neuroradiologists while all further MRI parameters were obtained by expert neuroradiologists.
Due to significant differences in the number and mean age of female and male patients, we balanced the dataset by separating all patients into groups according to sex and age and then randomly selecting patients within these groups until there were no more significant differences (up to p ≤ 0.1). This was necessary to ensure the predictions of our models were not based on an inherent bias in the training data (e.g., women being older on average and thus having worse outcomes) (16). The patient selection process is shown in Figure 1 and the characteristics of the dataset are described in Table 1.
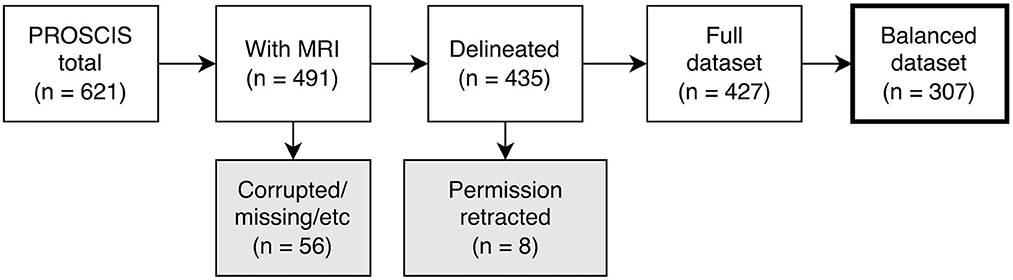
Figure 1. Flowchart depicting patient selection process. PROSCIS, PROSpective Cohort with Incident Stroke; MRI, Magnetic resonance imaging.
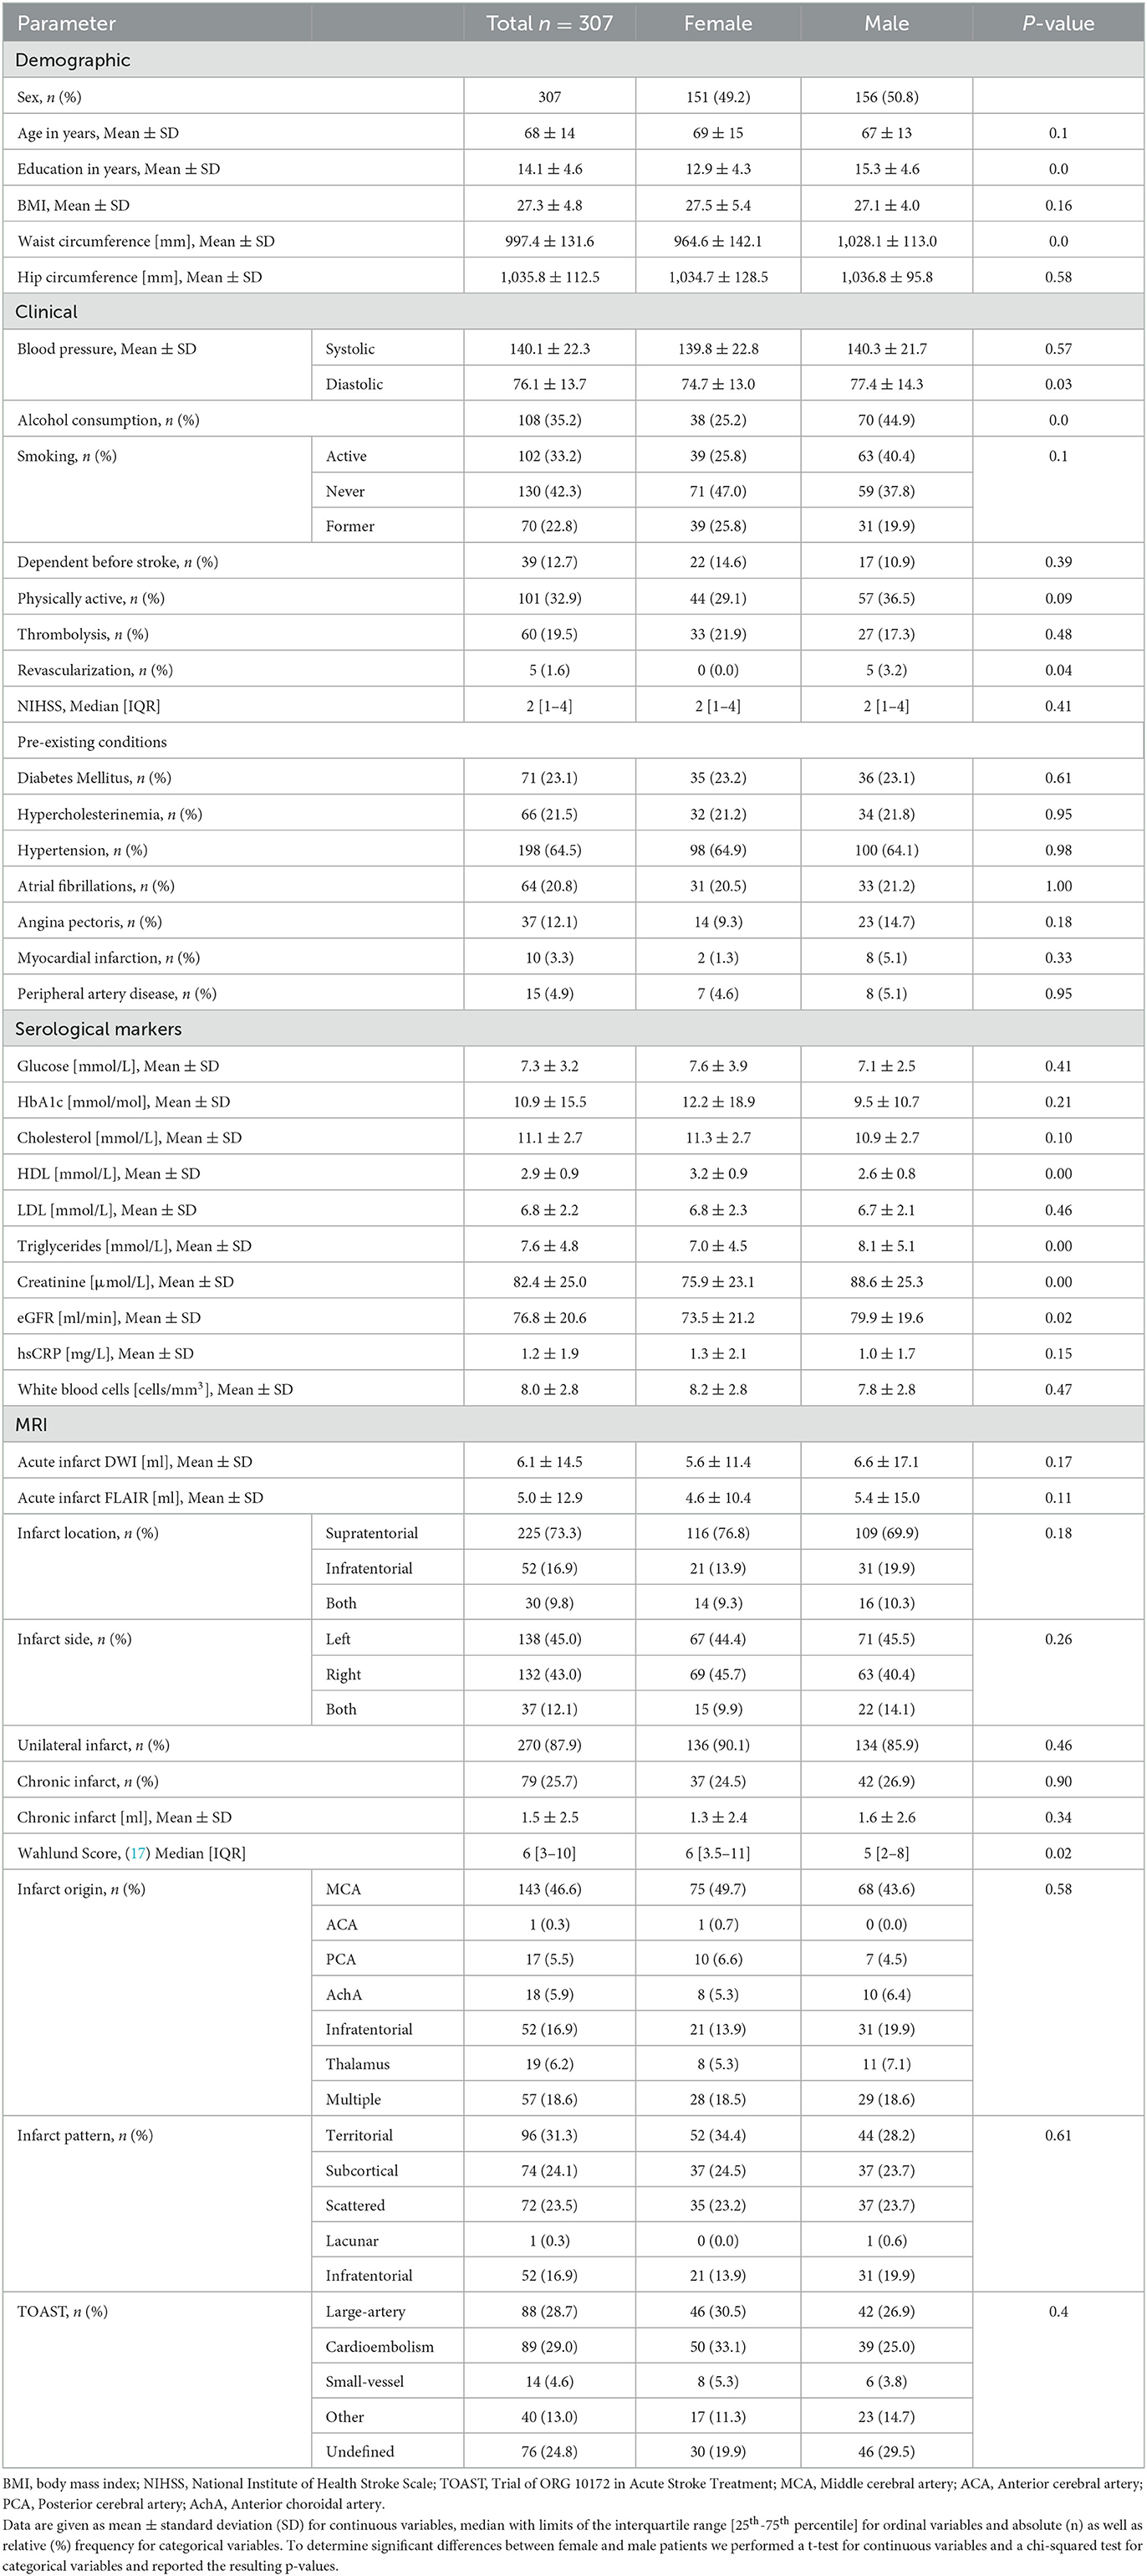
Table 1. Baseline characteristics of patient population.
2.2. Input data and outcomes
This study includes a total of 43 stroke-related baseline variables in four input subdomains. They consisted of 6 demographic and 16 clinical variables, 10 serological markers and 11 MRI parameters as listed in Table 1. Procalcitonin serum levels, which have previously been identified as a prognostic marker for 30-day mortality after stroke (18), had to be excluded since this variable had more than 15% missing values. The outcomes included measures of functional recovery (mRS and BI), cognitive function (MMSE and TICS-M), depression (CES-D) and survival. The mRS and BI were assessed at patient discharge, and 1 year post-stroke. Cognitive impairment was evaluated using the MMSE at discharge and later with the TICS-M at 1 and 3 years. CES-D and survival were also assessed 1 and 3 years after the index event. The follow-up process included an initial telephone assessment of cognitive function, followed by a structured interview conducted either by phone or mail. Table 2 shows the distribution of outcomes in the dataset, their respective follow-up time points, and the cut-off points for good vs. poor clinical outcome as defined by clinical scoring gold standards.
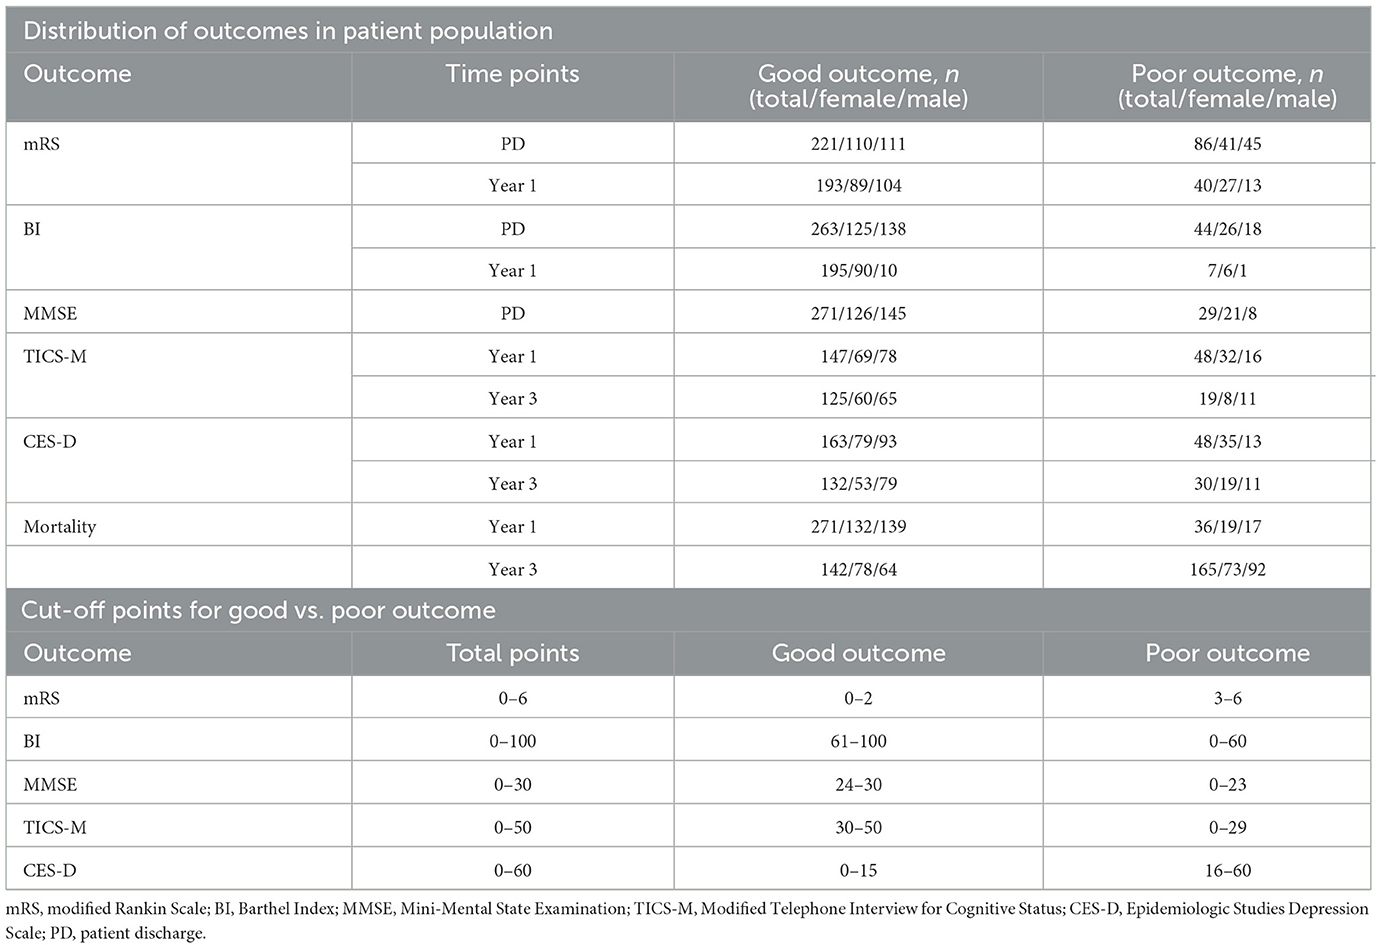
Table 2. Cut-offs and distribution of outcomes, listed as frequency for patient numbers in total, males, and females.
2.3. Machine learning analysis
The aim of this study was to conduct a systematic comparison of ML-based outcome prediction models after first-ever ischemic stroke. To accomplish this, a linear model, a non-linear model, and a tree-based model were selected for comparison (see Figure 2). To reduce complexity and potential problems brought on by multiple comparisons, a small set of three ML algorithms were selected. A Support Vector Machine (SVM) with linear kernel (SVM-lin) (19) and a SVM with radial basis function kernel (SVM-rbf) (20) were chosen as linear and non-linear models due to their strong performance in previous studies and the ability to directly compare them (6, 16, 21). Similarly, Gradient Boosting (GB) (22) was chosen as the tree-based classifier due to its superior performance and when compared to other tree-based models (23, 24). We compensated for missing data in the training and validation set with Multiple Imputation using Chained Equations (MICE) (25). The outcome class imbalances in the training set were counteracted with the Synthetic Minority Over-sampling Technique (SMOTE) (26) and random oversampling (27). Categorical input features were transformed using one-hot encoding. Then, models were carefully evaluated using ten times repeated 5-fold nested cross-validation with fixed seed to increase robustness (28). Here the data is split into five training (80%) and test sets (20%). Each of these training sets is then subdivided into further five training (80%) and validation sets (20%). The hyperparameters of the ML models (listed in Supplementary Table S1) have been optimized on these training and validation sets via grid search before finally being evaluated on the unseen data of the test sets.
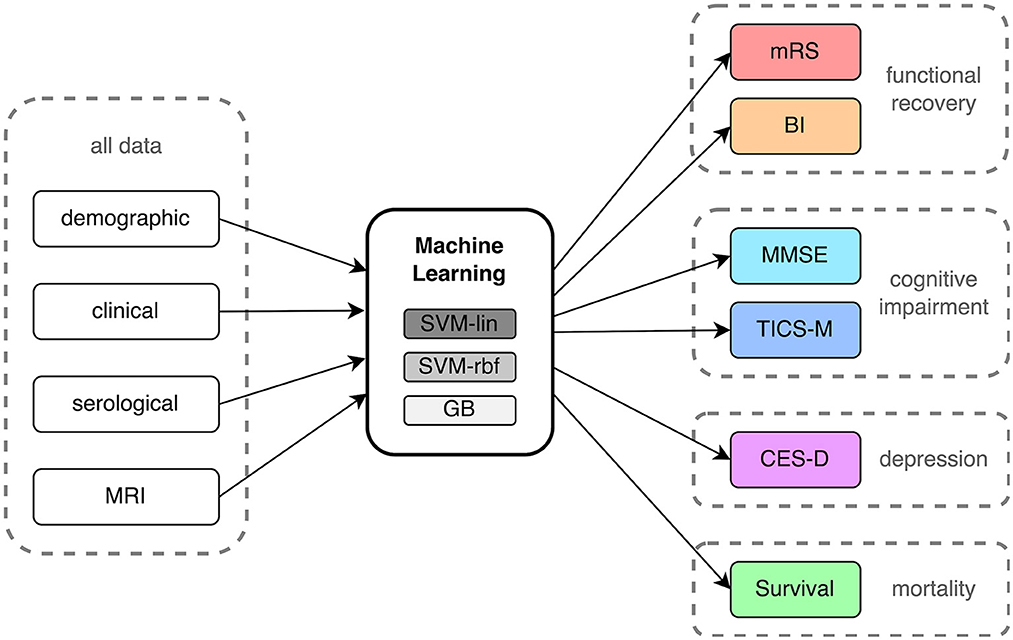
Figure 2. Process flow of input data, machine learning analysis and outcome prediction. mRS, modified Rankin Scale; BI, Barthel Index; MMSE, Mini-Mental State Examination; TICS-M, Modified Telephone Interview for Cognitive Status; CES-D, Epidemiologic Studies Depression Scale; SVM-lin, Support Vector Machine with linear kernel; SVM-rbf, Support Vector Machine with radial basis function kernel; GB, Gradient Bossting Classifier; MRI, Magnetic resonance imaging.
Performance of each model was evaluated using balanced accuracy (BA), area under the receiver operating characteristic curve, sensitivity, specificity, likelihood ratio (LR) and Integrated Discrimination Improvement index (IDI). BA is the arithmetic mean of sensitivity and specificity while the receiver operating characteristics curve (ROC) plots the true positive rate in relation to the false positive rate of the ML models. The area under the curve (AUC) of the ROC is routinely used as a measure of performance in ML. For each outcome, we reported the mean BA and AUC along with their standard deviation (SD) for ten iterations of 5-fold nested cross-validation. The LR compares the fit of two models by taking the ratio of their likelihoods (29) while the IDI ranks the model according to the change of the discrimination slopes (30). To test for statistical significance, we performed non-parametric permutation testing (31). Here, the exact same ML analysis and nested cross-validation procedure was performed a hundred times on randomly permuted ground truth labels before being compared to the original results. Results were considered statistically significant below p ≤ 0.05 and p ≤ 0.01 after Bonferroni correction for multiple comparisons (3 ML algorithms × 5 feature subsets). We used the Python 3.6 programming language with the scikit-learn, pandas, statsmodel, matplotlib and seaborn packages for all analyses and visualizations.
2.4. Feature importance and Shapley values
In order to discern feature importance we implemented Shapley values using the SHAP (SHapley Additive exPlanations) framework (32). This statistic is a solution concept originating from cooperative game theory which calculates the relative importance of an input feature for the final prediction result and has already demonstrated convincing results in biomedical and clinical research applications (33, 34). Shapley values are calculated by determining the average marginal contribution of each feature over all possible combinations of input features. This is done by analyzing the effect of each feature on the prediction when it is included or excluded, while also taking into account the dependencies between features. For the purposes of this study, we implemented the Kernel SHAPexplainer which acts as a specially-weighted local linear regression (32).
3. Results
Out of the 621 PROSCIS-B patients 125 had no MRI associated with their study ID and in 5 further cases we were unable to locate the MRI data. This resulted in 491 patients with imaging data out of which 255 had received a 3T scan at the Center of Stroke Research Berlin (CSB) and 236 had been processed on scanners at Charité - Universitätsmedizin Berlin ranging from 1 to 1.5T, all of which were Siemens MRI units. In 56 cases the imaging data could not be delineated due to missing sequences or motion artifacts and in 8 cases participants had retracted their consent for the study which resulted in a total of 427 fully delineated cases. The final balanced dataset consisted of 307 patients. There was a loss to follow-up of 74 patients (24.1%) in mRS, 105 patients (34.2%) in BI, 51 patients (26.2%) in TICS-M, and 49 patients (23.2%) in CES-D from the initial sample size. No loss was observed for mortality.
We evaluated and ranked the performance of the ML models using the metrics of BA and AUC. The results of these analyses can be found in Supplementary Tables S2–S6. In Figure 3, we show the performance in BA for all outcomes (mRS, BI, MMSE, TICS-M, CES-D, and survival), time points, and ML models (SVM-lin, SVM-rbf and GB). Additionally, we calculated the Integrated IDI and LR to provide further insight into the models' performance. The detailed results are reported in Supplementary Tables S7–S11. While the LR revealed no significant differences between the ML models it is important to note that the results obtained from the BA, AUC and the LR should be viewed independently, as they are based on different methods of evaluating the models' performance. Although in many cases the performance of the three ML models was at a comparable level the strongest predictive performance overall was achieved by SVM-rbf for TICS-M after 3 years (BA ± SD = 0.7 ± 0.13; AUC ± SD = 0.76 ± 0.13; p ≤ 0.05) using the demographic input subdomain. Table 3 states the most important predictors according to the Shapley values. The following paragraphs will list significant results (p ≤ 0.05 or p ≤ 0.01 Bonferroni corrected) according to the permutation test for each outcome per input subdomain.
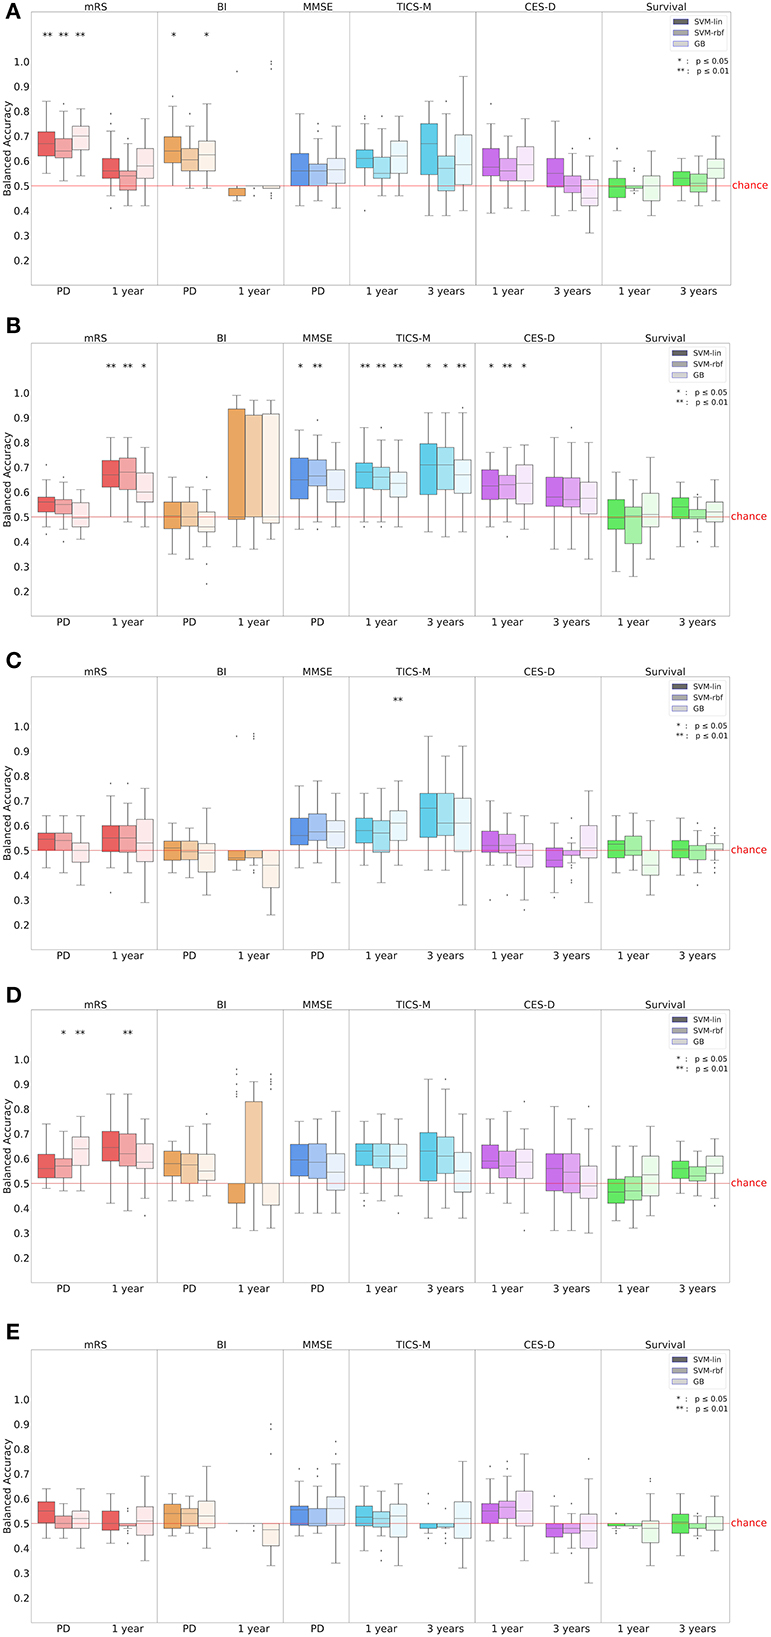
Figure 3. Prediction performance in balanced accuracy (BA) for all outcomes, time points and input subdomains. In (A) all input parameters were considered while (B–E) show the results of the (B) demographic, (C) clinical, (D) serological and (E) MRI input subdomain. Results for BI after 1 year were unreliable due to the extreme class imbalance in the dataset (see Table 2). mRS, modified Rankin Scale; BI, Barthel Index; MMSE, Mini-Mental State Examination; TICS-M, Modified Telephone Interview for Cognitive Status; CES-D, Epidemiologic Studies Depression Scale; SVM-lin, Support Vector Machine with linear kernel; SVM-rbf, Support Vector Machine with radial basis function kernel; GB, Gradient Bossting Classifier; MRI, Magnetic resonance imaging.
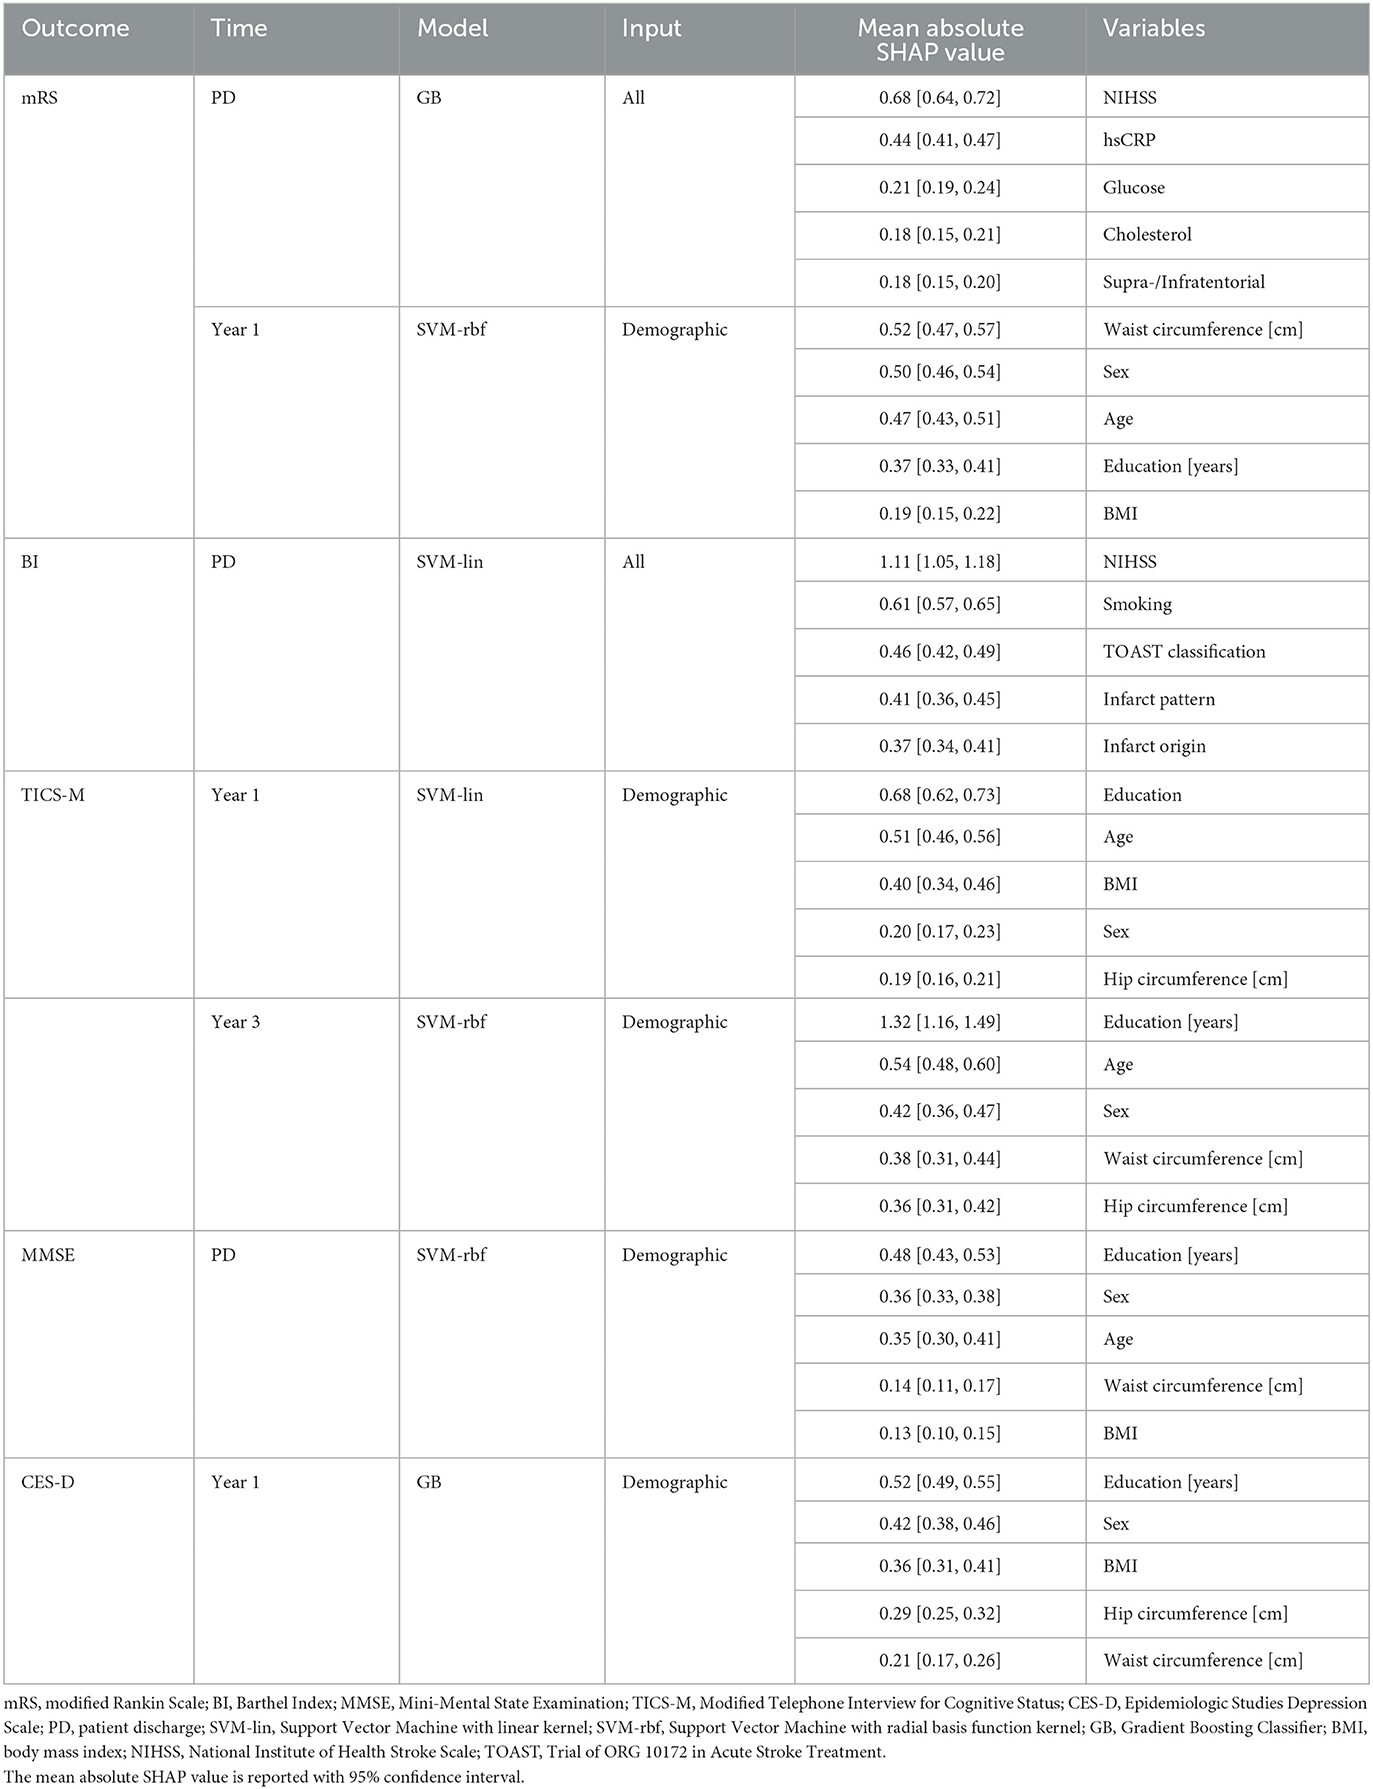
Table 3. Best prediction results and most important predictors for all outcomes as determined via Shapley values.
3.1. Modified Rankin Scale
The highest prediction score for mRS at patient discharge was achieved by GB (BA ± SD = 0.69 ± 0.07; AUC ± SD = 0.77 ± 0.06; p ≤ 0.01) followed by SVM-lin (BA ± SD = 0.67 ± 0.07; AUC ± SD = 0.74 ± 0.07; p ≤ 0.01) and SVM-rfb (BA ± SD = 0.65 ± 0.06; AUC ± SD = 0.77 ± 0.06; p ≤ 0.01) using all input parameters. In the serological input subdomain GB (BA ± SD = 0.63 ± 0.07; AUC ± SD = 0.68 ± 0.08; p ≤ 0.01) and SVM-rbf (BA ± SD = 0.57 ± 0.06; AUC ± SD = 0.63 ± 0.07; p ≤ 0.05) attained significant prediction results. The top five predictors using all input parameters were National Institutes of Health Stroke Scale (NIHSS), hsCRP, glucose, cholesterol and supra-/infratentorial infarct location.
The mRS after 1 year could best be predicted using the demographic input subdomain by SVM-rbf (BA ± SD = 0.68 ± 0.09; AUC ± SD = 0.73 ± 0.01; p ≤ 0.01) followed by SVM-lin (BA ± SD = 0.67 ± 0.08; AUC ± SD = 0.73 ± 0.01; p ≤ 0.01) and GB (BA ± SD = 0.61 ± 0.08; AUC ± SD = 0.66 ± 0.09; p ≤ 0.05). In the serological input subdomain, SVM-rbf (BA ± SD = 0.63 ± 0.1; AUC ± SD = 0.64 ± 0.12; p ≤ 0.01) led in prediction results. Waist circumference, sex, age, education, and BMI were the leading predictors in the demographic input subdomain.
3.2. Barthel Index
For BI at patient discharge, SVM-lin (BA ± SD = 0.65 ± 0.08; AUC ± SD = 0.73 ± 0.11; p ≤ 0.05) and GB (BA ± SD = 0.63 ± 0.08; AUC ± SD = 0.74 ± 0.07; p ≤ 0.05) achieved significant prediction results using all input parameters. The strongest predictors were NIHSS, smoking, the Trial of ORG 10172 in Acute Stroke Treatment (TOAST) classification, infarct pattern and infarct origin. However, BI after 1 year could not be predicted by any model.
3.3. Mini-Mental State Examination
The leading ML models for predicting MMSE at patient discharge were SVM-rbf (BA ± SD = 0.67 ± 0.09; AUC ± SD = 0.71 ± 0.11; p ≤ 0.01) and SVM-lin (BA ± SD = 0.65 ± 0.1; AUC ± SD = 0.7 ± 0.1; p ≤ 0.05) using the demographic input subdomain with education, sex, age, waist circumference and BMI being the most important predictors.
3.4. Modified Telephone Interview for Cognitive Status
The best predictions for TICS-M after 1 year were by SVM-lin (BA ± SD = 0.67 ± 0.09; AUC ± SD = 0.73 ± 0.09; p ≤ 0.01), SVM-rbf (BA ± SD = 0.65 ± 0.09; AUC ± SD = 0.72 ± 0.09; p ≤ 0.01) and GB (BA ± SD = 0.63 ± 0.08; AUC ± SD = 0.69 ± 0.11; p ≤ 0.01) using the demographic input subdomain. Further significant prediction results were achieved by GB (BA ± SD = 0.6 ± 0.08; AUC ± SD = 0.66 ± 0.1; p ≤ 0.01) using the clinical input subdomain. The top five predictors in the demographic input subdomain were education, age, BMI, sex, and hip circumference. TICS-M after 3 years was most successfully predicted by SVM-rbf (BA ± SD = 0.7 ± 0.13; AUC ± SD = 0.76 ± 0.13; p ≤ 0.05), SVM-lin (BA ± SD = 0.69 ± 0.14; AUC ± SD = 0.77 ± 0.13; p ≤ 0.05) and GB (BA ± SD = 0.68 ± 0.12; AUC ± SD = 0.74 ± 0.13; p ≤ 0.01) using the demographic input subdomain. Education, age, sex, waist circumference, and hip circumference were the leading variables.
3.5. Center for epidemiologic studies depression scale
For the prediction of CES-D after 1 year the use of the demographic input subdomain led to a significant prediction performance by GB (BA ± SD = 0.63 ± 0.09; AUC ± SD = 0.7 ± 0.1; p ≤ 0.05), SVM-lin (BA ± SD = 0.63 ± 0.08; AUC ± SD = 0.68 ± 0.1; p ≤ 0.05) and SVM-rbf (BA ± SD = 0.62 ± 0.07; AUC ± SD = 0.7 ± 0.09; p ≤ 0.01). The strongest predictors were education, sex, BMI as well as hip and waist circumference. No ML model achieved significant prediction results for CES-D after 3 years.
3.6. Survival
Survival within 1 or 3 years could not be predicted reliably by any model.
4. Discussion
To the best of our knowledge, this is the first study to apply highly comparable standardized ML models to predict a wide range of long-term patient outcomes including functional recovery, cognitive impairment, depression, and mortality from a single, homogenous patient collective. While functional recovery scores like mRS and BI are often used as primary outcome endpoints in most major stroke cohorts, cognitive impairment and depression play a vital role in terms of long-term patient outcome. Up to 80% of patients are affected by cognitive impairment post-stroke and up to 30% will develop a clinically relevant depression within 2 years after the index event (35, 36). These factors not only negatively affect functional recovery by decreasing a patient's capability for actively participating in rehabilitation measures but also disrupt their social integration. Although numerous previous studies have used similar ML models to predict functional recovery after stroke (5), here we demonstrate the accuracy of ML models to predict post-stroke cognitive status and depression up to 3 years post-stroke, as well as functional recovery.
Our results are in line with previous studies in identifying NIHSS as the leading predictor for mRS at patient discharge amongst all input variables (37, 38). Increased levels of hsCRP were correlated with poor clinical outcome which supports findings reported by den Hertog et al. (39) in acute stroke. Interestingly, waist circumference was the leading predictor for mRS after 1 year. Being underweight (BMI < 18.5 kg/m2) has previously been associated with unfavorable outcomes in terms of mortality and functional recovery in previous studies (40). Figure 4 illustrates the decision-making process of GB for mRS at patient discharge on a single-subject level.
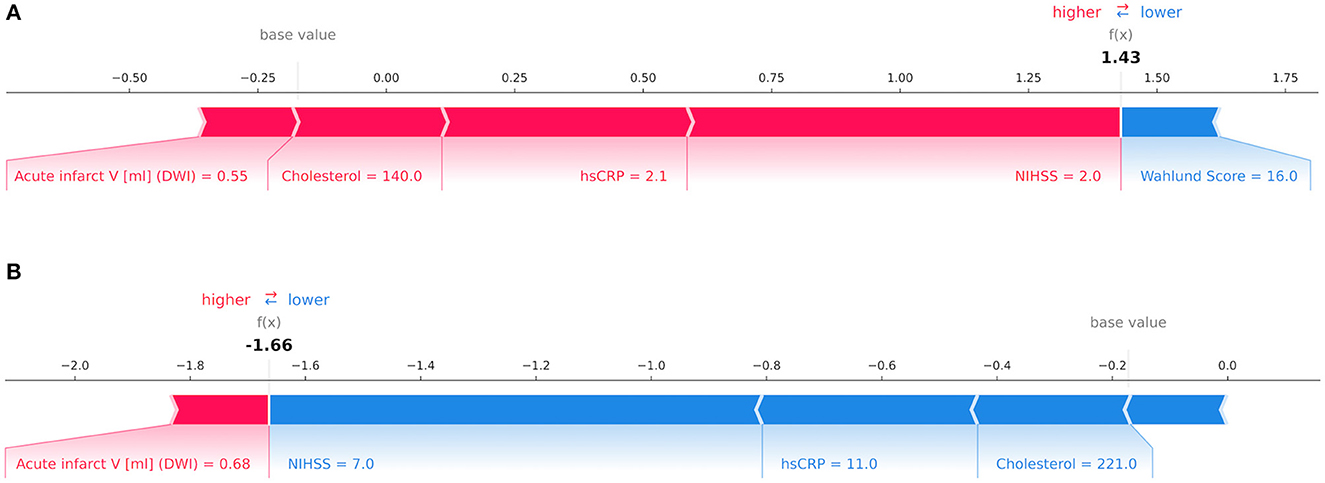
Figure 4. Decision-making process by the Gradient Boosting Classifier for the modified Rankin Scale (mRS) at patient discharge on the level of individual patients depicted via Shapley values. The relative importance of an input variable can be quantified by its Shapley value and represented by the length of a bar. In this example, features in red counted toward a good outcome while blue features signified poor outcome for mRS at patient discharge. In (A) a patient with a mRS score of 1 point was correctly classified as having a good outcome with variables such as low National Institutes of Health Stroke Scale (NIHSS), high-sensitivity C-reactive protein (hsCRP), cholesterol and acute infarct volume in Diffusion-weighted imaging (DWI) outweighing a high Wahlund Score. In (B) a patient with a mRS score of 4 points was correctly predicted as having poor outcome due to high NIHSS, hsCRP and cholesterol whilst offsetting a low acute infarct volume in DWI. In both instances the decision was made by considering the total impact of all features.
In a study by Monteiro et al. (6) various ML models were applied to predict mRS after 3 months from 425 patients using 152 input variables. The best performance using baseline variables was achieved using a Random Forest (RF) classifier with an AUC of 0.808 ± 0.085. In a separate study by Heo et al. (7) a DNN was used on 3,522 patients and achieved a classification accuracy of AUC = 0.888 with no reported SD. However, the authors did not mention whether cross-validation or repetition were used, which are important for developing a robust ML model and avoiding over-fitting. In a study by Li et al. (21) predicting mRS after 6 months a SVM (AUC = 0.865; 95% CI 0.823–0.907) performed comparably well with six other models, including a RF classifier (AUC = 0.874; 95% CI 0.835–0.912) and a DNN (AUC 0.867; 95% CI 0.827–0.908). In contrast, in our study, for mRS at patient discharge the SVM-lin (AUC ± SD = 0.74 ± 0.07) was outperformed by GB (AUC ± SD = 0.77 ± 0.06). However, comparing the results of these studies is challenging due to variations in follow-up time points, input variables, methodology, and performance measures. Nevertheless, it appears that SVMs tend to perform similarly to, or worse than, tree-based classifiers or DNNs for predicting mRS outcomes.
Considerable overlap exists between mRS and BI in the development of functional recovery post stroke (41). This is reflected in NIHSS being the leading predictor for BI at patient discharge. Our results also confirm the relative importance of stroke origin for this outcome (42). The BI after one year could not be predicted—this may be due to the extreme class imbalance of this outcome (see Table 2). In contrast, in a study by den Hertog et al. (39) a ML model for identifying prognostic factors for motor and cognitive improvement after post-stroke rehabilitative training was developed based on a SVM-lin. The model included 55 patients and the results of the ischemic test set reported performance scores of correlation = 0.75, MADP = 87,03% and RMSE = 21,74 for BI. The most important parameters for the prediction were identified as the Functional Independence Measure and BI at patient discharge as well as serological markers such as Platelet-to-lymphocyte ratio, Red Cell Distribution Width and Lymphocytes.
Amongst the leading predictors for cognitive function post-stroke were demographic factors such as education, age and BMI which confirms previously published results (43, 44). While our findings are in line with the results by Casanova et al. (45) and Aschwanden et al. (46) their studies additionally identified the importance of socioeconomic status and ethnicity in terms of cognitive function post-stroke. Unfortunately, in the current study, these variables could not be accounted for.
Education being the top predictor for levels of depression after 1 year is in accordance with several studies linking low education level to an increased risk of post-stroke depression (47). Previous studies have found a significant association between higher waist circumference with an elevated rate of depression (48). In the current analysis, female sex was also identified as an important predictor of depression (49). A study by Hama et al. (50) achieved an impressive AUC above 0.90 for the prediction of post-stroke depression using a probabilistic artificial neural network on 274 stroke inpatients at the Hibino Hospital. The predicted clinical score was the Hospital Anxiety and Depression Scale and its lead predictors were the Japanese Perceived Stress Scale, the Symbol Digit Modalities Test, tapping span backward, visual cancellation Kana time and the Continuous Performance Test. This jump in prediction accuracy may be explained in part by the inclusion of these very specific test scores.
4.1. Methodological considerations
While many previous ML-based studies achieved noteworthy results, there are some potentially problematic methodological factors to consider: ideally, a ML model is trained and tested on numerous different samples in order to create a robust predictor for new, unseen data (51). In face of limited clinical data, it is crucial to include a re-sampling procedure to ensure effective training (52). Additionally, few studies performed more than one iteration of their analyses which negatively impacts robustness (28). In our study, we accounted for these factors by using a repeated 5-fold nested cross-validation. Furthermore, many studies use datasets and ML methods specific to the purpose of predicting an individual outcome. This impedes comparability as it remains unclear whether differences in performance are based on variations in input data or technical aspects of the ML analysis (5). Neglecting to balance these datasets regarding age and sex may also lead to biased results (53). We therefore balanced the dataset according to age and sex and predicted a range of clinical outcomes from the same dataset using three classical ML models while ensuring independence between training and test data. In addition, and in contrast to previous ML studies, we estimated the relative importance of features using Shapley values allowing to assess the impact of different input features for clinical outcome prediction in individual patients (see Figure 4).
4.2. Clinical implications
In the coming years, the advancement of big data analytics based on collaboration networks and electronic health records is set to drive a paradigm shift in clinical research (54). Novel automated and computer-based methods will play a key role in making use of increasing datasets and processing power. Therefore, we take a crucial step forward in the application of ML-based research methods to one of the most common and severe diseases around the globe and show that established as well as less traditional risk predictors can be identified and reproduced with ML techniques even in a limited sample size.
There is currently no established prediction score for depression outcomes following ischemic stroke. However, there are already a variety of scores available in the scientific literature for predicting functional outcomes (such as the Wang et al. (55) and ASTRAL (56) scores), cognitive outcomes (such as the CHANGE (57) and SIGNAL2 (58) scores), and mortality outcomes (such as the iScore (59) and PLAN (60) scores). In future studies, the aim should be to develop a universal model that can predict multiple outcomes-including functional recovery, cognitive impairment, depression, and mortality outcomes-using a basic set of variables such as NIHSS, education, sex, age, or BMI. This model would ideally be an easy-to-use tool for clinicians in real-world medical practice and act as an AI-based clinical decision support system (CDSS). The implementation of CDSS has been shown to be a cost-effective and efficient method for enhancing clinical workflow and decision-making (61). CDSSs have the potential to enhance patient safety by mitigating the occurrence of oversights and treatment errors. In the case of stroke, functional recovery is heavily dependent on rehabilitation measures which in turn requires adequate cognitive function and management of post-stroke depression (62, 63). The ability of CDSSs to alert providers to potential challenges in the management process can provide valuable guidance for more personalized rehabilitation programs and patient-tailored secondary prevention strategies, ultimately improving post-stroke outcomes.
4.3. Limitations
This study has several limitations that warrant discussion. First and foremost, this study had a limited sample size, the outcome classes were imbalanced, and an external control dataset was lacking. The application of 5-fold nested cross-validation, SMOTE and random oversampling partially counteract these limitations. To avoid shortcut learning and develop a model representative of the general population, we balanced our dataset by age and sex. Shortcut learning occurs when the model relies heavily on easily observable features like age rather than underlying causes, leading to potential biases and inaccuracies when applied to individuals outside the trained age range. However, this approach does not account for the natural incidence variation within the population, which may impact the ML model's predictions. Additionally, most of the patients included in this study had relatively mild to moderate strokes (NIHSS median of 2 (1–4)); this may have negatively affected prediction performance and limits generalizability to more severely affected stroke cohorts. There was also no data available on whether patients entered a rehabilitation program post-stroke, or which secondary prevention strategies were initiated. Therefore, these factors could not be accounted for in terms of post-stroke outcome endpoints in this analysis.
5. Conclusion
Based on a systematic comparison, the results of this study demonstrated the viability of ML-based outcome prediction after first-ever ischemic stroke for functional recovery, cognitive function, depression, and mortality. Compared to group-based statistical analyses, the advantage of ML-techniques is their ability to make predictions on a single-subject level by considering a multitude of variables which is key for future application in clinical routine. Furthermore, we extracted the most important prognostic variables for each outcome. On the one hand, the results confirmed several already established prognostic markers and on the other identified novel candidates such as education, hsCRP and waist circumference as relevant predictors of important clinical endpoints. However, further studies are needed to confirm these findings and to establish their clinical viability.
Data availability statement
The PROCIS-B data is available upon request from TL. The code and results data are available upon request from KR.
Ethics statement
The studies involving human participants were reviewed and approved by the Ethics Committee of the Charité - Universitätsmedizin Berlin (EA1/218/09). The patients/participants or their legal representative provided their written informed consent to participate in this study.
Author contributions
LF, KV, AK, and KR: conceptualization. LF, UT, KV, AK, HA, SP, and KR: data curation. LF, UT, and KR: formal analysis, methodology, visualization, and software. LF, TL, and KR: project administration. LF: writing–original draft. KV, AK, ES, SH, SP, PS, TL, ME, and KR: writing–review and editing. KV, TL, and KR: resources. KV and KR: supervision. All authors contributed to the article and approved the submitted version.
Funding
We acknowledge support from the German Research Foundation (DFG, 389563835; 402170461-TRR 265; 414984028-CRC 1404; 42075332-RU 5187) and the Manfred and Ursula-Müller Stiftung. ME received funding from DFG under Germany's Excellence Strategy–EXC-2049–390688087, Collaborative Research Center ReTune TRR 295-424778381, Bundesministerium für Bildung und Forschung (BMBF), Deutsches Zentrum für Neurodegenerative Erkrankungen (DZNE), Deutsches Zentrum für Herz-Kreislauferkrankungen (DZHK), EU, Corona Foundation, and Fondation Leducq.
Acknowledgments
We thank Evert de Man for supplying the ML toolbox, Ralf Mekle for access to the server infrastructure and Jane Thümmler for data management.
Conflict of interest
ME reports grants from Bayer and fees paid to the Charité from Abbot, Amgen, AstraZeneca, Bayer, 296 Boehringer Ingelheim, BMS, Daiishi Sankyo, Sanofi, Novartis, Pfizer, all outside the submitted work.
The remaining authors declare that the research was conducted in the absence of any commercial or financial relationships that could be construed as a potential conflict of interest.
Publisher's note
All claims expressed in this article are solely those of the authors and do not necessarily represent those of their affiliated organizations, or those of the publisher, the editors and the reviewers. Any product that may be evaluated in this article, or claim that may be made by its manufacturer, is not guaranteed or endorsed by the publisher.
Supplementary material
The Supplementary Material for this article can be found online at: https://www.frontiersin.org/articles/10.3389/fneur.2023.1114360/full#supplementary-material
References
1. Gorelick PB. The global burden of stroke: persistent and disabling. Lancet Neurol. (2019) 18:417–8. doi: 10.1016/S1474-4422(19)30030-4
2. Deb P, Sharma S, Hassan KM. Pathophysiologic mechanisms of acute ischemic stroke: An overview with emphasis on therapeutic significance beyond thrombolysis. Pathophysiology. (2010) 17:197–218. doi: 10.1016/j.pathophys.2009.12.001
3. Donkor ES. Stroke in the 21st century: a snapshot of the burden, epidemiology, and quality of life. Stroke Res Treat. (2018) 2018:3238165. doi: 10.1155/2018/3238165
4. Topol EJ. High-performance medicine: the convergence of human and artificial intelligence. Nat Med. (2019) 25:44–56. doi: 10.1038/s41591-018-0300-7
5. Wang W, Kiik M, Peek N, Curcin V, Marshall IJ, Rudd AG, et al. systematic review of machine learning models for predicting outcomes of stroke with structured data. PLoS ONE. (2020) 15:e0234722. doi: 10.1371/journal.pone.0234722
6. Monteiro M, Fonseca AC, Freitas AT, Pinho E. Melo T, Francisco AP, Ferro JM, Oliveira AL. Using machine learning to improve the prediction of functional outcome in ischemic stroke patients. IEEEACM Trans Comput Biol Bioinform. (2018) 15:1953–9. doi: 10.1109/TCBB.2018.2811471
7. Heo J, Yoon JG, Park H, Kim YD, Nam HS, Heo JH. Machine learning-based model for prediction of outcomes in acute stroke. Stroke. (2019) 50:1263–5. doi: 10.1161/STROKEAHA.118.024293
8. Chiu IM, Zeng WH, Cheng CY, Chen SH, Lin CR. Using a Multiclass machine learning model to predict the outcome of acute ischemic stroke requiring reperfusion therapy. Diagn Basel. (2021) 11:80. doi: 10.3390/diagnostics11010080
9. Saver JL, Filip B, Hamilton S, Yanes A, Craig S, Cho M, et al. FAST-MAG investigators and coordinators. Improving the reliability of stroke disability grading in clinical trials and clinical practice: the Rankin Focused Assessment (RFA). Stroke. (2010) 41:992–5. doi: 10.1161/STROKEAHA.109.571364
10. Dewing J. A critique of the Barthel Index. Br J Nurs Mark Allen Publ. (1992) 1:325–9. doi: 10.12968/bjon.1992.1.7.325
11. Cook SE, Marsiske M, McCoy KJM. The use of the modified Telephone Interview for Cognitive Status (TICS-M) in the detection of amnestic mild cognitive impairment. J Geriatr Psychiatry Neurol. (2009) 22:103–9. doi: 10.1177/0891988708328214
12. Carleton RN, Thibodeau MA, Teale MJN, Welch PG, Abrams MP, Robinson T, et al. The center for epidemiologic studies depression scale: a review with a theoretical and empirical examination of item content and factor structure. PLoS ONE. (2013) 8:e58067–e58067. doi: 10.1371/journal.pone.0058067
13. Pangman VC, Sloan J, Guse L. An examination of psychometric properties of the mini-mental state examination and the standardized mini-mental state examination: implications for clinical practice. Appl Nurs Res. (2000) 13:209–13. doi: 10.1053/apnr.2000.9231
14. Liman T, Zietemann V, Wiedmann S, Jungehülsing G, Endres M, Wollenweber F, et al. Prediction of vascular risk after stroke - protocol and pilot data of the Prospective Cohort with Incident Stroke (PROSCIS). Int J Stroke Off J Int Stroke Soc. (2012) 8:484–90. doi: 10.1111/j.1747-4949.2012.00871.x
15. Rorden C, Brett M. Stereotaxic display of brain lesions. Behav Neurol. (2000) 12:191–200. doi: 10.1155/2000/421719
16. Rane RP, de Man EF, Lim JH, Gorgen K, Tschorn M, Rapp MA, et al. Structural differences in adolescent brains can predict alcohol misuse. eLife. (2022) 11:e77545. doi: 10.7554/eLife.77545
17. Wahlund LO, Barkhof F, Fazekas F, Bronge L, Augustin M, Sjögren M, et al. A new rating scale for age-related white matter changes applicable to MRI and CT. Stroke. (2001) 32:1318–22. doi: 10.1161/01.STR.32.6.1318
18. Yan L, Wang S, Xu L, Zhang Z, Liao P. Procalcitonin as a prognostic marker of patients with acute ischemic stroke. J Clin Lab Anal. (2020) 34:e23301. doi: 10.1002/jcla.23301
19. Boser BE, Guyon IM, Vapnik VN. A training algorithm for optimal margin classifiers. In: Proceedings of the fifth annual workshop on Computational learning theory (COLT '92). New York, NY: Association for Computing Machinery (1992). p. 144–52. doi: 10.1145/130385.130401
20. Chapelle O, Vapnik V, Bousquet O, Mukherjee S. Choosing multiple parameters for support vector machines. Mach Learn. (2002) 46:131–59. doi: 10.1023/A:1012450327387
21. Li X, Pan X, Jiang C, Wu M, Liu Y, Wang F, et al. Predicting 6-month unfavorable outcome of acute ischemic stroke using machine learning. Front Neurol. (2020) 11:539509. doi: 10.3389/fneur.2020.539509
22. Friedman JH. Greedy function approximation: a gradient boosting machine. Ann Stat. (2001) 29:1189–232. doi: 10.1214/aos/1013203450
23. Zhang Z, Zhao Y, Canes A, Steinberg D, Lyashevska O. Predictive analytics with gradient boosting in clinical medicine. Ann Transl Med. (2019) 7:152. doi: 10.21037/atm.2019.03.29
24. Ogutu JO, Piepho HP, Schulz-Streeck T. A comparison of random forests, boosting and support vector machines for genomic selection. BMC Proc. (2011) 5:S11. doi: 10.1186/1753-6561-5-S3-S11
25. Azur MJ, Stuart EA, Frangakis C, Leaf PJ. Multiple imputation by chained equations: what is it and how does it work? Int J Methods Psychiatr Res. (2011) 20:40–9. doi: 10.1002/mpr.329
26. Chawla NV, Bowyer KW, Hall LO, Kegelmeyer WP. SMOTE synthetic minority over-sampling technique. J Artif Int Res. (2002) 16:321–57. doi: 10.1613/jair.953
27. Mohammed R, Rawashdeh J, Abdullah M. Machine Learning with Oversampling and Undersampling Techniques: Overview Study and Experimental Results. In: 11th International Conference on Information and Communication Systems (ICICS). Irbid (2020). p. 243–8. doi: 10.1109/ICICS49469.2020.239556
28. Qayyum A, Qadir J, Bilal M, Al-Fuqaha A. Secure and robust machine learning for healthcare: a survey. IEEE Rev Biomed Eng. (2021) 14:156–80. doi: 10.1109/RBME.2020.3013489
29. Birkes D. Likelihood Ratio. In:Armitage P, and Colton T, , editors. Encyclopedia of Biostatistics. Chichester: John Wiley & Sons. (2005). doi: 10.1002/0470011815.b2a15073
30. Pickering J, Endre Z. New metrics for assessing diagnostic potential of candidate biomarkers. Clin J Am Soc Nephrol CJASN. (2012) 7:1355–64. doi: 10.2215/CJN.09590911
31. Nichols T, Holmes A. Nonparametric permutation tests for functional neuroimaging: a primer with examples. Hum Brain Mapp. (2002) 15:1–25. doi: 10.1002/hbm.1058
32. Lundberg SM, Lee S-I. A Unified Approach to Interpreting Model Predictions. In:Guyon I, Luxburg UV, Bengio S, Wallach H, Fergus R, Vishwanathan S, Garnett R, , editors. Advances in Neural Information Processing Systems 30: Annual Conference on Neural Information Processing Systems 2017. Long Beach, CA: Curran Associates, Inc. (2017). p. 4765–4774.
33. Shapley LS. Notes on the n-Person Game — II: The Value of an n-Person Game. Santa Monica, CA: RAND Corporation. (1951).
34. Lundberg SM, Nair B, Vavilala MS, Horibe M, Eisses MJ, Adams T, et al. Explainable machine-learning predictions for the prevention of hypoxaemia during surgery. Nat Biomed Eng. (2018) 2:749. doi: 10.1038/s41551-018-0304-0
35. Leśniak M, Bak T, Czepiel W, Seniów J, Członkowska A. Frequency and prognostic value of cognitive disorders in stroke patients. Dement Geriatr Cogn Disord. (2008) 26:356–63. doi: 10.1159/000162262
36. Hackett ML, Pickles K. Part I: frequency of depression after stroke: an updated systematic review and meta-analysis of observational studies. Int J Stroke. (2014) 9:1017–25. doi: 10.1111/ijs.12357
37. Wouters A, Nysten C, Thijs VN, Lemmens R. Prediction of Outcome in Patients With Acute Ischemic Stroke Based on Initial Severity and Improvement in the First 24 h. Front Neurol. (2018) 9:308. doi: 10.3389/fneur.2018.00308
38. Kazi SA, Siddiqui M, Majid S. Stroke outcome prediction using admission nihss in anterior and posterior circulation stroke. J Ayub Med Coll Abbottabad JAMC. (2021) 2:274–8.
39. den Hertog HM, van Rossum JA, van der Worp HB, van Gemert HM, de Jonge R, Koudstaal PJ, et al. C-reactive protein in the very early phase of acute ischemic stroke: association with poor outcome and death. J Neurol. (2009) 256:2003–8. doi: 10.1007/s00415-009-5228-x
40. Sun W, Huang Y, Xian Y, Zhu S, Jia Z, Liu R, et al. Association of body mass index with mortality and functional outcome after acute ischemic stroke. Sci Rep. (2017) 7:2507. doi: 10.1038/s41598-017-02551-0
41. Cioncoloni D, Piu P, Tassi R, Acampa M, Guideri F, Taddei S, et al. Relationship between the modified Rankin Scale and the Barthel Index in the process of functional recovery after stroke. NeuroRehabilitation. (2012) 30:315–22. doi: 10.3233/NRE-2012-0761
42. Musa KI, Keegan TJ. The change of Barthel Index scores from the time of discharge until 3-month post-discharge among acute stroke patients in Malaysia: a random intercept model. PLoS ONE. (2018) 13:e0208594. doi: 10.1371/journal.pone.0208594
43. Crum RM, Anthony JC, Bassett SS, Folstein MF. Population-based norms for the Mini-Mental State Examination by age and educational level. JAMA. (1993) 269:2386–91. doi: 10.1001/jama.1993.03500180078038
44. Lee M, Oh MS, Jung S, Lee JH, Kim CH, Jang MU, et al. Differential effects of body mass index on domain-specific cognitive outcomes after stroke. Sci Rep. (2021) 11:14168. doi: 10.1038/s41598-021-93714-7
45. Casanova R, Saldana S, Lutz MW, Plassman BL, Kuchibhatla M, Hayden KM. Investigating predictors of cognitive decline using machine learning. J Gerontol B Psychol Sci Soc Sci. (2020) 75:733–42. doi: 10.1093/geronb/gby054
46. Aschwanden D, Aichele S, Ghisletta P, Terracciano A, Kliegel M, Sutin AR, et al. Predicting cognitive impairment and dementia: a machine learning approach. J Alzheimers Dis. (2020) 75:717–28. doi: 10.3233/JAD-190967
47. Shi Y, Yang D, Zeng Y, Wu W. Risk factors for post-stroke depression: a meta-analysis. Front Aging Neurosci. (2017) 9:218. doi: 10.3389/fnagi.2017.00218
48. Xu Q, Anderson D, Lurie-Beck J. The relationship between abdominal obesity and depression in the general population: a systematic review and meta-analysis. Obes Res Clin Pr. (2011) 5:267–360. doi: 10.1016/j.orcp.2011.04.007
49. Poynter B, Shuman M, Diaz-Granados N, Kapral M, Grace SL, Stewart DE. Sex differences in the prevalence of post-stroke depression: a systematic review. Psychosomatics. (2009) 50:563–9. doi: 10.1016/S0033-3182(09)70857-6
50. Hama S, Yoshimura K, Yanagawa A, Shimonaga K, Furui A, Soh Z, et al. Relationships between motor and cognitive functions and subsequent post-stroke mood disorders revealed by machine learning analysis. Sci Rep. (2020) 10:19571. doi: 10.1038/s41598-020-76429-z
51. Cawley GC, Talbot NLC. On over-fitting in model selection and subsequent selection bias in performance evaluation. J Mach Learn Res. (2010) 11:2079–107. Available online at: https://ueaeprints.uea.ac.uk/id/eprint/3640
52. Krstajic D, Buturovic LJ, Leahy DE, Thomas S. Cross-validation pitfalls when selecting and assessing regression and classification models. J Cheminform. (2014) 6:10. doi: 10.1186/1758-2946-6-10
53. Mehrabi N, Morstatter F, Saxena N, Lerman K, Galstyan A. A survey on bias and fairness in machine learning. ACM Comput Surv. (2021) 54:1–35. doi: 10.1145/3457607
54. Rajkomar A, Oren E, Chen K, Dai AM, Hajaj N, Hardt M, et al. Scalable and accurate deep learning with electronic health records. Npj Digit Med. (2018) 1:18. doi: 10.1038/s41746-018-0029-1
55. Wang A, Pednekar N, Lehrer R, Todo A, Sahni R, Marks S, et al. DRAGON score predicts functional outcomes in acute ischemic stroke patients receiving both intravenous tissue plasminogen activator and endovascular therapy. Surg Neurol Int. (2017) 8:149. doi: 10.4103/2152-7806.210993
56. Saposnik G. An integer-based score to predict functional outcome in acute ischemic stroke: the ASTRAL score. Neurology. (2012) 79:2293–4. doi: 10.1212/WNL.0b013e31827a3c0a
57. Chander RJ, Lam BYK, Lin X, Ng AYT, Wong APL, Mok VCT, et al. Development and validation of a risk score (CHANGE) for cognitive impairment after ischemic stroke. Sci Rep. (2017) 7:12441. doi: 10.1038/s41598-017-12755-z
58. Kandiah N, Chander RJ, Lin X, Ng A, Poh YY, Cheong CY, et al. Cognitive Impairment after Mild Stroke: Development and Validation of the SIGNAL2 Risk Score. J Alzheimers Dis. (2016) 49:1169–77. doi: 10.3233/JAD-150736
59. Saposnik G, Kapral MK, Liu Y, Hall R, O'Donnell M, Raptis S, et al. IScore: a risk score to predict death early after hospitalization for an acute ischemic stroke. Circulation. (2011) 123:739–49. doi: 10.1161/CIRCULATIONAHA.110.983353
60. O'Donnell MJ, Fang J, D'Uva C, Saposnik G, Gould L, McGrath E, et al. The PLAN score: a bedside prediction rule for death and severe disability following acute ischemic stroke. Arch Intern Med. (2012) 172:1548–56. doi: 10.1001/2013.jamainternmed.30
61. Sutton RT, Pincock D, Baumgart DC, Sadowski DC, Fedorak RN, Kroeker KI. An overview of clinical decision support systems: benefits, risks, and strategies for success. Npj Digit Med. (2020) 3:17. doi: 10.1038/s41746-020-0221-y
62. das Nair R, Cogger H, Worthington E, Lincoln NB. Cognitive rehabilitation for memory deficits after stroke. Cochrane Database Syst Rev. (2016) 9:CD002293. doi: 10.1002/14651858.CD002293.pub3
Keywords: stroke, machine learning, outcome prediction, post-stroke depression, mortality, functional outcome, cognitive impairment
Citation: Fast L, Temuulen U, Villringer K, Kufner A, Ali HF, Siebert E, Huo S, Piper SK, Sperber PS, Liman T, Endres M and Ritter K (2023) Machine learning-based prediction of clinical outcomes after first-ever ischemic stroke. Front. Neurol. 14:1114360. doi: 10.3389/fneur.2023.1114360
Received: 02 December 2022; Accepted: 31 January 2023;
Published: 21 February 2023.
Edited by:
Nishant K. Mishra, Yale University, United StatesReviewed by:
Amit Mehndiratta, Indian Institute of Technology Delhi, IndiaShubham Misra, Yale University, United States
Copyright © 2023 Fast, Temuulen, Villringer, Kufner, Ali, Siebert, Huo, Piper, Sperber, Liman, Endres and Ritter. This is an open-access article distributed under the terms of the Creative Commons Attribution License (CC BY). The use, distribution or reproduction in other forums is permitted, provided the original author(s) and the copyright owner(s) are credited and that the original publication in this journal is cited, in accordance with accepted academic practice. No use, distribution or reproduction is permitted which does not comply with these terms.
*Correspondence: Kerstin Ritter,  a2Vyc3Rpbi5yaXR0ZXJAY2hhcml0ZS5kZQ==