Abstract
Objective:
The study aimed to investigate the differences in clinical features between pediatric and adult patients with first-episode MOG-IgG associated disorders (MOGAD) and evaluate the relationship between the fibrinogen-to-albumin ratio (FAR) and the severity of neurological deficits at disease onset.
Methods:
We retrospectively collected and analyzed biochemical test results, imaging characteristics, clinical manifestations, expanded disability status scale (EDSS) score, and FAR. The Spearman correlation analysis and logistic regression models were used to examine the association between FAR and severity. Receiver operating characteristic (ROC) curve analysis was to analyze the predictive ability of FAR for the severity of neurological deficits.
Results:
Fever (50.0%), headache (36.1%), and blurred vision (27.8%) were the most common clinical manifestations in the pediatric group (<18 years old). However, in the adult group (≥18 years old), the most common symptoms were blurred vision (45.7%), paralysis (37.0%), and paresthesia (32.6%). Fever was more common in the pediatric group, while paresthesia was more common in the adult patients, with all differences statistically significant (P < 0.05). The most frequent clinical phenotype in the pediatric group was acute disseminated encephalomyelitis (ADEM; 41.7%), whereas optic neuritis (ON; 32.6%) and transverse myelitis (TM; 26.1%) were more common in the adult group. The differences in clinical phenotype between the two groups were statistically significant (P < 0.05). In both pediatric and adult patients, cortical/subcortical and brainstem lesions were the most common lesions on cranial magnetic resonance imaging (MRI), whereas, for spinal MRI, cervical and thoracic spinal cord lesions were the most commonly observed. According to binary logistic regression analysis, FAR was an independent risk factor for the severity of neurological deficits (odds ratio = 1.717; 95% confidence interval = 1.191–2.477; P = 0.004). FAR (r = 0.359, P = 0.001) was positively correlated with the initial EDSS score. The area under the ROC curve was 0.749.
Conclusion:
The current study found age-dependent phenotypes in MOGAD patients as ADEM was more commonly observed in patients < 18 years old, while ON and TM were more frequently found in patients ≥18 years old. A high FAR level was an independent indicator for more severe neurological deficits at disease onset in patients with a first episode of MOGAD.
1. Introduction
Myelin oligodendrocyte glycoprotein (MOG) is produced by oligodendrocytes, which are the myelin-forming cells of the central nervous system (CNS). MOG is preferentially expressed on the outermost layers of the myelin sheath and surface of the oligodendrocytes, accounting for about 0.05% of the total myelin proteins, and it is also a vital surface marker of oligodendrocyte maturation (1, 2). Its specific location on the outermost layer of the myelin sheath makes it a potential target for autoimmune antibodies and cell-mediated responses during demyelination (2, 3). The MOG antibody is a subtype of immunoglobulin (Ig)G1 that can effectively regulate complement-dependent cytotoxicity. MOG-IgG associated disorders (MOGAD), which is an inflammatory demyelinating disease of the CNS, is mediated by anti-MOG antibodies. MOGAD phenotypes vary and include optic neuritis (ON), transverse myelitis (TM), acute disseminated encephalomyelitis (ADEM), and meningeal/brainstem encephalitis. Although the clinical presentation of this disease sometimes resembles neuromyelitis optica spectrum disorders (NMOSD), MOGAD is definitely considered a distinct disease with immunopathological features markedly different from those of multiple sclerosis (MS) and NMOSD (4, 5). A growing body of research suggests that MOGAD is an individual spectrum of disease (4–7). In 2018, MOGAD was internationally recommended as an independent disease (8, 9). Recently, international MOGAD panel have proposed diagnostic criteria for MOGAD (10).
Fibrinogen (FIB) is a 340-kDa soluble glycoprotein synthesized by hepatocytes (11, 12). It is not only an essential component of the coagulation cascade response but also an acute-phase reactant that reflects the systemic inflammatory state (13, 14). Albumin (ALB), also synthesized in the liver, is the most abundant protein in the plasma and has significant anti-inflammatory activity (15, 16). FIB and ALB are widely used as essential markers in the response against systemic inflammation and hemorheological changes, while the FIB-to-ALB ratio (FAR) includes these two indicators, which is a valuable serological index. As reported, FAR may serve as a valuable systemic inflammatory and disease activity marker in autoimmune diseases, such as rheumatoid arthritis (17). Therefore, based on the combined analysis of FIB and ALB, we hypothesized that FAR could be used as a predictor for the severity of neurological deficits at disease onset in patients with the first episode of MOGAD.
This study analyzed the clinical, laboratory, and magnetic resonance imaging (MRI) characteristics of patients with first-attack MOGAD. This study investigated the relationship between FAR and severity at disease onset and the predictive value of FAR to identify and judge the severity of the disease at an early stage. Our results provide a basis for subsequent standardized treatment and management.
2. Materials and methods
2.1. Study cohort
Data from 82 MOGAD patients admitted to the First Affiliated Hospital of Zhengzhou University between January 2018 and June 2022 were analyzed in this retrospective study.
All MOGAD patients included in this study met the international recommendations of Jarius et al. (8) for the diagnosis of MOG encephalomyelitis: (1) positive serum MOG-IgG test based on live cell-based assays (CBA) using full-length human MOG as a target antigen; (2) presence of one or a combination of the following clinical manifestations: ON, TM, encephalitis or meningoencephalitis, and brainstem encephalitis; (3) MRI or electrophysiological (visual-evoked potentials in patients with isolated ON) findings related to CNS demyelination; (4) exclusion of alternative diagnoses. The following exclusion criteria were applied: non-first episode MOGAD, patients with previous diseases that severely affected motor ability and visual function (e.g., trauma and acute cerebrovascular disease), use of corticosteroids or immunosuppressive therapies within 3 months prior to admission, complicated serious diseases (e.g., liver disease, renal disease, cardiovascular disease, and malignant tumor), and patients who were double positive for anti-MOG-IgG and anti-aquaporin-4 (AQP-4)-IgG antibodies.
This study was approved by the Ethics Committee of the First Affiliated Hospital of Zhengzhou University. We strictly complied with the Declaration of Helsinki and anonymized all patient data.
2.2. Clinical data collection
Clinical information, laboratory results, and radiological records were collected and documented, including age at onset, sex, clinical presentations, laboratory tests (routine blood tests, coagulation tests, liver function, renal function, blood lipids, and cerebrospinal fluid analysis), MRI findings at admission, and expanded disability status scale (EDSS) scores at admission and discharge. FAR was calculated using the following formula: FIB × 100%/ALB.
Patients were categorized into pediatric (<18 years old) and adult (≥18 years old) groups based on age at disease onset. Differences in clinical, laboratory, and imaging characteristics between the two groups were analyzed. Patients were then divided into mild-to-moderate and severe groups according to the initial EDSS score (≤3 or >3, respectively) to investigate predictive factors that may affect the severity of neurological deficits at the time of disease onset.
The severity of neurological deficits in patients with MOGAD was evaluated using the EDSS score, which ranges between 0 and 10, with higher scores indicating more severe disability. Scanning was performed using a 3.0 T MRI scanner. Blood samples were collected from patients during the early morning of the second day after admission. Antibodies against MOG, AQP4, and autoimmune encephalitis-related antibodies from blood or CSF samples were detected using CBA. We assumed that the MOG status was positive when antibody titers were higher than 1:10. Anti-MOG antibody titers varied from 1:10 to 1:1,000++. Antibody titers >1:1,000 were described as 1:1,000+ or 1:1,000++.
2.3. Statistical analyses
Continuous data conforming to normal distribution were expressed as mean ± standard deviation; otherwise, they were shown as median ± interquartile range. Categorical variables were presented as frequencies (percentages, %). When continuous data were normally distributed, a t-test for independent samples was used for comparisons between the groups. When data were not normally distributed, the Mann–Whitney U-test was used for comparison between the groups. Categorical data were compared using the chi-square test or Fisher's exact test. To investigate the relationship between FAR and disease severity, we performed binary logistic regression and correlation analysis: a univariate logistic regression analysis model was used to identify potential predictors for the severity of neurological deficits at disease onset, and multivariate logistic regression analysis was performed to determine the independent effect of FAR on the severity of neurological deficits at the onset of MOGAD; the basic model of multivariate logistic regression analysis included variables with a significance level of P < 0.1 in the univariate logistic regression analysis. The adjusted model included variables that are clinically considered to affect initial EDSS (including age at onset and sex) to analyze the stability of the correlation between the FAR level and severity of neurological deficits. The Spearman correlation analysis was used to detect the correlation between FAR and EDSS scores. The diagnostic value of FAR for the severity of neurological deficits was analyzed using receiver operating characteristic (ROC) curve analysis and the area under the curve (AUC). A P-value of < 0.05 was considered to be statistically significant. The Statistical Package for the Social Sciences 21.0 version software was used for statistical analysis.
3. Results
3.1. Demographic and clinical characteristics
As shown in Table 1, 82 patients (women, n = 38; men, n = 44) meeting the inclusion criteria were included. The mean age at disease onset was 20.00 (9.00, 33.00) years old, and the first MOGAD attack age was 1–64 years old. There were 36 patients in the pediatric group (<18 years old), and 15 (41.7%) were girls. The adult group (≥18 years old) comprised of 46 patients and 23 (50%) were women. The difference in sex between the two groups was not statistically significant (P > 0.05). The clinical manifestations of this disease were diverse. Comparison between the groups showed that the incidence of fever was higher in patients <18 years old than in patients ≥18 years old, and the difference was statistically significant (P < 0.05); paresthesia was more common in patients ≥18 years old than in patients <18 years old, and the difference was statistically significant (P < 0.05). The remaining clinical manifestations were not statistically different between the two groups (P > 0.05). Among the clinical phenotypes, ADEM was more common in the pediatric group (41.7%), and ON or TM was more frequent in the adult group (32.6%, 26.1%). The differences between the two groups were statistically significant (P < 0.05). The initial and discharge EDSS scores were not significantly different between the two groups (P > 0.05; Table 1).
Table 1
| Clinical characteristics | Participants (n = 82) | Pediatric group (n = 36) | Adult group (n = 46) | χ2/Z | P-value |
|---|---|---|---|---|---|
| Age | 20.00 (9.00–33.00) | 8.00 (5.25–14.00) | 31.00 (25.00–41.00) | −7.740 | < 0.001 |
| Sex, female | 38 (46.3%) | 15 (41.7%) | 23 (50.0%) | 0.564 | 0.453 |
| Clinical manifestations | |||||
| Paresthesia | 19 (23.20%) | 4 (11.1%) | 15 (32.6%) | 5.243 | 0.022 |
| Paralysis | 26 (31.7%) | 9 (25.0%) | 17 (37.0%) | 1.333 | 0.248 |
| Bladder/bowel dysfunction | 14 (17.1%) | 3 (8.3%) | 11 (23.9%) | 3.462 | 0.063 |
| Blurred vision | 31 (37.8%) | 10 (27.8%) | 21 (45.7%) | 2.744 | 0.098 |
| Eye pain | 11 (13.4%) | 6 (16.7%) | 5 (10.9%) | 0.192 | 0.661 |
| Nausea/vomiting | 10 (12.2%) | 7 (19.4%) | 3 (6.5%) | 2.058 | 0.151 |
| Fever | 27 (32.9%) | 18 (50.0%) | 9 (19.6%) | 8.470 | 0.004 |
| Headache | 27 (32.9%) | 13 (36.1%) | 14 (30.4%) | 0.295 | 0.587 |
| Dysarthria | 2 (2.4%) | 2 (5.6%) | 0 | 0.190 | |
| Facial paralysis | 7 (8.5%) | 4 (11.1%) | 3 (6.5%) | 0.116 | 0.734 |
| Disturbance of consciousness | 6 (7.3%) | 3 (8.3%) | 3 (6.5%) | 0.000 | > 0.999 |
| Seizures | 17 (20.7%) | 9 (25.0%) | 8 (17.4%) | 0.711 | 0.399 |
| Clinical phenotype | |||||
| ON | 19 (23.2%) | 4 (11.1%) | 15 (32.6%) | 5.243 | 0.022 |
| TM | 14 (17.1%) | 2 (5.6%) | 12 (26.1%) | 6.013 | 0.014 |
| ON+TM | 9 (11.0%) | 4 (11.1%) | 5 (10.9%) | 0.000 | > 0.999 |
| Meningeal/brainstem encephalitis | 19 (23.2%) | 11 (30.6%) | 8 (17.4%) | 1.966 | 0.161 |
| ADEM | 21 (25.6%) | 15 (41.7%) | 6 (13.0%) | 8.685 | 0.003 |
| EDSS | |||||
| Initial EDSS | 3.5 (2.0–4.625) | 3.5 (2.0–4.5) | 3.25 (2.5–5.0) | −0.522 | 0.601 |
| Discharge EDSS | 2.0 (0.0–3.0) | 1.75 (0.0–2.88) | 2.0 (0.0–3.125) | −0.801 | 0.423 |
Clinical characteristics of patients in different age groups.
Values are presented as mean ± standard deviation, number (percentage), or median (interquartile range).
ADEM, acute disseminated encephalomyelitis; ON, optic neuritis; TM, transverse myelitis; EDSS, expanded disability status scale.
Statistical significance with a two-sided P-value of < 0.05.
Bold it when P-value < 0.05.
3.2. Laboratory examinations
Neutrophil count, prothrombin time (PT), activated partial thromboplastin time (aPTT), and globulin levels were significantly higher in pediatric patients than in adult patients (P < 0.05). Thrombin time (TT) and urea were significantly higher in patients ≥18 years old than in those <18 years old (P < 0.05; Table 2). A total of eight (22.2%) patients <18 years old had positive CSF oligoclonal bands (OBs), compared with five (10.9%) patients ≥18 years old, with no significant between-group difference (P > 0.05). Anti-N-methyl-D-aspartate receptor (anti-NMDAR) antibodies were present in the first episode of MOGAD in two (5.6%) patients in the pediatric group and five patients (10.9%) in the adult group, with no statistically significant difference between the two groups (P > 0.05; Table 2).
Table 2
| Variables | Participants (n = 82) | Pediatric group (n = 36) | Adult group (n = 46) | χ2/Z/t | P-value |
|---|---|---|---|---|---|
| Neutrophil count (×109/L) | 5.46 (3.78–8.52) | 6.57 (4.55–10.28) | 4.91 (3.61–7.41) | −2.518 | 0.012 |
| Lymphocyte count (×109/L) | 1.95 (1.25–2.52) | 2.01 (1.29–2.85) | 1.90 (1.22–2.42) | −0.762 | 0.446 |
| Monocyte count (×109/L) | 0.47 (0.36–0.66) | 0.45 (0.31–0.70) | 0.47 (0.36–0.62) | −0.033 | 0.974 |
| Eosinophil count (×109/L) | 0.09 (0.03–0.17) | 0.09 (0.01–0.21) | 0.08 (0.03–0.15) | −0.145 | 0.885 |
| PT (s) | 11.20 (10.60–11.59) | 11.43 (10.95–12.00) | 11.10 (10.50–11.40) | −3.036 | 0.002 |
| aPTT (s) | 29.20 (27.70–31.81) | 29.91 (28.14–32.89) | 28.50 (27.10–31.38) | −1.991 | 0.047 |
| TT (s) | 15.41 ± 1.88 | 14.84 ± 1.43 | 15.86 ± 2.08 | −2.634 | 0.010 |
| Fibrinogen (g/L) | 3.16 ± 0.77 | 3.34 ± 0.77 | 3.01 ± 0.75 | 1.909 | 0.060 |
| D-dimer (mg/L) | 0.13 (0.07–0.21) | 0.12 (0.07–0.23) | 0.16 (0.07–0.19) | −0.070 | 0.944 |
| TC (mmol/L) | 3.80 (3.31–4.35) | 3.82 (3.15–4.26) | 3.78 (3.44–4.66) | −0.916 | 0.360 |
| Triglycerides (mmol/L) | 0.94 (0.62–1.19) | 0.97 (0.55–1.13) | 0.92 (0.66–1.33) | −0.388 | 0.698 |
| HDL (mmol/L) | 1.09 (0.96–1.26) | 1.13 (0.99–1.25) | 1.03 (0.94–1.29) | −1.201 | 0.230 |
| LDL (mmol/L) | 2.26 (1.90–2.68) | 2.24 (1.86–2.61) | 2.31 (1.93–2.93) | −1.290 | 0.197 |
| Urea (mmol/L) | 4.00 ± 1.21 | 3.52 ± 1.10 | 4.39 ± 1.18 | −3.423 | 0.001 |
| UA (μmol/L) | 251.65 ± 84.39 | 235.72 ± 87.68 | 264.11 ± 80.49 | −1.524 | 1.131 |
| Albumin (g/L) | 42.26 ± 4.21 | 42.43 ± 3.74 | 42.12 ± 4.59 | 0.330 | 0.742 |
| Globulin (g/L) | 25.82 ± 3.29 | 26.79 ± 3.24 | 25.05 ± 3.16 | 2.442 | 0.017 |
| Positive oligoclonal band | 13 (15.9%) | 8 (22.2%) | 5 (10.9%) | 1.951 | 0.162 |
| CSF Anti-NMDAR antibody | 7 (8.5%) | 2 (5.6%) | 5 (10.9%) | 0.208 | 0.648 |
Laboratory data in different age groups.
Values are presented as mean ± standard deviation, number (percentage), or median (interquartile range).
CSF, cerebrospinal fluid; antiNMDAR, antiN-methyl-D-aspartate receptor; TC, total cholesterol; HDL, high-density lipoprotein cholesterol; LDL, low-density lipoprotein cholesterol; PT, Prothrombin time; TT, Thrombin time; aPTT, activated partial thromboplastin time; UA, uric acid.
Statistical significance with a two-sided P-value of < 0.05.
Bold it when P-value < 0.05.
3.3. Magnetic resonance imaging features
As shown in Table 3, 82 patients underwent cranial MRI in the acute stage, and patients <18 years old had significantly more lesions in the basal ganglia than those in patients ≥ 18 years old (P < 0.05). Spinal cord MRI was performed in 61 patients, among whom the cervical and thoracic segments of the spinal cord were more commonly involved, with no statistically significant difference in the distribution of lesions between the two groups (P > 0.05). As shown in Table 4, patients with EDSS > 3 had significantly more lesions in the brainstem and cerebellum than patients with EDSS ≤ 3 (P < 0.05).
Table 3
| Lesion location | Participants (n = 82) | Pediatric group (n = 36) | Adult group (n = 46) | χ2 | P-value |
|---|---|---|---|---|---|
| Optic nerve | 13 (15.9%) | 4 (11.1%) | 9 (19.6%) | 1.082 | 0.298 |
| Cortical/subcortical | 40 (48.8%) | 21 (58.3%) | 19 (41.3%) | 2.344 | 0.126 |
| Periventricular | 18 (22.0%) | 10 (27.8%) | 8 (17.4%) | 1.272 | 0.259 |
| Corpus callosum | 5 (6.1%) | 1 (2.8%) | 4 (8.7%) | 0.418 | 0.518 |
| Basal ganglia | 10 (12.2%) | 10 (27.8%) | 0 | 12.074 | 0.001 |
| Internal capsule | 1 (1.2%) | 0 | 1 (2.2%) | > 0.999 | |
| Thalamus | 17 (20.7%) | 10 (27.8%) | 7 (15.2%) | 1.939 | 0.164 |
| Hippocampus | 1 (1.2%) | 1 (2.8%) | 0 | 0.439 | |
| Brainstem | 25 (30.5%) | 13 (36.1%) | 12 (26.1%) | 0.958 | 0.328 |
| Cerebellum | 13 (15.9%) | 7 (19.4%) | 6 (13.0%) | 0.620 | 0.431 |
| Cervical spinal cord | 26/61 (42.6%) | 12/30 (40.0%) | 14/31 (45.2%) | 0.166 | 0.684 |
| Thoracic spinal cord | 24/61 (39.3%) | 14/30 (46.7%) | 10/31 (32.3%) | 1.326 | 0.249 |
| Lumbar spinal cord | 3/61 (4.9%) | 2/30 (6.7%) | 1/31 (3.2%) | 0.001 | 0.977 |
Localization of brain magnetic resonance imaging lesions in patients according to age groups.
Values are presented as number (percentage).
Statistical significance with a two-sided P-value of < 0.05.
Bold it when P-value < 0.05.
Table 4
| Lesion location | Participants (n = 82) | EDSS ≤ 3 (n = 40) | EDSS>3 (n = 42) | χ2 | P-value |
|---|---|---|---|---|---|
| Optic nerve | 13 (15.9%) | 5 (12.5%) | 8 (19.0%) | 0.658 | 0.417 |
| Cortical/subcortical | 40 (48.8%) | 21 (52.5%) | 19 (45.2%) | 0.432 | 0.511 |
| Periventricular | 18 (22.0%) | 11 (27.5%) | 7 (16.7%) | 1.403 | 0.236 |
| Corpus callosum | 5 (6.1%) | 2 (2.4%) | 3 (7.1%) | 0 | > 0.999 |
| Basal ganglia | 10 (12.2%) | 4 (10.0%) | 6 (14.3%) | 0.065 | 0.799 |
| Internal capsule | 1 (1.2%) | 0 | 1 (2.4%) | > 0.999 | |
| Thalamus | 17 (20.7%) | 6 (15.0%) | 11 (26.2%) | 1.561 | 0.211 |
| Hippocampus | 1 (1.2%) | 1 (2.5%) | 0 | 0.488 | |
| Brainstem | 25 (30.5%) | 8 (20.0%) | 17 (40.5%) | 4.053 | 0.044 |
| Cerebellum | 13 (15.9%) | 3 (7.5%) | 10 (23.8%) | 4.085 | 0.043 |
| Cervical spinal cord | 26/61 (42.6%) | 9/27 (33.3%) | 17/34 (50.0%) | 1.709 | 0.191 |
| Thoracic spinal cord | 24/61 (39.3%) | 9/27 (33.3%) | 15/34 (44.1%) | 0.733 | 0.392 |
| Lumbar spinal cord | 3/61 (4.9%) | 2/27 (7.4%) | 1/34 (2.9%) | 0.042 | 0.837 |
Localization of brain magnetic resonance imaging lesions in patients according to initial expanded disability status scale (EDSS) scores.
Values are presented as numbers (percentages).
Statistical significance with a two-sided P-value of < 0.05.
Bold it when P-value < 0.05.
3.4. The relationship between FAR and disease severity
As shown in Table 5, there was no significant difference between the two groups regarding sex, age at onset, neutrophil count, lymphocyte, monocyte, eosinophil, PT, aPTT, TT, D-dimer, total cholesterol (TC), triglyceride, low-density lipoprotein (LDL), urea, globulin, positive OBs, and positive anti-NMDAR antibodies (P > 0.05). The levels of ALB, uric acid (UA), and high-density lipoprotein (HDL) were significantly higher in patients with EDSS ≤ 3 than in those with EDSS >3, while the levels of FIB and FAR were significantly lower in patients with EDSS ≤ 3 than in those with EDSS >3 (P < 0.05).
Table 5
| Variables | EDSS ≤ 3 (n = 40) | EDSS >3 (n = 42) | χ2/Z/t | P-value |
|---|---|---|---|---|
| Sex, female | 16 (40.0) | 22(52.4) | 1.263 | 0.261 |
| Age, years | 20.00 (11.50–33.00) | 21.00 (6.00–33.25) | −0.719 | 0.472 |
| Neutrophil count (×109/L) | 5.32 (3.70–7.93) | 5.79 (4.12–9.25) | −0.974 | 0.330 |
| Lymphocyte count (×109/L) | 1.99 (1.52–2.43) | 1.87 (1.14–2.61) | −0.923 | 0.356 |
| Monocyte count (×109/L) | 0.46 (0.37–0.65) | 0.47 (0.31–0.67) | −0.548 | 0.584 |
| Eosinophil count (×109/L) | 0.10 (0.04–0.18) | 0.05 (0.01–0.18) | −1.255 | 0.209 |
| PT (s) | 11.25 (10.70–11.60) | 11.16 (10.60–11.52) | −0.576 | 0.565 |
| aPTT (s) | 28.85 (27.83–31.58) | 29.50 (27.28–32.00) | −0.747 | 0.455 |
| TT (s) | 15.51 ± 1.87 | 15.32 ± 1.92 | 0.470 | 0.640 |
| Fibrinogen (g/L) | 2.88 ± 0.66 | 3.42 ± 0.78 | −3.338 | 0.001 |
| D-dimer (mg/L) | 0.10 (0.07–0.19) | 0.17 (0.08–0.23) | −1.562 | 0.118 |
| TC (mmol/L) | 3.66 (3.18–4.22) | 3.97 (3.43–4.44) | −1.132 | 0.258 |
| Triglycerides (mmol/L) | 0.92 (0.57–1.08) | 0.96 (0.67–1.23) | −0.719 | 0.472 |
| HDL (mmol/L) | 1.12 (0.98–1.35) | 1.03 (0.88–1.18) | −2.00 | 0.046 |
| LDL (mmol/L) | 2.10 (1.87–2.53) | 2.49 (1.94–2.87) | −1.619 | 0.105 |
| Urea (mmol/L) | 4.21 ± 1.20 | 3.81 ± 1.21 | 1.522 | 0.132 |
| UA (μmol/L) | 271.43 ± 92.93 | 232.81 ± 71.49 | 2.115 | 0.038 |
| Albumin (g/L) | 43.40 ± 3.36 | 41.17 ± 4.68 | 2.467 | 0.016 |
| Globulin (g/L) | 26.02 ± 3.42 | 25.63 ± 3.20 | 0.529 | 0.598 |
| FAR (%) | 6.46 (5.66–7.74) | 7.78 (6.93–9.97) | −3.887 | < 0.001 |
| Positive oligoclonal band | 8 (20.0) | 5 (11.9) | 1.006 | 0.316 |
| CSF Anti-NMDAR antibody | 5 (12.5) | 2 (4.8) | 0.736 | 0.391 |
Laboratory data according to the initial expanded disability status scale (EDSS) score.
Data are presented as mean ± standard deviation, number (percentage), or median (interquartile range).
EDSS, Expanded Disability Status Scale; CSF, cerebrospinal fluid; anti-NMDAR, anti-N-methyl-D-aspartate receptor; TC, total cholesterol; HDL, high-density lipoprotein cholesterol; LDL, low-density lipoprotein cholesterol; PT, prothrombin time; TT, thrombin time; aPTT, activated partial thromboplastin time; UA, uric acid; FAR, fibrinogen-to-albumin ratio.
Statistical significance with a two-sided P-value of < 0.05.
Bold it when P-value < 0.05.
As shown in Table 6, univariate logistic regression analysis showed that FIB (odds ratio (OR) = 2.900; 95% confidence interval CI = 1.438–5.849; P = 0.003), ALB (OR = 0.871; 95% CI = 0.774–0.979; P = 0.020), uric acid (OR = 0.994; 95% CI = 0.989–1.000; P = 0.042), HDL levels (OR = 0.171; 95% CI = 0.029–0.993; P = 0.049), and FAR (OR = 1.827; 95% CI = 1.302–2.564; P < 0.001) were significantly associated with the initial EDSS score.
Table 6
| Factors | Univariate logistic regression OR (95%CI) | P-value |
|---|---|---|
| Age, years | 0.993 (0.966–1.021) | 0.639 |
| Sex, female | 0.606 (0.252–1.455) | 0.262 |
| Neutrophils | 1.080 (0.955–1.222) | 0.222 |
| Lymphocytes | 0.801 (0.488–1.314) | 0.379 |
| Monocytes | 0.685 (0.120–3.912) | 0.670 |
| Eosinophils | 1.219 (0.082–18.124) | 0.885 |
| PT | 0.962 (0.862–1.073) | 0.487 |
| aPTT | 1.068 (0.959–1.189) | 0.231 |
| TT | 0.945 (0.750–1.192) | 0.635 |
| Fibrinogen | 2.900 (1.438–5.849) | 0.003 |
| D-dimer | 8.196 (0.298–225.488) | 0.214 |
| TC | 1.139 (0.699–1.855) | 0.602 |
| Triglycerides | 1.490 (0.648–3.428) | 0.348 |
| HDL | 0.171 (0.029–0.993) | 0.049 |
| LDL | 1.200 (0.669–2.151) | 0.541 |
| Urea | 0.751 (0.516–1.093) | 0.135 |
| UA | 0.994 (0.989–1.000) | 0.042 |
| Albumin | 0.871 (0.774–0.979) | 0.020 |
| Globulin | 0.964 (0.844–1.102) | 0.594 |
| FAR | 1.827 (1.302–2.564) | < 0.001 |
| Positive oligoclonal band | 0.541 (0.161–1.819) | 0.320 |
| CSF Anti-NMDAR antibody | 0.350 (0.064–1.919) | 0.227 |
Univariate logistic regression for assessing the association of fibrinogen-to-albumin ratio with disease severity.
FAR, fibrinogento-albumin ratio; CSF, cerebrospinal fluid; EDSS, expanded disability status scale scores; MOGAD, MOG-IgG associated disorders; OR, odds ratio; CI, confidence interval; TC, total cholesterol; HDL, high-density lipoprotein cholesterol; LDL, low-density lipoprotein cholesterol; PT, prothrombin time; TT, thrombin time; aPTT, activated partial thromboplastin time; UA, uric acid.
Statistical significance with a two-sided P-value of < 0.05.
Bold it when P-value < 0.05.
As shown in Table 7, FAR (OR = 1.693; 95% CI = 1.186–2.417; P = 0.004) was correlated with the initial EDSS score in the basic model corrected for other risk factors. In the adjusted model corrected for related factors (age at admission and sex), FAR was still independently associated with the severity of neurological deficits at the onset of MOGAD (OR = 1.717; 95% CI = 1.191–2.477; P = 0.004).
Table 7
| Factors | Multivariate logistic regression | |||
|---|---|---|---|---|
| Basic model a | Adjusted model b | |||
| OR (95%CI) | P -value | OR (95%CI) | P -value | |
| Sex, female | 0.552 (0.183–1.667) | 0.292 | ||
| Age at onset | 1.000 (0.967–1.033) | 0.987 | ||
| FAR | 1.693 (1.186–2.417) | 0.004 | 1.717 (1.191–2.477) | 0.004 |
| UA | 0.995 (0.989–1.002) | 0.149 | 0.997 (0.990–1.003) | 0.329 |
| HDL | 0.266 (0.037–1.897) | 0.187 | 0.233 (0.030–1.802) | 0.163 |
Multivariate logistic regression for assessing the association of fibrinogen-to-albumin ratio with disease severity.
FAR, fibrinogen-to-albumin ratio; UA, uric acid; HDL, high-density lipoprotein cholesterol; EDSS, expanded disability status scale; OR, odds ratio; CI, confidence interval.
Basic model: Variables with a P-value of < 0.1 in the univariate logistic regression analysis were included in the multivariate model.
Adjusted model: Variables with a P-value of < 0.1 in the univariate logistic regression analysis or variables clinically assumed to have an impact on initial EDSS (including age at onset and sex) were included in the adjusted model.
Statistical significance with a two-sided P-value of < 0.05.
Bold it when P-value < 0.05.
The Spearman correlation analysis revealed that FAR (r = 0.359, P = 0.001) and FIB (r = 0.257, P = 0.020) were positively correlated with the initial EDSS score, whereas ALB levels (r = −0.258, P = 0.019) were negatively correlated with the initial EDSS score (Figure 1).
Figure 1

(A) The correlation between albumin (ALB) levels and the initial expanded disability status scale (EDSS) scores is shown. (B) The correlation between fibrinogen (FIB) levels and the initial EDSS scores is shown. (C) The correlation between FIB-to-ALB ratio (FAR) levels and the initial EDSS scores is shown.
Figure 2 shows the association of FIB, ALB, and FAR with MOGAD severity at onset based on ROC curve analysis. When the ALB cut-off value was 43.15 g/L, the AUC was 0.665 (95% CI = 0.545–0.786, P = 0.010), with a sensitivity of 73.8% and specificity of 60%. At a FIB cutoff value of 3.035 g/L, the AUC was 0.694 (95% CI = 0.580–0.807, P = 0.003), with a sensitivity of 71.4% and specificity of 65%. The AUC was 0.749 (95% CI = 0.645–0.853, P < 0.001), with a sensitivity of 78.6% and specificity of 62.5% when the FAR cutoff value was 6.92%. The AUC of FAR was significantly higher than that of FIB and ALB.
Figure 2
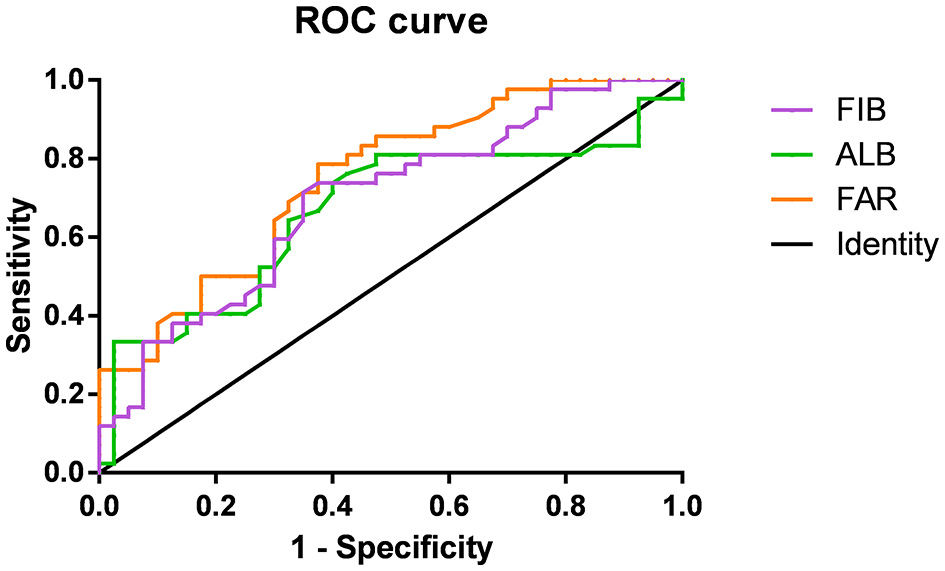
Receiver-operating characteristic (ROC) curves showing the association between fibrinogen (FIB; purple), albumin (ALB; green), FIB-to-ALB ratio (FAR; orange), and the severity of neurological dysfunction at the onset of MOG-IgG–Associated Disorders (MOGAD).
4. Discussion
In this study, a retrospective analysis was conducted to compare clinical, laboratory, and MRI findings between pediatric and adult patients with first-episode MOGAD and explore the risk factors that may predict severity at disease onset. Our study demonstrated that clinical features were different between patients of different ages. The most common disease spectrum in patients <18 years old was ADEM, whereas ON or TM was commonly found in patients ≥18 years old. Cortical/paracortical lesions were the most common lesions in both pediatric and adult patients. The FAR level at admission was significantly associated with the severity of neurological deficits. FAR has a good clinical value for assessing the severity of first-episode MOGAD.
The sex difference between MOGAD patients in this study was not statistically significant, and the male-to-female ratio was 1.16:1, which is consistent with previous studies, and these studies have shown a male-to-female ratio of approximately 1:1 (18), which differs from the female bias often observed in other immune-mediated/autoimmune diseases, including AQP4-IgG + NMOSD (1:9.2) and MS (1:3) (19–21). In the present study, the most common clinical phenotype at onset in patients ≥18 years old was ON, and ADEM was the most common phenotype in the pediatric group, which was consistent with previous studies (20, 22, 23). Cortical/paracortical lesions on encephalic MRI in patients were the most common lesions observed, while spinal cord injuries in this study mainly involved the cervical or thoracic segments, consistent with previous studies (7, 25). In the current study, the incidence of OBs was 15.9%, which was consistent with previous studies (<20%) (7, 20).
Autoimmune encephalitis (AE) causes severe neurologic symptoms in patients of all ages, and advances in AE diagnosis have led to the identification of more antibodies causing brain inflammation, so antibodies to MOG and NMDAR have been reported with increasing frequency in AE (24). In this study, the incidence of anti-NMDAR antibody positivity was 8.5%, which is similar to that reported in previous studies (25), and none of them met the diagnostic criteria for anti-NMDAR AE.
In this study, correlation analysis showed that FIB, ALB, and FAR were all correlated with the initial EDSS score, and binary logistic regression analysis showed that FAR was an independent risk factor for the severity of MOGAD. ROC curve analysis showed that FAR was a good indicator for assessing the severity of disease at admission.
Fibrinogen can enter the CNS after the destruction of the blood–brain barrier (BBB) and is related to neuroinflammation, neuronal injury, and immune cell recruitment in the nervous system. Fibrin is a crucial factor in inflammatory demyelination, neurodegeneration, and inhibition of CNS repair (26). At sites of BBB disruption, FIB is converted to inflammatory fibrin, which can induce the release of reactive oxygen species (ROS) and M1-like activation of microglia and macrophages (14, 27). In animal models of MS, FIB enters the CNS parenchyma via the damaged BBB, which is deposited in the form of insoluble fibrin in the brain tissue (11) and binds to the CD11b/CD18 integrin receptor, which induces ROS release in the microglia and recruitment of peripheral macrophages and T cells, leading to autoimmune demyelination and axonal destruction (14, 26–28). FIB is a potent exogenous inhibitor of oligodendrocyte progenitor cell differentiation and remyelination (29). Destruction of BBB in the acute phase of MOGAD suggests that FIB may contribute to the acute inflammatory response through BBB. The level of FIB is positively correlated with the severity of the inflammatory response and disease. A correlation was found between FIB levels and the severity of coronary lesions in patients with the acute coronary syndrome (30). In addition, FIB levels in patients with NMOSD were correlated with disease severity (31).
Albumin is associated with several critical physiological functions, such as the maintenance of plasma colloid oncotic pressure, regulation of microvascular permeability, metabolism, lipid transport, antioxidant, anti-inflammatory effect, and immunomodulatory effect (16, 32, 33). ALB is thought to be associated with many neurological disorders because of its ability to modulate the hemodynamic properties of the cerebral circulation and its direct neuroprotective functions in the neuronal and glial cells. In experimental ischemic stroke models, exogenous human serum ALB is neuroprotective by promoting amelioration of brain swelling, preventing postischemic thrombosis, antioxidation, hemodilution, and improving microvascular hemoperfusion to increase the perfusion volume of the ischemic tissue. In experimental models of Alzheimer's disease, it is thought to be neuroprotective by inhibiting aggregation and enhancing the clearance of β-amyloid (16). ALB is a valuable biomarker for several diseases. Studies have found that a lower ALB level was associated with an increased risk of mortality in cardiovascular disease and carotid atherosclerosis (34, 35). Low ALB levels were also observed in some autoimmune diseases of the nervous system, such as Guillain–Barre syndrome, myasthenia gravis, and NMOSD (36–38).
Fibrinogen and ALB are vital factors in the coagulation system and reliable indicators for nutritional status and inflammation. FAR, which incorporates these two indicators, may have a better predictive value than any single biomarker. As a novel inflammatory serological marker, FAR has promising predictive ability in a variety of diseases, such as various tumors (pancreatic, esophageal, and liver cancers) (39–41), cardiovascular diseases (30, 42), and in estimating the risk of hemorrhagic transformation in patients with acute ischemic stroke (43). However, a study including 40 patients with MS found no statistically significant correlation between the mean EDSS score and peripheral blood FAR (P > 0.05) (44). The relationship between peripheral blood FAR and inflammatory demyelinating diseases of the CNS requires further exploration.
This study had several limitations. First, as a retrospective study, the number of patients included was relatively small. Data were acquired from a single center and region, which may inevitably lead to subjective selection bias. Second, our study only included results from the early stage of admission, and long-term prognostic information was limited. Long-term follow-up data must be refined. Third, this study recorded the FAR level only once at the time of admission, and studies examining the dynamic changes of FAR over time are limited.
In summary, the present study showed that the clinical and imaging manifestations of MOGAD differed between patients of different ages. Patients with EDSS ≤ 3 had significantly lower FAR levels than those with EDSS >3, and FAR was positively correlated with the initial EDSS score. In addition, the potential role of FIB and ALB in disease progression may be used clinically to provide new treatment approaches against the disease. Detection of FAR is simple, noninvasive, and reproducible and is expected to become a relatively novel and reliable laboratory indicator for assessing the severity at disease onset in patients with first-episode MOGAD.
Statements
Data availability statement
The raw data supporting the conclusions of this article will be made available by the authors, without undue reservation.
Ethics statement
The studies involving human participants were reviewed and approved by the Ethics Committee of First Affiliated Hospital of Zhengzhou University. Written informed consent for participation was not required for this study in accordance with the national legislation and the institutional requirements. Written informed consent was not obtained from the individual(s), nor the minor(s)' legal guardian/next of kin, for the publication of any potentially identifiable images or data included in this article.
Author contributions
YL contributed to the project conception, performed the statistical analysis, and wrote the manuscript. SW interpreted the data and prepared the figures. PL and JM screened and extracted the data. XL and JY supervised this study. All authors have made intellectual contributions to the manuscript and have approved of its submission.
Acknowledgments
We thank all study participants and the clinical staff at the hospital for their support and contribution to this project.
Conflict of interest
The authors declare that the research was conducted in the absence of any commercial or financial relationships that could be construed as a potential conflict of interest.
Publisher’s note
All claims expressed in this article are solely those of the authors and do not necessarily represent those of their affiliated organizations, or those of the publisher, the editors and the reviewers. Any product that may be evaluated in this article, or claim that may be made by its manufacturer, is not guaranteed or endorsed by the publisher.
References
1.
Johns TG Bernard CC . The structure and function of myelin oligodendrocyte glycoprotein. J Neurochem. (1999) 72:1–9. 10.1046/j.1471-4159.1999.0720001.x
2.
Quarles RH . Myelin sheaths: glycoproteins involved in their formation, maintenance and degeneration. Cell Mol Life Sci. (2002) 59:1851–71. 10.1007/PL00012510
3.
Ambrosius W Michalak S Kozubski W Kalinowska A . Myelin oligodendrocyte glycoprotein antibody-associated disease: current insights into the disease pathophysiology, diagnosis and management. Int J Mol Sci. (2020) 22:100. 10.3390/ijms22010100
4.
Cobo-Calvo Á Ruiz A D'Indy H Poulat AL Carneiro M Philippe N et al . MOG antibody-related disorders: common features and uncommon presentations. J Neurol. (2017) 264:1945–55. 10.1007/s00415-017-8583-z
5.
Takai Y Misu T Kaneko K Chihara N Narikawa K Tsuchida S et al . Myelin oligodendrocyte glycoprotein antibody-associated disease: an immunopathological study. Brain. (2020) 143:1431–46. 10.1093/brain/awaa102
6.
Jarius S Ruprecht K Kleiter I Borisow N Asgari N Pitarokoili K et al . MOG-IgG in NMO and related disorders: a multicenter study of 50 patients. Part 1: frequency, syndrome specificity, influence of disease activity, long-term course, association with Aqp4-IgG, and origin. J Neuroinflammation. (2016) 13:279. 10.1186/s12974-016-0717-1
7.
Jarius S Ruprecht K Kleiter I Borisow N Asgari N Pitarokoili K et al . MOG-IgG in Nmo and related disorders: a multicenter study of 50 patients. Part 2: epidemiology, clinical presentation, radiological and laboratory features, treatment responses, and long-term outcome. J Neuroinflammation. (2016) 13:280. 10.1186/s12974-016-0718-0
8.
Jarius S Paul F Aktas O Asgari N Dale RC de Seze J et al . Mog encephalomyelitis: international recommendations on diagnosis and antibody testing. J Neuroinflammation. (2018) 15:134. 10.1186/s12974-018-1144-2
9.
López-Chiriboga AS Majed M Fryer J Dubey D McKeon A Flanagan EP et al . Association of MOG-IgG serostatus with relapse after acute disseminated encephalomyelitis and proposed diagnostic criteria for MOG-IgG-associated disorders. JAMA Neurol. (2018) 75:1355–63. 10.1001/jamaneurol.2018.1814
10.
Banwell B Bennett JL Marignier R Kim HJ Brilot F Flanagan EP et al . Diagnosis of Myelin Oligodendrocyte Glycoprotein Antibody-Associated Disease: International Mogad Panel Proposed Criteria. Lancet Neurol. (2023) 22:268–82. 10.1016/S1474-4422(22)00431-8
11.
Davalos D Akassoglou K . Fibrinogen as a key regulator of inflammation in disease. Semin Immunopathol. (2012) 34:43–62. 10.1007/s00281-011-0290-8
12.
Weisel JW . Fibrinogen and fibrin. Adv Protein Chem. (2005) 70:247–99. 10.1016/S0065-3233(05)70008-5
13.
Ryu JK Davalos D Akassoglou K . Fibrinogen signal transduction in the nervous system. J Thromb Haemost. (2009) 7(Suppl 1):151–4. 10.1111/j.1538-7836.2009.03438.x
14.
Davalos D Ryu JK Merlini M Baeten KM Le Moan N Petersen MA et al . Fibrinogen-induced perivascular microglial clustering is required for the development of axonal damage in neuroinflammation. Nat Commun. (2012) 3:1227. 10.1038/ncomms2230
15.
Walley KR McDonald TE Wang Y Dai S Russell JA . Albumin resuscitation increases cardiomyocyte contractility and decreases nitric oxide synthase II expression in rat endotoxemia. Crit Care Med. (2003) 31:187–94. 10.1097/00003246-200301000-00029
16.
Prajapati KD Sharma SS Roy N . Current perspectives on potential role of albumin in neuroprotection. Rev Neurosci. (2011) 22:355–63. 10.1515/rns.2011.028
17.
Yang WM Zhang WH Ying HQ Xu YM Zhang J Min QH et al . Two new inflammatory markers associated with disease activity Score-28 in patients with rheumatoid arthritis: albumin to fibrinogen ratio and C-reactive protein to albumin ratio. Int Immunopharmacol. (2018) 62:293–8. 10.1016/j.intimp.2018.07.007
18.
Cobo-Calvo A Ruiz A Maillart E Audoin B Zephir H Bourre B et al . Clinical spectrum and prognostic value of CNS MOG autoimmunity in adults: the Mogador study. Neurology. (2018) 90:e1858–69. 10.1212/WNL.0000000000005560
19.
Jarius S Ruprecht K Wildemann B Kuempfel T Ringelstein M Geis C et al . Contrasting disease patterns in seropositive and seronegative neuromyelitis optica: a multicentre study of 175 patients. J Neuroinflammation. (2012) 9:14. 10.1186/1742-2094-9-14
20.
Sechi E Cacciaguerra L Chen JJ Mariotto S Fadda G Dinoto A et al . Myelin oligodendrocyte glycoprotein antibody-associated disease (MOGAD): a review of clinical and Mri features, diagnosis, and management. Front Neurol. (2022) 13:885218. 10.3389/fneur.2022.885218
21.
Kingwell E Marriott JJ Jetté N Pringsheim T Makhani N Morrow SA et al . Incidence and prevalence of multiple sclerosis in Europe: a systematic review. BMC Neurol. (2013) 13:128. 10.1186/1471-2377-13-128
22.
Cobo-Calvo A Ruiz A Rollot F Arrambide G Deschamps R Maillart E et al . Clinical features and risk of relapse in children and adults with myelin oligodendrocyte glycoprotein antibody-associated disease. Ann Neurol. (2021) 89:30–41. 10.1002/ana.25909
23.
Satukijchai C Mariano R Messina S Sa M Woodhall MR Robertson NP et al . Factors associated with relapse and treatment of myelin oligodendrocyte glycoprotein antibody-associated disease in the United Kingdom. JAMA Netw Open. (2022) 5:e2142780. 10.1001/jamanetworkopen.2021.42780
24.
Cucuzza ME Pavone P D'Ambra A Finocchiaro MC Greco F Smilari P et al . Autoimmune encephalitis and CSF anti-ampa Glur3 antibodies in childhood: a case report and literature review. Neurol Sci. (2022) 43:5237–41. 10.1007/s10072-022-06170-0
25.
Li Y Xie H Zhang J Zhou Y Jing L Yao Y et al . Clinical and radiological characteristics of children and adults with first-attack myelin oligodendrocyte glycoprotein antibody disease and analysis of risk factors for predicting the severity at disease onset in central China. Front Immunol. (2021) 12:752557. 10.3389/fimmu.2021.752557
26.
Petersen MA Ryu JK Akassoglou K . Fibrinogen in neurological diseases: mechanisms, imaging and therapeutics. Nat Rev Neurosci. (2018) 19:283–301. 10.1038/nrn.2018.13
27.
Ryu JK Petersen MA Murray SG Baeten KM Meyer-Franke A Chan JP et al . Blood coagulation protein fibrinogen promotes autoimmunity and demyelination via chemokine release and antigen presentation. Nat Commun. (2015) 6:8164. 10.1038/ncomms9164
28.
Adams RA Bauer J Flick MJ Sikorski SL Nuriel T Lassmann H et al . The fibrin-derived Gamma377-395 peptide inhibits microglia activation and suppresses relapsing paralysis in central nervous system autoimmune disease. J Exp Med. (2007) 204:571–82. 10.1084/jem.20061931
29.
Petersen MA Ryu JK Chang KJ Etxeberria A Bardehle S Mendiola AS et al . Fibrinogen activates Bmp signaling in oligodendrocyte progenitor cells and inhibits remyelination after vascular damage. Neuron. (2017) 96:1003–12.e7. 10.1016/j.neuron.2017.10.008
30.
Duan Z Luo C Fu B Han D . Association between fibrinogen-to-albumin ratio and the presence and severity of coronary artery disease in patients with acute coronary syndrome. BMC Cardiovasc Disord. (2021) 21:588. 10.1186/s12872-021-02400-z
31.
Zhang Y Zhang X Liu D Wang H Pan S Wang D et al . Elevated fibrinogen levels in neuromyelitis optica is associated with severity of disease. Neurol Sci. (2016) 37:1823–9. 10.1007/s10072-016-2628-4
32.
Ferrer R Mateu X Maseda E Yébenes JC Aldecoa C De Haro C et al . Non-oncotic properties of albumin. A multidisciplinary vision about the implications for critically ill patients. Expert Rev Clin Pharmacol. (2018) 11:125–37. 10.1080/17512433.2018.1412827
33.
Quinlan GJ Martin GS Evans TW . Albumin: biochemical properties and therapeutic potential. Hepatology. (2005) 41:1211–9. 10.1002/hep.20720
34.
Djoussé L Rothman KJ Cupples LA Levy D Ellison RC . Serum albumin and risk of myocardial infarction and all-cause mortality in the Framingham offspring study. Circulation. (2002) 106:2919–24. 10.1161/01.CIR.0000042673.07632.76
35.
Ishizaka N Ishizaka Y Nagai R Toda E Hashimoto H Yamakado M . Association between serum albumin, carotid atherosclerosis, and metabolic syndrome in Japanese individuals. Atherosclerosis. (2007) 193:373–9. 10.1016/j.atherosclerosis.2006.06.031
36.
Weng YY Yang DH Qian MZ Wei MM Yin F Li J et al . Low serum albumin concentrations are associated with disease severity in patients with myasthenia gravis. Med (Baltim). (2016) 95:e5000. 10.1097/MD.0000000000005000
37.
Su Z Chen Z Xiang Y Wang B Huang Y Yang D et al . Low serum levels of uric acid and albumin in patients with Guillain-barre syndrome. Medicine. (2017) 96:e6618. 10.1097/MD.0000000000006618
38.
Yao XY Wu YF Gao MC Hong RH Ding J Hao Y et al . Serum albumin level is associated with the severity of neurological dysfunction of NMOSD patients. Mult Scler Relat Disord. (2020) 43:102130. 10.1016/j.msard.2020.102130
39.
Fang L Yan FH Liu C Chen J Wang D Zhang CH et al . Systemic inflammatory biomarkers, especially fibrinogen to albumin ratio, predict prognosis in patients with pancreatic cancer. Cancer Res Treat. (2021) 53:131–9. 10.4143/crt.2020.330
40.
Xu Q Yan Y Gu S Mao K Zhang J Huang P et al . A novel inflammation-based prognostic score: the fibrinogen/albumin ratio predicts prognoses of patients after curative resection for hepatocellular carcinoma. J Immunol Res. (2018) 2018:4925498. 10.1155/2018/4925498
41.
Tan Z Zhang M Han Q Wen J Luo K Lin P et al . A novel blood tool of cancer prognosis in esophageal squamous cell carcinoma: the fibrinogen/albumin ratio. J Cancer. (2017) 8:1025–9. 10.7150/jca.16491
42.
Xiao L Jia Y Wang X Huang H . The impact of preoperative fibrinogen-albumin ratio on mortality in patients with acute St-segment elevation myocardial infarction undergoing primary percutaneous coronary intervention. Clin Chim Acta. (2019) 493:8–13. 10.1016/j.cca.2019.02.018
43.
Ruan Y Yuan C Liu Y Zeng Y Cheng H Cheng Q et al . High fibrinogen-to-albumin ratio is associated with hemorrhagic transformation in acute ischemic stroke patients. Brain Behav. (2021) 11:e01855. 10.1002/brb3.1855
44.
Çiçekli E Sayan S Kotan D . Availability of fibrinogen/albumin ratio in MS Attack. Mult Scler Relat Disord. (2022) 60:103674. 10.1016/j.msard.2022.103674
Summary
Keywords
MOG-IgG associated disorders, clinical features, magnetic resonance imaging, fibrinogen, albumin, expanded disability status scale
Citation
Li Y, Wang S, Liu P, Ma J, Liu X and Yuan J (2023) Clinical features of patients with MOG-IgG associated disorders and analysis of the relationship between fibrinogen-to-albumin ratio and the severity at disease onset. Front. Neurol. 14:1140917. doi: 10.3389/fneur.2023.1140917
Received
09 January 2023
Accepted
15 March 2023
Published
20 April 2023
Volume
14 - 2023
Edited by
Patricia Coyle, Stony Brook University, United States
Reviewed by
Piero Pavone, University of Catania, Italy; Alina Gonzalez-Quevedo, Instituto de Neurología y Neurocirugía, Cuba
Updates
Copyright
© 2023 Li, Wang, Liu, Ma, Liu and Yuan.
This is an open-access article distributed under the terms of the Creative Commons Attribution License (CC BY). The use, distribution or reproduction in other forums is permitted, provided the original author(s) and the copyright owner(s) are credited and that the original publication in this journal is cited, in accordance with accepted academic practice. No use, distribution or reproduction is permitted which does not comply with these terms.
*Correspondence: Xinjing Liu xinjingly@126.comJing Yuan yuanjing27@126.com
This article was submitted to Multiple Sclerosis and Neuroimmunology, a section of the journal Frontiers in Neurology
Disclaimer
All claims expressed in this article are solely those of the authors and do not necessarily represent those of their affiliated organizations, or those of the publisher, the editors and the reviewers. Any product that may be evaluated in this article or claim that may be made by its manufacturer is not guaranteed or endorsed by the publisher.