 Bowen Hou
 Sabato Santaniello
 Anastasios V. Tzingounis
- 1Department of Physiology and Neurobiology, University of Connecticut, Storrs, CT, United States
- 2Department of Biomedical Engineering and CT Institute for the Brain and Cognitive Sciences, University of Connecticut, Storrs, CT, United States
Over the last decade KCNQ2 channels have arisen as fundamental and indispensable regulators of neonatal brain excitability, with KCNQ2 loss-of-function pathogenic variants being increasingly identified in patients with developmental and epileptic encephalopathy. However, the mechanisms by which KCNQ2 loss-of-function variants lead to network dysfunction are not fully known. An important remaining knowledge gap is whether loss of KCNQ2 function alters GABAergic interneuron activity early in development. To address this question, we applied mesoscale calcium imaging ex vivo in postnatal day 4–7 mice lacking KCNQ2 channels in interneurons (Vgat-ires-cre;Kcnq2f/f;GCamp5). In the presence of elevated extracellular potassium concentrations, ablation of KCNQ2 channels from GABAergic cells increased the interneuron population activity in the hippocampal formation and regions of the neocortex. We found that this increased population activity depends on fast synaptic transmission, with excitatory transmission promoting the activity and GABAergic transmission curtailing it. Together, our data show that loss of function of KCNQ2 channels from interneurons increases the network excitability of the immature GABAergic circuits, revealing a new function of KCNQ2 channels in interneuron physiology in the developing brain.
Introduction
Pathogenic variants in multiple potassium channels have been associated with neurodevelopmental disorders, including epilepsy and autism spectrum disorders (1–3). In particular, members of the KCNQ (Kv7) channel family have been linked to pediatric epilepsy disorders ranging from benign self-limiting epilepsy to severe forms like developmental and epileptic encephalopathy (DEE) (4–6). The KCNQ family is a subdivision of the voltage-gated potassium channel superfamily and is comprised of five members, KCNQ1 to KCNQ5 (Kv7.1-Kv7.5), named based on the order of identification (7–9). Three of the five members (KCNQ2, KCNQ3, and KCNQ5) have been implicated in epilepsy disorders, with KCNQ2 channels being the most frequently identified member (10). Indeed, KCNQ2 variants are the most common genetic causes of early onset neonatal epilepsy (5).
The KCNQ2 channel was first identified in 1998 as a gene underlying benign familial neonatal convulsions (11, 12), now renamed as self-limited (familial) neonatal epilepsy (SLFNE). As the name suggests, seizures resolve within a short period of time without looming cognitive issues later in life, although a small percentage of these patients have an increased propensity for future epilepsy (13). In addition to SLFNE, pathogenic KCNQ2 variants have been identified in patients with DEE (4, 14). These variants are predominantly loss-of-function and act in a dominant-negative fashion, leading to seizures shortly after birth (4, 5). Although the seizures can resolve over time, these patients have persistent developmental issues such as intellectual disability, impaired communication abilities, sleep disruption, and a disrupted ability to feed themselves (15, 16). Currently, the mechanisms that underlie the majority of the symptoms associated with KCNQ2 DEE are unclear (4).
Unlike the majority of voltage-gated potassium channels, KCNQ2 channels are expressed early in the nervous system, prior to birth (17, 18). For instance, a study found that KCNQ2 channels are expressed in humans starting at the 20th midgestational week (19). Similarly, KCNQ2 protein can be clearly detected in embryonic cells and at birth in mice (18, 20). Following birth, KCNQ2 protein levels steadily increase (21, 22), partly due to the progressive downregulation of microRNAs targeting KCNQ2 mRNA and preventing its translation early in development (22). Consistent with the presence of KCNQ2 expression early in development, we and others have found that deletion of KCNQ2 channels or expression of loss of function KCNQ2 variants in forebrain neurons leads to profound changes in hyperexcitability across the neocortex and hippocampus in the first week of life (23, 24). Consistent with this finding, application of pan-KCNQ2 blockers increased neuronal activity and bursting in slices prepared from one-week-old animals (25). These changes in excitability are due to the loss of KCNQ2 channels mediating the M-current, medium afterhyperpolarization, and in some cell types the slow afterhyperpolarization (26–28). Together, these potassium currents act as a brake to excessive firing activity in excitatory cells, counteracting the effects of the persistent sodium current, a subthreshold conductance that increases neuronal activity (29–31).
Although KCNQ2 channels are associated with the M-current and spike frequency adaptation, a feature most commonly associated with excitatory glutamatergic cells, KCNQ2 channel expression is not restricted to excitatory cells, as it is also found in GABAergic interneurons (32–35). Indeed, we previously found that deleting Kcnq2 from parvalbumin interneurons elevated their excitability, thus increasing the frequency of spontaneous inhibitory synaptic potentials in pyramidal neurons (35, 36). Similarly, studies using knockin mice expressing Kcnq2 pathogenic variants (p.Tyr284Cys; pThr274Met) across all cell types also reported increased GABAergic synaptic activity in the hippocampus (34) and neocortex (24). In addition to genetic perturbations, pharmacologically inhibiting or activating KCNQ channels can increase or dampen interneuron excitability, respectively, supporting the notion that KCNQ channels regulate interneuron firing properties (33, 35, 36).
With few exceptions (34), past studies on KCNQ channels and interneuron excitability have taken place in juvenile or adult neurons. Considering the early expression of KCNQ2 channels in the brain (17, 18), here we examined whether deleting Kcnq2 solely from GABAergic interneurons alters interneuron network excitability in the neonatal forebrain. We utilized mesoscale calcium imaging in order to monitor the effect of KCNQ2 protein loss from GABAergic interneurons across the neocortex and hippocampus in parallel (23). We found that Kcnq2 deletion leads to increased GABAergic interneuron network excitability, suggesting that KCNQ2 loss-of-function pathogenic variants would alter not only excitatory neuronal excitability, but also GABAergic interneuron network excitability early in development, an effect that might contribute to the developmental and epileptic encephalopathy phenotype of KCNQ2 DEE patients.
Materials and methods
The animal study was reviewed and approved by the University of Connecticut institutional animal care and use committee (IACUC).
All mice were kept on a C57BL/6 J background. The Kcnq2f/f mice have been previously described and published (23, 37, 38). To express Cre recombinase in GABAergic cells, we used the Slc32a1tm2(cre)/Lowl/J mouse line, which drives Cre recombinase from the Slc32a1 promoter region (RRID:IMSR_JAX:016962). Slc32a1tm2(cre)/Lowl/J mice are also known as Vgat-ires-cre mice; hereafter, we refer to these mice as VGAT-cre. To detect calcium events in neurons, we used B6;129S6-Polr2aTn(pb-CAG-GCaMP5g,-tdTomato)Tvrd/J mice (RRID:IMSR_JAX:024477|PC-G5-tdT), which express Gcamp5g in the presence of Cre recombinase (39). This enabled the expression of GCamp5g as well as dtTomato when Cre recombinase was present. The expression of dtTomato allowed us to determine the extent of Cre recombinase activity and the specificity, ensuring no ectopic expression. Hereafter, we refer to the interneuron-specific Kcnq2 knockout mice as IN:Kcnq2. Breeding was performed at the University of Connecticut Vivarium. For this study, we developed and used VGAT-cre::PC-G5-tdT::Kcnq2f/+ mice. We intercrossed these mice to obtain VGAT-cre::PC-G5-tdT::Kcnq2+/+, VGAT-cre::PC-G5-tdT::Kcnq2f/+, and VGAT-cre::PC-G5-tdT::Kcnq2f/f mice. For our experiments, we used either VGAT-cre::PC-G5-tdT::Kcnq2+/+ or VGAT-cre::PC-G5-tdT::Kcnq2f/f mice. Genotypes were confirmed with PCR before each experiment. Experiments were conducted without considering sex preference as there have been no reported effects of sex-dependency on KCNQ2 patients (40). Mice had food and water ad libitum and were kept in a 12:12 light/dark cycle.
Acute brain slice preparation
P4–P7 mice were anesthetized using isoflurane. Anesthetized mice were then decapitated rapidly and their brains were quickly dissected out. The removed brains were transferred into an ice-cold cutting solution containing: 26 mM NaHCO3, 210 mM sucrose, 10 mM glucose, 2.5 mM KCl, 1.25 mM NaH2PO4, 0.5 mM CaCl2, and 7 mM MgCl2. The brains were kept in a holding chamber for ~1 min prior to relocation to a vibratome (Leica, VS2000) for slicing. Slices, 300 μm in thickness, were obtained and transferred into an incubation chamber warmed to 35–37°C. Slices were kept at 35–37°C for 30 min. After that, the incubation container and the slices were placed on a benchtop at room temperature for at least 1 hour prior to experiments. The incubation chamber contained artificial cerebrospinal fluid (ACSF) with the following components: 125 mM NaCl, 26 mM NaHCO3, 2.5 mM KCl, 1 mM NaH2PO4, 1.3 mM MgCl2, 1.5 mM CaCl2, and 12 mM D-glucose.
Acute brain slice imaging
To image calcium activity, slices were placed in a Warner holding chamber superfused continuously with warm (33–35°C) ACSF. For recording calcium activity, we used an Axio Zoom V.16 (Zeiss) microscope with a PlanNeoFluar Z 1X, 0.25NA objective and a 56 mm working distance. Using multi-imaging acquisition software (Micromanager), 300 s long movies recorded using an sCMOS camera (pco.edge 4.2) at a 500 × 513 pixel resolution (50 ms exposure time; 6,000 frames).
Analysis of calcium events
TIFF files (6,000 frames per file) were imported into the Fiji-ImageJ1 (41) software package. For each TIFF file, we selected a region of interest (ROI) such as the CA3 region of the hippocampus or the anterior, medial, or posterior cortex to measure changes in calcium fluorescence. Using the Fiji-ImageJ built-in functions, we plotted the z-axis profile for each ROI, and then obtained the fluorescent value per each frame for every ROI. The fluorescent values (F) for the 300 s-long recording period were then exported to Axograph analysis software (v.1.7.5, https://axograph.com/). Using the built-in functions of Axograph, we obtained the ΔF/F time series for each calcium event. The cut-off point for a recorded calcium event was 0.01 ΔF/F. For each calcium event, we measured its amplitude and duration (50% of the peak).
ROIs and signals ΔF/F for the 2D plots were determined according to a semi-automatic procedure as described in (23). Briefly, frames (500 × 500 pixels, inter-pixel distance: 6 μm) were inspected for the external edges of the area covered by each hemisphere, and only pixels within the area delineated by these lines were further considered. Pixels within this area were divided into ROIs by using the SLIC (simple linear iterative clustering) algorithm (42) and, for each ROI, the fluorescence signal F was estimated as the average value of the fluorescence intensity across all pixels in the ROI. The series of variations ΔF was then estimated for each ROI as ΔF = (F − m)/m, where m is the moving average value of F (moving window: 30 s). ROIs were numbered consecutively along the anteroposterior direction, with lower values assigned to ROIs towards the anterior cortex and higher values assigned to ROIs towards the posterior cortex and the CA3 area of the hippocampus.
Local field potential recording and analysis
In parallel to calcium fluorescence events, we recorded the local field potentials (LFP) from the CA3 region of the hippocampus using a microarray with eight bipolar electrodes (MicroProbes). Data were recorded through a RHD2000 multichannel amplifier with RHD2000 interface software (v1.5, Intan Technologies) at a 20 kHz sample rate and imported in MATLAB (R2020b, MathWorks, Inc.). The raw data were lowpass filtered (20th order FIR filter, cutoff frequency 1.3 kHz), and the resultant signals were further filtered (cutoff frequency: 80 Hz, 8th order Chebyshev Type I lowpass filter applied in both directions to avoid phase distortions) before being down-sampled to 200 Hz. For each recording, 30 s-long segments were selected for spectral analyses. LFP channels in each segment were standardized and processed via continuous wavelet transform (10 voices per octave, analytic bump wavelet) to perform a time-frequency analysis. All analyses were performed blind to the genotype.
Statistics
GraphPad Prism 8 software (GraphPad) was used to graph the data for statistical analyses. We used Mann–Whitney U tests to determine significance between groups of data.
Results
Loss of KCNQ2 channels from GABAergic cells primarily impacts network activity in the hippocampal formation
To determine whether KCNQ2 channels alter interneuron GABAergic network excitability, we first recorded interneuron activity under basal conditions (2.5 mM Ko). For these experiments, we used horizontal slices, preserving the connections between different network subregions. Figure 1 compares the fluorescence activity across different hemispheres. We note that the observed calcium fluorescence changes reflect activity across a population of neurons, as mesoscale imaging does not allow for detection of calcium events at a single-cell resolution. In our control slices, the regions with the highest basal activity were the hippocampal formation and in particular the CA3 region of the hippocampus and the posterior cortex, likely reflecting the entorhinal cortex (Figures 1A,B). This was consistent with earlier reports showing that the hippocampal formation shows spontaneous activity in slices from neonatal mice (43, 44).
Figure 1. Kcnq2 deletion from neonatal GABAergic interneurons elevates hippocampal formation and posterior cortex excitability. (A) Top panels: representative examples of horizontals slices expressing GCamp5g from control and IN:Kcnq2 mice. Each hemisphere was segmented into regions of interest (ROI). Bottom panels: 2D plots showing the changes in the calcium signal measured as ΔF/F for the different ROIs during the 5 min recording period. The ROI numbering represents the various ROIs with lower values towards the anterior cortex and higher values towards the posterior cortex and the CA3 area of the hippocampus. (B) Representative example of change in calcium fluorescence (ΔF/F) observed in the posterior cortex. The data are from the slice depicted in (A). (C) Summary graphs showing the effect of Kcnq2 deletion to the amplitude (ΔF/F), duration (s), and number of events per second (Hz) for ROIs representing the CA3 area of the hippocampus and posterior cortex. Data are presented as box-and-whisker plots (box shows the 25th and 75th percentiles, whereas the whiskers show the minimum and maximum values). Detailed data and statistics for these graphs are reported under Table 1; Figure 1C section.
In the absence of KCNQ2 channels, we found an even greater activity in these subregions reflected as changes in the amplitude, duration, or frequency of calcium events (Figure 1). For instance, in the posterior cortex we found a two-fold increase in the amplitude of the calcium signals (control: 0.053 ± 0.052 ΔF/F, n = 24; IN:Kcnq2: 0.14 ± 0.095 ΔF/F, n = 25; p < 0.0001, Mann–Whitney U test), whereas in the CA3 region of the hippocampus we observed changes both in the duration of the calcium signal (control: 0.75 ± 0.28 s, n = 24,; IN:Kcnq2: 0.81 ± 0.26 s, n = 26; p = 0.0006, Mann–Whitney U test) and its frequency (events/s; control: 0.012 ± 0.012 Hz, n = 28; IN:Kcnq2 0.019 ± 0.015 Hz, n = 26; p = 0.0021, Mann–Whitney U test) (Figure 1B). Thus, deletion of Kcnq2 from GABAergic neurons leads to increases in activity primarily in the hippocampus and posterior cortex, which is comparable to our earlier findings of deleting KCNQ2 channels from excitatory neurons (23).
Ablation of Kcnq2 from GABAergic cells increases interneuron population activity across the forebrain in the presence of 8 mM Ko
The low basal activity in the neocortex in 2.5 mM extracellular potassium prevented us from determining whether KCNQ2 channels also play a role in the neocortex, a region that highly expresses KCNQ2 channels across development. This is because spontaneous neocortical activity in slices at these ages is sparse (45). Thus, we examined the effects of ablating KCNQ2 channels from GABAergic cells in slices superfused with 8 mM Ko. Increasing the extracellular potassium depolarizes neurons as it shifts the Nernst equilibrium potassium potential to more positive values, leading to increased neuronal excitability. Despite the change in the extracellular potassium concentration, calcium activity was still restricted to the hippocampal formation in our control slices (Figure 2A). However, in slices deficient of KCNQ2 channels, we detected activity across the hemisphere with prominent activity both at the hippocampal formation and the neocortex. This is clearly illustrated in the two-dimensional plot in Figure 2A. Notice that in the absence of KCNQ2 channels fluorescence signal is apparent across the hemisphere.
Figure 2. Loss of KCNQ2 from GABAergic cells leads to widespread forebrain hyperexcitability in the presence of 8 mM Ko. (A) Top panels: representative examples of horizontals slices expressing GCamp5g from control and IN:Kcnq2 mice. Each hemisphere was segmented into regions of interest (ROI). Bottom panels: 2D plots showing the changes in the calcium signal measured as ΔF/F for the different ROIs during the 5 min recording period. The ROI numbering represents the various segmented areas with lower values towards the anterior cortex and higher values towards the posterior cortex and the CA3 area of the hippocampus. (B) Top panels: LFPs recorded in parallel to the calcium signal from the CA3 region of the hippocampus. Bottom panels: Temporal evolution of ΔF/F across multiple ROIs. ROIs represent different forebrain anatomical areas (CA3 region of the hippocampus, posterior, medial, and anterior cortex). (C) Summary graphs showing the effect of Kcnq2 ablation to the amplitude (ΔF/F), duration(s), and frequency (Hz; events/s) as box plots of the calcium events for different anatomic regions. MC, medial cortex; PC, posterior cortex; AC, anterior cortex. Data are presented as box-and-whisker plots (box shows the 25th and 75th percentiles, whereas the whiskers show the minimum and maximum values). Detailed data and statistics could be found in Table 1; Figure 2C section.
To quantify the impact of KCNQ2 deletion from GABAergic interneurons, we divided our hemispheres into different subregions and determined the amplitude, duration, and frequency of the calcium events (Figure 2B). With respect to the amplitude, we found that Kcnq2 ablation increased calcium activity primarily in the posterior and anterior cortex, whereas the duration of the calcium signals was increased in all regions except the posterior cortex. The amplitude and duration of the calcium signals were a function of the number and duration of neurons active at any given moment. Thus, the aforementioned changes suggest that Kcnq2 deletion increases the population activity of interneurons across the neocortex. This would be consistent with an increased excitability of interneurons, making them more prone to firing action potentials following incoming activity and further explaining the increase in the frequency of calcium events in the neocortex (Figures 2B,C).
In parallel to our calcium measurements, we recorded the LFP from the CA3 region of the hippocampus. With an elevated potassium concentration (8 mM Ko), we routinely observed robust LFP activity independent of the presence or absence of KCNQ2 channels. We also noticed that the LFP activity was comprised of continuous events with intermittent bursts lasting ~30 s (Figure 2B), with this bursting being independent of the presence of KCNQ2 channels. Next, we assessed the spectral content of these bursts (Figure 3A) and we found that, while bursts had power spectra spanning across the theta (3–7 Hz), alpha (8–14 Hz), and beta (15–30 Hz) frequencies (Figure 3B), oscillations in the range 5–10 Hz (i.e., upper theta/low alpha frequencies) showed a significant increase (Figure 3C). The 5–10 Hz frequency band likely reflects oscillations in the alpha frequency range, which have been previously associated with increased fast spiking interneuron activity.
Figure 3. Deletion of Kcnq2 from GABAergic cells had modest effects on the local field potential (LFP) measured in the CA3 of the hippocampus. (A) Top panels: calcium signal ΔF/F from the CA3 hippocampus in the presence of 8 mM Ko. Middle panels: LFP from the same region as in the top panels recorded in parallel. Notice that the close correspondence of the LFP and the calcium signal. Bottom panels: zoom-in on the LFP signals showing 30 s of recording of bursting activity. (B) Time-frequency scalogram of the LFP zoom-in signals reported in (A) (bottom panels). The color scale indicates the power spectrum density (μV2/Hz). Note that the power density is mainly concentrated between 5 Hz and 30 Hz throughout the duration of the burst. (C) Left panel: spectral power (μV2) calculated in five frequency ranges. Right panel: same data as in the left panel with frequency ranges up to 20 Hz. Note the significant increase in power in the 5–10 Hz. Power values are obtained by integration of the scalogram over time (0–30 s) and frequency range. Data are presented as mean and S.E.M. Detailed data and statistics for these graphs are reported under Table 1; Figure 3C section.
Blocking GABAA receptors increases GABAergic interneuron network activity
GABAergic interneurons release GABA and activate GABAA receptors, which in turn inhibit or facilitate activity based on the equilibrium membrane potential of chloride ions. At our developmental time point (P4–P7), GABA is primarily inhibitory in the neocortex (45, 46) whereas in the hippocampus it still transitions from excitatory to inhibitory as recently reported by Murata et al., i.e., excitatory at P3 and inhibitory by P7 (46). Additionally, multiple groups have shown that in addition to phasic GABA release, GABA is found tonically activating extracellular GABAA receptors (47). We previously found that application of picrotoxin, a GABAA receptor inhibitor that blocks both synaptic and extrasynaptic GABAA receptors, increases excitability in brain slices of 1 week-old animals (23). Thus, we hypothesized that eliminating GABAA receptor activity would also allow for greater interneuron excitability due to unabated excitatory network activity.
To investigate the effects of GABAA receptor inhibition on the interneuron network activity, we first applied 50 μM picrotoxin in slices from control animals (Figure 4A). Blocking GABAA receptors had several effects. First, calcium activity was no longer restricted to the hippocampal formation, but instead was present across multiple regions. This was especially evident in the anterior cortex, where the barely detectable initial activity levels increased to large calcium events in the presence of picrotoxin. Second, the activity became more periodic and synchronous, with bursting activity followed by quiescence periods (Figures 4A,B). Third, the amplitude and duration of the calcium events became larger and longer, likely reflecting greater recruitment of interneurons in the network (Figures 4B,C).
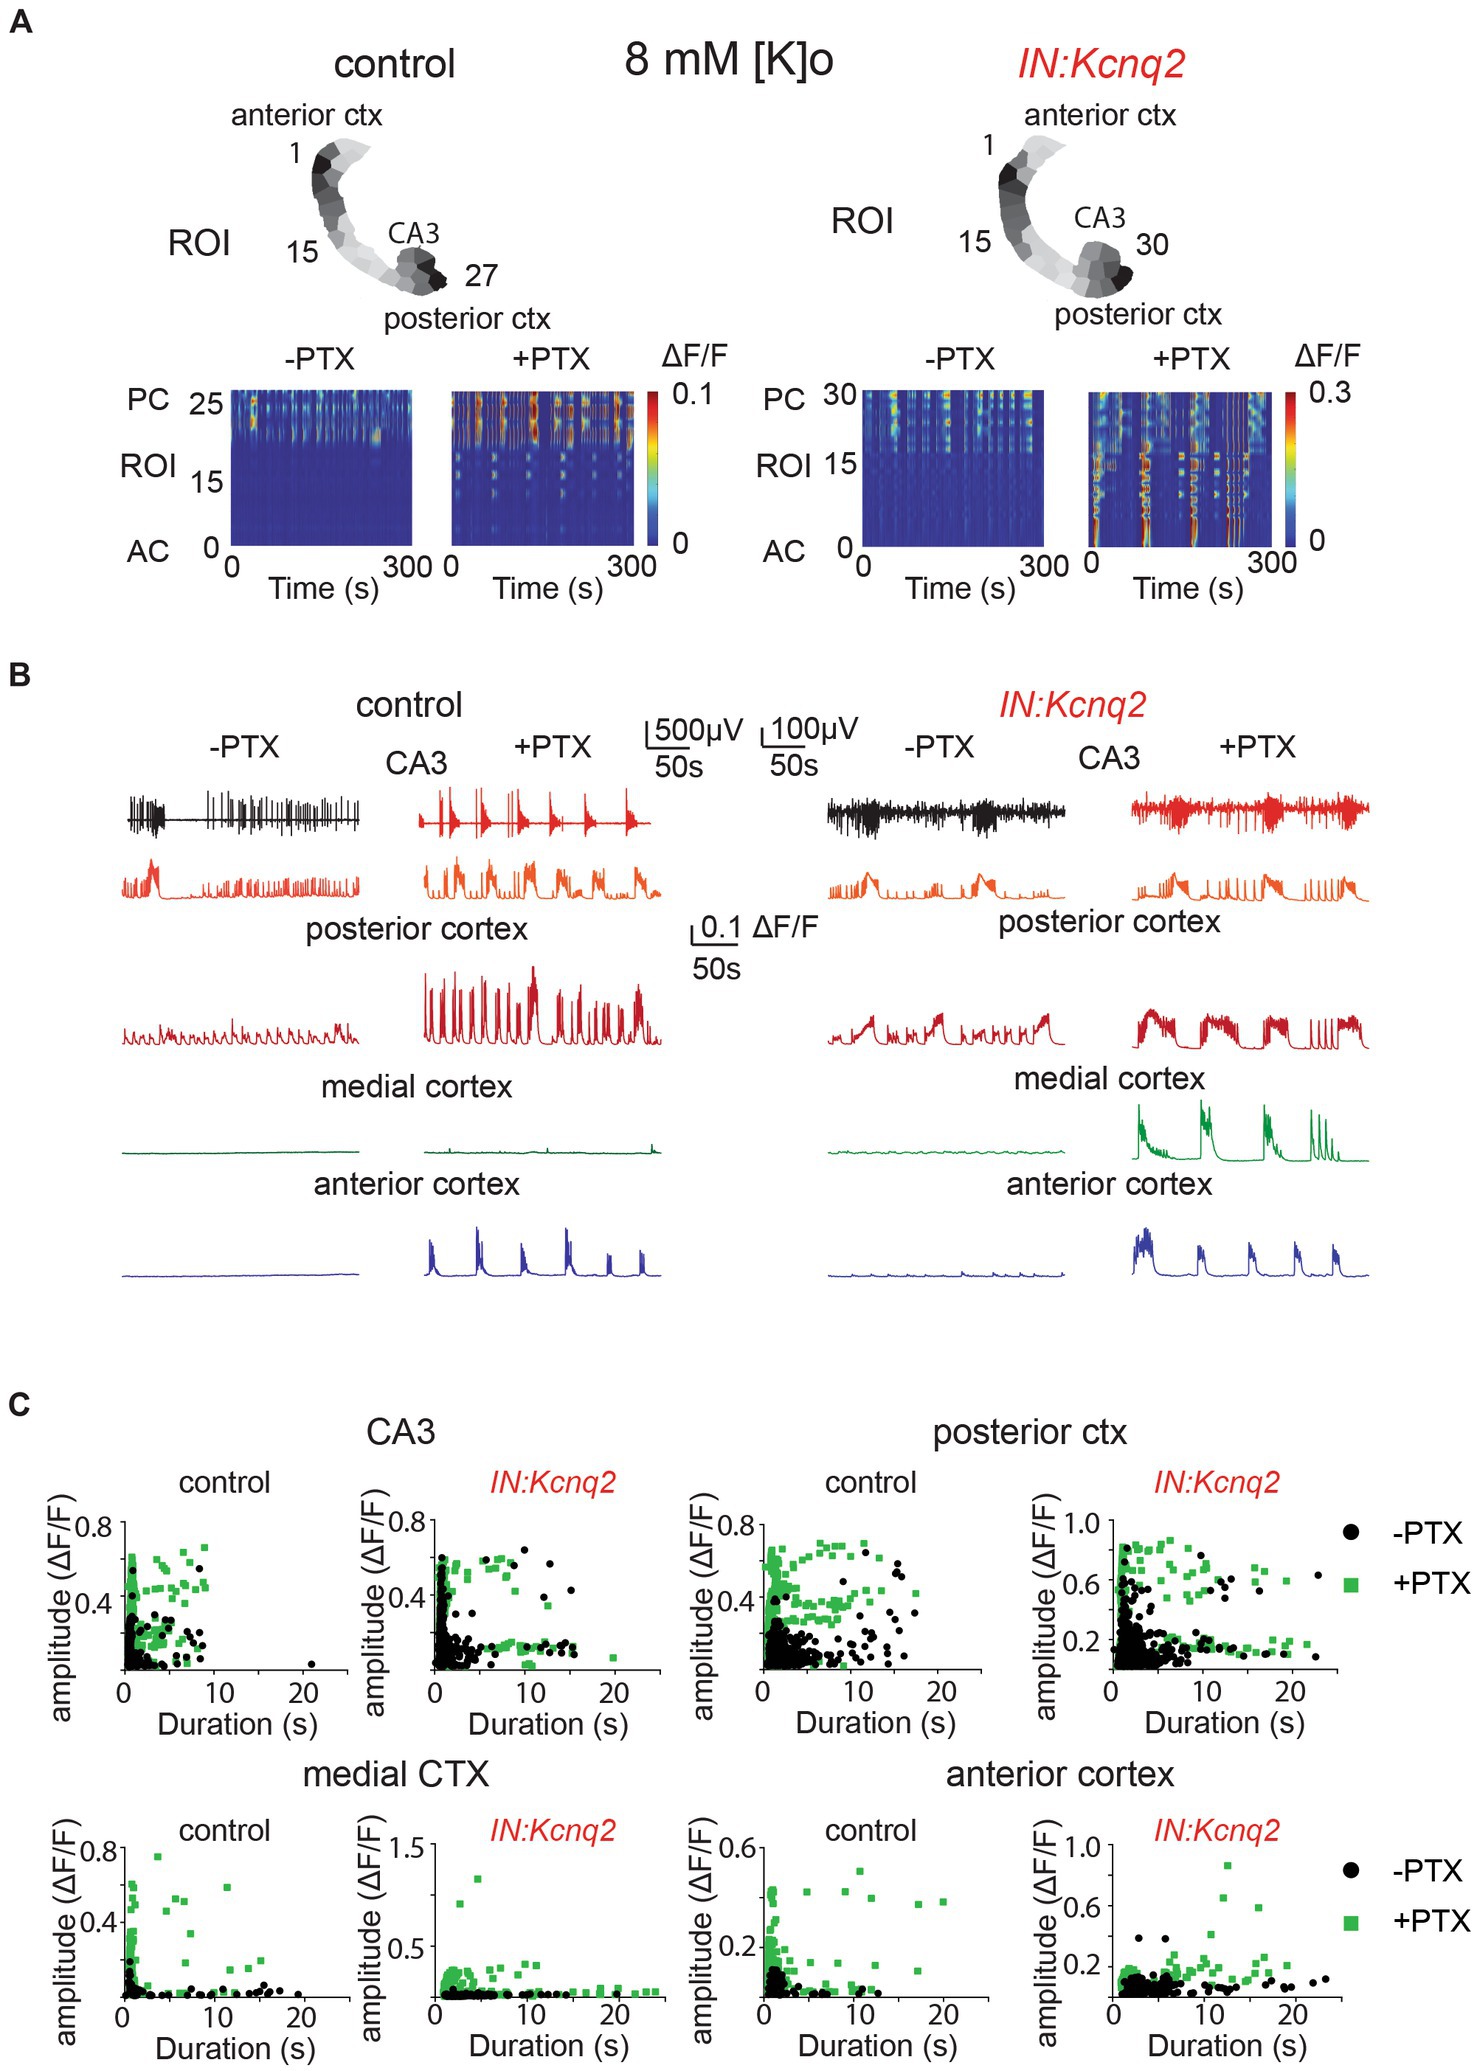
Figure 4. GABAA receptors limit activity from both wild-type and Kcnq2-null GABAergic neonatal brain slices. (A) Two examples of acute slices from control and IN:Kcnq2 mice (left and right column, respectively) before (−PTX) and after (+PTX) the application of 50 μM picrotoxin (PTX) to block synaptic and extrasynaptic GABAA receptors. Top panels: horizontal slices segmented into regions of interest (ROI). Bottom panels: changes in the ΔF/F as a function of time for the different ROIs. The numbering corresponds to the segmented area in the top panels, with lower values towards the anterior cortex and higher values at the posterior cortex and CA3 area of the hippocampus. (B) Temporal evolution of the LFP (top lines) and the ΔF/F signals (bottom lines) for different anatomical regions (CA3, posterior cortex, medial cortex, and anterior cortex) before and after application of 50 μM PTX. (C) Scatter plots showing the effect in amplitude and duration for the different anatomical regions (CA3, posterior cortex, medial cortex, and anterior cortex) before and after application of 50 μM PTX. Details on the statistical analysis and number of replicates for this figure are found under Table 1; Figure 4C section.
Next, we investigated the effect of blocking inhibition in the IN:Kcnq2 slices. Similar to the slices from control animals, we found that activity was synchronous and present across all regions in the IN:Kcnq2 slices (Figures 4A,B). We observed robust events even in the medial cortex, a region typically showing very low-level activity in slices from control animals (Figures 4B,C). Additionally, we observed large calcium events independent of whether their duration was brief or long lasting (Figure 4C). Overall, the loss of KCNQ2 channels from interneurons further amplified the pro-excitatory effects of picrotoxin. Together, our data suggest that the main role of GABAergic interneuron activity is inhibitory at the network population level.
Blocking NMDA receptors dampens interneuron network activity
Multiple groups have shown that network population events in slices depend on ongoing excitatory network activity (43, 44, 48, 49). In neonatal mice, NMDA receptors have been proposed to have a strong excitatory role (43, 50). As our recording conditions included elevated potassium concentrations, which would make it easier to relieve the magnesium block, the role of the NMDA receptors might have been enhanced. Indeed, we found that in slices from control animals, application of the competitive NMDA receptor antagonist APV (25 μM) substantially reduced the LFP, the calcium event frequency, and on many occasions the amplitude and duration of the calcium events (Figure 5). We observed similar effects in slices from IN:Kcnq2 mice (Figure 5A). However, one notable exception was in the anterior cortex, where application of APV in IN:Kcnq2 slices reduced the frequency of the events but had very weak effects on the amplitude and duration of the calcium events (Figures 5B,C).
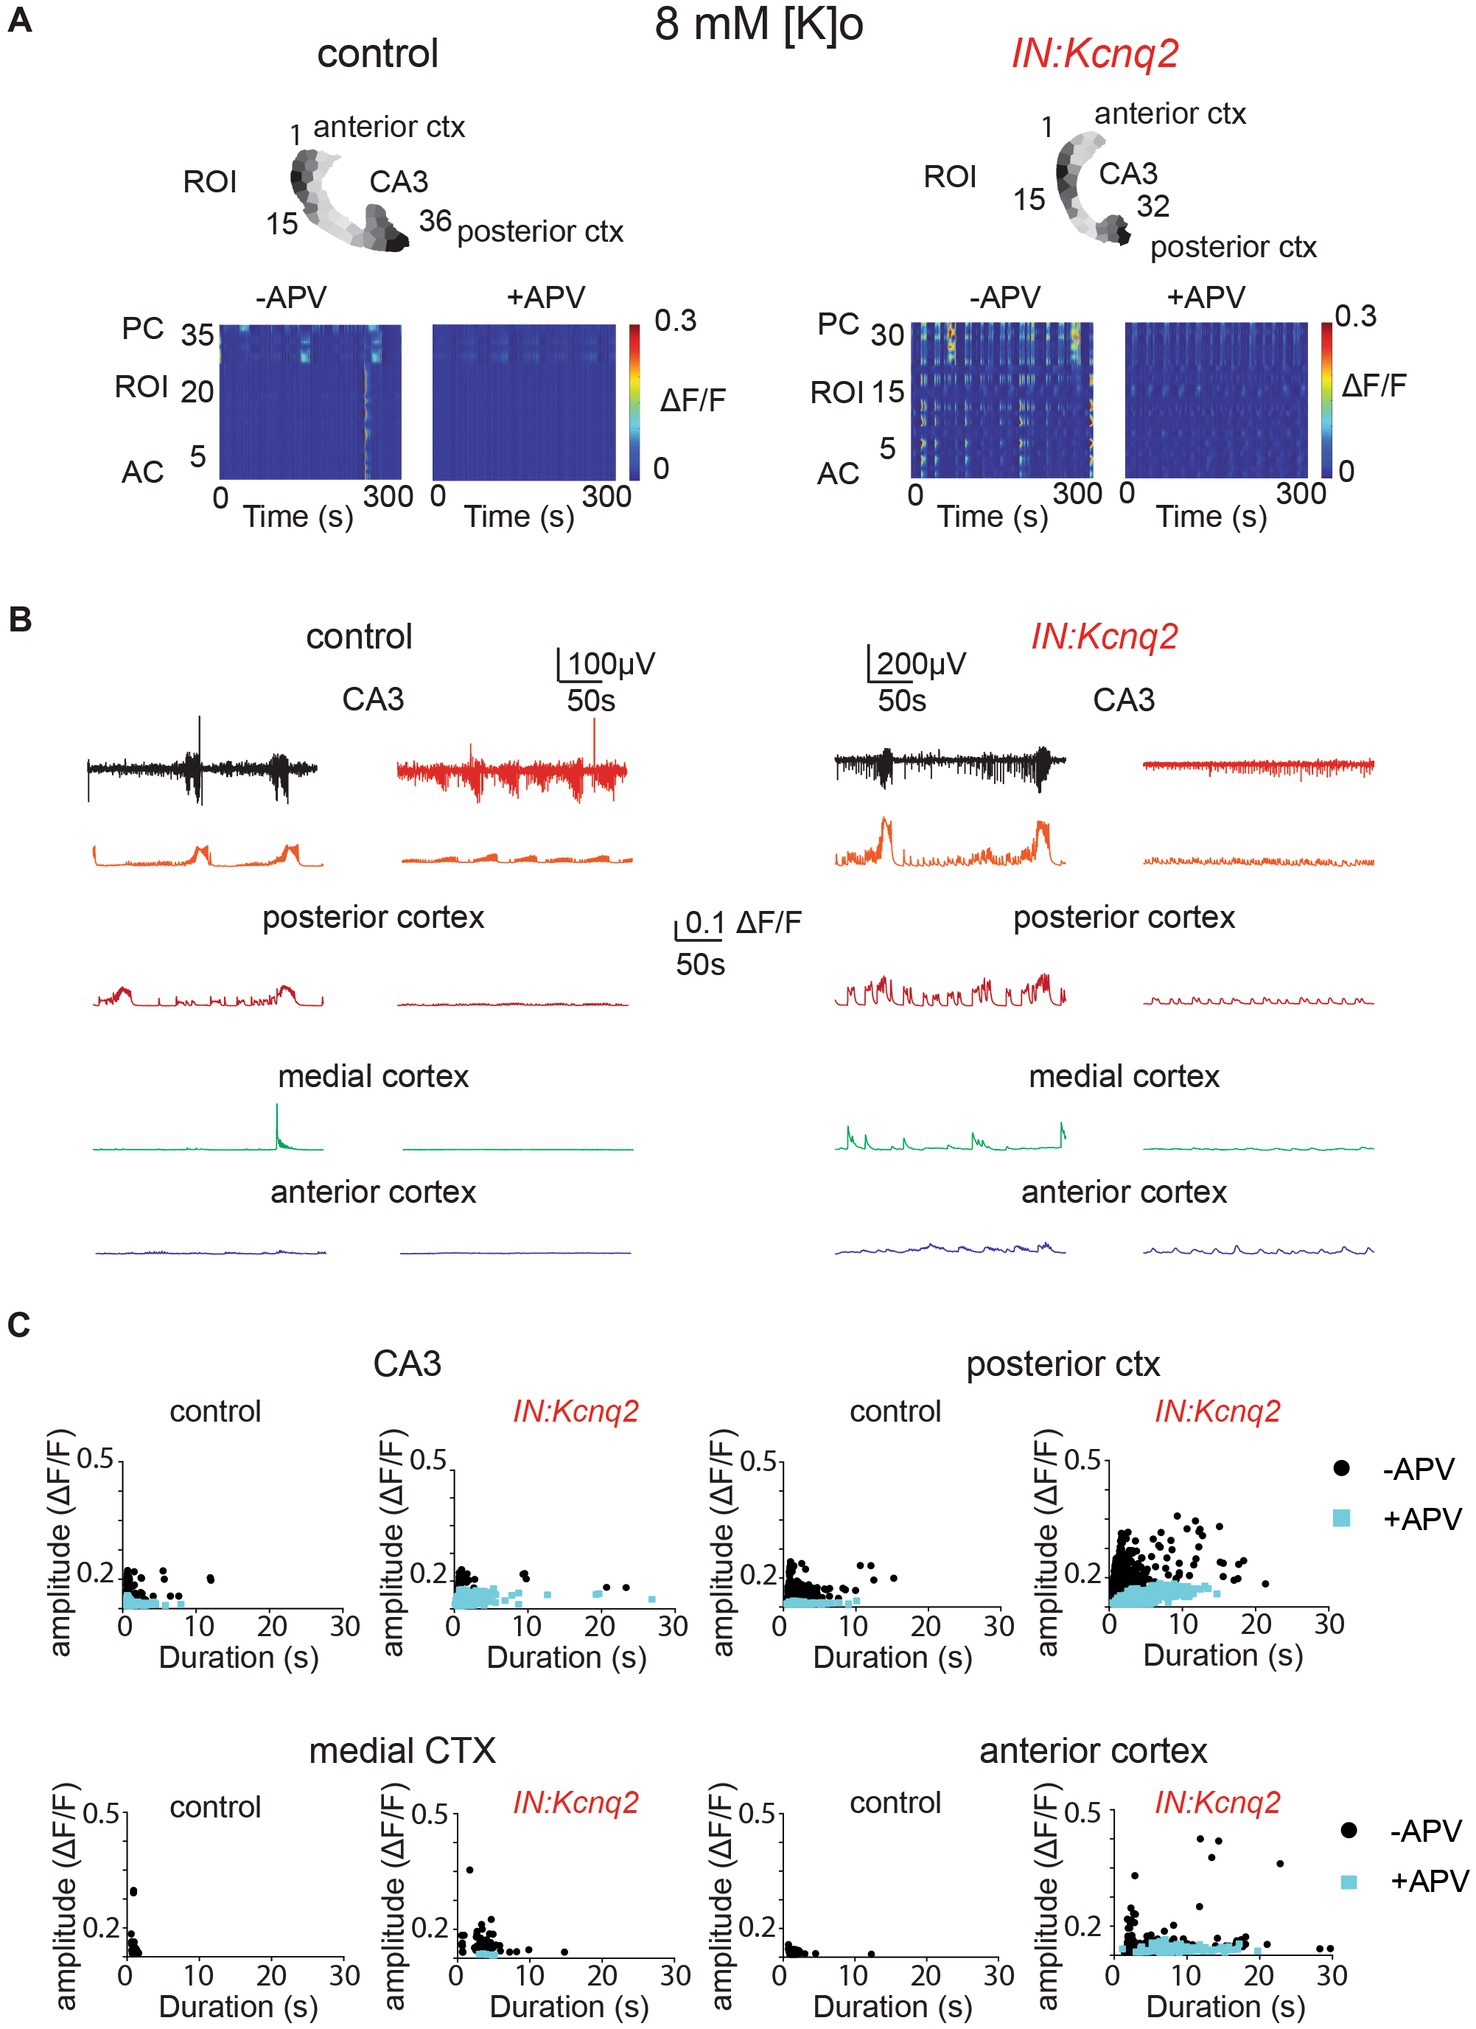
Figure 5. GABAergic population excitability is partly driven by NMDA receptors. (A) Two examples of acute slices from control and IN:Kcnq2 mice (left and right column, respectively) before (−APV) and after (+APV) the application of 25 μM D-APV in the presence of 8 mM Ko. Top panels: horizontal slices segmented into regions of interest (ROI). Bottom panels: changes in the ΔF/F as a function of time for the different ROIs. The numbering corresponds to the segmented area in the top panels, with lower values towards the anterior cortex and higher values at the posterior cortex and CA3 area of the hippocampus. (B) Temporal evolution of the LFP (top lines) and the ΔF/F signals (bottom lines) for different anatomical regions (CA3, posterior cortex, medial cortex, and anterior cortex) before and after application of 25 μM D-APV. (C) Scatter plots showing the effect in amplitude and duration for the different anatomical regions (CA3, posterior cortex, medial cortex, and anterior cortex) before and after application of 25 μM D-APV. Additional details on the statistical analysis and number of replicates for this figure are found under Table 1; Figure 5C section.
Not surprisingly, simultaneous application of synaptic blockers for AMPA, NMDA, and GABAA receptors almost entirely eliminated calcium activity in control slices (Figure 6A). Similarly, we found a very strong reduction in interneuron activity in slices from IN:Kcnq2 mice upon application of all three synaptic blockers. We did notice some remaining low-level activity in the medial and anterior cortex (Figures 6B,C; Table 1); however, this activity was barely above background levels. Thus, GABAergic interneuron activity in neonatal slices is driven primarily by fast excitatory transmission, and loss of KCNQ2 channels from interneurons increases their population activity.
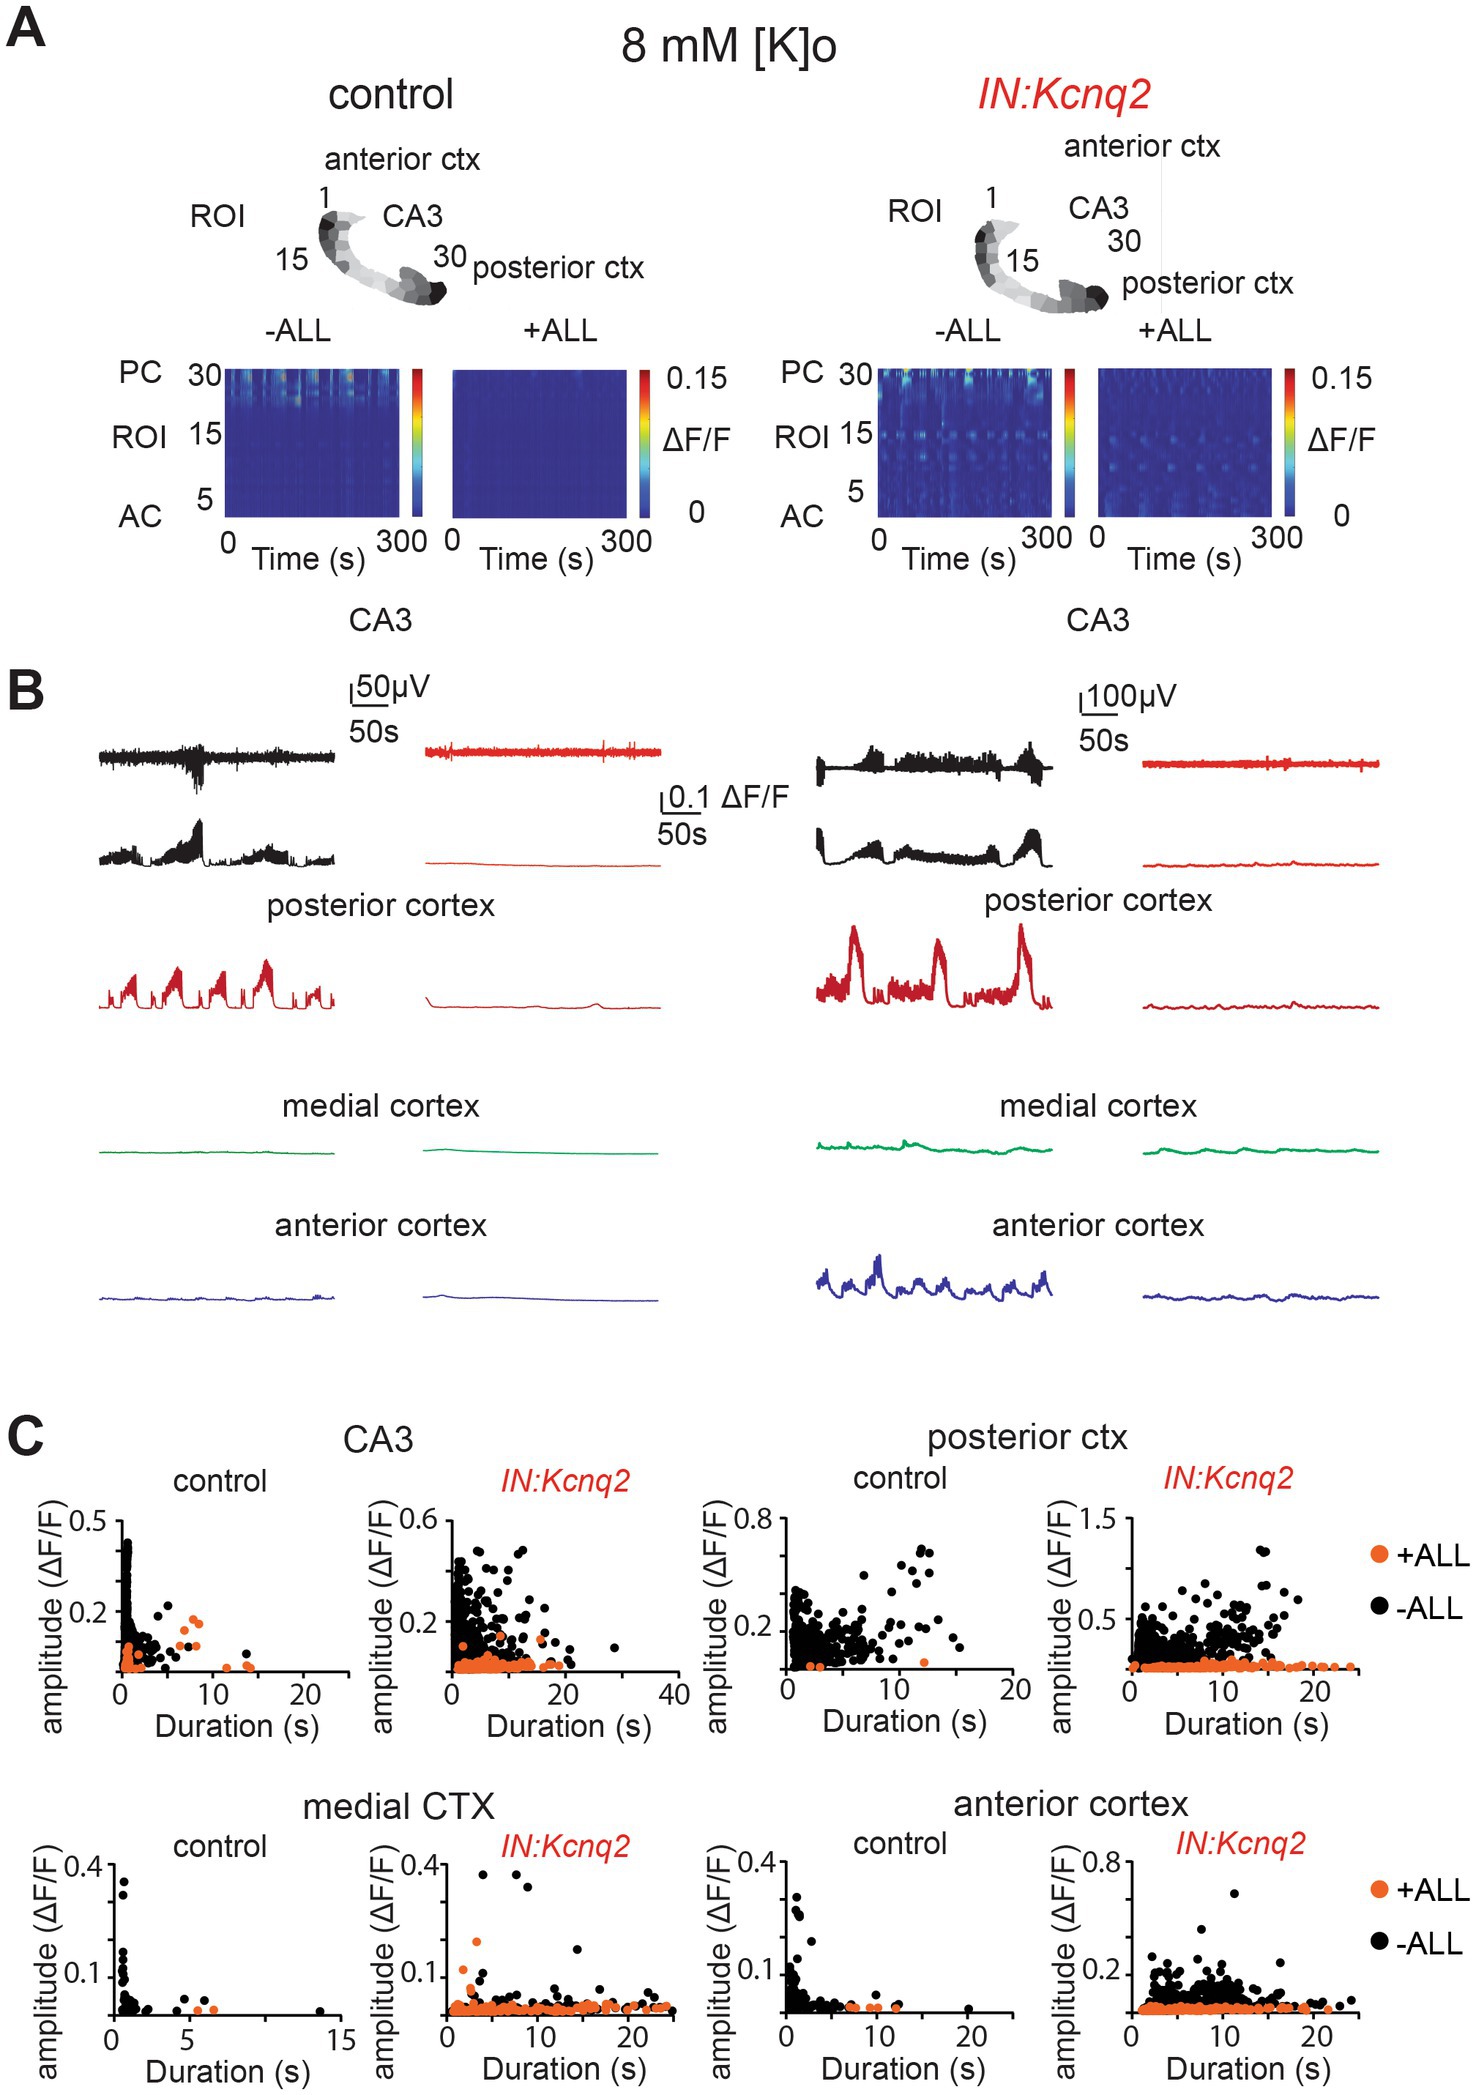
Figure 6. Fast synaptic transmission receptor activity drives calcium population changes in GABAergic neurons deficient of KCNQ2 channels. (A) Two examples of acute slices from control and IN:Kcnq2 mice (left and right column, respectively) before (−ALL) and after (+ALL) the application of 50 μM PTX, 25 μM D-APV, and 25 μM NBQX. Top panels: horizontal slices segmented into regions of interest (ROI). Bottom panels: changes in the ΔF/F as a function of time for the different ROIs. The numbering corresponds to the segmented area in the top panels, with lower values towards the anterior cortex and higher values at the posterior cortex and CA3 area of the hippocampus. (B) Temporal evolution of the LFP (top lines) and the ΔF/F signals (bottom lines) for different anatomical regions (CA3, posterior cortex, medial cortex, and anterior cortex) before and after application of 50 μM PTX, 50 μM D-APV, and 25 μM NBQX. (C) Scatter plots showing the effect in amplitude and duration for the different anatomical regions (CA3, posterior cortex, medial cortex, and anterior cortex) before and after application of 50 μM PTX, 50 μM D-APV, and 25 μM NBQX. Additional details on the statistical analysis and number of replicates for this figure are found under Table 1; Figure 6C section.
Discussion
In this study, we defined the role of KCNQ2 channels in the interneuron network excitability of the forebrain. Currently, very few studies have focused on GABAergic interneurons and the impact of KCNQ2 channels on their properties. By using conditional Kcnq2 knockout mice, we found that deletion of Kcnq2 from GABAergic interneurons early in life increases their excitability across the hippocampal formation and neocortex. Thus, our work suggests that KCNQ2 channel variants alter not only the excitability properties of immature excitatory cells, but also the properties of immature GABAergic cells.
KCNQ2 channels and GABAergic interneurons
KCNQ2 channels are a core component of the M-current (51, 52), a slowly activating non-inactivating voltage-gated potassium channel. The M-current’s main function is to prevent excessive firing (53). Thus, following strong activity, KCNQ2 channels and the M-current are activated, leading to spike frequency adaptation. This quiescence period is most typically associated with excitatory cells, and in particular pyramidal neurons (54). Consequently, for many years, the roles of the M-current and KCNQ2 channels in interneurons have been ignored. Despite this, a few studies using pharmacology have shown that a KCNQ-mediated current is present in interneurons, including somatostatin and parvalbumin GABAergic cells of the hippocampus (33, 35, 55). We and others have also shown that deletion of KCNQ2 channels from parvalbumin interneurons increases their firing activity, leading to elevated spontaneous inhibitory transmission (35, 36). Our study reveals that deletion of KCNQ2 channels from GABAergic neurons has a significant effect on the posterior cortex, which includes the entorhinal cortex, as well as on the CA3 area of the hippocampus. Previous studies have shown that the entorhinal cortex displays prominent spontaneous activity early in life (43, 44), potentially due to its high level of interconnectivity (56), although the exact mechanism remains unclear. The absence of KCNQ2 channels from GABAergic neurons is likely to amplify the propensity for spontaneous activity in these two regions, suggesting that the loss of KCNQ2 activity may have a more pronounced effect on these regions than on other cortical regions such as the medial and anterior cortex. Although the activity in these regions also increased in the absence of KCNQ2 channels from GABAergic neurons, the effect was much weaker than in the posterior cortex and hippocampal CA3 area.
A limitation of previous studies was the age of the animals. Most prior studies on KCNQ2 channels and interneuron activity were performed in juvenile or adult mice (33, 35, 36, 55). However, KCNQ2 channels are already expressed prior to birth, with their levels increasing as the animals further develop (18). Considering the key role of GABAergic transmission in the development of neuronal networks (48, 57), we sought to examine whether KCNQ2 channels also alter GABAergic interneuron activity in immature neurons. We found that, indeed, loss of KCNQ2 channel activity leads to elevated interneuron activity across the forebrain. Therefore, we suggest that KCNQ2 channels act as a brake early in development, limiting the recruitment of interneurons. This was evident in experiments in which we blocked GABAergic transmission.
Consistent with some recent papers (58, 59), we found that application of the GABAA receptor antagonist picrotoxin increases interneuron network excitability in both control and Kcnq2 GABAergic null neurons. This result is consistent with earlier and more recent findings that GABAA receptors are inhibitory at the network level within the first week of rodent life (46, 58–60). Although several studies have shown that GABA acts to depolarize neurons, at the network level its effects are likely inhibitory (59). This could be because tonic GABAA receptor activity likely acts as a shunt, clamping the resting potential of neurons to values that are depolarized yet subthreshold to action potential generation.
Implication to KCNQ2 loss-of-function variants
A major development over the last 10 years has been the recognition that KCNQ2 loss-of-function variants can lead to severe DEE (4, 5). Our current and prior work suggest that KCNQ2 loss of function would impair the function of both excitatory and GABAergic neurons. An unanswered question is whether loss of KCNQ2 channel activity from interneurons will further promote seizures or will dampen overall activity. In our previous study, deletion of Kcnq2 solely from interneurons led to increased excitatory transmission due to homeostatic changes (36). However, in constitutive Kcnq2 loss-of-function mice, pyramidal neuron excitability would already be elevated; thus, additional homeostatic changes should not lead to any further increase in neuronal excitability. We predict that loss of Kcnq2 from interneurons might instead have a protective role. Indeed, when we crossed our IN:Kcnq2 mice to Pyr:Kcnq2 mice (forebrain excitatory neuron Kcnq2 null mice), we found that the mice survived longer than the Pyr:Kcnq2 mice (data not shown). In contrast, pharmacological activation of KCNQ2 channels using KCNQ activators such as retigabine (61) will dampen excitability of GABAergic interneurons, which might decrease their ability to dampen overall network excitability. Indeed, a recent study showed the deleting KCNQ2 channels from parvalbumin interneurons allowed retigabine to have stronger anti-convulsant effects (35).
Limitations of our study
A limitation of this study is the lack of determination of the impact of KCNQ2 channels on interneuron neuronal physiology in different subregions at a single-cell level. For instance, we do not know whether all types of interneurons at this early stage of life depend on KCNQ2 channel activity or whether only a subset depends on them. We also do not know whether ablation of KCNQ2 channels from interneurons alters the properties of the excitatory cells or whether the synaptic drive to interneurons is affected. Lastly, it is possible that some of our effects might not solely be due to loss of KCNQ2 channel activity. For instance, KCNQ2 channels form heteromers with KCNQ3 and KCNQ5 channels (62). Thus, deletion of KCNQ2 might also alter the protein levels of KCNQ channels in general (37), further amplifying the observed phenotype.
Conclusion
Deleting KCNQ2 channels from GABAergic cells leads to increased GABAergic interneuron population activity in the neonatal forebrain. Our study fills a significant gap in our knowledge by demonstrating that KCNQ2 channels are important regulators of not only immature excitatory neurons networks but also GABAergic interneuron networks. Thus, KCNQ2 pathogenic variants or drugs targeting KCNQ2 channels early in life will modify the activity of both glutamatergic and GABAergic cells.
Data availability statement
The original contributions presented in the study are included in the article/Supplementary material. Further inquiries can be directed to the corresponding author.
Ethics statement
The animal study was reviewed and approved by the University of Connecticut Institutional Animal Care and Use Committee (IACUC).
Author contributions
BH, SS, and AT: designed research and wrote the paper. BH: performed research. BH and SS: analyzed data. All authors contributed to the article and approved the submitted version.
Funding
This work was supported by National Institutes of Health Grants R01 NS101596, NS108874 (to AT), and NSF CAREER Award 1845348 (to SS).
Acknowledgments
We thank all members of the Tzingounis lab for discussions.
Conflict of interest
The authors declare that the research was conducted in the absence of any commercial or financial relationships that could be construed as a potential conflict of interest.
Publisher’s note
All claims expressed in this article are solely those of the authors and do not necessarily represent those of their affiliated organizations, or those of the publisher, the editors and the reviewers. Any product that may be evaluated in this article, or claim that may be made by its manufacturer, is not guaranteed or endorsed by the publisher.
Footnotes
References
1. Gamal El-Din, TM , Lantin, T , Tschumi, CW , Juarez, B , Quinlan, M , Hayano, JH, et al. Autism-associated mutations in KV7 channels induce gating pore current. Proc Natl Acad Sci U S A. (2021) 118:e2112666118. doi: 10.1073/pnas.2112666118
2. Moyses-Oliveira, M , Yadav, R , Erdin, S , and Talkowski, ME . New gene discoveries highlight functional convergence in autism and related neurodevelopmental disorders. Curr Opin Genet Dev. (2020) 65:195–206. doi: 10.1016/j.gde.2020.07.001
3. Satterstrom, FK , Kosmicki, JA , Wang, J , Breen, MS , de Rubeis, S , An, JY, et al. Large-scale exome sequencing study implicates both developmental and functional changes in the neurobiology of autism. Cells. (2020) 180:568–584.e23. doi: 10.1016/j.cell.2019.12.036
4. Nappi, P , Miceli, F , Soldovieri, MV , Ambrosino, P , Barrese, V , and Taglialatela, M . Epileptic channelopathies caused by neuronal Kv7 (KCNQ) channel dysfunction. Pflugers Arch. (2020) 472:881–98. doi: 10.1007/s00424-020-02404-2
5. Cornet, MC , and Cilio, MR . Genetics of neonatal-onset epilepsies. Handb Clin Neurol. (2019) 162:415–33. doi: 10.1016/B978-0-444-64029-1.00020-5
6. El Kosseifi, C , Cornet, MC , and Cilio, MR . Neonatal developmental and epileptic encephalopathies. Semin Pediatr Neurol. (2019) 32:100770. doi: 10.1016/j.spen.2019.08.006
7. Jentsch, TJ . Neuronal KCNQ potassium channels: physiology and role in disease. Nat Rev Neurosci. (2000) 1:21–30. doi: 10.1038/35036198
8. Greene, DL , and Hoshi, N . Modulation of Kv7 channels and excitability in the brain. Cell Mol Life Sci. (2017) 74:495–508. doi: 10.1007/s00018-016-2359-y
9. Jepps, TA , Barrese, V , and Miceli, F . Editorial: Kv7 channels: structure, physiology, and pharmacology. Front Physiol. (2021) 12:679317. doi: 10.3389/fphys.2021.679317
10. Wright, CF , Campbell, P , Eberhardt, RY , Aitken, S , Perrett, D , Brent, S, et al. Genomic diagnosis of rare pediatric disease in the United Kingdom and Ireland. N Engl J Med. (2023) 388:1559–71. doi: 10.1056/NEJMoa2209046
11. Biervert, C , Schroeder, BC , Kubisch, C , Berkovic, SF , Propping, P , Jentsch, TJ, et al. A potassium channel mutation in neonatal human epilepsy. Science. (1998) 279:403–6. doi: 10.1126/science.279.5349.403
12. Singh, NA , Charlier, C , Stauffer, D , DuPont, BR , Leach, RJ , Melis, R, et al. A novel potassium channel gene, KCNQ2, is mutated in an inherited epilepsy of newborns. Nat Genet. (1998) 18:25–9. doi: 10.1038/ng0198-25
13. Cooper, EC . Potassium channels (including KCNQ) and epilepsy In: JLN Th, M Avoli, MA Rogawski, RW Olsen, and AV Delgado-Escueta, editors. Jasper’s basic mechanisms of the epilepsies. Bethesda, MD: National Center for Biotechnology Information (2012).
14. Allen, NM , Weckhuysen, S , Gorman, K , King, MD , and Lerche, H . Genetic potassium channel-associated epilepsies: clinical review of the Kv family. Eur J Paediatr Neurol. (2020) 24:105–16. doi: 10.1016/j.ejpn.2019.12.002
15. Berg, AT , Mahida, S , and Poduri, A . KCNQ2-DEE: developmental or epileptic encephalopathy? Ann Clin Trans Neurol. (2021) 8:666–76. doi: 10.1002/acn3.51316
16. Cossu, A , Lo Barco, T , Proietti, J , Dalla Bernardina, B , Cantalupo, G , Ghobert, L, et al. Clinical characteristics of 80 subjects with KCNQ2-related encephalopathy: results from a family-driven survey. Epilepsy Behav. (2023) 142:109153. doi: 10.1016/j.yebeh.2023.109153
17. Springer, K , Varghese, N , and Tzingounis, AV . Flexible stoichiometry: implications for KCNQ2- and KCNQ3-associated neurodevelopmental disorders. Dev Neurosci. (2021):1–10. doi: 10.1159/000515495
18. Dirkx, N , Miceli, F , Taglialatela, M , and Weckhuysen, S . The role of Kv7.2 in neurodevelopment: insights and gaps in our understanding. Front Physiol. (2020) 11:570588. doi: 10.3389/fphys.2020.570588
19. Kanaumi, T , Takashima, S , Iwasaki, H , Itoh, M , Mitsudome, A , and Hirose, S . Developmental changes in KCNQ2 and KCNQ3 expression in human brain: possible contribution to the age-dependent etiology of benign familial neonatal convulsions. Brain Dev. (2008) 30:362–9. doi: 10.1016/j.braindev.2007.11.003
20. Zhou, X , Song, M , Chen, D , Wei, L , and Yu, SP . Potential role of KCNQ/M-channels in regulating neuronal differentiation in mouse hippocampal and embryonic stem cell-derived neuronal cultures. Exp Neurol. (2011) 229:471–83. doi: 10.1016/j.expneurol.2011.03.018
21. Safiulina, VF , Zacchi, P , Taglialatela, M , Yaari, Y , and Cherubini, E . Low expression of Kv7/M channels facilitates intrinsic and network bursting in the developing rat hippocampus. J Physiol. (2008) 586:5437–53. doi: 10.1113/jphysiol.2008.156257
22. Kim, K-W , Kim, K , Kim, H-J , Kim, B-I , Baek, M , and Suh, B-C . Posttranscriptional modulation of KCNQ2 gene expression by the miR-106b microRNA family. Proc Natl Acad Sci. (2021) 118:e2110200118. doi: 10.1073/pnas.2110200118
23. Hou, B , Varghese, N , Soh, H , Santaniello, S , and Tzingounis, AV . Loss of KCNQ2 or KCNQ3 leads to multifocal time-varying activity in the neonatal forebrain ex vivo. eNeuro. (2021) 8:ENEURO.0024–21.2021. doi: 10.1523/ENEURO.0024-21.2021
24. Biba-Maazou, N , Becq, H , Pallesi-Pocachard, E , Sarno, S , Granjeaud, S , Montheil, A, et al. Time-limited alterations in cortical activity of a knock-in mouse model of KCNQ2-related developmental and epileptic encephalopathy. J Physiol. (2022) 600:2429–60. doi: 10.1113/JP282536
25. Okada, M , Zhu, G , Hirose, S , Ito, KI , Murakami, T , Wakui, M, et al. Age-dependent modulation of hippocampal excitability by KCNQ-channels. Epilepsy Res. (2003) 53:81–94. doi: 10.1016/S0920-1211(02)00249-8
26. Laker, D , Tolle, F , Stegen, M , Heerdegen, M , Köhling, R , Kirschstein, T, et al. Kv7 and Kir6 channels shape the slow AHP in mouse dentate gyrus granule cells and control burst-like firing behavior. Neuroscience. (2021) 467:56–72. doi: 10.1016/j.neuroscience.2021.05.025
27. Simkin, D , Marshall, KA , Vanoye, CG , Desai, RR , Bustos, BI , Piyevsky, BN, et al. Dyshomeostatic modulation of ca(2+)-activated K(+) channels in a human neuronal model of KCNQ2 encephalopathy. elife. (2021) 10:e64434. doi: 10.7554/eLife.64434
28. Peters, HC , Hu, H , Pongs, O , Storm, JF , and Isbrandt, D . Conditional transgenic suppression of M channels in mouse brain reveals functions in neuronal excitability, resonance, and behavior. Nat Neurosci. (2005) 8:51–60. doi: 10.1038/nn1375
29. Golomb, D , Yue, C , and Yaari, Y . Contribution of persistent Na+ current and M-type K+ current to somatic bursting in CA1 pyramidal cells: combined experimental and modeling study. J Neurophysiol. (2006) 96:1912–26. doi: 10.1152/jn.00205.2006
30. Yue, C , and Yaari, Y . KCNQ/M channels control spike afterdepolarization and burst generation in hippocampal neurons. J Neurosci. (2004) 24:4614–24. doi: 10.1523/JNEUROSCI.0765-04.2004
31. Verneuil, J , Brocard, C , Trouplin, V , Villard, L , Peyronnet-Roux, J , and Brocard, F . The M-current works in tandem with the persistent sodium current to set the speed of locomotion. PLoS Biol. (2020) 18:e3000738. doi: 10.1371/journal.pbio.3000738
32. Cooper, EC , Harrington, E , Jan, YN , and Jan, LY . M channel KCNQ2 subunits are localized to key sites for control of neuronal network oscillations and synchronization in mouse brain. J Neurosci. (2001) 21:9529–40. doi: 10.1523/JNEUROSCI.21-24-09529.2001
33. Lawrence, JJ , Saraga, F , Churchill, JF , Statland, JM , Travis, KE , Skinner, FK, et al. Somatodendritic Kv7/KCNQ/M channels control interspike interval in hippocampal interneurons. J Neurosci. (2006) 26:12325–38. doi: 10.1523/JNEUROSCI.3521-06.2006
34. Uchida, T , Lossin, C , Ihara, Y , Deshimaru, M , Yanagawa, Y , Koyama, S, et al. Abnormal gamma-aminobutyric acid neurotransmission in a Kcnq2 model of early onset epilepsy. Epilepsia. (2017) 58:1430–9. doi: 10.1111/epi.13807
35. Jing, J , Dunbar, C , Sonesra, A , Chavez, A , Park, S , Yang, R, et al. Removal of KCNQ2 from parvalbumin-expressing interneurons improves anti-seizure efficacy of retigabine. Exp Neurol. (2022) 355:114141. doi: 10.1016/j.expneurol.2022.114141
36. Soh, H , Park, S , Ryan, K , Springer, K , Maheshwari, A , and Tzingounis, AV . Deletion of KCNQ2/3 potassium channels from PV+ interneurons leads to homeostatic potentiation of excitatory transmission. elife. (2018) 7:e38617. doi: 10.7554/eLife.38617
37. Soh, H , Pant, R , LoTurco, JJ , and Tzingounis, AV . Conditional deletions of epilepsy-associated KCNQ2 and KCNQ3 channels from cerebral cortex cause differential effects on neuronal excitability. J Neurosci. (2014) 34:5311–21. doi: 10.1523/JNEUROSCI.3919-13.2014
38. Niday, Z , Hawkins, VE , Soh, H , Mulkey, DK , and Tzingounis, AV . Epilepsy-associated KCNQ2 channels regulate multiple intrinsic properties of layer 2/3 pyramidal neurons. J Neurosci. (2017) 37:576–86. doi: 10.1523/JNEUROSCI.1425-16.2016
39. Gee, JM , Smith, NA , Fernandez, FR , Economo, MN , Brunert, D , Rothermel, M, et al. Imaging activity in neurons and glia with a Polr2a-based and cre-dependent GCaMP5G-IRES-tdTomato reporter mouse. Neuron. (2014) 83:1058–72. doi: 10.1016/j.neuron.2014.07.024
40. Miceli, F , Soldovieri, MV , Joshi, N , Weckhuysen, S , Cooper, E , and Taglialatela, M . KCNQ2-related disorders In: MP Adam, HH Ardinger, RA Pagon, SE Wallace, LJH Bean, and G Mirzaa, et al., editors. GeneReviews((R)). Seattle (WA): University of Washington, Seattle (1993).
41. Schindelin, J , Arganda-Carreras, I , Frise, E , Kaynig, V , Longair, M , Pietzsch, T, et al. Fiji: an open-source platform for biological-image analysis. Nat Method. (2012) 9:676–82. doi: 10.1038/nmeth.2019
42. Achanta, R , Shaji, A , Smith, K , Lucchi, A , Fua, P , and Susstrunk, S . SLIC superpixels compared to state-of-the-art superpixel methods. IEEE Trans Pattern Anal Mach Intell. (2012) 34:2274–82. doi: 10.1109/TPAMI.2012.120
43. Sheroziya, MG , von Bohlen Und, O , Halbach, KU , and Egorov, AV . Spontaneous bursting activity in the developing entorhinal cortex. J Neurosci. (2009) 29:12131–44. doi: 10.1523/JNEUROSCI.1333-09.2009
44. Namiki, S , Norimoto, H , Kobayashi, C , Nakatani, K , Matsuki, N , and Ikegaya, Y . Layer III neurons control synchronized waves in the immature cerebral cortex. J Neurosci. (2013) 33:987–1001. doi: 10.1523/JNEUROSCI.2522-12.2013
45. Garaschuk, O , Linn, J , Eilers, J , and Konnerth, A . Large-scale oscillatory calcium waves in the immature cortex. Nat Neurosci. (2000) 3:452–9. doi: 10.1038/74823
46. Murata, Y , and Colonnese, MT . GABAergic interneurons excite neonatal hippocampus in vivo. Sci Adv. (2020) 6:eaba1430. doi: 10.1126/sciadv.aba1430
47. Brickley, SG , and Mody, I . Extrasynaptic GABA(a) receptors: their function in the CNS and implications for disease. Neuron. (2012) 73:23–34. doi: 10.1016/j.neuron.2011.12.012
48. Cossart, R , and Khazipov, R . How development sculpts hippocampal circuits and function. Physiol Rev. (2022) 102:343–78. doi: 10.1152/physrev.00044.2020
49. Minlebaev, M , Ben-Ari, Y , and Khazipov, R . NMDA receptors pattern early activity in the developing barrel cortex in vivo. Cereb Cortex. (2009) 19:688–96. doi: 10.1093/cercor/bhn115
50. Allene, C , and Cossart, R . Early NMDA receptor-driven waves of activity in the developing neocortex: physiological or pathological network oscillations? J Physiol. (2010) 588:83–91. doi: 10.1113/jphysiol.2009.178798
51. Wang, HS , Pan, Z , Shi, W , Brown, BS , Wymore, RS , Cohen, IS, et al. KCNQ2 and KCNQ3 potassium channel subunits: molecular correlates of the M-channel. Science. (1998) 282:1890–3. doi: 10.1126/science.282.5395.1890
52. Shapiro, MS , Roche, JP , Kaftan, EJ , Cruzblanca, H , Mackie, K , and Hille, B . Reconstitution of muscarinic modulation of the KCNQ2/KCNQ3 K(+) channels that underlie the neuronal M current. J Neurosci. (2000) 20:1710–21. doi: 10.1523/JNEUROSCI.20-05-01710.2000
53. Brown, DA , and Adams, PR . Muscarinic suppression of a novel voltage-sensitive K+ current in a vertebrate neurone. Nature. (1980) 283:673–6. doi: 10.1038/283673a0
54. Cooper, EC . Potassium channels: how genetic studies of epileptic syndromes open paths to new therapeutic targets and drugs. Epilepsia. (2001) 42:49–54. doi: 10.1111/j.1528-1167.2001.0s009.x
55. Nieto-Gonzalez, JL , and Jensen, K . BDNF depresses excitability of parvalbumin-positive interneurons through an M-like current in rat dentate gyrus. PLoS One. (2013) 8:e67318. doi: 10.1371/journal.pone.0067318
56. Dhillon, A , and Jones, RS . Laminar differences in recurrent excitatory transmission in the rat entorhinal cortex in vitro. Neuroscience. (2000) 99:413–22. doi: 10.1016/S0306-4522(00)00225-6
57. Warm, D , Schroer, J , and Sinning, A . GABAergic interneurons in early brain development: conducting and orchestrated by cortical network activity. Front Mol Neurosci. (2021) 14:807969. doi: 10.3389/fnmol.2021.807969
58. Che, A , Babij, R , Iannone, AF , Fetcho, RN , Ferrer, M , Liston, C, et al. Layer I interneurons sharpen sensory maps during neonatal development. Neuron. (2018) 99:98–116.e7. doi: 10.1016/j.neuron.2018.06.002
59. Kirmse, K , Kummer, M , Kovalchuk, Y , Witte, OW , Garaschuk, O , and Holthoff, K . GABA depolarizes immature neurons and inhibits network activity in the neonatal neocortex in vivo. Nat Commun. (2015) 6:1–13. doi: 10.1038/ncomms8750
60. Minlebaev, M , Ben-Ari, Y , and Khazipov, R . Network mechanisms of spindle-burst oscillations in the neonatal rat barrel cortex in vivo. J Neurophysiol. (2007) 97:692–700. doi: 10.1152/jn.00759.2006
61. Tatulian, L , Delmas, P , Abogadie, FC , and Brown, DA . Activation of expressed KCNQ potassium currents and native neuronal M-type potassium currents by the anti-convulsant drug retigabine. J Neurosci. (2001) 21:5535–45. doi: 10.1523/JNEUROSCI.21-15-05535.2001
Keywords: KCNQ2, epilepsy, neurological disorders, interneurons, channelopathy, neonate
Citation: Hou B, Santaniello S and Tzingounis AV (2023) KCNQ2 channels regulate the population activity of neonatal GABAergic neurons ex vivo. Front. Neurol. 14:1207539. doi: 10.3389/fneur.2023.1207539
Edited by:
Carlos De Cabo, Complejo Hospitalario Universitario de Albacete, SpainReviewed by:
Leonid S. Godlevsky, Odessa National Medical University, UkraineYukun Yuan, University of Michigan, United States
Copyright © 2023 Hou, Santaniello and Tzingounis. This is an open-access article distributed under the terms of the Creative Commons Attribution License (CC BY). The use, distribution or reproduction in other forums is permitted, provided the original author(s) and the copyright owner(s) are credited and that the original publication in this journal is cited, in accordance with accepted academic practice. No use, distribution or reproduction is permitted which does not comply with these terms.
*Correspondence: Anastasios V. Tzingounis, YW5hc3Rhc2lvcy50emluZ291bmlzQHVjb25uLmVkdQ==