Abstract
Background:
In critically ill patients, transcutaneous oxygen saturation (SpO2) upon admission is typically associated with in-hospital mortality. Nevertheless, the available information for patients with non-traumatic subarachnoid hemorrhage (SAH) is limited. In our study, our objective was to assess the correlation between SpO2 levels and mortality among patients diagnosed with severe SAH.
Methods:
In this study, we extracted data from the Medical Information Marketplace in Intensive Care (MIMIC-IV) database, which comprises information on critically ill patients. By employing matching ICD-9 and ICD-10 codes, we identified 3,328 patients diagnosed with SAH. Every individual who was admitted to the intensive care unit (ICU) had their SpO2 data and various covariates, including age, sex, diagnosis, and duration of stay, recorded upon admission. Subsequently, the patients were categorized into three distinct groups according to their SpO2 levels: low (≤95%), moderate (95–98%), and high (≥98%). To investigate the association between percutaneous oxygen saturation and mortality in patients with severe SAH, logistic regression, and cubic spline models were utilized. The main outcomes of interest were 28- and 90-day mortality rates. Additionally, subgroup analyses were conducted to evaluate these correlations and assess the consistency of interactions.
Results:
A cohort of 864 patients diagnosed with non-traumatic SAH was included in this study. The correlation between SpO2 and mortality displayed a U-shaped curve when utilizing a finite cubic spline function (non-linearity < 0.001), with the nadir in the probability of in-hospital death at 96%. Mortality at 28 and 90 days showed an inverse correlation with SpO2 < 96% (adjusted odds ratio [OR], 0.8; 95% confidence interval [CI], 0.67–0.95, and 0.76; 95% CI, 0.6–0.96). Conversely, there was a positive correlation between percutaneous oxygen saturation (SpO2) levels of ≥96% and mortality rates at both 28 and 90 days (adjusted OR, 1.17; 95% CI, 1.02–1.35 and 1.2; 95% CI, 1.05–1.39).
Conclusion:
In patients with severe subarachnoid hemorrhage, the association between SpO2 and mortality at 28 and 90 days demonstrated a U-shaped pattern. When SpO2 levels were between 95 and 98%, both short- and long-term mortality rates were at their lowest. Patients with significant subarachnoid hemorrhage had a lower chance of survival when their SpO2 values were either high or low.
Introduction
Traumatic subarachnoid hemorrhage (SAH), which accounts for 2–7% of all fatalities (1), is a serious and potentially fatal disorder primarily caused by the rupture of cerebral aneurysms. Compared to ischemic stroke and cerebral hemorrhage, non-traumatic subarachnoid hemorrhage is a more severe type of stroke (2), comprising only 5% of all strokes (3). It has an annual incidence of 8 per 100,000 people (4), occurs relatively early in life (3), and is associated with high mortality, morbidity, and poor prognosis when compared to more common strokes (5). Population-based research indicates that the median age of non-traumatic SAH patients is 55 years, and they have a morbidity and mortality rate of approximately 50% (2, 6, 7). One-third of SAH patients pass away before reaching the hospital, and the remaining patients require ICU care (1, 5). Despite adequate therapeutic care in the ICU, patients with severe SAH continue to experience a significant rate of mortality (8). Reports suggest that 30% of SAH patients die within 48 h of admission, 56% die after the first week, and 76% die after the second week (9).
Transcutaneous oxygen saturation measures how much oxygen is bound to hemoglobin in arterial blood and can be used to monitor cardiovascular disease, determine the respiratory–circulatory condition of ICU patients, and determine whether or not the blood oxygen level is normal (10). SpO2 has the benefit of being able to continually measure blood oxygen levels, dynamically reflecting the hypoxic or hyperoxic status of ICU patients, as well as being simple to monitor and observe and non-invasive. It also has an advantage over partial pressure of arterial oxygen (PaO2) and arterial oxygen saturation (SaO2) (11–15).
The detrimental effects of hypoxia are well-established, and SpO2 is valuable for monitoring hypoxemia. However, hyperoxia can also have negative consequences (16–22). Increased oxidative stress and inflammation resulting from excessive oxygen supplementation can lead to lung and systemic damage (23). Moreover, studies have demonstrated that elevated levels of oxygen saturation can adversely affect the central nervous system (24). Oxygen therapy lacks a defined standard in many therapeutic situations, and its connection with mortality among individuals with severe subarachnoid hemorrhage remains unknown. While studies have discussed the impact of transcutaneous oxygen saturation on in-hospital mortality in intensive care patients with brain injury (25), patients with severe non-traumatic subarachnoid hemorrhage have not been extensively investigated.
Therefore, this study utilizes data from a large intensive care database to examine the relationship between transcutaneous oxygen saturation and death in patients with critical subarachnoid hemorrhage.
Materials and methods
Study population
The Critical Care Medical Information Marketplace MIMIC-IV (v2.2) database, maintained by the MIT Laboratory of Computational Physiology,1 was utilized in this study and contains all the necessary data. This database is a comprehensive, open-access, well-documented, and freely available longitudinal single-center database that encompasses inpatient information from cases accepted into the Boston Higher Medical Center in Boston, Massachusetts, United States, between 2008 and 2019. The extraction of unprocessed patient data from the database and its subsequent development for retrospective investigations was validated by the Beth Israel Deaconess Medical Center (Boston, MA, United States) and the Massachusetts Institute of Technology (Cambridge, MA, United States).
It was justified to utilize the MIMIC-IV (V2.2) database for this study for the following reasons: First, all data within the database were carefully de-identified, meaning patient identities were replaced with randomization numbers. This anonymization process is an integral part of MIMIC-IV’s design, which aims to facilitate various research and instructional endeavors while upholding patient privacy and simplifying the conduct of clinical research. Consequently, the requirement for informed consent was waived by the Ethics Committee at Beth Israel Deaconess Medical Center. It should be highlighted that this study followed the guidelines stated in the Declaration of Helsinki and adhered to the principles outlined in the Statement to Strengthen Reporting of Observational Studies in Epidemiology (STROBE). Furthermore, author JL has satisfactorily completed the Collaborative Institutional Training Initiative (CITI) course and obtained a passing score on the “Data or Sample Study Only” exam (ID: 52698592), granting her access to the database for extracting the information required to analyze the correlation between mortality and SpO2 in patients with severe subarachnoid hemorrhage. The diagnosis of SAH determined using the International Classification of Diseases (ICD) includes both the ninth revision (ICD-9) and the tenth revision (ICD-10).
There were 257,366 patients in MIMIC-IV overall from 2008 to 2019, of whom 69,619 were admitted to the ICU. Of these, a total of 3,328 patients were selected based on the following recorded ICD-9 code: 430 and ICD-10 codes: I60, I600 ~ I6012, I6000 ~ I6002, I6020 ~ I6022, I6030 ~ I6032, and I6050 ~ I6052, and 3,328 patients with SAH were included. An analysis was conducted that included patients who satisfied the following criteria for selection: (1) it was their first ICU admission; (2) they were over 18 years of age; and (3) SpO2 recordings were available within 24 h before admission. Exclusion criteria included those as follows: (1) clear evidence of trauma as the cause; (2) ICU stay of less than 24 h; (3) ICU readmission; (4) missing data exceeding 5%; (5) lack of follow-up information; (6) ICU stay of fewer than 48 h with fewer than 24 recorded SpO2 measures; and (7) patients who had not received oxygen therapy. As a result, this study only comprised 864 patients.
Data acquisition
The MIMIC-IV database was utilized to extract the following variables on the initial day of ICU admission: (1) Demographic variables: age and insurance status. (2) Vital signs: temperature, respiratory rate, heart rate, and oxygen saturation levels were recorded on the first day of ICU admission. (3) Comorbidities: comorbidity index, heart failure, atrial fibrillation, vascular disease, stroke, chronic respiratory disease, liver disease, diabetes mellitus, nephropathy, benign tumors, and metastatic solid tumors. (4) Laboratory tests were performed within the initial 24 h after ICU admission, including white blood cell count, platelet count, serum potassium level, serum sodium level, hemoglobin level, blood glucose level, serum chloride level, urea nitrogen level, creatinine level, anion gap, APTT, and other laboratory markers. If a variable was measured multiple times within the previous 24 h, the mean value was used. (5) Glasgow Coma Scale (GCS), Simplified Acute Physiology Score II (SAPS II), and Acute Physiology Score III (APS III) scores were used to assess the severity of illness upon admission. (6) The duration of ICU stay, overall length of hospital stay, occurrences of death within the ICU, and cases of death during hospitalization. Please note that all the data utilized in this study for analysis and research purposes were exclusively extracted from the MIMIC-IV database.
Endpoints
Endpoints include short-term mortality (28-day mortality) and long-term mortality (90-day mortality).
Statistics
Regarding continuous variables, statistical measures such as the mean, standard deviation, or median (interquartile range) were employed. Based on the normality of the distribution, either independent sample t-tests or Mann–Whitney U-tests were conducted for statistical comparison. To compare non-normally distributed variables between groups, the Wilcoxon rank sum test was utilized. They were also reported as the median interquartile range (IQR). Categorical variable hypotheses were examined using the chi-squared test (or Fisher’s exact method), presenting the number of cases (%) for each analysis.
Based on 95 and 98%, SpO2 was split into three groups: 95, 95–98, and 98%. It was investigated how SpO2 levels correlated with ICU or hospital outcomes.
Using univariate and multivariate logistic regression models, the association between SpO2 levels and mortality rates at both 28- and 90-day intervals in patients diagnosed with severe SAH was examined. Model 1 referred to an unadjusted model; model 2 referred to a minimum adjusted model, adjusted for demographic factors such as sex, age, and race; and model 3 was a maximum adjusted model: adjusted for sex, age, race, insurance status, heart rate, respiratory rate, temperature, GCS score, atrial fibrillation, congestive heart failure, vascular disease, stroke, chronic lung disease, liver disease, diabetes mellitus, renal disease, benign tumors, white blood cell count, hemoglobin, blood chloride, blood glucose, platelet count, creatinine, anion gap, APTT, and length of hospital stay; and model 4 was a comprehensive and fully adjusted model that considered all variables listed in Table 1, ensuring a thorough examination of their impact on the outcomes.
Table 1
| Variables | Total (n = 864) | SpO₂ <95% (n = 62) | SpO₂ (≥95%, <98%) (n = 352) | SpO₂ (≥98%) (n = 450) | p value |
|---|---|---|---|---|---|
| *Age, year | 64.0 ± 17.1 | 72.0 ± 14.2 | 65.3 ± 16.2 | 61.9 ± 17.7 | < 0.001 |
| *Sex, n (%) | < 0.001 | ||||
| Female subjects | 466 (53.9) | 32 (51.6) | 176 (50) | 258 (57.3) | |
| Male subjects | 398 (46.1) | 30 (48.4) | 176 (50) | 192 (42.7) | |
| *Race, n (%) | |||||
| White | 551 (63.8) | 38 (61.3) | 272 (77.3) | 241 (53.6) | < 0.001 |
| Asian | 28 (3.2) | 3 (4.8) | 7 (2) | 18 (4) | |
| Black | 52 (6.0) | 3 (4.8) | 17 (4.8) | 32 (7.1) | |
| Other | 233 (27.0) | 18 (29) | 56 (15.9) | 159 (35.3) | |
| *Insurance, n (%) | 0.007 | ||||
| Medicaid | 57 (6.6) | 2 (3.2) | 25 (7.1) | 30 (6.7) | |
| Medicare | 317 (36.7) | 37 (59.7) | 127 (36.1) | 153 (34) | |
| Other | 490 (56.7) | 23 (37.1) | 200 (56.8) | 267 (59.3) | |
| *HR, beats/min | 79.8 ± 14.2 | 78.5 ± 14.8 | 78.1 ± 13.4 | 81.2 ± 14.6 | 0.006 |
| *SBP, mmHg | 124.7 ± 14.3 | 126.4 ± 20.7 | 126.0 ± 13.4 | 123.4 ± 13.9 | 0.023 |
| *DBP, mmHg | 63.9 ± 9.6 | 61.0 ± 9.6 | 64.8 ± 9.4 | 63.6 ± 9.7 | 0.009 |
| *MBP, mmHg | 80.7 ± 9.4 | 77.8 ± 10 | 80.9 ± 8.7 | 80.9 ± 9.7 | 0.045 |
| RR, beats/min | 18.1 ± 3.2 | 18.9 ± 4 | 17.9 ± 3.4 | 18.1 ± 3 | 0.092 |
| *Temperature, °C | 37 ± 0.6 | 36.9 ± 0.8 | 36.9 ± 0.5 | 37 ± 0.6 | 0.002 |
| *SAPSII | 33.4 ± 13.1 | 40.1 ± 18.3 | 30.1 ± 11.9 | 35 ± 12.6 | < 0.001 |
| *APSIII | 39.0 (28, 56) | 42.5 (29, 73.8) | 33 (25.8, 46) | 44 (30, 61.8) | < 0.001 |
| *GCS | 13.9 ± 1.9 | 13.9 ± 2.3 | 14.1 ± 1.5 | 13.8 ± 2.2 | 0.045 |
| *Charlson index | 4 (3, 6) | 5 (4, 6) | 4 (3, 6) | 4 (3, 6) | < 0.001 |
| Myocardial infarct | 60 (6.9) | 4 (6.5) | 22 (6.2) | 34 (7.6) | 0.776 |
| Congestive heart failure | 73 (8.4) | 8 (12.9) | 31 (8.8) | 34 (7.6) | 0.348 |
| Peripheral vascular disease | 77 (8.9) | 7 (11.3) | 31 (8.8) | 39 (8.7) | 0.791 |
| *Cerebrovascular disease | 572 (66.2) | 47 (75.8) | 218 (61.9) | 307 (68.2) | 0.044 |
| Chronic pulmonary disease | 109 (12.6) | 12 (19.4) | 43 (12.2) | 54 (12) | 0.252 |
| Mild liver disease | 41 (4.7) | 2 (3.2) | 17 (4.8) | 22 (4.9) | 0.934 |
| Diabetes | 136 (15.7) | 13 (21) | 51 (14.5) | 72 (16) | 0.424 |
| Renal disease | 65 (7.5) | 7 (11.3) | 25 (7.1) | 33 (7.3) | 0.49 |
| Metastatic solid tumor | 15 (1.7) | 1 (1.6) | 5 (1.4) | 9 (2) | 0.837 |
| *WBC, 109/L | 12.4 (9.3, 15.9) | 12.1 (9.0, 15.8) | 11.8 (8.7, 14.9) | 13.2 (10.1, 16.8) | < 0.001 |
| *Hemoglobin, g/dL | 11.6 ± 2.1 | 12 ± 1.7 | 12 ± 2.1 | 11.2 ± 2 | < 0.001 |
| platelets, 109/L | 202.6 ± 82.3 | 209.6 ± 78.3 | 207.2 ± 87.0 | 198.1 ± 78.9 | 0.233 |
| *Glucose, mg/dL | 135.2 (116.6, 158.8) | 143.8 (123.5, 242.9) | 132.2 (114.0, 152.9) | 136.2 (118.4, 159) | 0.007 |
| *Sodium, mmol/L | 141.1 ± 4.8 | 145 ± 6 | 140.3 ± 4.1 | 141.8 ± 4.9 | < 0.001 |
| Potassium, mmol/L | 4.3 ± 0.7 | 4.2 ± 0.5 | 4.2 ± 0.7 | 4.3 ± 0.8 | 0.546 |
| *Chloride, mmol/L | 107.1 ± 5.6 | 105.4 ± 6 | 105.5 ± 5 | 108.6 ± 5.7 | < 0.001 |
| *BUN, mg/dL | 17 (13, 22.2) | 20.5 (16, 28) | 17 (13, 23) | 16 (12, 22) | < 0.001 |
| *Creatinine, mg/dL | 0.9 (0.7, 1.1) | 1 (0.8, 1.3) | 0.9 (0.7, 1.1) | 0.9 (0.7, 1.1) | 0.023 |
| *Bicarbonate, mmoL/L | 24.8 ± 3.3 | 25.4 ± 4.8 | 25.3 ± 3 | 24.3 ± 3.1 | < 0.001 |
| Anion gap, mmoL/L | 16 ± 3.4 | 16.2 ± 3 | 15.8 ± 3.2 | 16.2 ± 3.6 | 0.364 |
| *INR | 1.3 ± 0.9 | 1.4 ± 0.7 | 1.4 ± 1.3 | 1.2 ± 0.4 | 0.045 |
| PT, s | 12.8 (11.9, 14.4) | 13.4 (12.2, 14.9) | 12.8 (11.9, 14.4) | 12.8 (11.9, 14.1) | 0.133 |
| APTT, s | 28.5 (25.6, 33.5) | 28.9 (26.4, 34.2) | 28.4 (25.6, 33.0) | 28.6 (25.4, 33.8) | 0.57 |
| *ICU LOS (day) | 3 (1, 9) | 1 (1, 2) | 2 (1, 7) | 5 (2, 11) | < 0.001 |
| *Hospital LOS (day) | 8 (4, 15) | 3(1, 9) | 7 (4, 12) | 10 (5, 19) | < 0.001 |
| *Hospital mortality, n (%) | 166 (19.2) | 29 (46.8) | 44 (12.5) | 93 (20.7) | < 0.001 |
| *28-day mortality, n (%) | 191 (22.1) | 25 (40.3) | 65 (18.5) | 101 (22.4) | < 0.001 |
| *90-day mortality, n (%) | 220 (25.5) | 28 (45.2) | 73 (20.7) | 119 (26.4) | < 0.001 |
Baseline characteristics of selected patients grouped by SpO2 level.
SpO₂, Percutaneous oxygen saturation; SBP, Systolic blood pressure; DBP, Diastolic blood pressure; MBP, Mean blood pressure; RR, Respiratory rate; HR, Heart rate; SAPS II, Simplified acute physiology score II; GCS, Glasgow Coma Score; Chronic pulmonary disease, Chronic obstructive pulmonary disease; WBC, White blood cell; BUN, Blood urea nitrogen; INR, International normalized ratio; PT, Prothrombin time; APTT, Activated partial thromboplastin time; ICU LOS, Intensive care unit length of stay; Hospital LOS, Hospital length of stay.
Additionally, we employed stratified linear regression models, likelihood ratio tests, and curve fitting to establish the correlation between SpO2 levels and ICU or in-hospital mortality rates. In the study, we had the following data: age (<60 or ≥ 60 years), GCS score (<8 or ≥ 8), SAPS II score (<30 or ≥ 30), and length of ICU stay (<7 or ≥ 7 days). Statistical analysis was conducted using the R software package (R Foundation, http://www.R-project.org) and Free Statistics software version 1.7. A value of p < 0.05 was employed as the threshold for determining statistical significance.
Results
Baseline characteristics of the participants
The analysis included 864 consecutive participants (Figure 1). Their SpO2 levels were categorized into three groups using thresholds of 95 and 98%. Table 1 provides an overview of the baseline characteristics, revealing that the average age of the participants was 64.0 ± 17.1 years, with men accounting for 46.1% of the study population. Participants with high SpO2 (≥98%) were younger and mostly women. Mortality at 28 and 90 days was 22.1 and 25.5%, respectively. The low SpO2 (<95%) group had the highest mortality rate, followed by the high SpO2 (≥98%) group (p < 0.05). In the high SpO2 (≥98%) group, several notable differences were observed when compared to other racial backgrounds. These differences included a higher heart rate, lower systolic blood pressure, elevated body temperature, higher APS III score, lower GCS score, increased white blood cell count, lower hemoglobin level, higher chloride ion level, shorter ICU stay, and shorter overall hospital stay (p < 0.05). In the low SpO2 (<95%) group, participants displayed distinct characteristics, including higher systolic blood pressure, lower diastolic blood pressure, decreased mean arterial pressure, accelerated respiratory rate, higher SAPS II score, elevated BUN level, prolonged ICU stay, and extended overall hospital stay (p < 0.05). However, no significant differences were observed among the three groups in terms of complications and relevant parameters (p < 0.05).
Figure 1

Patient selection flowchart. ICD10, Tenth version of the International Classification of Disease; ICD9, Ninth version of the International Classification of Disease; ICU, Intensive care unit; MIMIC-IV, Medical information mart for intensive care fourth edition; SpO2, Pulse oximetry-derived oxygen saturation.
The impact of percutaneous oxygen saturation on 28- and 90-day mortality rates
In Table 2, the results of univariate logistic regression analysis demonstrated significant correlations between several factors and the 28- and 90-day mortality rates. These factors included age, insurance status, heart rate, body temperature, respiratory rate, oxygen saturation, comorbidity index, congestive heart failure, chronic respiratory disease, renal disease, metastatic solid tumors, white blood cell count, hemoglobin level, serum sodium, serum chloride, blood urea nitrogen, anion gap, and hospitalization duration (p < 0.05).
Table 2
| Variable | 28-day mortality | 90-day mortality | ||
|---|---|---|---|---|
| OR (95%CI) | p value | OR (95%CI) | p value | |
| *Age | 1.04 (1.03 ~ 1.05) | <0.001 | 1.04 (1.02 ~ 1.05) | <0.001 |
| Sex: male subjects vs. female subjects | 1.21 (0.88 ~ 1.67) | 0.249 | 1.21 (0.89 ~ 1.64) | 0.231 |
| Race, n (%) | ||||
| White | 1 | 1 | ||
| Asian | 1.55 (0.67 ~ 3.61) | 0.309 | 1.55 (0.68 ~ 3.51) | 0.294 |
| Black | 0.7 (0.32 ~ 1.54) | 0.38 | 0.78 (0.38 ~ 1.6) | 0.495 |
| *Other | 1.41 (0.98 ~ 2.01) | 0.061 | 1.46 (1.04 ~ 2.06) | 0.029 |
| Insurance | ||||
| Medicaid | 1 | 1 | ||
| *Medicare | 4.33 (1.8 ~ 10.41) | 0.001 | 4.41 (1.94 ~ 10.04) | <0.001 |
| Other | 1.61 (0.67 ~ 3.88) | 0.289 | 1.65 (0.73 ~ 3.76) | 0.232 |
| *HR, beats/min | 1.01 (1 ~ 1.02) | 0.096 | 1.01 (1 ~ 1.02) | 0.023 |
| SBP, mmHg | 1.01 (1 ~ 1.02) | 0.06 | 1.01 (1 ~ 1.02) | 0.168 |
| DBP, mmHg | 0.99 (0.97 ~ 1.01) | 0.176 | 0.99 (0.98 ~ 1.01) | 0.401 |
| MBP, mmHg | 1 (0.98 ~ 1.02) | 0.899 | 1 (0.99 ~ 1.02) | 0.761 |
| *RR, beats/min | 1.16 (1.1 ~ 1.21) | <0.001 | 1.17 (1.12 ~ 1.23) | <0.001 |
| *Temperature, °C | 0.87 (0.66 ~ 1.14) | 0.308 | 0.75 (0.58 ~ 0.97) | 0.028 |
| *SpO₂, mean ± SD | 0.91 (0.86 ~ 0.97) | 0.004 | 0.92 (0.86 ~ 0.98) | 0.008 |
| *SAPSII | 1.07 (1.06 ~ 1.09) | <0.001 | 1.07 (1.06 ~ 1.09) | <0.001 |
| *APSIII | 1.03 (1.03 ~ 1.04) | <0.001 | 1.04 (1.03 ~ 1.04) | <0.001 |
| *GCS | 0.82 (0.76 ~ 0.89) | <0.001 | 0.82 (0.76 ~ 0.88) | <0.001 |
| *Charlson comorbidity index | 1.28 (1.2 ~ 1.38) | <0.001 | 1.29 (1.21 ~ 1.38) | <0.001 |
| *Myocardial infarct | 1.7 (0.96 ~ 3.01) | 0.067 | 1.77 (1.02 ~ 3.07) | 0.041 |
| *Congestive heart failure | 2.24 (1.35 ~ 3.72) | 0.002 | 2.21 (1.35 ~ 3.62) | 0.002 |
| Peripheral vascular disease | 0.92 (0.52 ~ 1.63) | 0.769 | 0.96 (0.56 ~ 1.64) | 0.868 |
| Cerebrovascular disease | 1.15 (0.81 ~ 1.62) | 0.43 | 1.16 (0.84 ~ 1.61) | 0.377 |
| *Chronic pulmonary disease | 1.73 (1.11 ~ 2.69) | 0.015 | 1.61 (1.04 ~ 2.47) | 0.031 |
| *Mild liver disease | 1.89 (0.97 ~ 3.69) | 0.061 | 1.94 (1.02 ~ 3.71) | 0.044 |
| Diabetes | 1.27 (0.83 ~ 1.94) | 0.267 | 1.44 (0.97 ~ 2.15) | 0.074 |
| *Renal disease | 3.17 (1.89 ~ 5.32) | <0.001 | 2.94 (1.76 ~ 4.92) | <0.001 |
| *Metastatic solid tumor | 4.16 (1.49 ~ 11.62) | 0.007 | 4.54 (1.6 ~ 12.89) | 0.005 |
| *WBC, 109/L | 1.02 (1 ~ 1.05) | 0.044 | 1.03 (1 ~ 1.05) | 0.018 |
| *Hemoglobin, g/dL | 0.89 (0.83 ~ 0.97) | 0.004 | 0.89 (0.83 ~ 0.96) | 0.002 |
| *Platelets, 109/L | 1 (0.99 ~ 1) | 0.002 | 1 (0.99 ~ 1) | 0.002 |
| Glucose, mg/dL | 1 (1 ~ 1) | 0.598 | 1 (1 ~ 1) | 0.569 |
| *Sodium, mmol/L | 1.07 (1.04 ~ 1.11) | <0.001 | 1.08 (1.04 ~ 1.12) | <0.001 |
| *Potassium, mmol/L | 1.32 (1.08 ~ 1.62) | 0.006 | 1.32 (1.09 ~ 1.61) | 0.005 |
| *Chloride, mmol/L | 1.04 (1.01 ~ 1.07) | 0.004 | 1.05 (1.02 ~ 1.08) | <0.001 |
| *BUN, mg/dL | 1.04 (1.03 ~ 1.06) | <0.001 | 1.04 (1.03 ~ 1.06) | <0.001 |
| *Creatinine, mg/dL | 1.25 (1.04 ~ 1.5) | 0.019 | 1.25 (1.04 ~ 1.5) | 0.02 |
| Bicarbonate, mmoL/L | 0.97 (0.93 ~ 1.02) | 0.286 | 0.97 (0.92 ~ 1.02) | 0.19 |
| *Anion gap, mmoL/L | 1.1 (1.05 ~ 1.15) | <0.001 | 1.1 (1.05 ~ 1.15) | <0.001 |
| INR | 1.06 (0.91 ~ 1.24) | 0.434 | 1.1 (0.95 ~ 1.28) | 0.218 |
| PT, s | 1.01 (0.99 ~ 1.02) | 0.431 | 1.01 (1 ~ 1.03) | 0.173 |
| APTT, s | 1 (1 ~ 1.01) | 0.335 | 1 (1 ~ 1.01) | 0.261 |
| *ICU LOS (day) | 0.97 (0.94 ~ 0.99) | 0.014 | 0.97 (0.95 ~ 0.99) | 0.011 |
| *Hospital LOS (day) | 0.95 (0.93 ~ 0.97) | <0.001 | 0.95 (0.93 ~ 0.97) | <0.001 |
Univariate logistic analysis between oxygen saturation and 28- or 90-day mortality.
SpO₂, Percutaneous oxygen saturation; SBP, Systolic blood pressure; DBP, Diastolic blood pressure; MBP, Mean blood pressure; RR, Respiratory rate; HR, Heart rate; SAPS II, Simplified acute physiology score II; GCS, Glasgow Coma Score; Chronic pulmonary disease, Chronic obstructive pulmonary disease; WBC, White blood cell; BUN, Blood urea nitrogen; INR, International normalized ratio; PT, Prothrombin time; APTT, Activated partial thromboplastin time; ICU LOS, Intensive care unit length of stay; and Hospital LOS, Hospital length of stay.
In the multivariable logistic model, we observed consistent associations between SpO2 and the 28- and 90-day mortality rates across all four models (Table 3). When analyzing SpO2 as a continuous variable, we found a negative correlation with mortality rates. Furthermore, when SpO2 was categorized, the SpO2 (<95%) group exhibited an increased risk of mortality compared to the SpO2 (95–98%) group in critically ill SAH patients (adjusted OR, 1.67; 95% CI, 1.08–3.46 for 28-day mortality, and 1.79; 95% CI, 1.02–3.65 for 90-day mortality). In the fully adjusted model, which took into account all covariates listed in Table 1, the SpO2 (>98%) group showed an increased risk of mortality compared to the SpO2 (95–98%) group in critically ill SAH patients (adjusted OR, 1.14; 95% CI, 1.01–1.36 for 28-day mortality, and 1.36; 95% CI, 1.12–1.47 for 90-day mortality). However, no significant relationship was found between high oxygen saturation (SpO2 > 98%) and mortality rates in critically ill SAH patients in the unadjusted model, minimal adjustment model, and maximal adjustment model (which included various demographic and clinical factors).
Table 3
| Variable | Non-adjusted model | Minimally adjusted model | Multiply adjusted model | Fully adjusted model | ||||
|---|---|---|---|---|---|---|---|---|
| OR (95% CI) | p-value | OR (95% CI) | p-value | OR (95% CI) | p-value | OR (95% CI) | p-value | |
| 28-day mortality | ||||||||
| *SpO₂ (%) | 0.91 (0.86 ~ 0.97) | 0.004 | 0.94 (0.88 ~ 1.01) | 0.07 | 0.96 (0.89 ~ 1.04) | 0.301 | 0.91 (0.84 ~ 0.99) | 0.033 |
| SpO₂ tertiles | ||||||||
| *Low (<95%) | 2.98 (1.68 ~ 5.3) | <0.001 | 2.36 (1.29 ~ 4.28) | 0.005 | 1.77 (1.1 ~ 3.48) | 0.06 | 1.67 (1.08 ~ 3.46) | 0.046 |
| Medium (95–98%) | Reference | Reference | Reference | Reference | ||||
| High (>98%) | 1.28 (0.9 ~ 1.81) | 0.168 | 1.35 (0.93 ~ 1.96) | 0.114 | 1.24 (0.81 ~ 1.92) | 0.324 | 1.14 (1.01 ~ 1.36) | 0.502 |
| p for trend | 0.85 (0.66 ~ 1.09) | 0.201 | 0.93 (0.72 ~ 1.21) | 0.602 | 0.96 (0.7 ~ 1.31) | 0.792 | 0.75 (0.54 ~ 1.05) | 0.094 |
| 90-day mortality | ||||||||
| *SpO₂ (%) | 0.92 (0.86 ~ 0.98) | 0.008 | 0.95 (0.89 ~ 1.01) | 0.1 | 0.97 (0.9 ~ 1.05) | 0.481 | 0.92 (0.85 ~ 1) | 0.041 |
| SpO₂ tertiles | ||||||||
| *Low (<95%) | 3.15 (1.79 ~ 5.52) | <0.001 | 2.5 (1.39 ~ 4.49) | 0.002 | 1.82 (0.93 ~ 3.55) | 0.08 | 1.79 (1.02 ~ 3.65) | 0.012 |
| Medium (95–98%) | Reference | Reference | Reference | Reference | ||||
| High (>98%) | 1.37 (0.99 ~ 1.92) | 0.061 | 1.45 (1.02 ~ 2.07) | 0.04 | 1.38 (0.91 ~ 2.09) | 0.129 | 1.36 (1.12 ~ 1.47) | 0.767 |
| p for trend | 0.89 (0.7 ~ 1.13) | 0.33 | 0.97 (0.75 ~ 1.25) | 0.816 | 1.03 (0.76 ~ 1.39) | 0.86 | 0.79 (0.57 ~ 1.09) | 0.146 |
Multivariate logistic analysis between percutaneous oxygen saturation and 28- or 90-day mortality.
Unadjusted: Unadjusted for covariates. Minimally adjusted model: Adjusted for age, sex, and race. Multivariable adjusted model: Adjusted for age, sex, race, insurance status, heart rate, respiratory rate, temperature, GCS score, congestive heart failure, atrial fibrillation, vascular disease, stroke, chronic lung disease, liver disease, diabetes, renal disease, benign tumor, white blood cell count, hemoglobin, platelet count, blood glucose, blood chloride, creatinine, anion gap, APTT, and length of hospital stay. Fully adjusted model: Adjusted for all covariates listed in Table 1. SpO₂, Percutaneous oxygen saturation; OR, Odds ratio; CI, Confidence interval.
Figure 2 illustrates the correlation between average SpO2 and both 28- and 90-day mortality rates. It is noteworthy that both hypoxemia and hyperoxemia are associated with an increased risk of mortality. As a result, we have identified a specific range of SpO2 values that carries a lower risk of mortality. To account for various factors such as age, sex, race, GCS score, SAPS II score, APS III score, and length of hospital stay, we employed restricted cubic splines to analyze the relationship between SpO2 and mortality rates in SAH patients. Our findings revealed a non-linear, U-shaped pattern in the relationship between SpO2 and in-hospital mortality (p < 0.001). The nadir of the mortality risk was observed at 96% SpO2. As the saturation level increased beyond this point, a less pronounced U-shaped curve was observed. It is worth mentioning that, even without precise information on corresponding PaO2 levels, we can infer that higher oxygen levels are relatively less harmful than hypoxia.
Figure 2
Smoothed curves depicting the relationship between Sp02 levels and the risk of mortality, constructed using a restricted cubic spline model. (A) Short-term (28-day) mortality rate; (B) Long-term (90-day) mortality rate. The solid black line represents the fitted curve between Sp02 and mortality, while the gray shaded area indicates the corresponding 95% confidence interval. The model was adjusted for multiple covariates, including age, sex, race, insurance status, heart rate, respiratory rate, temperature, GCS score, congestive heart failure, atrial fibrillation, vascular disease, stroke, chronic lung disease, liver disease, diabetes, renal disease, benign tumor, white blood cell count, hemoglobin, platelet count, blood glucose, blood chloride, creatinine, anion gap, activated partial thromboplastin time (APTT), and length of hospital stay. The blue shadow in the figure represents the relative density curve of overall cases, while the red shadow represents the relative density curve of positive outcome cases. It has been explained in the caption.
Using a two-part logistic regression model, we identified a critical threshold of 96% for SpO2 (as shown in Table 4). When SpO2 levels were below 96%, we observed a negative association with both 28-day and 90-day mortality rates (adjusted OR, 0.8; 95% CI, 0.67–0.95 and 0.76; 95% CI, 0.6–0.96). Conversely, when SpO2 levels were equal to or higher than 96%, we found a positive association with 28-day and 90-day mortality rates (adjusted OR, 1.17; 95% CI, 1.02–1.35 and 1.2; 95% CI, 1.05–1.39). These results highlight a clear inflection point at the SpO2 threshold of 96%, indicating a significant change in mortality risk as SpO2 levels fall below or rise above this critical value. It is important to note that these associations indicate a change in mortality risk as SpO2 levels fall below or rise above the 96% threshold.
Table 4
| Variable | n.total | Non-adjusted model | Multiply adjusted model | ||
|---|---|---|---|---|---|
| OR (95% CI) | p value | OR (95% CI) | p value | ||
| 28-day mortality | |||||
| SpO₂ (<96%) | 145 | 0.77 (0.66 ~ 0.91) | 0.002 | 0.8 (0.67 ~ 0.95) | 0.012 |
| SpO₂ (≥96%) | 719 | 1.12 (0.97 ~ 1.28) | 0.112 | 1.17 (1.02 ~ 1.35) | 0.028 |
| 90-day mortality | |||||
| SpO₂ (<96%) | 145 | 0.69 (0.56 ~ 0.85) | <0.001 | 0.76 (0.6 ~ 0.96) | 0.02 |
| SpO₂ (≥96%) | 719 | 1.16 (1.02 ~ 1.32) | 0.027 | 1.2 (1.05 ~ 1.39) | 0.01 |
Threshold analysis of SpO2 on 28- and 90-day mortality in SAH patients in the ICU using a two-segment regression model.
Unadjusted: Unadjusted for covariates. Multivariable adjusted model: Adjusted for age, sex, race, insurance status, heart rate, respiratory rate, temperature, GCS score, congestive heart failure, atrial fibrillation, vascular disease, stroke, chronic lung disease, liver disease, diabetes, renal disease, benign tumor, white blood cell count, hemoglobin, platelet count, blood glucose, blood chloride, creatinine, anion gap, APTT, and length of hospital stay. SpO₂, Percutaneous oxygen saturation; OR, Odds ratio; and CI, Confidence interval.
Sensitivity analysis
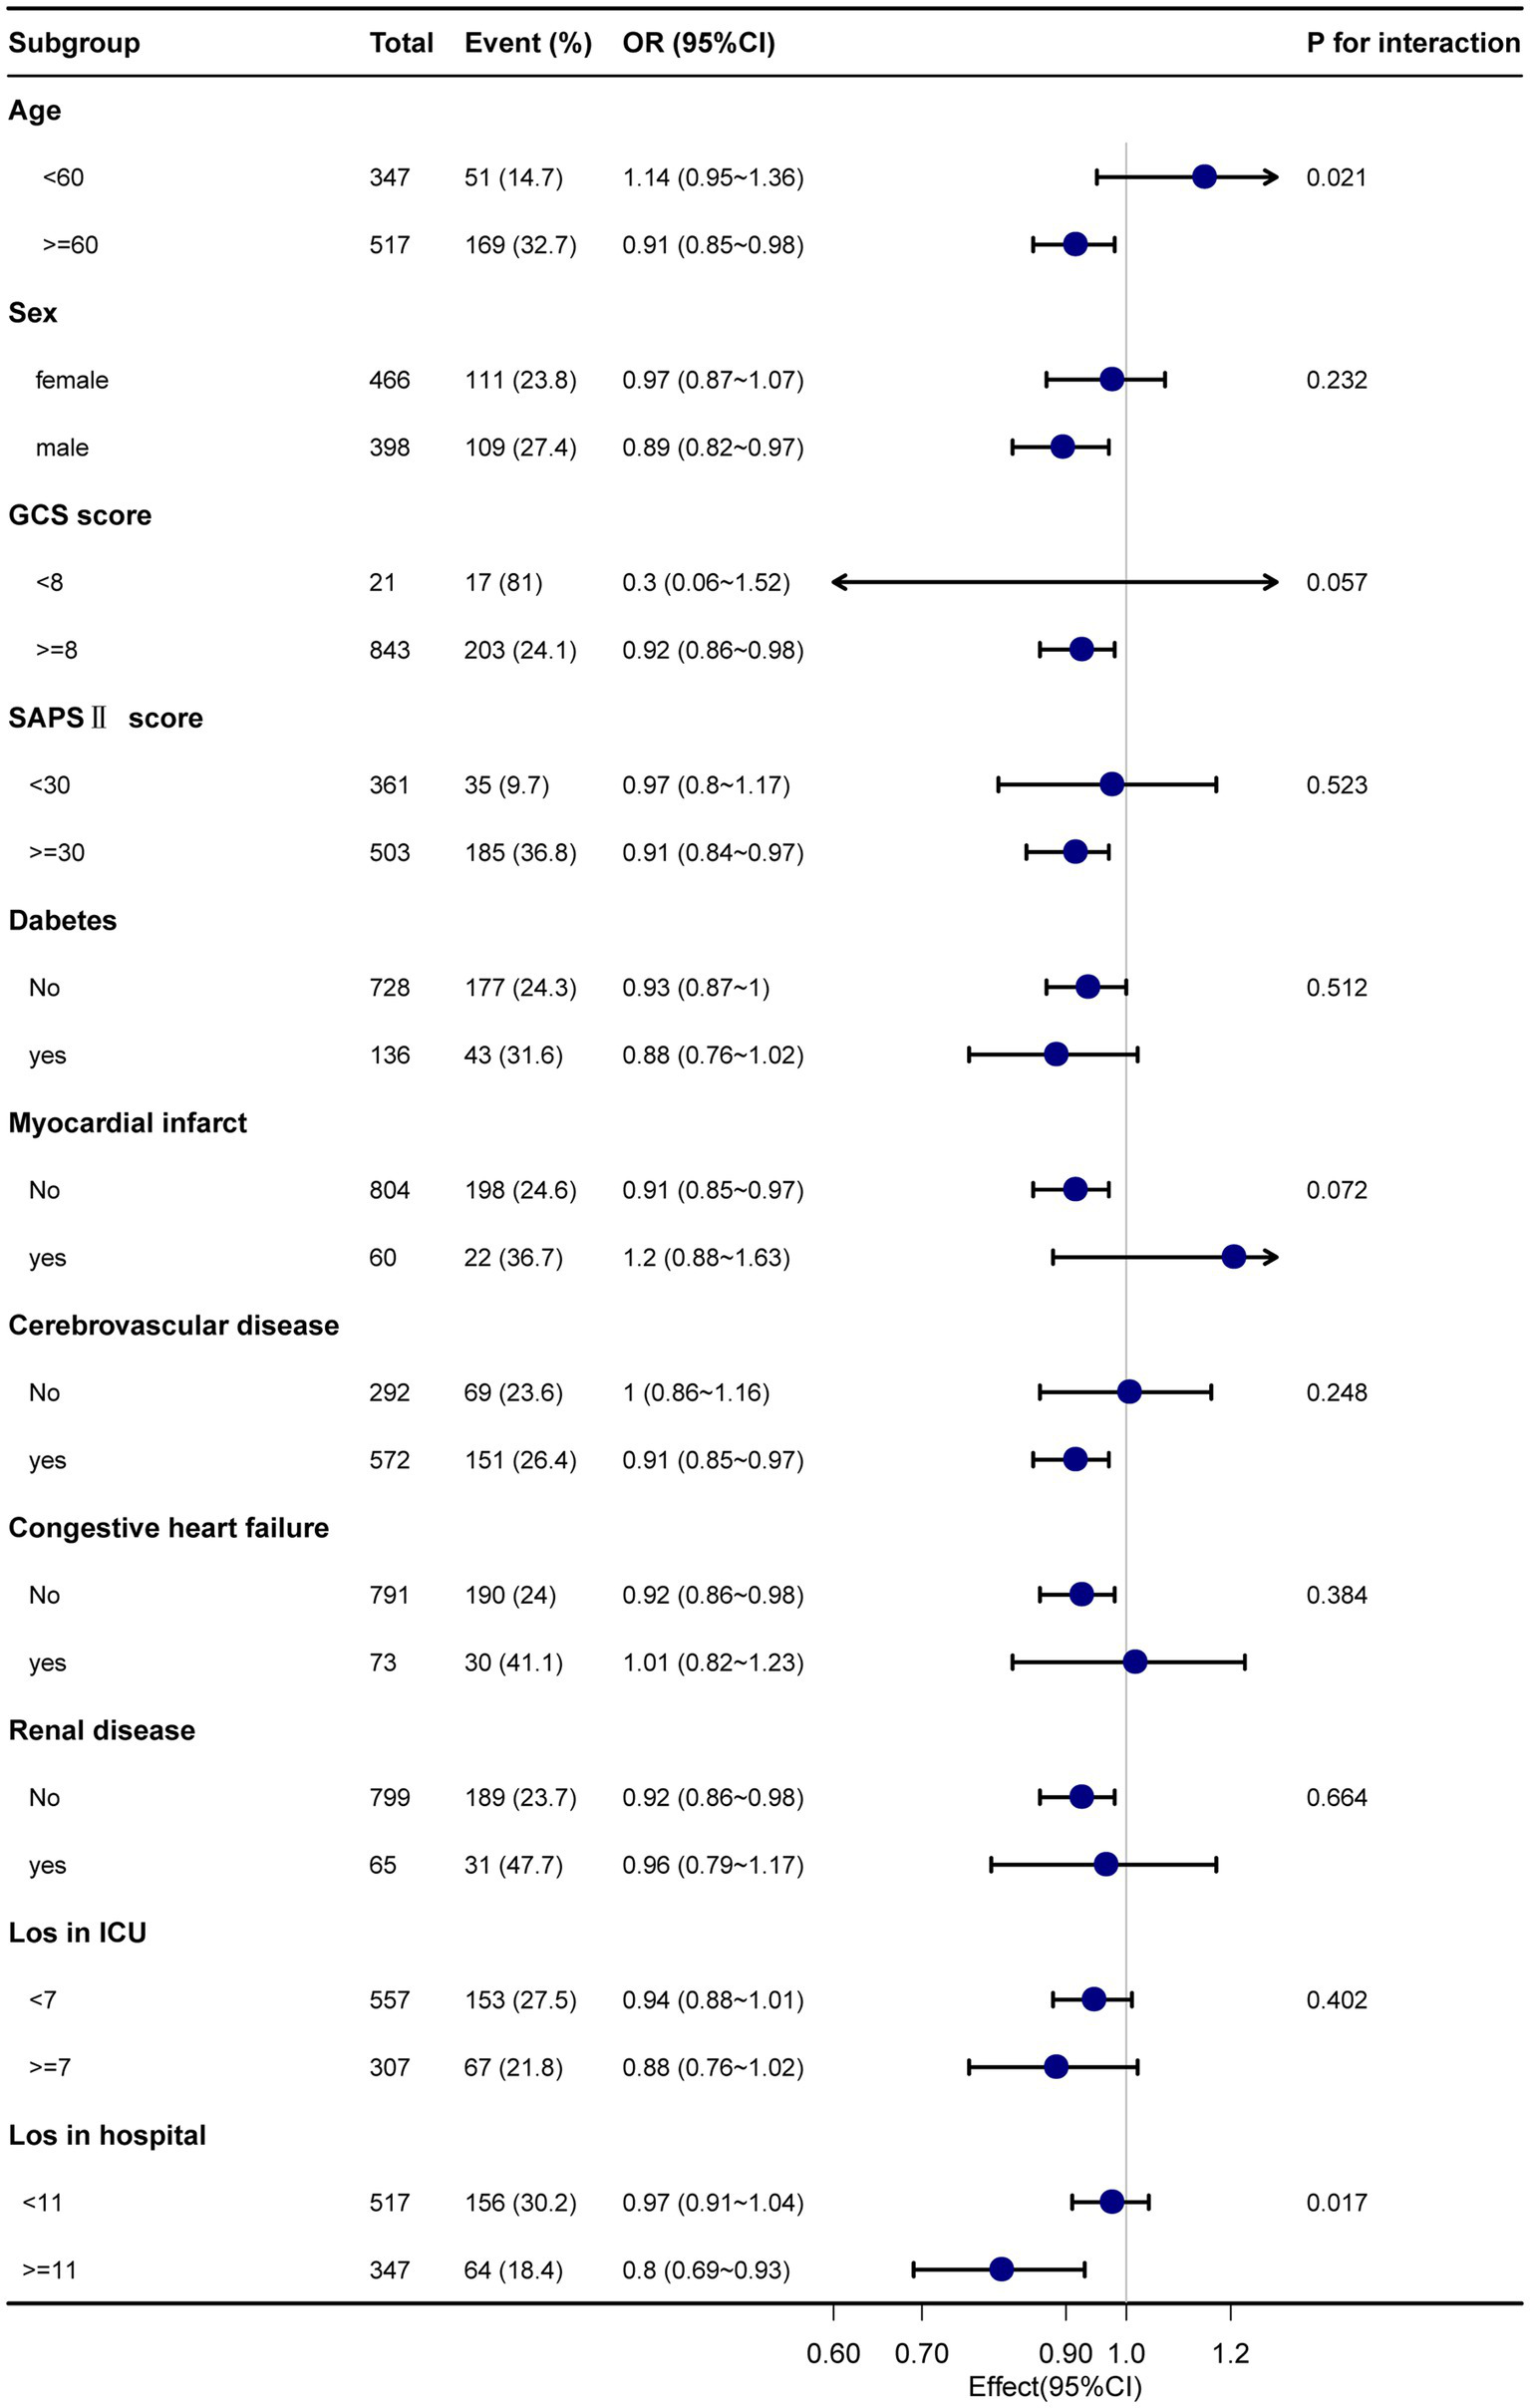
Subgroup analyses were performed considering confounding factors such as age, sex, GCS score, SAPS II score, comorbidities (diabetes, myocardial infarction, cerebrovascular disease, congestive heart failure, and renal disease), ICU length of stay, and total length of hospital stay (refer to Figures 3, 4). The results remained robust after these analyses. An interaction was observed between the GCS score and the total length of hospital stay for the 28-day mortality rate. Similarly, an interaction was found among age, GCS score, and total length of hospital stay for the 90-day mortality rate. However, no significant interactions were detected among the other variables (p > 0.05). These subgroup analyses strengthen our findings by considering potential confounders and demonstrating the consistency of the results across various subgroups, supporting the reliability of our findings.
Figure 3

The relationship between Sp02 and 28-day mortality in subgroup analysis.
Figure 4

The relationship between Sp02 and 90-day mortality in subgroup analysis.
Discussion
This study undertook an investigation into the relationship between SpO2 levels and mortality rates among individuals afflicted with subarachnoid hemorrhage (SAH). Specifically, we investigated the association between average SpO2 within 24 h of admission and both short-term (28-day) and long-term (90-day) mortality rates. Our findings unveiled an independent correlation between SpO2 levels and the risk of mortality in SAH patients. Regardless of the approach taken, whether analyzing SpO2 as a continuous or categorical variable, we observed a significant association between SpO2 levels and both short-term and long-term mortality rates. Additionally, our analysis using restricted cubic splines indicated a distinctive U-shaped curve in the relationship between SpO2 and mortality rates. This U-shaped curve suggested that there was a nadir of mortality risk at approximately 96% SpO2, indicating that mortality rates were the lowest within this range. Notably, the significance of these associations persisted even after meticulous adjustment for potential confounding factors. It is noteworthy that maintaining SpO2 levels within the range of 95–98% appeared to be beneficial for patient outcomes, as this range was associated with the lowest short-term and long-term mortality rates. Deviations from this optimal range, either above or below, had negative effects on patient survival. Overall, our study emphasizes the independent correlation between SpO2 levels assessed during the initial 24 h of admission and subsequent mortality rates among individuals diagnosed with SAH. These findings underscore the importance of monitoring and optimizing SpO2 levels to improve patient outcomes in this specific population. The correlation between SpO2 and PaO2 is deemed reliable when SpO2 levels are within the range of 95–98%. This range effectively reduces the likelihood of underestimating hypoxemia or hyperoxemia occurrences (26). Furthermore, the therapeutic benefits of SpO2 lie in its capacity to facilitate adjustments in inspired oxygen and ventilator settings according to fluctuations in SpO2 readings. This obviates the necessity for intermittent arterial blood gas measurements, providing a more streamlined approach to patient management (27).
It was believed that higher blood oxygen saturation (SpO2) resulted in better patient survival rates. However, our research findings have challenged this assumption. Our findings revealed that the group exhibiting elevated SpO2 levels had increased rates of both short-term and long-term mortality compared to the group with moderate SpO2. Similar studies have also reported similar results. For instance, Davis et al. (28) conducted a retrospective study involving 3,420 TBI patients and found a correlation between extremely high oxygen levels [PaO2 (487 mmHg)] upon admission and worse outcomes. In this study, the optimal PaO2 range was found to be between 110 and 487 mmHg (28). Another study highlighted the detrimental effects of high oxygen saturation in hospitalized patients, which encompassed prolonged hospitalization and elevated mortality rates within the healthcare setting (29). Furthermore, the lowest mortality rate among TBI patients was observed when SpO2 ranged from 94 to 98% (30), which aligns with our research findings. Currently, most research and guidelines focus on TBI patients, and there is a lack of specific research on SAH. It is worth noting that these sources emphasize the identification and correction of hypoxia in the ICU but do not address the potential harm of high oxygen levels (31). Previously, it was believed that higher oxygen saturation would lead to better patient survival rates. However, research suggests that patients with oxygen saturation levels between 98 and 100% have lower survival rates compared to those within the range of 96 and 98%.
Elevated blood oxygen levels can induce vasoconstriction in critical arterial territories, including the brain and coronary arteries, thereby aggravating post-SAH cerebral vasospasm (32). From a molecular biology standpoint, excessively elevated blood oxygen levels can lead to the generation of reactive oxygen species (ROS) as byproducts of aerobic metabolism. These ROS have the potential to cause harm to essential biological elements, such as proteins, lipids, and deoxyribonucleic acid (DNA) (33). Prolonged exposure to excessive hyperoxia invariably leads to tissue damage, causing subsequent neuronal injury, and impairment (34). Furthermore, studies have shown that excessive oxygen supplementation can increase oxidative stress and inflammation, potentially causing negative effects on both the lungs and the overall body (23).
Hypoxia is a major contributing factor to adverse outcomes in stroke, and numerous studies have recommended active oxygen therapy (35, 36). Our research has produced comparable findings, indicating significantly elevated mortality rates at both 28- and 90-day follow-ups in the low SpO2 group when compared to the group with moderate SpO2 levels. It is well known that hypoxia can lead to various problems in different systems of the human body. Many studies have indicated that hypoxia may disrupt the blood–brain barrier, cause irreversible neurological damage, and result in significant impairment (37). The vascular system in SAH is often compromised, leading to inadequate cerebral perfusion, ischemia, hypoxia, and other complications, with hypoxia exacerbating brain tissue damage. From a molecular biology standpoint, hypoxia-induced aberrant metabolism in the brain tissue sets off a cascade of events, including the development of cerebral edema and disruption of the blood–brain barrier. This creates a cyclical process that perpetuates the detrimental effects (38). Furthermore, hypoxia also causes harm to other systems in the body. Hyperoxia primarily affects the cardiovascular system by manifesting as an elevation in heart rate, increased contractility of the myocardium, impaired diastolic function, and the initial onset of arrhythmias (31). Hypoxia leads to rapid and deep breathing, and over time, respiratory muscles may become fatigued (39). In conclusion, hypoxia causes multi-system damage in SAH patients, impeding their recovery and accelerating mortality.
However, this study has several noteworthy limitations. First, within the MIMIC-IV database, we lacked access to important covariates such as delayed cerebral ischemia, hydrocephalus, intracranial hypertension, and other potential confounding factors. Additionally, there may be residual confounding variables present, as is common in retrospective analyses. Despite employing interpolation techniques, the limited availability of extensive data made it challenging to completely mitigate biases. Furthermore, this study was conducted at a single center, thereby limiting its generalizability to patients from diverse geographic regions. Moreover, the observed relationship between SpO2 and overall mortality rates established an association rather than a direct causal relationship. Therefore, it is crucial to conduct additional prospective studies to validate the findings and conclusions derived from this research.
Conclusion
In non-traumatic SAH patients, we have observed a U-shaped correlation between the initial SpO2 levels upon admission and the mortality rates at 28 and 90 days. Additionally, the lowest risks of short-term and long-term mortality were found when the average SPO₂ within the first 24 h of admission was at 96%. Elevated or reduced average SpO2 levels during the initial 24 h after admission were both linked to higher mortality rates. Nevertheless, it is worth emphasizing that additional prospective studies are required to substantiate these results.
Statements
Data availability statement
The data analyzed in this study was obtained from the Medical Information Mart for Intensive Care IV (MIMIC-IV) database. The following licenses/restrictions apply: To access the files, users must be credentialed users, complete the required training (CITI Data or Specimens Only Research), and sign the data use agreement for the project. Requests to access these datasets should be directed to PhysioNet, https://physionet.org/, DOI: 10.13026/6mm1-ek67.
Ethics statement
Ethical review and approval were not required for the study on human participants in accordance with local legislation and institutional requirements. Written informed consent from the patients/participants or patients/participants’ legal guardian/next of kin was not required to participate in this study in accordance with the national legislation and the institutional requirements.
Author contributions
JuL: Writing – original draft. ZZ: Writing – review & editing. JiL: Conceptualization, Writing – review & editing. QZ: Data curation, Writing – review & editing. YW: Investigation, Writing – review & editing. JZ: Validation, Writing – review & editing.
Funding
The author(s) declare financial support was received for the research, authorship, and/or publication of this article. This study was supported by the Tangshan Science Program Project (21130224C) and the Hebei Medical Research Project (20221533).
Acknowledgments
The authors thank Liu Jie (People’s Liberation Army of China General Hospital, Beijing, China) for helping with the data availability statement.
Conflict of interest
The authors declare that the research was conducted in the absence of any commercial or financial relationships that could be construed as a potential conflict of interest.
Publisher’s note
All claims expressed in this article are solely those of the authors and do not necessarily represent those of their affiliated organizations, or those of the publisher, the editors and the reviewers. Any product that may be evaluated in this article, or claim that may be made by its manufacturer, is not guaranteed or endorsed by the publisher.
Footnotes
References
1.
Nieuwkamp DJ Setz LE Algra A Linn FHH de Rooij NK Rinkel GJE . Changes in case fatality of aneurysmal subarachnoid haemorrhage over time, according to age, sex, and region: a meta-analysis. Lancet Neurol. (2009) 8:635–42. doi: 10.1016/S1474-4422(09)70126-7
2.
Macdonald RL Schweizer TA . Spontaneous subarachnoid haemorrhage. Lancet. (2017) 389:655–66. doi: 10.1016/S0140-6736(16)30668-7
3.
van Gijn J Kerr RS Rinkel GJE . Subarachnoid haemorrhage. Lancet. (2007) 369:306–18. doi: 10.1016/S0140-6736(07)60153-6
4.
Linn FHH Rinkel GJE Algra A Van Gijn J . Incidence of subarachnoid hemorrhage: role of region, year, and rate of computed tomography: a meta-analysis. Stroke. (1996) 27:625–9. doi: 10.1161/01.STR.27.4.625
5.
Johnston SC Selvin S Gress DR . The burden, trends, and demographics of mortality from subarachnoid hemorrhage. Neurology. (1998) 50:1413–8. doi: 10.1212/WNL.50.5.1413
6.
Hop JW Rinkel GJE Algra A Van Gijn J . Case-fatality rates and functional outcome after subarachnoid hemorrhage: a systematic review. Stroke. (1997) 28:660–4. doi: 10.1161/01.STR.28.3.660
7.
De Ley P . An Anecdotal History of Nematology. WebsterJMErikssonKBMcNamaraDG, editors. Sofia (Bulgaria): Pensoft Publishers.
8.
Samuels OB Sadan O Feng C Martin K Medani K Mei Y et al . Aneurysmal subarachnoid hemorrhage: trends, outcomes, and predictions from a 15-year perspective of a single neurocritical care unit. Neurosurgery. (2021) 88:574–83. doi: 10.1093/neuros/nyaa465
9.
Lantigua H Ortega-Gutierrez S Schmidt JM Lee K Badjatia N Agarwal S et al . Subarachnoid hemorrhage: who dies, and why?Crit Care. (2015) 19:309. doi: 10.1186/s13054-015-1036-0
10.
Zeserson E Goodgame B Hess JD Schultz K Hoon C Lamb K et al . Correlation of venous blood gas and pulse oximetry with arterial blood gas in the undifferentiated critically ill patient. J Intensive Care Med. (2018) 33:176–81. doi: 10.1177/0885066616652597
11.
Kirkwood R Lade G Dewar D Eben W Paton LF Kirkwood R et al . Testimonial to Dr. Robert Dundas Thomson. Lancet. (1853) 62:378–9. doi: 10.1016/S0140-6736(02)58085-5
12.
Vincent J-L Taccone FS He X . Harmful effects of Hyperoxia in Postcardiac arrest, Sepsis, traumatic brain injury, or stroke: the importance of individualized oxygen therapy in critically ill patients. Can Respir J. (2017) 2017:1–7. doi: 10.1155/2017/2834956
13.
Liesegang TJ . Precipitating factors in pituitary apoplexy. Am J Ophthalmol. (2002) 133:434–5. doi: 10.1016/S0002-9394(02)01364-8
14.
Gennarelli TA Champion HR Sacco WJ Copes WS Alves WM . Mortality of patients with head injury and extracranial injury treated in trauma centers. J Trauma. (1989) 29:1193–202. doi: 10.1097/00005373-198909000-00002
15.
Chu DK Kim LH-Y Young PJ Zamiri N Almenawer SA Jaeschke R et al . Mortality and morbidity in acutely ill adults treated with liberal versus conservative oxygen therapy (IOTA): a systematic review and meta-analysis. Lancet. (2018) 391:1693–705. doi: 10.1016/S0140-6736(18)30479-3
16.
Kallet RH Branson RD . Should oxygen therapy be tightly regulated to minimize Hyperoxia in critically ill patients?Respir Care. (2016) 61:801–17. doi: 10.4187/respcare.04933
17.
Maas AI Stocchetti N Bullock R . Moderate and severe traumatic brain injury in adults. Lancet Neurol. (2008) 7:728–41. doi: 10.1016/S1474-4422(08)70164-9
18.
Manning EP . Central nervous system oxygen toxicity and hyperbaric oxygen seizures. Aero Med Hum Perform. (2016) 87:477–86. doi: 10.3357/AMHP.4463.2016
19.
Martin J Mazer-Amirshahi M Pourmand A . The impact of Hyperoxia in the critically ill patient: a review of the literature. Respir Care. (2020) 65:1202–10. doi: 10.4187/respcare.07310
20.
McHugh GS Engel DC Butcher I Steyerberg EW Lu J Mushkudiani N et al . Prognostic value of secondary insults in traumatic brain injury: results from the IMPACT study. J Neurotrauma. (2007) 24:287–93. doi: 10.1089/neu.2006.0031
21.
Miller JD . Early insults to the injured brain. JAMA. (1978) 240:439–42. doi: 10.1001/jama.1978.03290050029011
22.
O’Driscoll BR Howard LS Davison AG . On behalf of the British Thoracic Society. BTS guideline for emergency oxygen use in adult patients. Thorax. (2008) 63:vi1–vi68. doi: 10.1136/thx.2008.102947
23.
Damiani E Donati A Girardis M . Oxygen in the critically ill: friend or foe?Curr Opin Anaesthesiol. (2018) 31:129–35. doi: 10.1097/ACO.0000000000000559
24.
Singer M Young PJ Laffey JG Asfar P Taccone FS Skrifvars MB et al . Dangers of hyperoxia. Crit Care. (2021) 25:440. doi: 10.1186/s13054-021-03815-y
25.
Yin H Yang R Xin Y Jiang T Zhong D . In-hospital mortality and SpO2 incritical care patients with cerebral injury: data from the MIMIC-IV database. BMC Anesthesiol. (2022) 22:386. doi: 10.1186/s12871-022-01933-w
26.
Durlinger EMJ Spoelstra-de Man AME Smit B De Grooth HJ Girbes ARJ Oudemans-van Straaten HM et al . Hyperoxia: at what level of SpO 2 is a patient safe? A study in mechanically ventilated ICU patients. J Crit Care. (2017) 39:199–204. doi: 10.1016/j.jcrc.2017.02.031
27.
Sjöberg F Singer M . The medical use of oxygen: a time for critical reappraisal. J Intern Med. (2013) 274:505–28. doi: 10.1111/joim.12139
28.
Davis DP Meade W Sise MJ Kennedy F Simon F Tominaga G et al . Both hypoxemia and extreme Hyperoxemia may be detrimental in patients with severe traumatic brain injury. J Neurotrauma. (2009) 26:2217–23. doi: 10.1089/neu.2009.0940
29.
Itagaki T Nakano Y Okuda N Izawa M Onodera M Imanaka H et al . Hyperoxemia in mechanically ventilated, critically ill subjects: incidence and related factors. Respir Care. (2015) 60:335–40. doi: 10.4187/respcare.03451
30.
Choudhury A Young G Reyad B Shah N Rahman R . Can we improve the prescribing and delivery of oxygen on a respiratory ward in accordance with new British Thoracic Society oxygen guidelines?BMJ Open Q. (2018) 7:e000371. doi: 10.1136/bmjoq-2018-000371
31.
Joyce W Wang T . Regulation of heart rate in vertebrates during hypoxia: a comparative overview. Acta Physiol. (2022) 234:e13779. doi: 10.1111/apha.13779
32.
Geoghegan P Keane S Martin-Loeches I . Change is in the air: dying to breathe oxygen in acute respiratory distress syndrome?J Thorac Dis. (2018) 10:S2133–7. doi: 10.21037/jtd.2018.06.73
33.
Terraneo L Samaja M . Comparative response of brain to chronic hypoxia and Hyperoxia. IJMS. (2017) 18:1914. doi: 10.3390/ijms18091914
34.
Daly S Thorpe M Rockswold S Hubbard M Bergman T Samadani U et al . Hyperbaric oxygen therapy in the treatment of acute severe traumatic brain injury: a systematic review. J Neurotrauma. (2018) 35:623–9. doi: 10.1089/neu.2017.5225
35.
Cole TB . Global road safety crisis remedy sought. JAMA. (2004) 291:2531. doi: 10.1001/jama.291.21.2531
36.
Girardis M Busani S Damiani E Donati A Rinaldi L Marudi A et al . Effect of conservative vs conventional oxygen therapy on mortality among patients in an intensive care unit: the oxygen-ICU randomized clinical trial. JAMA. (2016) 316:1583–9. doi: 10.1001/jama.2016.11993
37.
Halder SK Milner R . Mild hypoxia triggers transient blood-brain barrier disruption: a fundamental protective role for microglia. Acta Neuropathol Commun. (2020) 8:175. doi: 10.1186/s40478-020-01051-z
38.
Yang Z Lin P Chen B Zhang X Xiao W Wu S et al . Autophagy alleviates hypoxia-induced blood-brain barrier injury via regulation of CLDN5 (claudin 5). Autophagy. (2021) 17:3048–67. doi: 10.1080/15548627.2020.1851897
39.
Halder SK Milner R . The impact of chronic mild hypoxia on cerebrovascular remodelling; uncoupling of angiogenesis and vascular breakdown. Fluids Barriers CNS. (2021) 18:50. doi: 10.1186/s12987-021-00284-x
Summary
Keywords
transcutaneous oxygen saturation, mortality, hypoxia, hyperoxia, subarachnoid hemorrhage, intensive care unit
Citation
Liu J, Zhao Z, Li J, Zhang Q, Wang Y and Zhang J (2023) Association between transcutaneous oxygen saturation within 24 h of admission and mortality in critically ill patients with non-traumatic subarachnoid hemorrhage: a retrospective analysis of the MIMIC-IV database. Front. Neurol. 14:1292260. doi: 10.3389/fneur.2023.1292260
Received
11 September 2023
Accepted
30 October 2023
Published
20 November 2023
Volume
14 - 2023
Edited by
Luis Rafael Moscote-Salazar, Colombian Clinical Research Group in Neurocritical Care, Colombia
Reviewed by
Eder Caceres, University of La Sabana, Colombia; Miguel Urina, Simón Bolívar University, Colombia
Updates
Copyright
© 2023 Liu, Zhao, Li, Zhang, Wang and Zhang.
This is an open-access article distributed under the terms of the Creative Commons Attribution License (CC BY). The use, distribution or reproduction in other forums is permitted, provided the original author(s) and the copyright owner(s) are credited and that the original publication in this journal is cited, in accordance with accepted academic practice. No use, distribution or reproduction is permitted which does not comply with these terms.
*Correspondence: Junwei Zhang, Zjw6066@hotmail.com
Disclaimer
All claims expressed in this article are solely those of the authors and do not necessarily represent those of their affiliated organizations, or those of the publisher, the editors and the reviewers. Any product that may be evaluated in this article or claim that may be made by its manufacturer is not guaranteed or endorsed by the publisher.