 Adonay S. Nunes1*
 Meghan Pawlik2
 Ram Kinker Mishra1
 Emma Waddell3Madeleine Coffey4
 Christopher G. Tarolli2,5
 Ruth B. Schneider2,5E. Ray Dorsey2,5
 Ashkan Vaziri1Jamie L. Adams2,5
- 1BioSensics LLC, Newton, MA, United States
- 2Center for Health + Technology, University of Rochester Medical Center, Rochester, NY, United States
- 3Warren Alpert Medical School of Brown University, Providence, RI, United States
- 4Donald and Barbara Zucker School of Medicine, Uniondale, NY, United States
- 5Department of Neurology, University of Rochester Medical Center, Rochester, NY, United States
Background: Speech changes are an early symptom of Huntington disease (HD) and may occur prior to other motor and cognitive symptoms. Assessment of HD commonly uses clinician-rated outcome measures, which can be limited by observer variability and episodic administration. Speech symptoms are well suited for evaluation by digital measures which can enable sensitive, frequent, passive, and remote administration.
Methods: We collected audio recordings using an external microphone of 36 (18 HD, 7 prodromal HD, and 11 control) participants completing passage reading, counting forward, and counting backwards speech tasks. Motor and cognitive assessments were also administered. Features including pausing, pitch, and accuracy were automatically extracted from recordings using the BioDigit Speech software and compared between the three groups. Speech features were also analyzed by the Unified Huntington Disease Rating Scale (UHDRS) dysarthria score. Random forest machine learning models were implemented to predict clinical status and clinical scores from speech features.
Results: Significant differences in pausing, intelligibility, and accuracy features were observed between HD, prodromal HD, and control groups for the passage reading task (e.g., p < 0.001 with Cohen’d = −2 between HD and control groups for pause ratio). A few parameters were significantly different between the HD and control groups for the counting forward and backwards speech tasks. A random forest classifier predicted clinical status from speech tasks with a balanced accuracy of 73% and an AUC of 0.92. Random forest regressors predicted clinical outcomes from speech features with mean absolute error ranging from 2.43–9.64 for UHDRS total functional capacity, motor and dysarthria scores, and explained variance ranging from 14 to 65%. Montreal Cognitive Assessment scores were predicted with mean absolute error of 2.3 and explained variance of 30%.
Conclusion: Speech data have the potential to be a valuable digital measure of HD progression, and can also enable remote, frequent disease assessment in prodromal HD and HD. Clinical status and disease severity were predicted from extracted speech features using random forest machine learning models. Speech measurements could be leveraged as sensitive marker of clinical onset and disease progression in future clinical trials.
1 Introduction
Huntington disease (HD) is an inherited neurodegenerative disease characterized by complex motor, cognitive, and behavioral symptoms. The onset of HD features typically occurs in midlife and symptoms progressively worsen (1). Prior to meeting criteria for clinical diagnosis of HD, individuals who carry the huntingtin gene can be classified as having Prodromal HD and may experience some symptoms of HD (2). Presently, there are no disease-modifying therapies to halt or slow HD progression, and clinical care largely focuses on symptomatic management (3). However, longitudinal studies found that HD develops over many years since the onset of neurodegeneration and that some symptoms may be present years before clinical diagnosis (4, 5). Early intervention in disease progression may be critical in identifying disease modifying agents.
Speech changes often occur early in HD progression and may be observed prior to other motor, cognitive, and psychiatric symptoms, and may also be detected during the prodromal HD stage (6). Individuals with HD may exhibit alterations in speech clarity, articulation, or phonation, and experience a decline in syntactic complexity and speech rate (7, 8). HD can also disrupt the pitch, rhythm, and stress of speech (“prosodic features”) which can lead to abnormalities in the melody and timing of speech, causing irregular pausing and intensity patterns (6, 9). Since speech symptoms can present early in HD, tracking changes in speech may be a valuable marker of early disease and disease progression (6).
Assessment of HD commonly uses standardized clinician-rated outcome measures that are often administered in a clinic setting. These rating scales are limited by high inter-observer variability, insensitivity, and episodic administration (10). Digital measures can enable quantitative, remote, and passive assessment of various diseases and disease-specific features. Digital measures have become increasingly popular with a rise in the ubiquity of sensing technologies (11). In HD research, smartwatches (12), smartphone apps (13), and wearable sensors (14) have been leveraged to collect measurements of gait, finger tapping, chorea, and global activity (15, 16).
While digital measures have been most well studied to capture motor symptoms of HD (17), digital measures for speech symptoms of HD are a promising area of research given the early presence of speech features in HD progression. Speech measurements are also easy to collect and can be recorded in clinic or remote settings using simple, accessible devices (18). Different types of speech tasks can be performed to capture different features of speech, such as spontaneous free-flowing speech, passage reading, and syllable repetition (19), and features derived from phonetic, articulatory and prosodic characteristic of the speech can be used to detect and monitor neuromotor dysfunction (20). To test the sensitivity of speech features in differentiating individuals with HD, prodromal HD (pHD), and control participants, and in capturing disease severity, three speech tasks were performed. Speech feature outcomes were used to test for group differences, correlations with clinical scores, and to train machine learning models to classify groups and predict clinical scores.
2 Methods
2.1 Experimental design
Participants provided written informed consent and were enrolled in an investigator-initiated observational cohort study performed at the University of Rochester. The study was reviewed and approved by the University of Rochester institutional review board. The longitudinal study included visits every three to 6 months, for up to 3 years of total follow-up. At the baseline visit, the Montreal Cognitive Assessment (MoCA) (21) was performed, and demographics, concomitant medications, and health history were collected. At each visit the Unified Huntington Disease Rating Scale (UHDRS) (22), Timed Up and Go (23), activities of daily living, and speech tasks were performed. Activities of daily living tasks included writing a name, drinking water from a glass, unfolding a sheet and making a bed. Speech tasks included passage reading and counting forwards and backwards. Following each visit participants wore a wrist and pendant sensor for 1 week. This publication focuses solely on speech assessments from cross-sectional analyses.
2.2 Participants
Eighteen individuals with HD, 7 individuals with prodromal HD, and 11 controls had speech data available for analysis (Table 1). HD status was confirmed clinically by a movement disorders specialist investigator and either a self-reported first degree relative with HD or self-reported genetic test indicating a CAG expansion of >36 in the huntingtin gene (1). Prodromal HD participants were individuals with a self-reported CAG expansion of >36 in the huntingtin gene (1) without a self-reported clinical diagnosis of HD. Control participants were individuals in good health with no evidence of neurological disorder likely to cause involuntary movements or gait disturbance, as determined by the investigator. Exclusion criteria included pregnancy and any neurological, medical, or psychiatric conditions that would preclude participation in the activities in the investigator’s judgment. The study was approved by the Rochester ethics board.
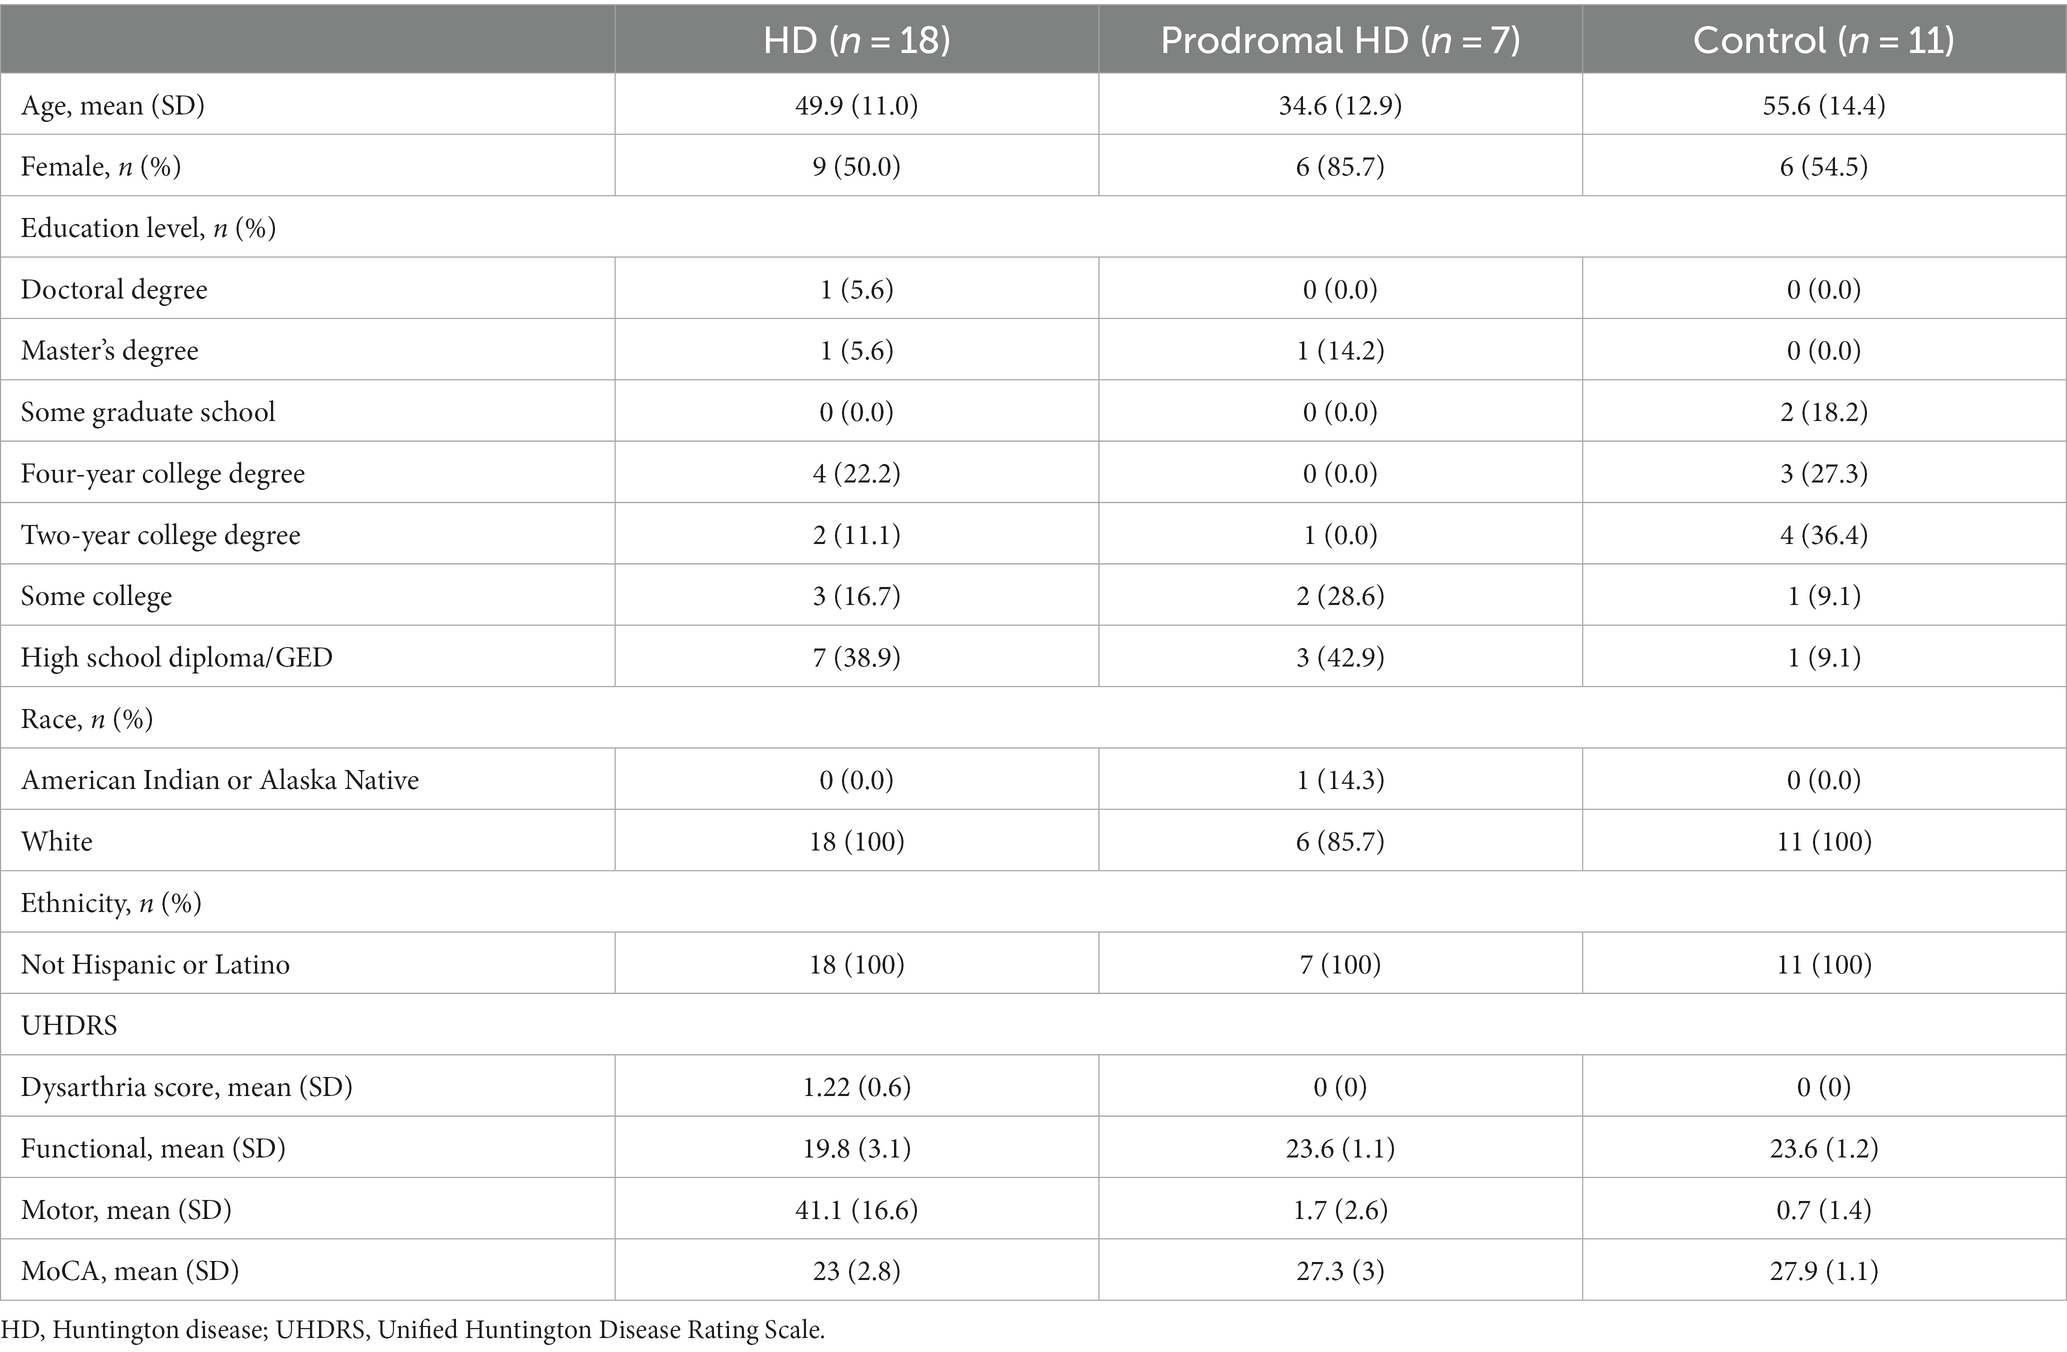
Table 1. Participant characteristics.
2.3 Digital speech assessments
Digital Speech Assessments involved three tasks each with a 40 s time limit. The first task was a passage reading exercise, specifically the initial paragraph of the standardized “Rainbow Passage” (24), which is commonly used to analyze the production of connected speech. The participants were instructed to read it at their regular pace and volume. The second task required the participants to count forward from 1 to 20. They were instructed to count comfortably, without rushing, and to continue counting even if they made a mistake. The third task involved counting backward from 50 to 30, but in increments of 3. Participants were instructed to keep counting by 3 s even if they made a mistake and not to stop. Throughout all the tasks, participants were situated in a quiet environment, and efforts were made to minimize external noise interference. The same instructions were read by the examiner for all participants, all the tasks were recorded with a same setup where the recorder was placed in the same position at the desk with a similar distance across tasks and participants.
2.4 Speech data analysis
To analyze the collected speech data, BioDigit Speech (BioSensics LLC, Newton, MA United States) was utilized (25). Prior to analyzing the data for each speech assessment, such as the Rainbow Passage, BioDigit Speech automatically identified and removed irrelevant audio segments. This process was facilitated by automated speech recognition (ASR), which transcribed the speech with an accuracy at the human-level performance and provided segment timestamps rather than word-level timestamps. BioDigit Speech inserted markers on the cross-attention layers, allowing retrieval of attention weights to obtain word-level timestamps. Optimal alignment was achieved using dynamic time warping (26), and the indexes of the optimal alignment were used to determine the beginning and end timestamps of the words. The pre-processed audio was then analyzed to extract phonatory, articulatory, prosody, and intelligibility features specific to each assessment, as described below.
2.4.1 Passage Reading features
Several features were calculated for the passage reading task. These included the total pause time, total voiced time, and their summation in total signal time, which were treated as separate features. The articulatory rate, representing the number of words articulated per second, was obtained by dividing the number of uttered words by the total voiced time. The mean pause length and the total number of pauses were calculated to assess the individual’s tendency to make longer or shorter pauses. Another feature, the speech-to-pause ratio, normalized the voiced time by the pause time, providing the proportion of speech relative to pauses or silence, regardless of the total signal duration. Additionally, three acoustic features were extracted, namely, the average loudness (measured in sone units), which quantified the sum of the root mean squared frequency signals on the Bark scale, the mean pitch (mean fundamental frequency), and the pitch standard deviation (SD). These features were considered important as decreased pulmonary capacity could impact loudness, and neuromotor difficulties in vocal fold regulation could result in pitch alterations and increased pitch variability (27, 28).
The transcription of the reading was compared with the word content of the original passage (26). The ratio of extra words and the ratio of missing words were calculated as features. Dynamic time warping was employed to compare the transcribed reading with the original passage. Instead of encoding words, a numerical coding system was utilized for individual letters, as it has been suggested to better capture speech alterations (29). Two dynamic time warping measures were extracted. The similarity dynamic time warping represented the reciprocal of the dynamic time warping distance plus one (1/(1 + dynamic time warping distance)), indicating the similarity between the original passage and the transcribed reading. Higher values indicated greater similarity between the two encoded signals. The intelligibility dynamic time warping represented the similarity between the transcription from a medium-sized automated speech recognition model and a small-sized model. The rationale behind using models of different complexities was that the smaller model would struggle to accurately transcribe unclear speech. Consequently, the less intelligible the speech, the lower the accuracy of the small speech recognition model, resulting in a smaller value for the intelligibility dynamic time warping.
2.4.2 Counting features
For counting tasks, the beginning of the speech task was determined automatically by the BioDigit Speech platform by excluding non-number words. In addition, automated speech recognition was applied to transcribe the speech, and computed the number of correct counts, incorrect counts, and the correct counts ratio (i.e., the ratio between the number of correct and total counts). As in passage, timing features were calculated (total voice, pause and signal times, and speech to pause ratio, number of pauses and mean pause length) as well as articulatory rate and the number of counts per second.
2.5 Statistical analysis
To evaluate the statistical significance of the null hypothesis, an independent pairwise t-test was employed to compare each extracted feature across the three groups. Cohen’s d was computed to estimate the effect size of the observed differences between the groups. To explore the associations between the speech features and the clinical scores (MoCA, UHDRS motor and functional, and dysarthria), correlation analyses were performed. Specifically, Pearson’s correlation coefficient was utilized for MoCA and UHDRS, which are traditionally treated as continuous scales, while Spearman’s correlation coefficient was applied for the UHDRS dysarthria score, which is a discrete scale with five values. We acknowledge the risk of Type I errors from multiple comparisons in our exploratory study. We chose not to use multiple corrections to avoid missing potentially significant findings. This decision may increase false positives but decreases the risk of overlooking meaningful results.
2.6 Machine learning
We developed a machine learning model to automate the detection of HD versus prodromal HD versus non-HD controls using speech. The passage reading task exhibited the most substantial differences between groups, compared to the counting tasks. The first machine learning model was trained using the significant speech features solely from the passage reading task. To assess if a multi-task model trained on the significant speech features from the three tasks would have more discriminative power, a second model was trained using the significant features from all speech tasks. Specifically, a random forest classifier was employed with balanced class weights, and its performance was evaluated using a weighted average and recall metrics for each group. Recall is particularly important as it measures the model’s ability to correctly identify positive instances, aiding in the detection of HD and early interventions. Recall is the “accuracy” per class, thus, for example, a 0.70 recall indicates that 70% of the class samples were correctly identified. In addition, a similar model was trained to classify dysarthria. Furthermore, to predict clinical scores of dysarthria, separate random forest regressors were trained for each of the four clinical scores. The performance of these regressors was assessed using metrics such as mean squared error, mean absolute error, and explained variance.
To ensure a robust evaluation of the models, a leave-one-subject-out cross-validation strategy was employed, a common approach for evaluating machine learning models with small sample size. In each iteration, the training set comprised all the subjects’ visits, except for one subject’s visits that was used as the test set. The reported performance represents the average performance across all iterations of the cross-validation process. This approach allows for a comprehensive assessment of the models’ generalization capabilities and helps mitigate the risk of overfitting to specific subject characteristics.
3 Results
3.1 Group differences
In the analysis of passage reading features (Table 2), several significant group differences were observed. Individuals with HD exhibited distinct speech features compared to pHD and control groups. Figure 1 shows the boxplot for the most significant speech features. The mean speech-to-pause ratio was significantly lower in the HD group (0.92, SD = 0.51) compared to both pHD (1.84, SD = 0.64, p = 0.001) and control groups (1.91, SD = 0.46, p = 0.001), indicating a higher proportion of pauses or silence relative to speech. The similarity dynamic time warping, a measure of the similarity between the original passage and the transcribed reading, was significantly lower in HD (0.37, SD = 0.34) compared to pHD (0.74, SD = 0.19, p = 0.001) and control groups (0.92, SD = 0.14, p = 0.001), indicating greater dissimilarity in speech production. Additionally, mean total pause time and total signal time were significantly longer in the HD group (pause time: 15.91, SD = 6.94; signal time: 27.53, SD = 7.00) compared to pHD (pause time: 7.01, SD = 2.43, p = 0.003; signal time: 18.60; p = 0.003) and control (pause time: 6.01, SD = 1.63, p = 0.001; signal time:16.90, SD = 2.19, p = 0.001), indicating more frequent and prolonged pauses during speech production. Other features such as intelligibility dynamic time warping, mean pause length, ratio of extra words, and ratio of missing words also showed significant differences between HD and pHD and control groups. Conversely, attributes associated with loudness, pitch, articulatory rate, and total voiced time remained consistent across groups. Notably, the pHD group exhibited few significant deviations from the control group, with exceptions in pitch mean (pHD: 166.63, SD = 24.3; control: 136, SD = 30.2; p = 0.037), pitch standard deviation (pHD: 24.62, SD = 9.06; control: 22, SD = 12.1; p = 0.026), and similarity dynamic time warping (pHD: 0.74, SD = 0.19; control: 0.92, SD = 0.14; p = 0.033).

Table 2. Descriptive statistics and group comparisons for passage reading features.

Figure 1. Boxplots illustrating speech features stratified by group. Within each boxplot, three whiskers represent the data distribution for the Control (CTR), Prodromal (pHD), and Huntington Disease (HD) groups. The whiskers indicate the 95% confidence interval, while the box represents the interquartile range (25th to 75th percentile), and the middle line represents the mean value. DTW: dynamic time warping.
When participants were grouped based on their UHDRS dysarthria scores in either no dysarthria, dysarthria score of 1, or dysarthria score of 2 (controls and pHD are negative, and HD either 1 or 2 dysarthria), several passage reading features exhibited significant differences (Table 3). Total signal time, mean pause length, ratio of extra words, similarity dynamic time warping, and total pause time were significantly higher in participants with dysarthria compared to those with no dysarthria. There were no significant differences in speech features between dysarthria scores of 1 and 2. Figure 2 shows the boxplots for the most significant features. These findings suggest that dysarthria severity is associated with altered speech patterns characterized by longer pauses, increased disfluencies, and reduced similarity to the original passage. However, loudness did not show significant differences across the dysarthria groups, indicating that dysarthria severity may not directly influence loudness in this context.
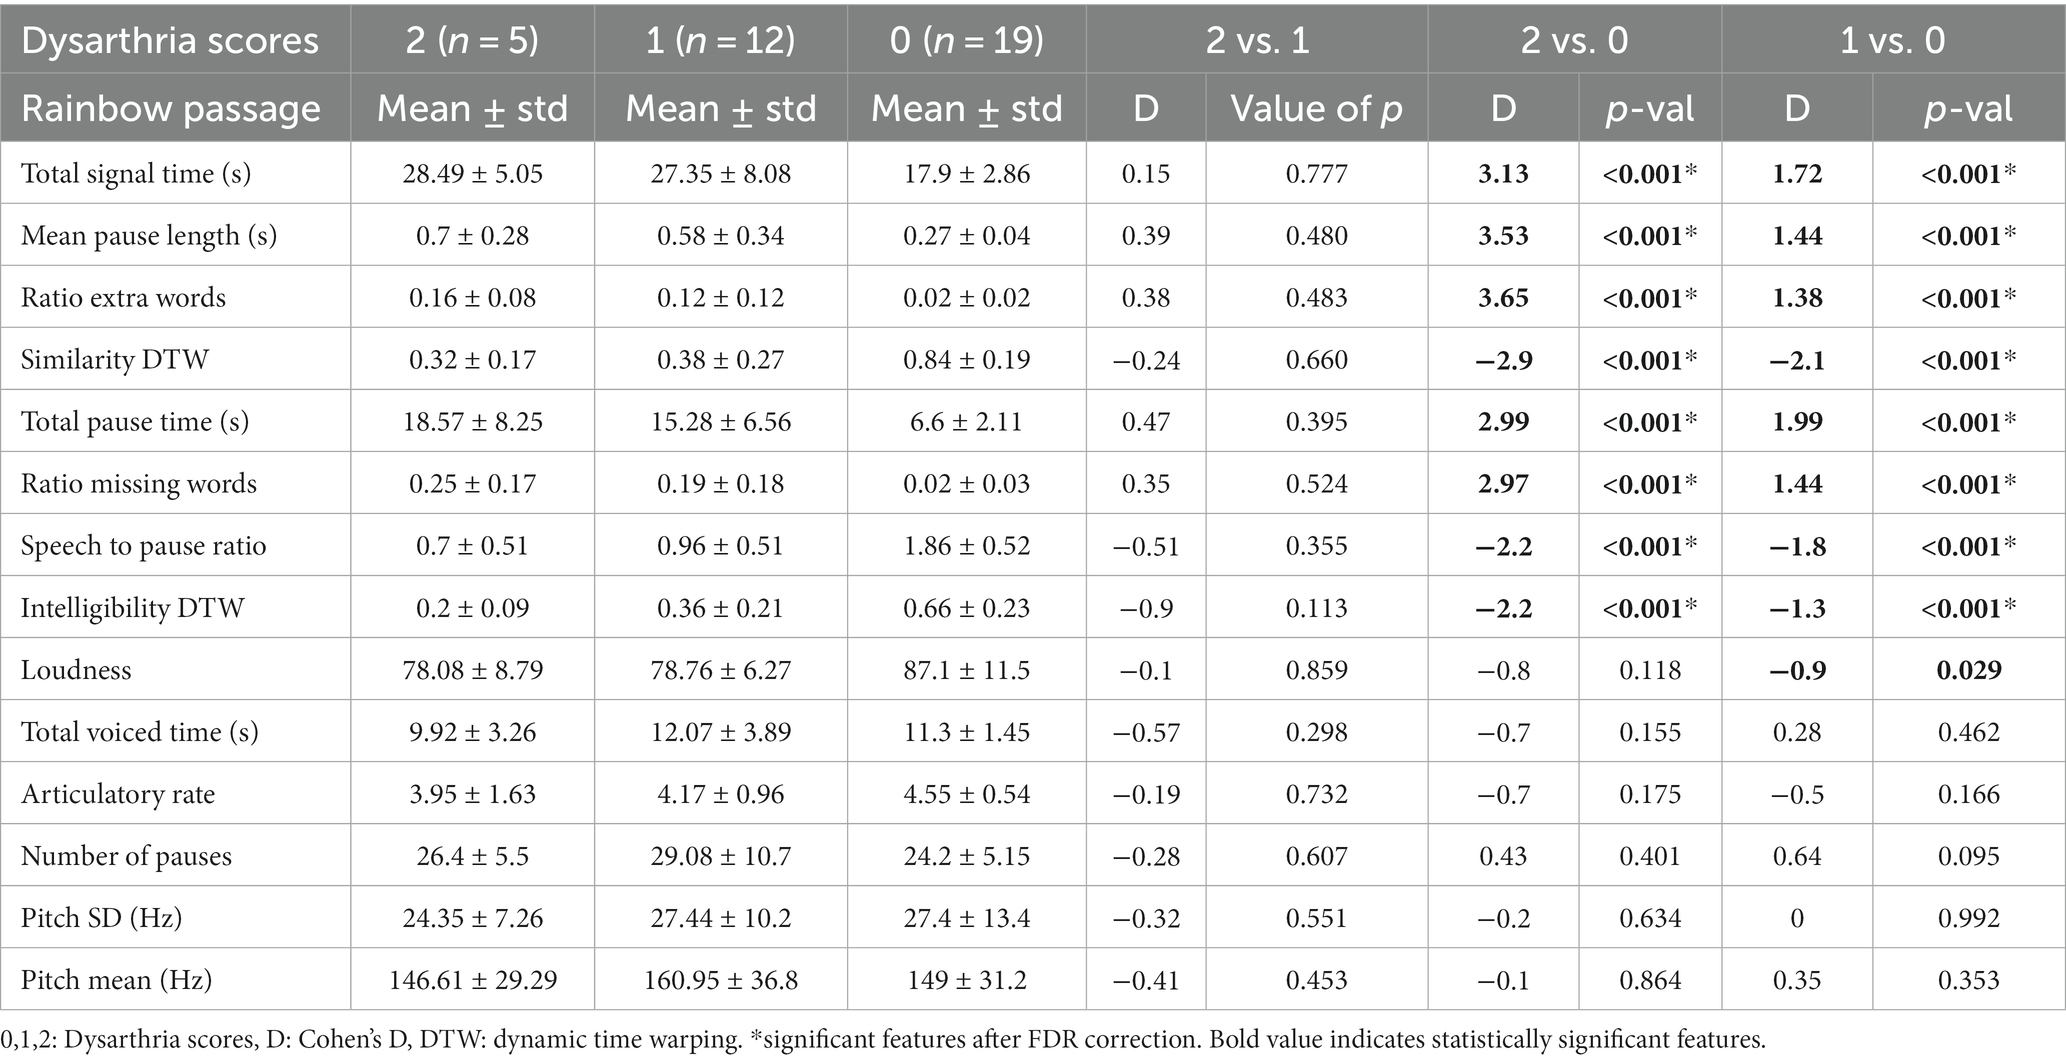
Table 3. Descriptive statistics and group comparisons for passage reading features grouping participants by their dysarthria score.
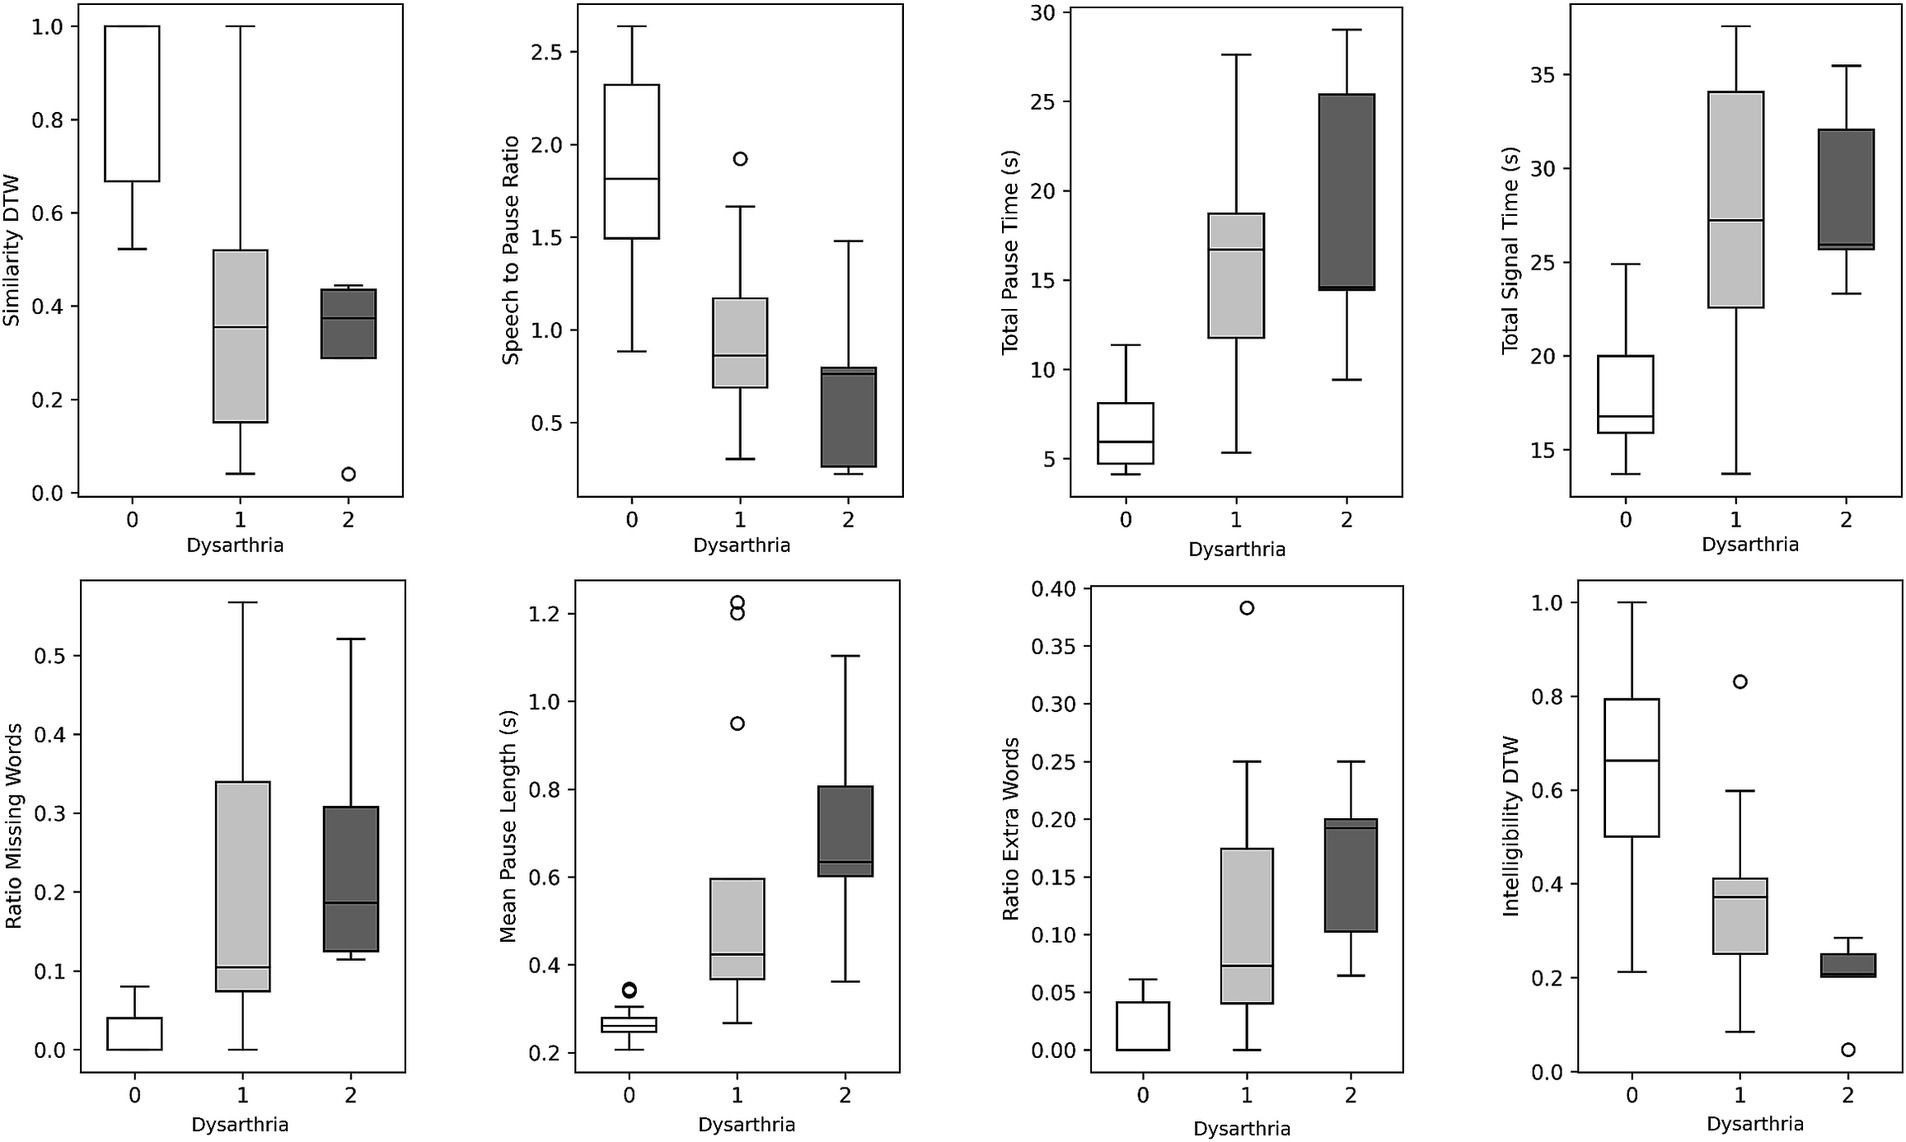
Figure 2. Boxplots illustrating speech features stratified by dysarthria scores. Within each boxplot, three whiskers represent the data distribution for individuals with dysarthria scores of 0, 1, and 2. The whiskers indicate the 95% confidence interval, while the box represents the interquartile range (25th to 75th percentile), and the middle line represents the mean value.
Group differences from counting forward and backward were not highly pronounced, except for a few features. In the counting forward task (Supplementary Table S1), the significant differences between the HD group and the control group were found in variables related to timing, such as pauses per second (HD: 1.69, SD = 0.50; control: 2.42, SD = 0.44; p = 0.001), total pause time (HD: 15, SD = 7.95; control: 8.86, SD = 3.19; p = 0.022), total signal time (HD: 23.47, SD = 7.54; control: 17.5, SD = 4.3; p = 0.024), mean pause length (HD: 0.44, SD = 0.31; control: 0.22, SD = 0.06; p = 0.024), and speech-to-pause ratio (HD: 0.72, SD = 0.42; control: 1.05, SD = 0.29; p = 0.032). In the counting backward task (Supplementary Table S2), the significant differences between the HD group and the control group were observed in the number of correct counts (HD: 4.53, SD = 2.42; control: 6.55, SD = 0.52; p = 0.012) and the percentage of correct counts (HD: 0.69, SD = 0.30; control: 0.91, SD = 0.14; p = 0.039). This suggests that individuals with HD had lower accuracy in counting backward compared to the control group. The pitch mean was significantly different between pHD and controls for both the counting forwards (pHD: 180.03, SD = 29.4; control: 146, SD = 26; p = 0.022) and counting backwards tasks (pHD: 213.44, SD = 47.7; control: 157, SD = 33.6; p = 0.009) groups but not from HD, and there were no differences in errors made while counting.
3.2 Clinical scores correlations
Correlation analyses (Table 4) revealed significant associations between passage reading features and clinical scores. Figure 3 plots the most correlated speech feature for each clinical assessment. Several speech features showed significant correlations with clinical scores such as the Montreal Cognitive Assessment (MoCA), Unified Huntington’s Disease Rating Scale (UHDRS) Functional, UHDRS Motor, and UHDRS dysarthria score. Total pause time, speech-to-pause ratio, mean pause length, ratio of extra words, similarity dynamic time warping, and total signal time exhibited significant correlations with one or more of these clinical scores. These findings suggest that specific speech features derived from passage reading tasks are related to the participants’ cognitive and motor abilities as well as their dysarthria severity. Longer pause durations, increased disfluencies, and lower similarity to the original passage were associated with poorer clinical scores.

Table 4. Correlations and p-values for speech features from passage reading and clinical scores.
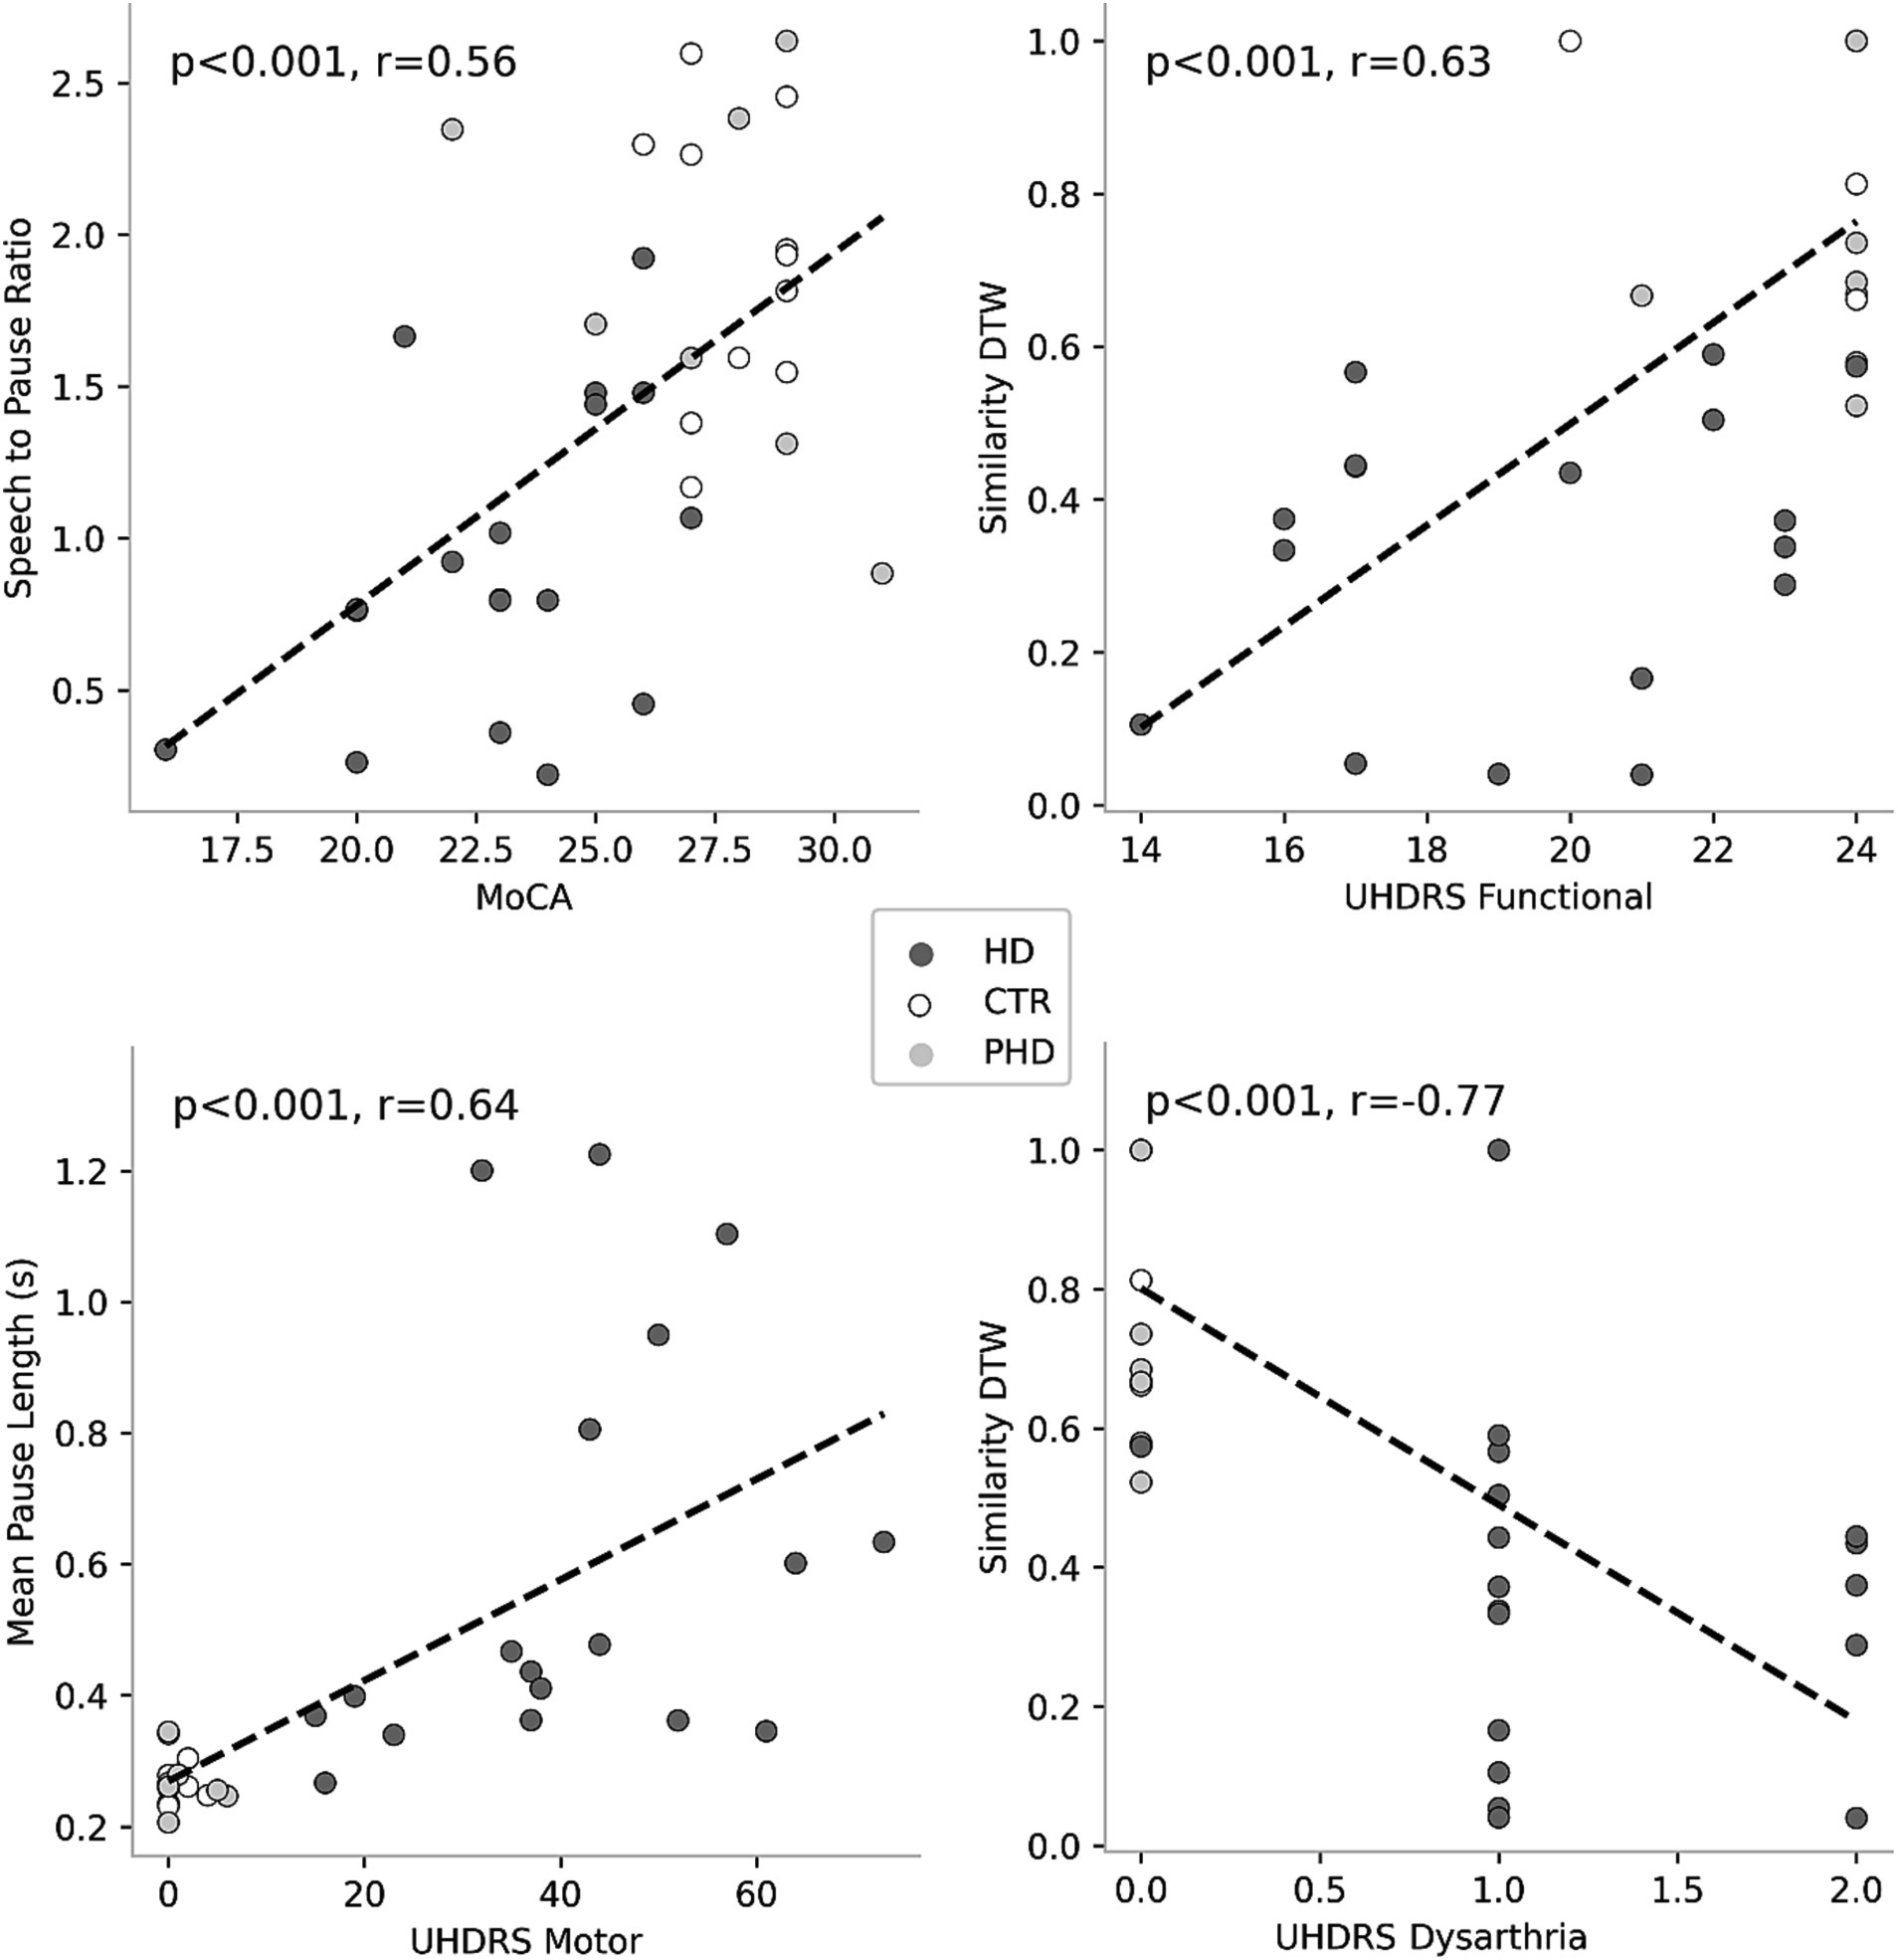
Figure 3. Correlations between speech features and clinical scores. Each plot represents the association between a specific clinical score and a corresponding speech feature. Colored circles indicate the group membership of the data points, allowing for visual differentiation among the groups.
3.3 Machine learning
The random forest classifier using passage reading features achieved an AUC of 0.89 and a weighted accuracy of 64% in differentiating between the HD, pHD, and control groups, and a recall of 94% for HD, 55% for pHD and 62% for control. Classification errors where more prevalent between adjacent groups, i.e., control and pHD, pHD and HD, as the differences between them are narrower. Better accuracy was achieved when using counting forward and backwards features in addition to passage reading features, with an AUC of 0.92 and an accuracy of 73%, and a recall of 94% for HD, 53% for pHD and 79% for control. Model performance was not significantly correlated with age (r = −0.33, p-val = 0.21) nor significantly different between sex groups (t-statistic = 0.26, p-val = 0.79). Figure 4 shows the ROC AUC curvatures for both models and in Figure 5 the confusion matrices. A similar approach was used to classify subjects with dysarthria scores of 0, 1 and 2. The results presented in Supplementary Figure S1 shows that while the models can clearly differentiate between individuals without dysarthria, it is challenging to separate dysarthria scores between 1 and 2.
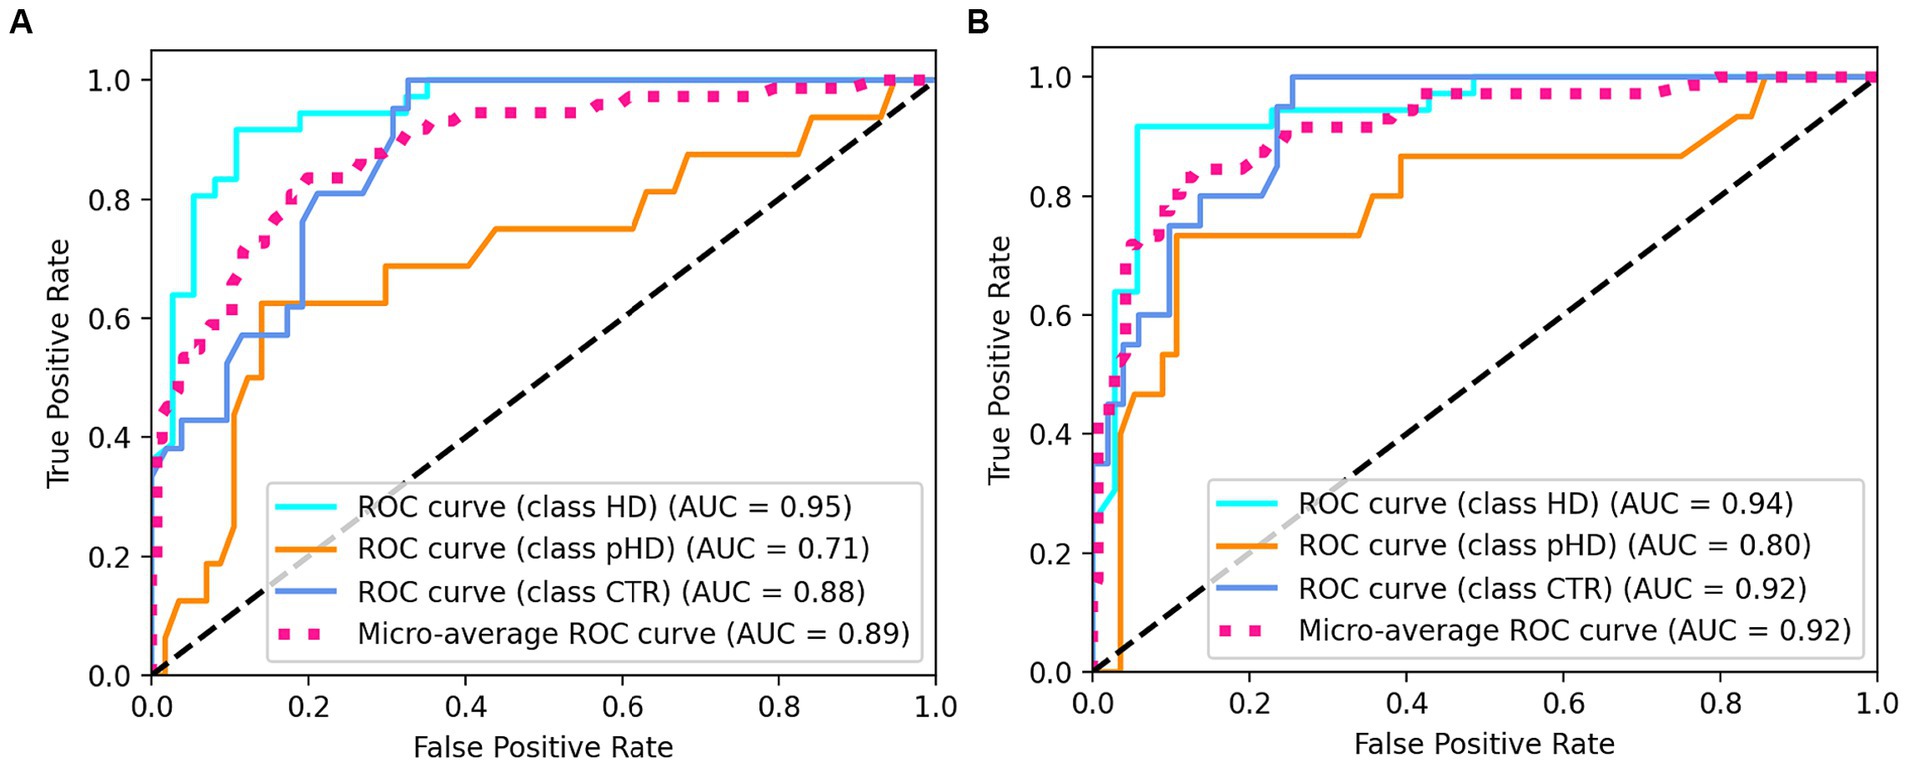
Figure 4. ROC AUC plots for (A) passage reading features only and (B) passage reading, counting forward and backward features.
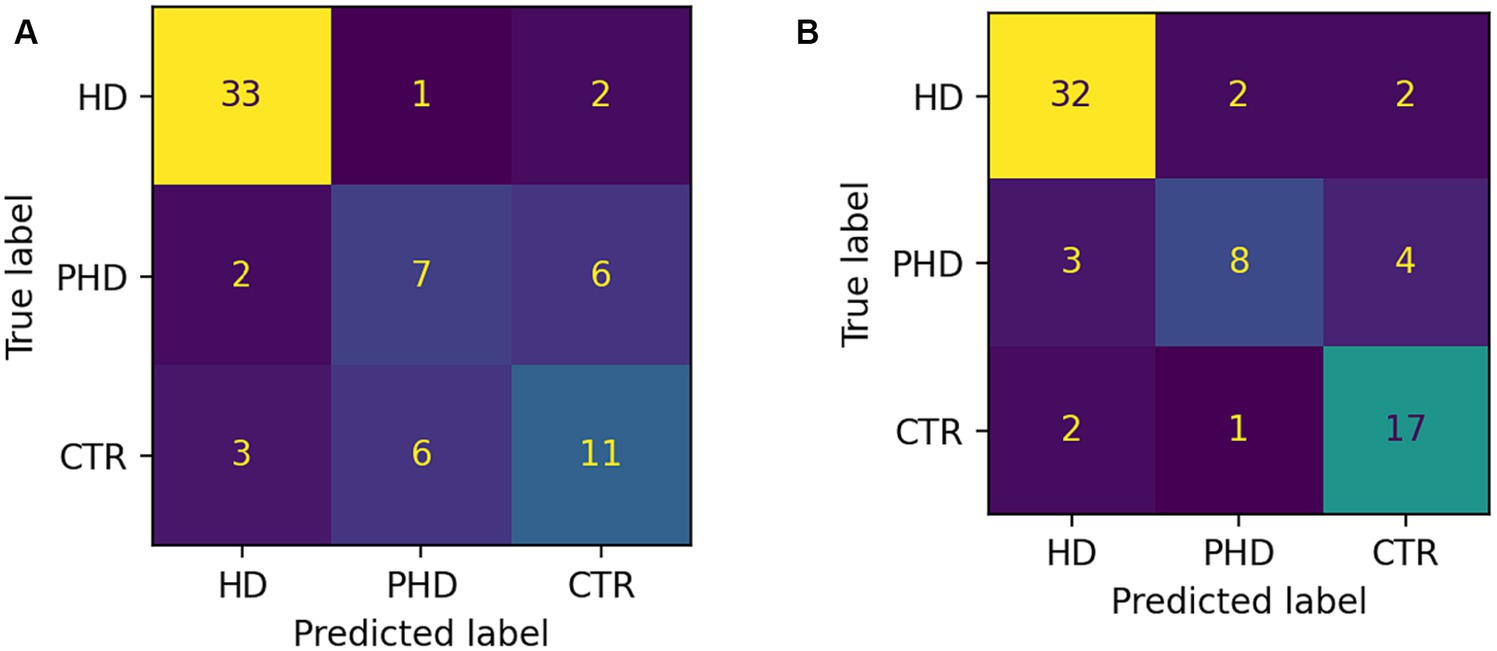
Figure 5. Confusion matrices showing number of correct and incorrect classifications. (A) Passage reading features only. (B) Passage reading, counting forward and backward features.
The random forest regressors trained to predict clinical scores demonstrated varying performance metrics (Table 5). The mean squared error (MSE) values were 8.39 for MoCA, 11.07 for UHDRS Functional, 194.68 for UHDRS Motor, and 0.33 for dysarthria. The mean absolute error (MAE) values were 2.3 for MoCA, 2.43 for UHDRS Functional, 9.64 for UHDRS Motor, and 0.37 for dysarthria. The explained variance ranged from 0.3 for MoCA to 0.54 for dysarthria. Figure 6 shows the scatterplot of clinical and predicted scores. It can be noted that controls and pHD tend to be clearly separated from HD. When inspecting for the most contributing features to predict the clinical scores, as shown in Figure 7, timing variables such as total time, mean pause duration, are the most contributing, as well as intelligibility dynamic time warping, indicating that the higher the clinical severity the more time it takes to read aloud the passage and less clear it is.
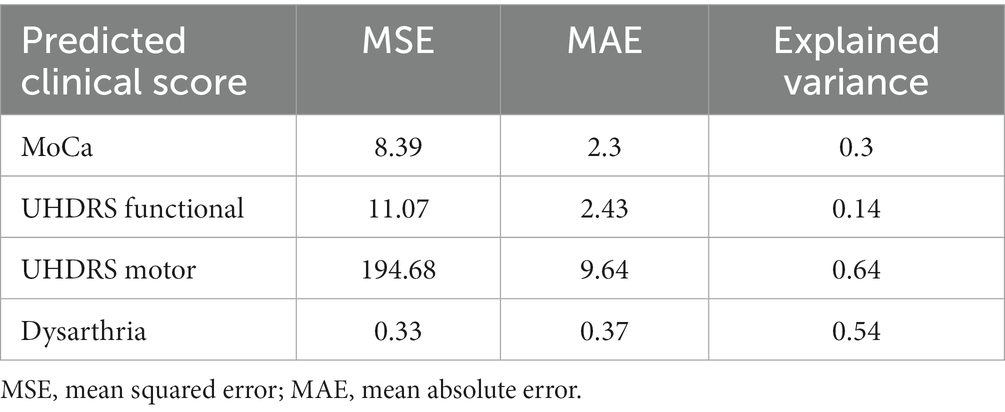
Table 5. Performance metrics for predicting clinical scores based on speech features.
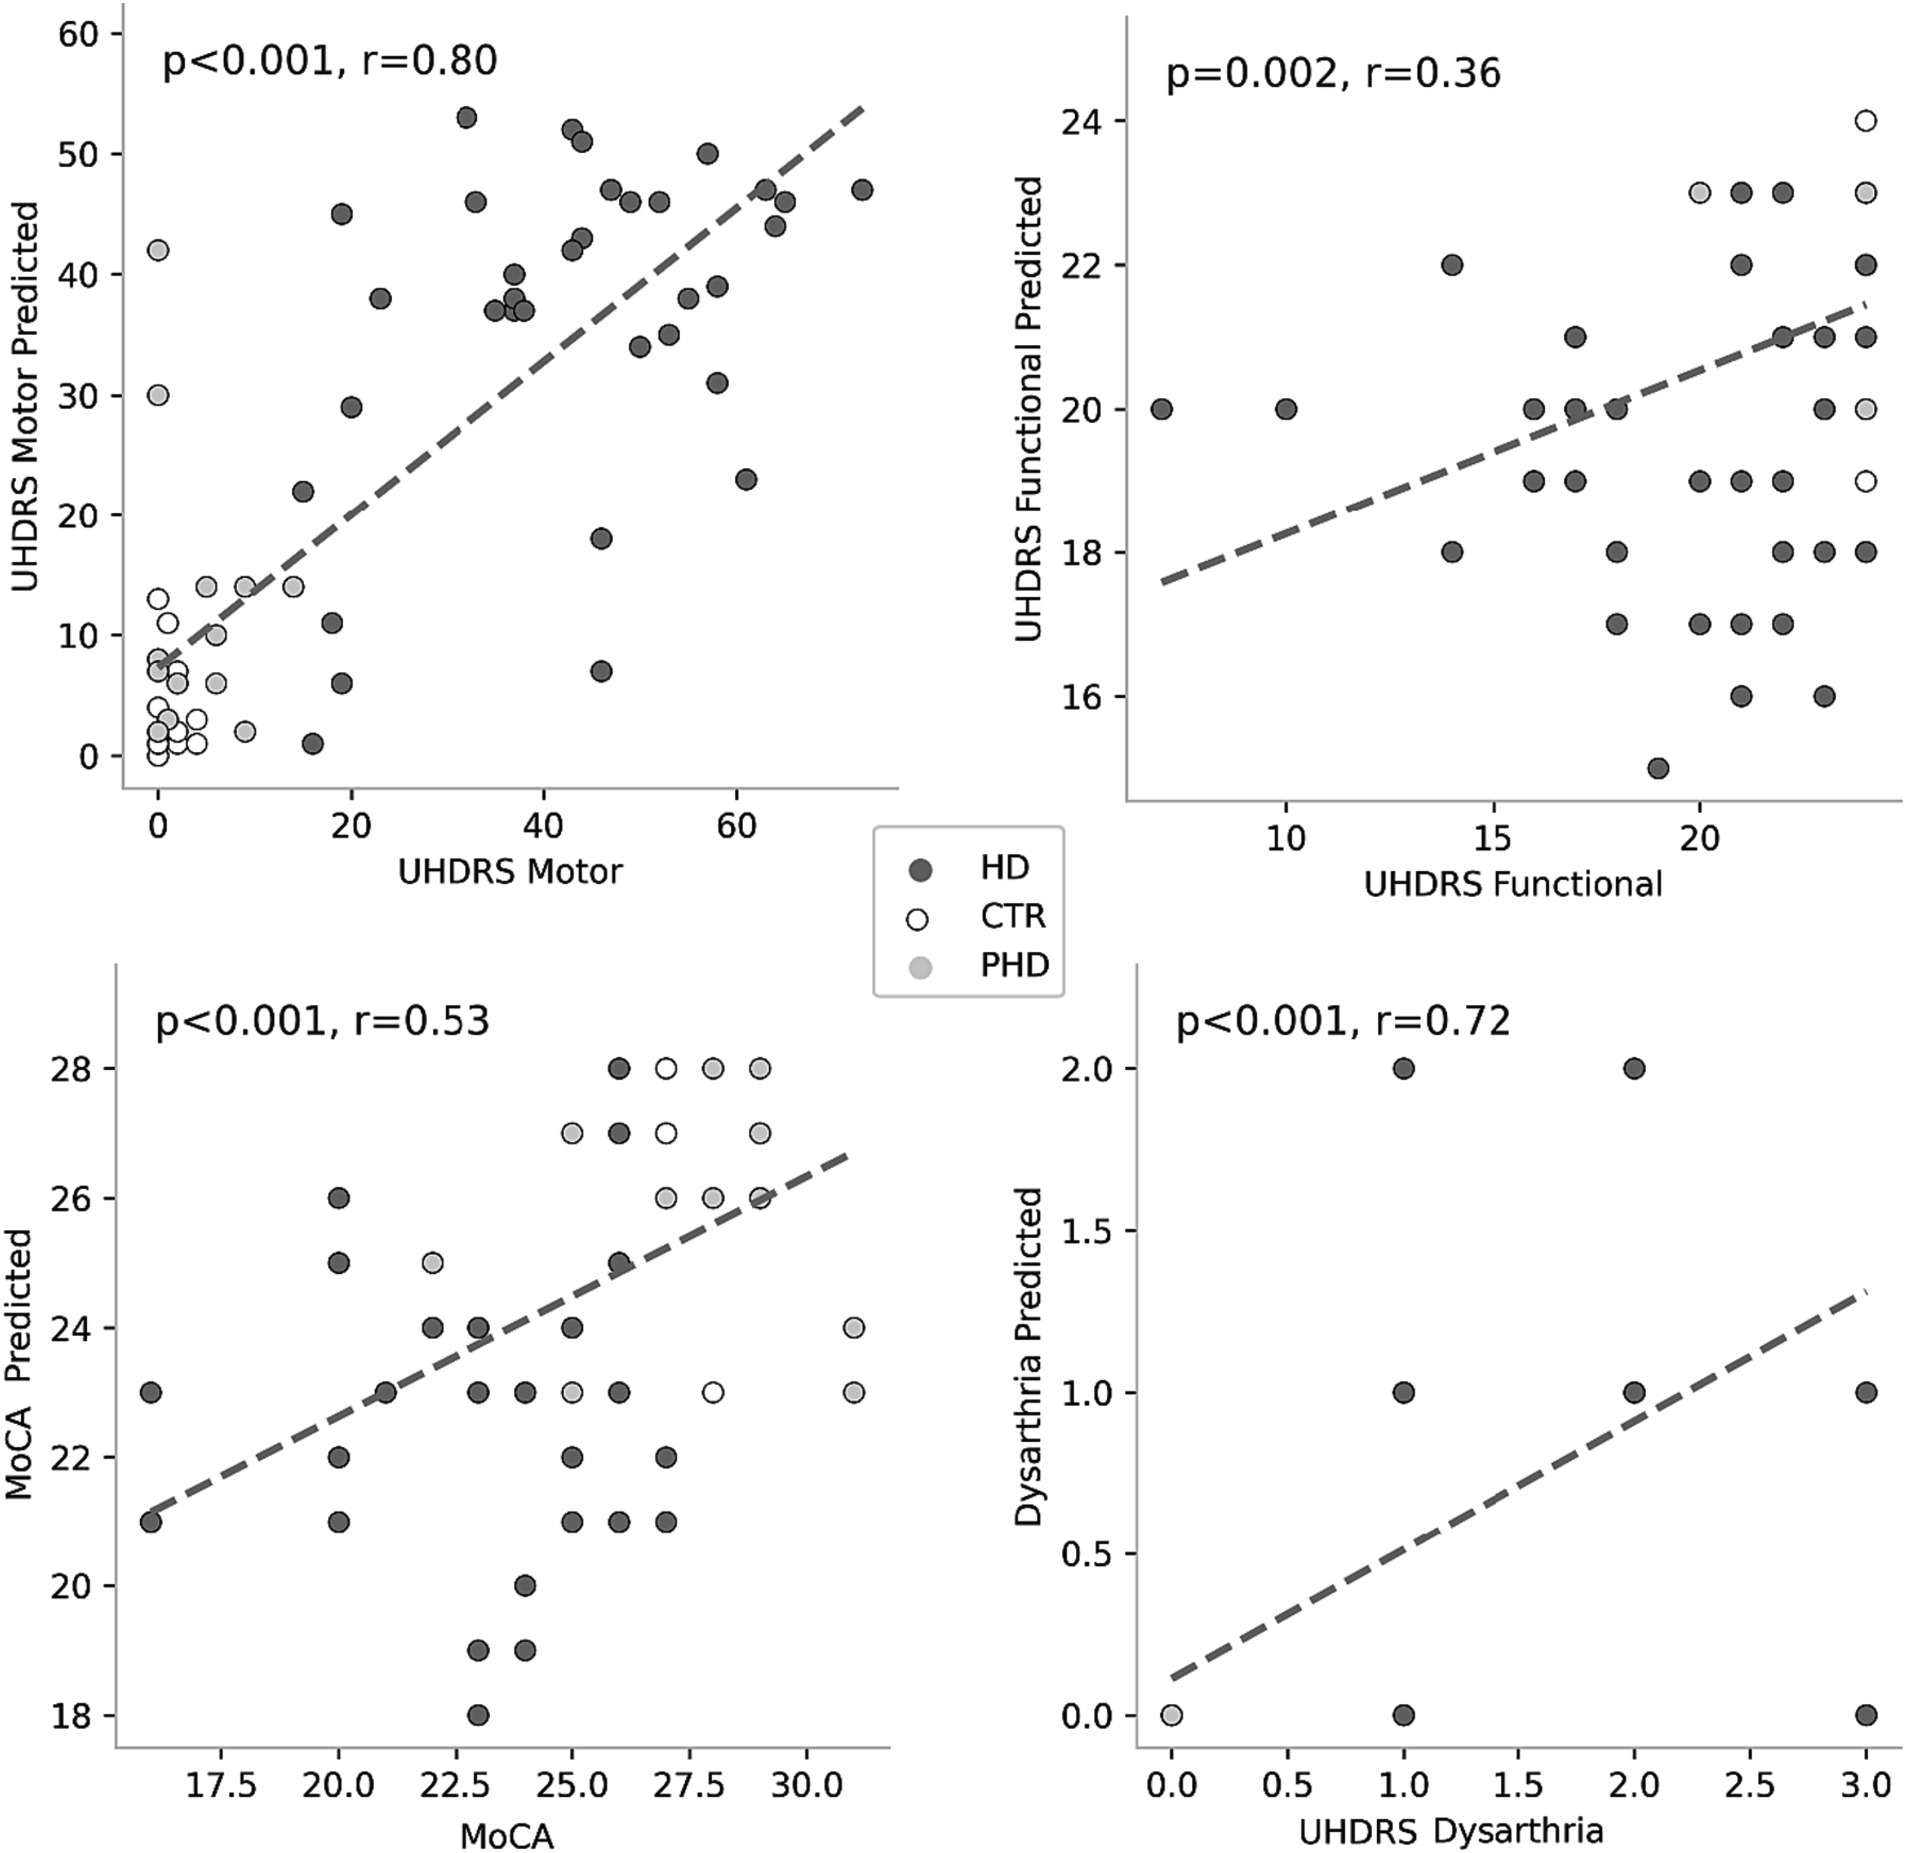
Figure 6. Scatterplot representing the original and the estimated clinical scores.
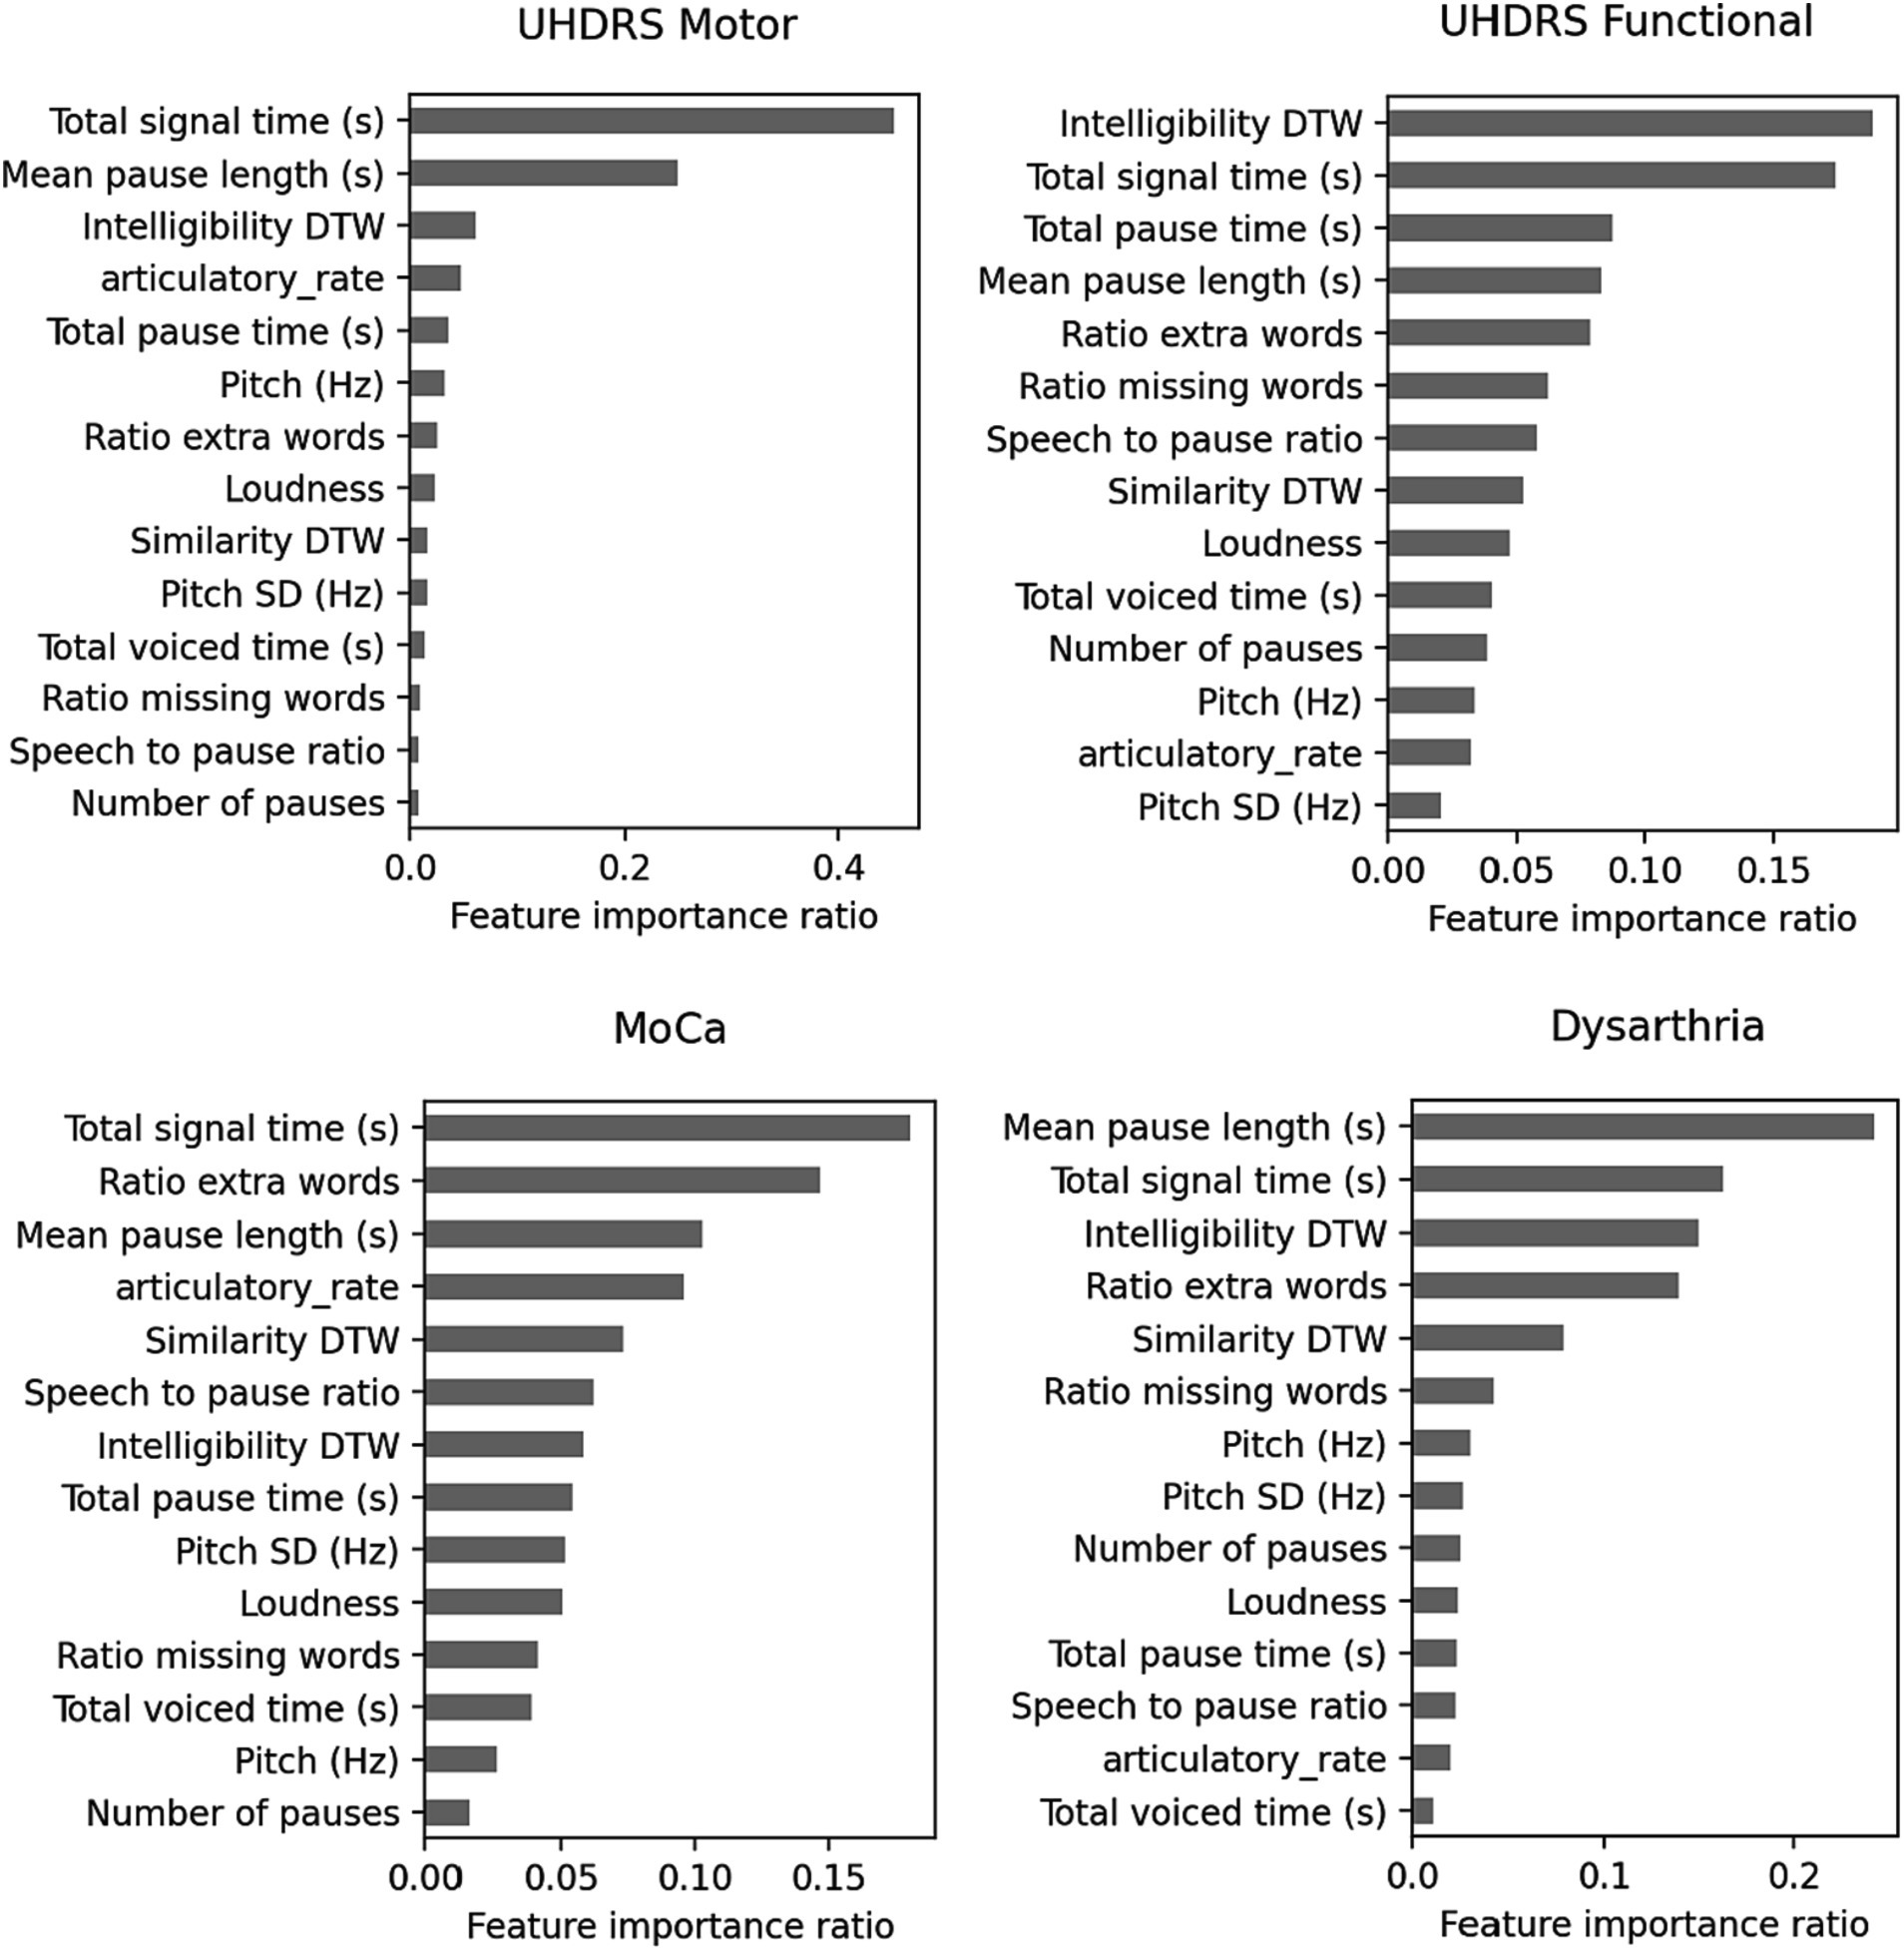
Figure 7. Feature contributions in predicting clinical scores.
4 Discussion
The present study investigated the utility of speech-based measures for assessing neurodegenerative movement disorders, focusing on HD. The study demonstrated the clinical potential significance of speech features obtained during passage reading and counting tasks. These assessments can be administered remotely and very frequently, allowing for a fine graded assessment of disease progression. The results demonstrated significant group differences in passage reading features between HD, pHD, and control groups. In general, a pattern can be seen where individuals in the HD and control groups differ the most across the passage reading features, while those with pHD are in between the two groups. However, while HD showed pronounced variations compared to pHD and control, the pHD group displayed minimal deviations from the control, likely attributable to their early disease stage’s subtle phenotypic shifts and perhaps their age, which was younger than the other groups. Additionally, correlations with clinical scores and successful machine learning models for group differentiation and prediction of clinical scores were observed.
In the analysis of passage reading features, HD participants exhibited distinct speech patterns compared to pHD and control groups. Notably, the speech-to-pause ratio was significantly lower in the HD group, indicating a higher proportion of pauses or silence relative to speech. Moreover, total pause time and total signal time were significantly longer in the HD group, suggesting more frequent and prolonged pauses during speech production. These differences in speech features may be indicative of dysarthria, a common symptom in HD, affecting motor speech control and articulation, and are in line with previous studies (30–32). However, features related to loudness, pitch, articulatory rate, and total voiced time did not demonstrate significant group differences. In the counting forwards task, there were minimal differences between groups in errors made while counting (See Supplementary Table S1 of the Supplementary materials). This is consistent with the results from our study in older adults with and without cognitive decline (33), where no differences in counting errors were observed between the two groups. However, the HD group had significantly higher counting errors on the counting backwards task compared to the prodromal and control groups (See Supplementary Table S2 of the Supplementary materials).
Correlation analyses further supported the significance of speech features as potential markers of disease severity. Several speech features showed significant moderate to strong correlations with clinical scores related to cognitive function, motor abilities, and dysarthria severity. Longer pause durations, increased disfluencies, and lower similarity to the original passage were associated with poorer clinical scores. Further research is needed to determine whether these specific speech measures could be used to monitor disease progression and assess functional decline.
The application of machine learning models for group differentiation and prediction of clinical scores showed promising results. A random forest classifier achieved relatively high recall values for HD and control groups based on passage reading features, however it was the least successful at classifying cases of pHD. The model’s performance was improved by incorporating counting tasks, suggesting that a combination of speech assessments could enhance the accuracy of group classification. However, the classification of dysarthria scores was challenging, especially distinguishing between scores of 1 and 2. This may be attributed to the limited number of recordings with dysarthria scores greater than 1. Prediction of clinical scores also showed promising results, with motor UHDRS and dysarthria scores explained variance over 50%, albeit only 14% of the variance was captured from functional UHDRS, suggesting that the model is more sensitive to specific assessments.
The findings of this study have important implications for the clinical application of remote monitoring systems and wearable sensors in neurodegenerative movement disorders, particularly in HD. While speech measurements were collected in clinic in this study, there is the potential to collect speech data remotely. Remote collection of speech data would allow for a quantitative assessment from the comfort of a patient’s home environment, however it may pose additional challenges such as a poorer recording quality and sources of ambient noise. Future research will be needed to determine the use and feasibility of remote speech data assessments in the HD population.
Despite its promising results, this study is not without its limitations. Among them is the low sample size, particularly in the prodromal HD group, which may limit the generalizability of the findings. With only seven participants and a lack of age and sex matching in the prodromal HD group, our study’s statistical power may be limited, potentially missing some subtle but clinically relevant differences. Furthermore, while the study incorporated passage reading and counting as speech assessments, a more comprehensive array of speech evaluations and inclusion of spontaneous speech might have yielded nuanced insights into the specific speech deficits in HD and their evolution. There’s also the potential that the current speech tasks are better suited to capture motor-related speech impairment rather than cognitive-related speech impairment. Future studies would benefit from a larger sample size, especially in prodromal HD, age matching, and the inclusion of more diverse speech assessments to capture a broader spectrum of speech and cognitive impairments in HD.
In conclusion, this study demonstrates the potential of utilizing speech-based measures as tools for assessing disease progression and aiding in early detection and intervention strategies in HD. The significant group differences, correlations with clinical scores, and successful machine learning models provide evidence for the efficacy of digital measures in capturing HD symptoms. The integration of speech assessments into routine clinical practice can offer a non-invasive and objective approach to monitor disease progression and improve patient care in neurodegenerative movement disorders. Furthermore, changes in speech may precede the onset of motor symptoms and therefore digital speech assessments may be valuable in clinical trials as a marker of clinical onset and disease progression. This is especially important since most therapeutics under development are targeting prodromal and early-stages of HD to slowdown the progression of the disease. Future research should focus on further validating the proposed speech-based measures in larger and more diverse populations.
Data availability statement
The raw data supporting the conclusions of this article will be made available by the authors, without undue reservation.
Ethics statement
The studies involving humans were approved by Research Subjects Review Board (RSRB) at the University of Rochester. The studies were conducted in accordance with the local legislation and institutional requirements. The participants provided their written informed consent to participate in this study.
Author contributions
AN: Formal analysis, Writing – original draft, Writing – review & editing. MP: Writing – original draft. RM: Writing – original draft. EW: Writing – review & editing. MC: Writing – review & editing. CT: Writing – review & editing. RS: Writing – review & editing. ED: Writing – review & editing. AV: Funding acquisition, Methodology, Writing – original draft, Writing – review & editing. JA: Funding acquisition, Writing – review & editing.
Funding
The author(s) declare financial support was received for the research, authorship, and/or publication of this article. Research reported in this publication was supported in part by BioSensics LLC and in part by the National Institute of Neurological Disorders and Stroke of the National Institutes of Health under Award Nos. R44NS103648 and R44NS122672.
Conflict of interest
AN, RM, and AV were employed by BioSensics.
The remaining authors declare that the research was conducted in the absence of any commercial or financial relationships that could be construed as a potential conflict of interest.
The author(s) declared that they were an editorial board member of Frontiers, at the time of submission. This had no impact on the peer review process and the final decision.
Publisher’s note
All claims expressed in this article are solely those of the authors and do not necessarily represent those of their affiliated organizations, or those of the publisher, the editors and the reviewers. Any product that may be evaluated in this article, or claim that may be made by its manufacturer, is not guaranteed or endorsed by the publisher.
Author disclaimer
The content is solely the responsibility of the authors and does not necessarily represent the official views of the National Institutes of Health.
Supplementary material
The Supplementary material for this article can be found online at: https://www.frontiersin.org/articles/10.3389/fneur.2024.1310548/full#supplementary-material
References
2. Papp, KV , Kaplan, RF , and Snyder, PJ . Biological markers of cognition in prodromal Huntington’s disease: a review. Brain Cogn. (2011) 77:280–91. doi: 10.1016/j.bandc.2011.07.009
3. Barker, R , and Mason, SL . The hunt for better treatments for Huntington's disease. Lancet Neurol. (2019) 18:131–3. doi: 10.1016/S1474-4422(18)30448-4
4. Paulsen, JS , Langbehn, DR , Stout, JC , Aylward, E , Ross, CA , Nance, M, et al. Detection of Huntington’s disease decades before diagnosis: the predict-HD study. J Neurol Neurosurg Psychiatry. (2008) 79:874–80. doi: 10.1136/jnnp.2007.128728
5. Tabrizi, SJ , Reilmann, R , Roos, RA , Durr, A , Leavitt, B , Owen, G, et al. Potential endpoints for clinical trials in premanifest and early Huntington's disease in the TRACK-HD study: analysis of 24 month observational data. Lancet Neurol. (2012) 11:42–53. doi: 10.1016/S1474-4422(11)70263-0
6. Chan, JC , Stout, JC , and Vogel, AP . Speech in prodromal and symptomatic Huntington’s disease as a model of measuring onset and progression in dominantly inherited neurodegenerative diseases. Neurosci Biobehav Rev. (2019) 107:450–60. doi: 10.1016/j.neubiorev.2019.08.009
7. Rusz, J , Saft, C , Schlegel, U , Hoffman, R , and Skodda, S . Phonatory dysfunction as a preclinical symptom of Huntington disease. PLoS One. (2014) 9:e113412. doi: 10.1371/journal.pone.0113412
8. Skodda, S , Schlegel, U , Hoffmann, R , and Saft, C . Impaired motor speech performance in Huntington’s disease. J Neural Transm. (2014) 121:399–407. doi: 10.1007/s00702-013-1115-9
9. Vogel, AP , Shirbin, C , Churchyard, AJ , and Stout, JC . Speech acoustic markers of early stage and prodromal Huntington's disease: a marker of disease onset? Neuropsychologia. (2012) 50:3273–8. doi: 10.1016/j.neuropsychologia.2012.09.011
10. Dorsey, ER , Papapetropoulos, S , Xiong, M , and Kieburtz, K . The first frontier: digital biomarkers for neurodegenerative disorders. Digit Biomarkers. (2017) 1:6–13. doi: 10.1159/000477383
11. Masanneck, L , Gieseler, P , Gordon, WJ , Meuth, SG , and Stern, AD . Evidence from ClinicalTrials. Gov on the growth of digital health technologies in neurology trials. NPJ Digit Med. (2023) 6:23. doi: 10.1038/s41746-023-00767-1
12. Lipsmeier, F , Simillion, C , Bamdadian, A , Tortelli, R , Byrne, LM , Zhang, YP, et al. A remote digital monitoring platform to assess cognitive and motor symptoms in Huntington disease: cross-sectional validation study. J Med Internet Res. (2022) 24:e32997. doi: 10.2196/32997
13. Waddell, EM , Dinesh, K , Spear, KL , Elson, MJ , Wagner, E , Curtis, MJ, et al. GEORGE®: a pilot study of a smartphone application for Huntington’s disease. J Huntingtons Dis. (2021) 10:293–301. doi: 10.3233/JHD-200452
14. Adams, JL , Dinesh, K , Xiong, M , Tarolli, CG , Sharma, S , Sheth, N, et al. Multiple wearable sensors in Parkinson and Huntington disease individuals: a pilot study in clinic and at home. Digit Biomarkers. (2017) 1:52–63. doi: 10.1159/000479018
15. Saadeh, W , Altaf, MA , and Butt, SA . A wearable neuro-degenerative diseases detection system based on gait dynamics. 2017 IFIP/IEEE international conference on very large scale integration (VLSI-SoC), IEEE. Mov Disord. (2017) 36:1042–3.
16. Trojaniello, D , Cereatti, A , Ravaschio, A , Bandettini, M , and Della Croce, U . Assessment of gait direction changes during straight-ahead walking in healthy elderly and Huntington disease patients using a shank worn MIMU. 2014 36th annual international conference of the IEEE engineering in medicine and biology society, IEEE (2014).
17. Tortelli, R , Rodrigues, FB , and Wild, EJ . The use of wearable/portable digital sensors in Huntington's disease: a systematic review. Parkinsonism Relat Disord. (2021) 83:93–104. doi: 10.1016/j.parkreldis.2021.01.006
18. Yadav, N , Poellabauer, C , Daudet, L , Collins, T , McQuillan, S , and Flynn, P . Portable neurological disease assessment using temporal analysis of speech. Proceedings of the 6th ACM conference on bioinformatics, Computational Biology and Health Informatics. (2015).
19. Rusz, J , Tykalova, T , Ramig, LO , and Tripoliti, E . Guidelines for speech recording and acoustic analyses in dysarthrias of movement disorders. Mov Disord. (2021) 36:803–14. doi: 10.1002/mds.28465
20. Kouba, T , Frank, W , Tykalova, T , Mühlbäck, A , Klempíř, J , Lindenberg, KS, et al. Speech biomarkers in Huntington's disease: a cross-sectional study in pre-symptomatic, prodromal and early manifest stages. Eur J Neurol. (2023) 30:1262–71. doi: 10.1111/ene.15726
21. Nasreddine, ZS , Phillips, NA , Bédirian, V , Charbonneau, S , Whitehead, V , Collin, I, et al. The Montreal cognitive assessment, MoCA: a brief screening tool for mild cognitive impairment. J Am Geriatr Soc. (2005) 53:695–9. doi: 10.1111/j.1532-5415.2005.53221.x
22. Kieburtz, K , Penney, JB , Como, P , Ranen, N , Feigin, A , Abwender, D, et al. Unified Huntington’s disease rating scale: reliability and consistency. Mov Disord. (1996) 11:136–42. doi: 10.1002/mds.870110204
23. Shumway-Cook, A , Baldwin, M , Polissar, NL , and Gruber, W . Predicting the probability for falls in community-dwelling older adults using the timed up & go test. Phys Ther. (2000) 80:896–903. doi: 10.1093/ptj/80.9.896
24. Fairbanks, G . Voice and articulation drillbook. Boston, MA: Addison-Wesley Educational Publishers (1960).
25. Kang, K , Nunes, AS , Sharma, M , Hall, AJ , Mishra, RK , Casado, J, et al. Utilizing speech analysis to differentiate progressive supranuclear palsy from Parkinson's disease. Parkinsonism Relat Disord. (2023) 115:105835. doi: 10.1016/j.parkreldis.2023.105835
26. Giorgino, T . Computing and visualizing dynamic time warping alignments in R: the dtw package. J Stat Softw. (2009) 31:1–24.
27. Bowen, LK , Hands, GL , Pradhan, S , and Stepp, CE . Effects of Parkinson’s disease on fundamental frequency variability in running speech. J Med Speech Lang Pathol. (2013) 21:235–44.
28. Miller, N , Nath, U , Noble, E , and Burn, D . Utility and accuracy of perceptual voice and speech distinctions in the diagnosis of Parkinson’s disease, PSP and MSA-P. Neurodegen Dis Manage. (2017) 7:191–203. doi: 10.2217/nmt-2017-0005
29. Orozco-Arroyave, JR , Vásquez-Correa, JC , Vargas-Bonilla, JF , Arora, R , Dehak, N , Nidadavolu, PS, et al. NeuroSpeech: an open-source software for Parkinson's speech analysis. Digit Signal Process. (2018) 77:207–21. doi: 10.1016/j.dsp.2017.07.004
30. Velasco García, MJ , Cobeta, I , Martín, G , Alonso-Navarro, H , and Jimenez-Jimenez, FJ . Acoustic analysis of voice in Huntington's disease patients. J Voice. (2011) 25:208–17. doi: 10.1016/j.jvoice.2009.08.007
31. Perez, M , Jin, W , Le, D , Carlozzi, N , Dayalu, P , Roberts, A, et al. Classification of Huntington disease using acoustic and lexical features. Interspace. (2018) 2018:1898–902.
32. Riad, R , Lunven, M , Titeux, H , Cao, XN , Hamet Bagnou, J , Lemoine, L, et al. Predicting clinical scores in Huntington’s disease: a lightweight speech test. J Neurol. (2022) 269:5008–21. doi: 10.1007/s00415-022-11148-1
Keywords: Huntington (disease), machine learing, speech assessment, digital speech aid, remote monitoring
Citation: Nunes AS, Pawlik M, Mishra RK, Waddell E, Coffey M, Tarolli CG, Schneider RB, Dorsey ER, Vaziri A and Adams JL (2024) Digital assessment of speech in Huntington disease. Front. Neurol. 15:1310548. doi: 10.3389/fneur.2024.1310548
Edited by:
Konstantinos I. Tsamis, University of Ioannina, GreeceReviewed by:
Perman Gochyyev, University of California, Berkeley, United StatesSiddharth Arora, University of Oxford, United Kingdom
Copyright © 2024 Nunes, Pawlik, Mishra, Waddell, Coffey, Tarolli, Schneider, Dorsey, Vaziri and Adams. This is an open-access article distributed under the terms of the Creative Commons Attribution License (CC BY). The use, distribution or reproduction in other forums is permitted, provided the original author(s) and the copyright owner(s) are credited and that the original publication in this journal is cited, in accordance with accepted academic practice. No use, distribution or reproduction is permitted which does not comply with these terms.
*Correspondence: Adonay S. Nunes, YWRvbmF5Lm51bmVzQGJpb3NlbnNpY3MuY29t