Abstract
Background:
The red blood cell distribution width (RDW) is closely linked to the prognosis of multiple diseases. However, the connection between RDW and gastrointestinal bleeding (GIB) in stroke patients is not well understood. This study aimed to clarify this association.
Methods:
This retrospective study involved 11,107 hospitalized patients from 208 hospitals in the United States, admitted between January 1, 2014, and December 31, 2015. We examined clinical data from 7,512 stroke patients in the intensive care unit (ICU). Multivariate logistic regression assessed the link between RDW and in-hospital GIB in stroke patients. Generalized additive model (GAM) and smooth curve fitting (penalty spline method) were utilized to explore the non-linear relationship between RDW and GIB in stroke patients. The inflection point was calculated using a recursive algorithm, and interactions between different variables were assessed through subgroup analyses.
Results:
Among the 11,107 screened stroke patients, 7,512 were included in the primary analysis, with 190 identified as having GIB. The participants had a mean age of (61.67 ± 12.42) years, and a median RDW of 13.9%. Multiple logistic analysis revealed RDW as a risk factor for in-hospital GIB in stroke patients (OR = 1.28, 95% CI 1.21, 1.36, p < 0.05). The relationship between RDW and in-hospital GIB in stroke patients was found to be non-linear. Additionally, the inflection point of RDW was 14.0%. When RDW was ≥14.0%, there was a positive association with the risk of GIB (OR: 1.24, 95% CI: 1.16, 1.33, p < 0.0001). Conversely, when RDW was <14.0%, this association was not significant (OR: 1.02, 95% CI: 0.97–1.07, p = 0.4040).
Conclusion:
This study showed a substantial non-linear link between RDW and the risk of GIB in stroke patients. Maintaining the patient’s RDW value below 14.0% could lower the risk of in-hospital GIB.
Introduction
Gastrointestinal bleeding (GIB) is a frequent complication post-stroke, markedly increasing patient mortality (1–3). Studies show a 1.24% incidence of GIB after ischemic stroke in the United States and a 2.63% chance following hemorrhagic stroke in Japan (4, 5). In China, approximately 2.6% of hospitalized stroke patients experience GIB (5). Additionally, GIB has been associated with higher mortality risk in acute cardiovascular conditions such as Acute Coronary Syndrome (6, 7). Furthermore, GIB results in negative outcomes for stroke patients, with those suffering from ischemic stroke experiencing a 46% higher likelihood of severe disability and an 82% greater risk of in-hospital death (4). Our data indicate an 18.95% in-hospital mortality rate for stroke patients with GIB, a significantly high figure. Given the alarming link between GIB and stroke, identifying modifiable predictors of GIB, and enhancing patient outcomes are crucial.
Red blood cell distribution width (RDW) is a measurable clinical parameter routinely used to assess erythrocyte size variability and differentiate types of anemia. Over the past decade, RDW has gained attention as a predictive marker, confirmed by numerous studies. Research has shown a significant correlation between RDW and various diseases, including diabetes, chronic obstructive pulmonary disease (COPD), cardiovascular conditions, pneumonia, thromboembolism, Inflammatory Bowel Disease (IBD), and liver disorders (8–12), highlighting RDW’s prognostic value (13, 14).
Research indicates RDW is a valuable biomarker for assessing GIB status and prognosis (15). Liao et al. (16) in a retrospective study of 4,473 patients undergoing Coronary Artery Bypass Grafting (CABG) found elevated RDW levels associated with an increased risk of GIB post-CABG. Additionally, the study highlights the potential of RDW as a biomarker for assessing GIB risk following CABG surgery.
The role of RDW as an independent predictor of GIB in stroke patients remains to be further investigated. This study aims to investigate the relationship between RDW and in-hospital GIB following a stroke, and assess RDW’s predictive utility for this condition.
Methods
Data source
This study utilized data from the eICU Collaborative Research Database (eICU-CRD), a multi-center intensive care database comprising over 200,000 cases (17, 18). Electronic medical records from 208 U.S. hospitals, spanning 2014 to 2015, were compiled. The Institutional Review Board of the Massachusetts Institute of Technology (Cambridge, Massachusetts, USA) granted approval for database use. Data access and extraction were conducted by the author, Zhenhua Huang, under certification number 499395491.
Study population
Patients diagnosed with stroke, as recorded in the patient dataset, were potentially eligible. These stroke patients were classified into three groups: the ischemic stroke (IS) group, the hemorrhagic stroke (HS) group (comprising patients with subarachnoid hemorrhage and intracerebral hemorrhage), and another group. Initially, 11,107 stroke patients were included in this study. Subsequently, 2,762 patients were excluded due to missing data on factors such as age, gender, BMI, RDW. 833 were excluded due to RDW outliers. And those who experienced GIB within 24 h of admission or prior to admission were also excluded. Ultimately, the cohort comprised 7,512 stroke patients, including 2,371HS patients, 2,608 IS patients, and 2,533 patients with other stroke types. Among these, 190 patients were identified with GIB during their hospital stay (as depicted in Figure 1). When multiple measurements of RDW and other variables were taken after admission to the ICU, data from the initial measurement were utilized.
Figure 1

Flowchart of study participants.
Variable extraction
In this study, the main outcome measured was the occurrence of in-hospital GIB of hospitalization for stroke patients. Detailed demographic data, such as age, body mass index (BMI), red blood cell count (RBC), hemoglobin (Hb), platelet count (PC), RDW, blood urea nitrogen (BUN), blood calcium, serum creatinine (Scr), gender, ethnicity, and past medical history, were gathered. Furthermore, for variables that were recorded multiple times within the first 24 h of admission, the value most strongly linked to disease severity was chosen (as shown in Table 1).
Table 1
| RDW (%) (quartile) | Q1 (11.4–13.1) | Q2 (13.2–13.8) | Q3 (13.9–14.9) | Q4 (15.0–24.8) | p-value |
|---|---|---|---|---|---|
| N | 1,818 | 1,859 | 1,850 | 1,985 | |
| Age (year) | 58.35 ± 13.17 | 61.93 ± 12.19 | 63.37 ± 11.56 | 62.89 ± 12.13 | <0.001 |
| BMI (kg/m2) | 27.73 ± 7.78 | 28.39 ± 8.49 | 29.02 ± 9.00 | 29.02 ± 9.98 | <0.001 |
| RBC (× 1012/L) | 4.48 ± 0.59 | 4.45 ± 0.66 | 4.34 ± 0.76 | 4.02 ± 0.93 | <0.001 |
| Hb (g/L) | 139.1 ± 17.8 | 135.8 ± 19.6 | 129.5 ± 22.2 | 112.8 ± 24.8 | <0.001 |
| PC (× 109/L) | 219.0 (182.0–260.0) | 218.0 (174.5–263.0) | 217.0 (174.0–270.0) | 223.0 (167.0–288.0) | <0.001 |
| BUN (mmol/L) | 14.0 (11.0–19.0) | 15.0 (12.0–21.0) | 17.0 (13.0–24.0) | 20.0 (14.0–34.0) | <0.001 |
| Calcium (mg/dL) | 8.52 ± 1.98 | 8.61 ± 1.73 | 8.55 ± 1.81 | 8.47 ± 1.70 | 0.110 |
| Scr (mg/dL) | 0.84 (0.69–1.06) | 0.90 (0.70–1.10) | 0.97 (0.74–1.31) | 1.09 (0.80–1.70) | <0.001 |
| Gender, n (%) | <0.001 | ||||
| Male | 1,049 (57.70%) | 1,039 (55.89%) | 1,026 (55.46%) | 1,005 (50.63%) | |
| Female | 769 (42.30%) | 820 (44.11%) | 824 (44.54%) | 980 (49.37%) | |
| Ethnicity, n (%) | <0.001 | ||||
| African American | 140 (7.70%) | 176 (9.47%) | 306 (16.54%) | 442 (22.27%) | |
| Asian | 57 (3.14%) | 43 (2.31%) | 33 (1.78%) | 28 (1.41%) | |
| Caucasian | 1,420 (78.11%) | 1,397 (75.15%) | 1,325 (71.62%) | 1,337 (67.36%) | |
| Hispanic | 75 (4.13%) | 84 (4.52%) | 63 (3.41%) | 77 (3.88%) | |
| Native American | 3 (0.17%) | 9 (0.48%) | 15 (0.81%) | 15 (0.76%) | |
| Unknown | 123 (6.77%) | 150 (8.07%) | 108 (5.84%) | 86 (4.33%) | |
| History, n (%) | |||||
| AF | 120 (6.60%) | 137 (7.37%) | 190 (10.27%) | 280 (14.11%) | <0.001 |
| ACS | 44 (2.42%) | 83 (4.46%) | 93 (5.03%) | 117 (5.89%) | <0.001 |
| CHF | 20 (1.10%) | 56 (3.01%) | 83 (4.49%) | 174 (8.77%) | <0.001 |
| COPD | 180 (9.90%) | 199 (10.70%) | 303 (16.38%) | 355 (17.88%) | <0.001 |
| Diabetes | 193 (9.97%) | 196 (9.53%) | 356 (16.01%) | 371 (17.43%) | <0.001 |
| Hypertension | 531 (27.43%) | 656 (31.89%) | 752 (33.81%) | 652 (30.64%) | <0.001 |
| Cancer | 516 (28.38%) | 597 (32.11%) | 635 (34.32%) | 607 (30.58%) | 0.01 |
| Stroke type, n (%) | 0.964 | ||||
| Hemorrhagic stroke | 563 (30.97%) | 587 (31.58%) | 601 (32.49%) | 620 (31.23%) | |
| Ischemic stroke | 642 (35.31%) | 638 (34.32%) | 637 (34.43%) | 691 (34.81%) | |
| Others | 613 (33.72%) | 634 (34.10%) | 612 (33.08%) | 674 (33.95%) | |
| In-hospital GIB, n (%) | 21 (1.16%) | 20 (1.08%) | 41 (2.22%) | 108 (5.44%) | <0.001 |
| Status at hospital discharge, n (%) | <0.001 | ||||
| Alive | 1,666 (91.64%) | 1,648 (88.65%) | 1,620 (87.57%) | 1,601 (80.65%) | |
| Death | 152 (8.36%) | 211 (11.35%) | 230 (12.43%) | 384 (19.35%) |
Baseline characteristics of participants.
Continuous variables are summarized as mean (SD) or median (quartile interval); categorical variables are presented as percentages (%). BMI, body mass index; BUN, blood urea nitrogen; Scr, serum creatinine; RBC, red blood cell; Hb, hemoglobin; PC, platelet count; ACS, acute coronary syndrome; AF, atrial fibrillation; CHF, congestive heart-failure; COPD, chronic obstructive pulmonary disease; GIB, gastrointestinal bleeding.
Statistical analysis
RDW was categorized into four quartiles: Q1 (11.4–13.1%), Q2 (13.2–13.8%), Q3 (13.9–14.9%), and Q4 (15.0–24.8%). Descriptive statistics were provided for continuous variables, including the mean and standard deviation for normally distributed data, medians with interquartile range (IQR) for non-normally distributed data, and for categorical variables, frequency and proportion were reported. Various statistical tests were employed to compare different RDW groups based on the distribution of the data. One-way analysis of variance was used for groups with a normal distribution, the χ2 method for categorical variables, and the Kruskal-Wallis H test for groups with a non-normal distribution. These tests were selected appropriately to accurately analyze the data and draw valid conclusions based on the diverse characteristics of the RDW groups. Logistic regression analysis was performed to explore the association between RDW and hospital-acquired GIB in stroke patients. Adjusted odds ratios (OR) and 95% confidence intervals (CI) were calculated for the study results using multivariable models. Three models were constructed: (i) an unadjusted model, (ii) a minimally adjusted model (Model I: adjusted for age, gender, and ethnicity), and (iii) a fully adjusted model (adjusted for gender, age, ethnicity, atrial fibrillation (AF), congestive heart failure (CHF), acute coronary syndrome (ACS), COPD, diabetes, hypertension, and cancer). Given the suspicion that binary logistic regression models might not adequately handle nonlinear relationships, we explored such relationships using generalized additive models (GAM) and smooth curve fitting (penalized spline method). If nonlinearity was detected, we initially calculated the inflection point using a recursive algorithm and then established a two-piecewise linear logistic regression model on both sides of the inflection point. The log-likelihood ratio test was employed to determine the most suitable model describing the association between RDW and GIB. Additionally, interactions between different variables were assessed through subgroup analyses. ROC curve analysis was conducted to assess the predictive capability of RDW for in-hospital GIB among stroke patients, with a significance threshold set at p < 0.05. The analysis was conducted using Empower Stats software and the R language, with statistical significance defined as a two-tailed p-value <0.05.
Results
Baseline characteristics
The participants were divided into quartiles, each defined by a range of RDW values. When comparing these quartiles to the Q1 reference group, several variables showed significant differences. In the highest quartile (Q4: RDW ≥ 15%), age, BMI, PC, BUN, and Scr were notably higher. Additionally, elevated rates of AF, CHF, ACS, COPD, and hypertension were observed in this quartile. Conversely, the proportion of males, Hb, calcium and RBC were lower in the highest quartile (all p-values <0.05). Furthermore, both hospital mortality and the incidence of GIB significantly increased in Q4 compared to Q1 (p-values <0.05) (Table 1). Figure 2 illustrates the skewed distribution of RDW, ranging from 11.4 to 24.8%, with a median level of 13.9%.
Figure 2
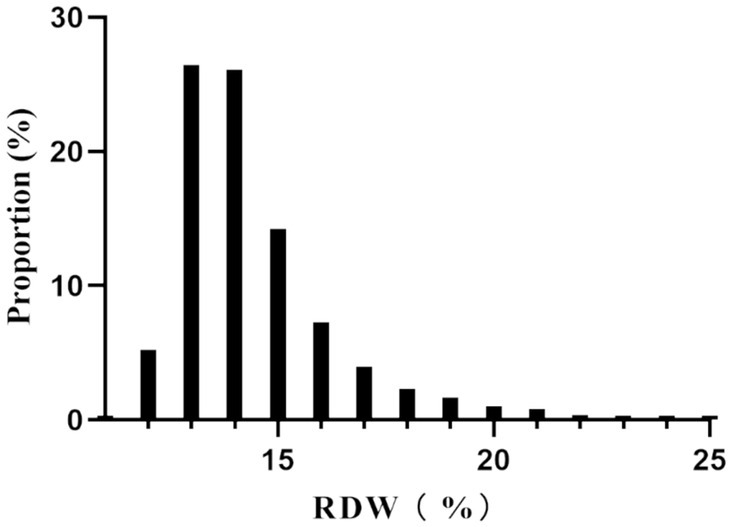
Distribution of RDW. It showed that RDW presented a skewed distribution ranging from 11.4 to 24.8%, with a median level of 13.9%.
Factors influencing in-hospital GIB risk in stroke patients via univariate analysis
Table 2 illustrates the correlations between various factors and GIB following hospitalization for stroke patients, as analyzed through univariate analysis. Significant associations with GIB (p < 0.05) were observed for RDW, age, Scr, calcium, BUN, RBC, Hb and BUN levels. Similarly, GIB exhibited significant correlations with ACS, COPD, CHF, AF, diabetes, and hypertension rates (all p < 0.05). However, no significant associations were found between hospital-acquired GIB and BMI, PC, gender, ethnicity, or cancer rates (all p > 0.05).
Table 2
| Statistics | OR (95% CI) | p-value | |
|---|---|---|---|
| Gender, n (%) | 0.1478 | ||
| Male | 4,119 (54.83%) | 1.0 | |
| Female | 3,393 (45.17%) | 0.80 (0.60, 1.08) | |
| Age (years) | 61.67 ± 12.42 | 1.02 (1.00, 1.03) | 0.0067 |
| Ethnicity, n (%) | |||
| African American | 1,064 (14.16%) | 1.0 | |
| Asian | 161 (2.14%) | 1.17 (0.48, 2.84) | 0.7240 |
| Caucasian | 5,479 (72.94%) | 0.71 (0.49, 1.05) | 0.0848 |
| Hispanic | 299 (3.98%) | 1.05 (0.51, 2.15) | 0.8975 |
| Native American | 42 (0.56%) | 0.00 (0.00, Inf) | 0.9717 |
| Unknown | 467 (6.22%) | 0.94 (0.50, 1.76) | 0.8381 |
| BMI, (kg/m2) | 28.55 ± 8.89 | 1.00 (0.99, 1.02) | 0.6382 |
| AF, n (%) | 727 (9.68%) | 2.24 (1.55, 3.25) | <0.0001 |
| ACS, n (%) | 337 (4.49%) | 3.40 (2.20, 5.26) | <0.0001 |
| CHF, n (%) | 333 (4.43%) | 2.95 (1.87, 4.67) | <0.0001 |
| COPD, n (%) | 321 (4.27%) | 3.25 (2.07, 5.10) | <0.0001 |
| Diabetes, n (%) | 1,037 (13.80%) | 2.23 (1.60, 3.10) | <0.0001 |
| Hypertension, n (%) | 2,355 (31.35%) | 2.50 (1.87, 3.33) | <0.0001 |
| Cancer, n (%) | 68 (0.91%) | 1.79 (0.56, 5.75) | 0.3274 |
| PC, (× 109/L) | 219.0 (175.0–270.0) | 1.00 (1.00, 1.00) | 0.0505 |
| RBC, (× 1012/L) | 4.32 ± 0.77 | 0.40 (0.34, 0.48) | <0.0001 |
| Hb, (g/L) | 129.0 ± 23.7 | 0.72 (0.68, 0.76) | <0.0001 |
| RDW, (%) | 14.39 ± 1.88 | 1.28 (1.22, 1.35) | <0.0001 |
| BUN, (mmol/L) | 16.0 (12.0–24.0) | 1.03 (1.02, 1.03) | <0.0001 |
| Calcium, (mg/dL) | 8.54 ± 1.81 | 0.93 (0.87, 0.99) | 0.0196 |
| Scr, (mg/dL) | 0.92 (0.72–1.24) | 1.14 (1.07, 1.21) | <0.0001 |
Factors influencing risk of in-hospital GIB in stroke patients analyzed by univariate analysis.
OR and 95% CI were calculated for the study results using univariate models. OR, odds ratios; CI, confidence intervals.
RDW’s association with in-hospital GIB in univariate and multivariate analyses
In univariate analysis, a significant association was observed between continuous RDW and in-hospital GIB (OR 1.28, 95% CI (1.22, 1.35), p < 0.001). To address various risk factors, including critical clinical variables, we developed a multivariate model. RDW remained an independent predictor of in-hospital GIB in both adjusted Model II (OR 1.29, 95% CI 1.22–1.36, p < 0.001) and Model III (OR 1.28, 95% CI 1.21–1.36, p < 0.001), as shown in Table 3. Furthermore, all participants were categorized into four groups based on RDW quartiles. Using the Q1 group as a reference, a significant increase in GIB risk was observed in the highest quartile (Q4) (p < 0.001), as illustrated in Table 3.
Table 3
| Exposure | Model I (OR, 95%CI) P |
Model II (OR, 95%CI) P |
Model III (OR, 95%CI) P |
|---|---|---|---|
| RWD (%) | 1.28 (1.22, 1.35) <0.0001 |
1.29 (1.22, 1.36) <0.0001 |
1.28 (1.21, 1.36) <0.0001 |
| (quartile) | |||
| Q1 | Ref | Ref | Ref |
| Q2 | 0.93 (0.50, 1.72) 0.8190 |
0.90 (0.48, 1.66) 0.7294 |
0.83 (0.45, 1.54) 0.5546 |
| Q3 | 1.94 (1.14, 3.29) 0.0143 |
1.84 (1.08, 3.14) 0.0250 |
1.65 (0.96, 2.83) 0.0687 |
| Q4 | 4.92 (3.07, 7.89) <0.0001 |
4.76 (2.96, 7.65) <0.0001 |
4.23 (2.59, 6.90) <0.0001 |
| P for trend | <0.0001 | <0.0001 | <0.0001 |
Relationship between RDW and in-hospital GIB in stroke patients in different models.
Adjusted model I: no covariates were adjusted for. Adjusted model II: we only adjusted for age, gender, and ethnicity. Adjusted model III: we adjusted for age, gender, ethnicity, AF, CHF, ACS, COPD, diabetes, hypertension, and cancer.
Non-linear relationship of RDW and in-hospital GIB in stroke patients
To further explore the relationship between RDW and in-hospital GIB incidence, we generated smoothing curves using a generalized additive model, adjusting for age, gender, ethnicity, AF, CHF, ACS, COPD, diabetes, hypertension, and cancer. The results showed a nonlinear association between RDW and in-hospital GIB risk, as illustrated in Figure 3. Furthermore, the curve notably steepened in the Q4 quartile, indicating a rapid and significant increase in in-hospital GIB incidence with rising RDW, especially in the Q4 group. Segmented regression models identified a threshold RDW value of 14.0% (p < 0.001 based on the log-likelihood ratio test). RDW ≥ 14.0% was positively associated with GIB risk (OR: 1.24, 95% CI: 1.16, 1.33, p < 0.0001). Conversely, RDW < 14.0% showed no significant association with GIB risk (OR: 1.02, 95% CI: 0.97–1.07, p = 0.4040) (as demonstrated in Table 4).
Figure 3

The nonlinear relationship between RDW and risk of GIB in stroke patients. A nonlinear relationship between them was detected after adjusting for age, gender, ethnicity, AF, CHF, ACS, COPD, diabetes, hypertension, and cancer.
Table 4
| Outcome: GIB | OR, 95%CI | p-value |
|---|---|---|
| Fitting model by standard linear regression | 1.28 (1.22, 1.35) | <0.0001 |
| Fitting model by two-piecewise linear regression model | ||
| Inflection points of RDW | 14.0% | |
| <14.0% | 1.02 (0.97, 1.07) | 0.4040 |
| ≥14.0% | 1.24 (1.16, 1.33) | <0.0001 |
| p for log-likelihood ratio test | <0.001 | |
The result of two-piecewise linear regression model.
We adjusted for age, gender, ethnicity, AF, CHF, ACS, COPD, diabetes, hypertension, and cancer.
Subgroup analyses for RDW impact on in-hospital GIB after stroke
Subgroup analyses were conducted to identify potential factors influencing RDW’s impact on in-hospital GIB post-stroke, as outlined in Table 5. Significant interactions between RDW and BUN, as well as creatinine levels, were observed regarding in-hospital GIB post-stroke. Specifically, patients with BUN levels <20 mg/dL had an elevated risk of GIB (OR = 1.37, 95% CI 1.24, 1.51), while those with creatinine levels <1.2 mg/dL also showed increased GIB risk (OR = 1.38, 95% CI 1.26, 1.50). There were no significant interactions observed between age, RBC, AF, ACS, CHF, COPD, DM, DKA, cancer, stroke type, and in-hospital GIB.
Table 5
| Exposure | OR (95% CI) | p-value | p for interaction |
|---|---|---|---|
| Age (year) | 0.9841 | ||
| <60 | 1.28 (1.16, 1.41) | <0.0001 | |
| ≥60 | 1.28 (1.19, 1.38) | <0.0001 | |
| Scr (mg/dL) | 0.0102 | ||
| <0.6 | 1.35 (1.11, 1.64) | 0.0027 | |
| ≥0.6, <1.2 | 1.38 (1.26, 1.50) | <0.0001 | |
| ≥1.2 | 1.15 (1.06, 1.25) | 0.0010 | |
| BUN (mmol/L) | 0.0546 | ||
| <9 | 1.37 (1.09, 1.72) | 0.0068 | |
| ≥9, <20 | 1.37 (1.24, 1.51) | <0.0001 | |
| ≥20 | 1.18 (1.10, 1.28) | <0.0001 | |
| RBC (× 1012/L) | 0.0820 | ||
| <4 | 1.17 (1.09, 1.27) | <0.0001 | |
| ≥4 | 1.31 (1.19, 1.43) | <0.0001 | |
| AF | 0.4480 | ||
| No | 1.29 (1.21, 1.38) | <0.0001 | |
| Yes | 1.22 (1.07, 1.40) | 0.0032 | |
| ACS | 0.6737 | ||
| No | 1.29 (1.21, 1.37) | <0.0001 | |
| Yes | 1.23 (1.03, 1.48) | 0.0250 | |
| CHF | 0.6828 | ||
| No | 1.29 (1.21, 1.37) | <0.0001 | |
| Yes | 1.24 (1.05, 1.47) | 0.0130 | |
| COPD | 0.2057 | ||
| No | 1.29 (1.22, 1.37) | <0.0001 | |
| Yes | 1.12 (0.89, 1.40) | 0.3277 | |
| DM | 0.0998 | ||
| No | 1.31 (1.23, 1.40) | <0.0001 | |
| Yes | 1.17 (1.03, 1.33) | 0.0142 | |
| Cancer | 0.2851 | ||
| No | 1.29 (1.21, 1.36) | <0.0001 | |
| Yes | 1.01 (0.62, 1.65) | 0.9680 | |
| Type of stroke | 0.4631 | ||
| Hemorrhagic stroke | 1.33 (1.22, 1.46) | 0.0002 | |
| Ischemic stroke | 1.22 (1.11, 1.36) | 0.0220 | |
| Other | 1.28 (1.16, 1.42) | 0.0005 |
Stratified analyses of the association between RDW and in-hospital GIB.
Above model adjusted for age, gender, ethnicity, AF, CHF, ACS, COPD, diabetes, hypertension, and cancer. In each case, the model is not adjusted for the stratification variable when the stratification variable was a categorical variable.
Roc curves for RDW predicting in-hospital GIB after stroke
Figure 4 and Table 6 presents the Receiver operating characteristics (ROC) curves for RDW in predicting in-hospital GIB in stroke patients among all participants. The AUC values and 95% CIs for RDW was 0.671 (0.632, 0.708). And the best threshold was 14.850.
Figure 4

ROC curves for RDW in predicting in-hospital GIB in stroke patients.
Table 6
| AUC | 95% CI low | 95% CI up | Best threshold | Sensitivity (%) | Specificity (%) | |
|---|---|---|---|---|---|---|
| RDW | 0.671 | 0.632 | 0.708 | 14.850 | 72.8 | 59.5 |
AUC with the 95% CI of RDW for predicting in-hospital GIB in stroke patients.
Discussion
Our retrospective study indicates a positive correlation between elevated RDW levels and increased risk of GIB in stroke patients. Specifically, each unit increase in RDW was associated with a 28% higher risk of GIB. We also discovered a non-linear correlation between RDW levels and GIB risk, where levels ≥14.0% showed a significant positive correlation (OR: 1.24, 95% CI: 1.16–1.33, p < 0.0001), while levels <14.0% did not show a statistically significant correlation (OR: 1.02, 95% CI:0.97–1.07, p = 0.4040).
Recent studies consistently demonstrate a strong link between increased RDW and a range of diseases such as cancers, digestive disorders, and cardiovascular conditions (19–23). Tonelli et al. (24) found that higher RDW levels correlate with increased cardiovascular events in patients with coronary artery disease, indicating that RDW may reflect disease severity and prognosis. Felker et al. (25) noted that higher RDW levels are associated with adverse outcomes in heart failure patients, underscoring its utility as a prognostic marker. Patel et al. (26) linked higher RDW levels to increased mortality in older adults, highlighting RDW’s role as a survival predictor, useful for health and prognosis evaluations. Recent studies have explored the link between higher RDW levels and increased GIB risk. A 2017 study showed that elevated RDW levels correlate with greater upper gastrointestinal bleeding (UGIB) risk (27). Another study identified RDW as an independent predictor of GIB post-CABG (16).
In 2019, stroke was a leading global health issue, with approximately 12.2 million cases worldwide, making it the second leading cause of death (28). GIB is a serious complication following a stroke, often presenting through subtle symptoms that pose challenges in timely diagnosis. Our study investigated the non-linear relationship between RDW and in-hospital GIB in stroke patients, even when adjusting for factors like age, gender, ethnicity, and various health conditions. Our analysis revealed significant interactions between RDW and both BUN and creatinine levels in relation to in-hospital GIB. Patients with lower BUN and creatinine levels demonstrated an increased risk of GIB, suggesting that monitoring RDW values can prompt early intervention and potentially reduce GIB incidence in stroke patients.
Our study identifies a non-linear association between RDW and in-hospital GIB in stroke patients, accounting for variables such as age, gender, ethnicity, and health conditions. Using a two-piecewise linear logistic regression model, we established the inflection point for RDW. At RDW levels ≥14.0%, there was a significant positive correlation with GIB risk. Conversely, at RDW levels <14.0%, the association was not significant. Subgroup analysis explored factors influencing RDW’s impact on in-hospital GIB in stroke patients. Significant interactions between RDW and both BUN and Scr levels were noted, relating to in-hospital GIB in stroke patients. Patients with BUN below 20 mg/dL and creatinine below 1.2 mg/dL showed an increased GIB risk. Therefore, using RDW values to predict GIB risk can facilitate early intervention by healthcare providers, potentially reducing GIB incidence in stroke patients.
Our study has notable strengths. For the first time, we explored the association between RDW and GIB risk in stroke patients, utilizing data from multiple centers and a large sample size. Through comprehensive multivariable logistic regression analysis, we accounted for several variables associated with GIB risk, including age, gender, ethnicity, and medical conditions such as AF, CHF, ACS, COPD, diabetes, hypertension, and cancer. This thorough consideration of pertinent variables bolsters the credibility of our findings. Secondly, we utilized cubic spline functions and smooth curve fitting to elucidate the non-linear relationship between RDW and GIB in stroke patients. Importantly, we identified the inflection point for RDW, offering critical clinical insights for preventing GIB in stroke patients.
However, our study has certain limitations. Firstly, this analysis relies on retrospective data, which may have limitations related to data collection and potential biases. We plan to conduct prospective research in the future to address these limitations. Secondly, the presence of only short-term follow-up data in the database limited our ability to discern long-term outcomes. Additionally, this retrospective observational study provides an association inference rather than establishing a causal relationship between RDW and The risk of gastrointestinal bleeding in stroke patients. Finally, given that our study is retrospective, the original database does not include data on non-ICU stroke patients. Therefore, we could not incorporate non-ICU stroke patients in this study. These limitations should be considered when interpreting our findings.
Conclusion
Our study revealed a significant non-linear correlation between RDW and GIB risk in stroke patients. Our findings also highlight that keeping the patient’s RDW value below 14.0% may reduce the risk of in-hospital GIB in stroke patients.
Statements
Data availability statement
The data analyzed in this study was obtained from the electronic Intensive Care Unit Collaborative Research Database (eICU-CRD), the following licenses/restrictions apply: to access the files, users must be credentialed users, complete the required training (CITI Data or Specimens Only Research) and sign the data use agreement for the project. Requests to access these datasets should be directed to PhysioNet, https://physionet.org/, DOI: 10.13026/0pzc-dm64.
Ethics statement
Ethical review and approval was not required for the study on human participants in accordance with the local legislation and institutional requirements. Written informed consent from the patients/participants or patients/participants' legal guardian/next of kin was not required to participate in this study in accordance with the national legislation and the institutional requirements.
Author contributions
ZW: Data curation, Writing – original draft. GP: Data curation, Formal analysis, Writing – original draft. ZC: Data curation, Writing – original draft. XX: Writing – review & editing. ZH: Data curation, Writing – review & editing.
Funding
The author(s) declare that no financial support was received for the research, authorship, and/or publication of this article.
Acknowledgments
In this regard, we sincerely thank the eICU Collaborative Research Database for providing the data resources, which have served as a valuable information foundation for this study.
Conflict of interest
The authors declare that the research was conducted in the absence of any commercial or financial relationships that could be construed as a potential conflict of interest.
Publisher’s note
All claims expressed in this article are solely those of the authors and do not necessarily represent those of their affiliated organizations, or those of the publisher, the editors and the reviewers. Any product that may be evaluated in this article, or claim that may be made by its manufacturer, is not guaranteed or endorsed by the publisher.
References
1.
Fu J . Factors affecting the occurrence of gastrointestinal bleeding in acute ischemic stroke patients. Medicine (Baltimore). (2019) 98:e16312. doi: 10.1097/MD.0000000000016312
2.
O'Donnell MJ Kapral MK Fang J Saposnik G Eikelboom JW Oczkowski W et al . Gastrointestinal bleeding after acute ischemic stroke. Neurology. (2008) 71:650–5. doi: 10.1212/01.wnl.0000319689.48946.25
3.
Chen CM Hsu HC Chuang YW Chang CH Lin CH Hong CZ . Study on factors affecting the occurrence of upper gastrointestinal bleeding in elderly acute stroke patients undergoing rehabilitation. J Nutr Health Aging. (2011) 15:632–6. doi: 10.1007/s12603-011-0052-2
4.
Rumalla K Mittal MK . Gastrointestinal bleeding in acute ischemic stroke: a population-based analysis of hospitalizations in the United States. J Stroke Cerebrovasc Dis. (2016) 25:1728–35. doi: 10.1016/j.jstrokecerebrovasdis.2016.03.044
5.
Ji R Shen H Pan Y Wang P Liu G Wang Y et al . Predictive factors for gastrointestinal bleeding following hemorrhagic stroke: a hospital-based cohort study. Brain Nerve. (2018) 14:943–6. doi: 10.1186/1471-230X-14-130
6.
Albeiruti R Chaudhary F Alqahtani F Kupec J Balla S Alkhouli M . Incidence, predictors, and outcomes of gastrointestinal bleeding in patients admitted with ST-elevation myocardial infarction. Am J Cardiol. (2019) 124:343–8. doi: 10.1016/j.amjcard.2019.05.008
7.
al-Mallah M Bazari RN Jankowski M Hudson MP . Predictors and outcomes associated with gastrointestinal bleeding in patients with acute coronary syndromes. J Thromb Thrombolysis. (2007) 23:51–5. doi: 10.1007/s11239-006-9005-8
8.
Wang J Zhang Y Wan Y Fan Z Xu R . The relationship between red blood cell distribution width and incident diabetes in Chinese adults: a cohort study. J Diabetes Res. (2020) 2020:1623247–7. doi: 10.1155/2020/1623247
9.
Ozgul G Seyhan EC Özgül MA Günlüoğlu MZ . Red blood cell distribution width in patients with CORonic obstructive pulmonary disease and healthy subjects. Arch Bronconeumol. (2017) 53:107–13. doi: 10.1016/j.arbres.2016.05.021
10.
Conic RR Damiani G Schrom KP Ramser AE Zheng C Xu R et al . Psoriasis and psoriatic ArtORitis cardiovascular disease Endotypes identified by red blood cell distribution width and mean platelet volume. J Clin Med. (2020) 9:186. doi: 10.3390/jcm9010186
11.
Febra C Spinu V Ferreira F Gil V Maio R Penque D et al . Predictive value for increased red blood cell distribution width in unprovoked acute venous TORomboembolism at the emergency department. Clin Appl TORomb Hemost. (2023) 29:1299592395. doi: 10.1177/10760296231193397
12.
Akkermans MD Vreugdenhil M Hendriks DM van den Berg A Schweizer JJ van Goudoever JB et al . Iron deficiency in inflammatory bowel disease: the use of Zincprotoporphyrin and red blood cell distribution width. J Pediatr Gastroenterol Nutr. (2017) 64:949–54. doi: 10.1097/MPG.0000000000001406
13.
Bello S Fandos S Lasierra AB Mincholé E Panadero C Simon AL et al . Red blood cell distribution width RDW. and long-term mortality after community-acquired pneumonia. A comparison with proadrenomedullin. Respir Med X. (2015) 109:1193–206. doi: 10.1016/j.rmed.2015.07.003
14.
Hu Z Sun Y Wang Q Han Z Huang Y Liu X et al . Red blood cell distribution width is a potential prognostic index for liver disease. Clin Chem Lab Med. (2013) 51:1403–8. doi: 10.1515/cclm-2012-0704
15.
Sun X Zhang Y Li J Zhang B Jia Q . Analysis of the effect of intelligent red blood cell distribution diagnosis model on the diagnosis and treatment of gastrointestinal bleeding. J Healthc Eng. (2021) 2021:5216979–10. doi: 10.1155/2021/5216979
16.
Liao Y Zhang R Shi S Lin X Wang Y Wang Y et al . Red blood cell distribution width predicts gastrointestinal bleeding after coronary artery bypass grafting. BMC Cardiovasc Disord. (2022) 22:436. doi: 10.1186/s12872-022-02875-4
17.
Pollard TJ Johnson A Raffa JD Celi LA Mark RG Badawi O . The eICU collaborative research database, a freely available multi-center database for critical care research. Sci Data. (2018) 5:180178. doi: 10.1038/sdata.2018.178
18.
Sauer CM Dam TA Celi LA Faltys M de la Hoz MAA Adhikari L et al . Systematic review and comparison of publicly available ICU data sets-a decision guide for clinicians and data scientists. Crit Care Med. (2022) 50:e581–8. doi: 10.1097/CCM.0000000000005517
19.
Montagnana M Danese E . Red cell distribution width and cancer. Ann Transl Med. (2016) 4:399. doi: 10.21037/atm.2016.10.50
20.
Xu WY Yang XB Wang WQ Bai Y Long JY Lin JZ et al . Prognostic impact of the red cell distribution width in esophageal cancer patients: a systematic review and meta-analysis. World J Gastroenterol. (2018) 24:2120–9. doi: 10.3748/wjg.v24.i19.2120
21.
Aslam H Oza F Ahmed K Kopel J Aloysius MM Ali A et al . The role of red cell distribution width as a prognostic marker in CORonic liver disease: a literature review. Int J Mol Sci. (2023) 24:487. doi: 10.3390/ijms24043487
22.
Parizadeh SM Jafarzadeh-Esfehani R Bahreyni A Ghandehari M Shafiee M Rahmani F et al . The diagnostic and prognostic value of red cell distribution width in cardiovascular disease; current status and prospective. Biofactors. (2019) 45:507–16. doi: 10.1002/biof.1518
23.
Alcaíno H Pozo J Pavez M Toledo H . Red cell distribution width as a risk marker in patients with cardiovascular diseases. Rev Med Chile. (2016) 144:634–42. doi: 10.4067/S0034-98872016000500012
24.
Tonelli M Sacks F Arnold M Moye L Davis B Pfeffer M et al . Relation between red blood cell distribution width and cardiovascular event rate in people with coronary disease. Circulation. (2008) 117:163–8. doi: 10.1161/CIRCULATIONAHA.107.727545
25.
Felker GM Allen LA Pocock SJ Shaw LK McMurray J Pfeffer MA et al . Red cell distribution width as a novel prognostic marker in heart failure: data from the CHARM program and the Duke databank. J Am Coll Cardiol. (2007) 50:40–7. doi: 10.1016/j.jacc.2007.02.067
26.
Patel KV Semba RD Ferrucci L Newman AB Fried LP Wallace RB et al . Red cell distribution width and mortality in older adults: a meta-analysis. J Gerontol A Biol Sci Med Sci. (2010) 65:258–65. doi: 10.1093/gerona/glp163
27.
Lee KR Park SO Kim SY Hong DY Kim JW Baek KJ et al . Red cell distribution width as a novel marker for predicting high-risk from upper gastro-intestinal bleeding patients. PLoS One. (2017) 12:e187158:e0187158. doi: 10.1371/journal.pone.0187158
28.
Global, regional, and national burden of stroke and its risk factors, 1990-2019: a systematic analysis for the global burden of disease study 2019. Lancet Neurol. (2021) 20:795–820. doi: 10.1016/S1474-4422(21)00252-0
Summary
Keywords
non-linear relationship, red blood cell distribution width, gastrointestinal bleeding, stroke, multi-center retrospective study
Citation
Wu Z, Peng G, Chen Z, Xiao X and Huang Z (2024) Non-linear relationship between red blood cell distribution width and gastrointestinal bleeding risk in stroke patients: results from multi-center ICUs. Front. Neurol. 15:1346408. doi: 10.3389/fneur.2024.1346408
Received
04 December 2023
Accepted
19 June 2024
Published
28 June 2024
Volume
15 - 2024
Edited by
Yanlin Zhang, Second Affiliated Hospital of Soochow University, China
Reviewed by
Luohai Chen, The First Affiliated Hospital of Sun Yat-sen University, China
Daxue Zhang, Anhui Medical University, China
Piotr Religa, Karolinska Institutet (KI), Sweden
Updates
Copyright
© 2024 Wu, Peng, Chen, Xiao and Huang.
This is an open-access article distributed under the terms of the Creative Commons Attribution License (CC BY). The use, distribution or reproduction in other forums is permitted, provided the original author(s) and the copyright owner(s) are credited and that the original publication in this journal is cited, in accordance with accepted academic practice. No use, distribution or reproduction is permitted which does not comply with these terms.
*Correspondence: Xiaoyong Xiao, as575947548@126.com; Zhenhua Huang, huangzhh12306@163.com
†These authors have contributed equally to this work and share first authorship
Disclaimer
All claims expressed in this article are solely those of the authors and do not necessarily represent those of their affiliated organizations, or those of the publisher, the editors and the reviewers. Any product that may be evaluated in this article or claim that may be made by its manufacturer is not guaranteed or endorsed by the publisher.