Abstract
Background:
Although diffusion magnetic resonance imaging (dMRI), particularly diffusion kurtosis imaging (DKI), has demonstrated efficacy in distinguishing between low- and high-grade gliomas, its predictive utility across various molecular genotypes remains unclear. Evaluating the accuracy of DKI and identifying sources of heterogeneity in its predictive performance could advance noninvasive molecular diagnostic methods and support the development of personalized treatment strategies.
Materials and methods:
A literature search of the PubMed, Web of Science, Cochrane Library, Embase, and Medline databases was performed. The studies retrieved were screened by two researchers (HFZ and ZGH), and those fulfilling the inclusion criteria were subsequently included in the meta-analysis. Study quality was assessed using the Quality Assessment of Diagnostic Accuracy Studies 2 (QUADAS-2) tool. The analyses summarized the mean differences in mean kurtosis (MK) and mean diffusivity (MD) in patients harboring various genotypes using suitable models, and explored heterogeneity. Finally, a bivariate restricted maximum likelihood estimation method and meta-regression analysis were performed to assess diagnostic potential and stability.
Results:
Fourteen studies comprising 886 patients were included in this meta-analysis. Regarding MK and MD, the mean difference between isocitrate dehydrogenase (IDH) mutation and IDH wild type was −0.21 (95% confidence interval [CI] −0.27 to −0.15; I2 = 93%) and 0.22 (95% CI 0.11 to 0.33; I2 = 92%), respectively. This heterogeneity could be explained by imaging parameters such as repetition time, echo time, maximal b-value, and number of diffusion directions. However, the mean difference did not reflect the genetic status of 1p/19q, α-thalassemia/mental retardation syndrome-X-linked (ATRX) gene, or O6-methylguanine-DNA-methyltransferase (MGMT). Analysis of diagnostic accuracy revealed that the pooled areas under the curve for MK and MD, based on IDH status, were 0.96 (95% CI 0.93 to 0.97) and 0.76 (95% CI 0.71 to 0.81), respectively. Heterogeneity was not observed for these DKI parameters.
Conclusion:
MK and MD exhibited potential diagnostic utility in the prediction of glioma molecular status and should be explored in medical practice. These parameters should be compared with other MRI models to develop a stable and suitable genetic molecular prediction method for patients with gliomas.
Systematic Review Registration:
https://www.crd.york.ac.uk/PROSPERO/view/CRD42024568923, CRD42024568923.
Introduction
Gliomas are the most common primary intracranial malignancy (1). Clinicians have reported significant differences in treatment response, risk for recurrence, and overall survival among patients diagnosed with gliomas (2). Previous studies have suggested that these differences could be attributed to molecular expression status, especially isocitrate dehydrogenase (IDH), chromosomal alterations in 1p/19q, alpha-thalassemia X-linked intellectual disability syndrome (ATRX), and O6-methylguanine-DNA methyltransferase (MGMT) (3). For example, Galbraith et al. (4) described the high heterogeneity and invasiveness of wild-type IDH glioma cell clusters. Similarly, Iwadate et al. (5) demonstrated that 1p/19q co-deletion could reflect favorable outcomes and a lower risk for disease recurrence. Moreover, clinical trials have shown that some genetic markers—particularly ATRX and MGMT—were associated with therapeutic responses (5, 6). These findings highlight the importance of identifying the genetic status of gliomas to guide treatment strategies and improve patient outcomes (Figure 1). Traditionally, molecular diagnoses have primarily been determined from tissue samples obtained after surgical resection. However, not all patients accept the risk for neurological damage and mortality associated with surgery (7). Therefore, developing noninvasive diagnostic methods is critical for those who are unable or unwilling to undergo surgical intervention.
Figure 1

Significance of diffusion kurtosis imaging (DKI) and its key parameters in patient treatment. (A) When a patient was diagnosed with glioma, DKI was recommended. (B) Based on the molecular expression status predicted from the patient’s DKI main parameters’ values, clinicians could more accurately determine the histological grade. (C) Then, this information guided decisions on the extent of surgical area and the individualized adjuvant treatment strategies. Finally, patient survival rates could be monitored during follow-up, contributing to the advancement of medical care.
With advances and developments in medical technologies, diffusion magnetic resonance imaging (dMRI) and its related sequences, particularly diffusion-weighted imaging (DWI) and diffusion tensor imaging (DTI), have demonstrated potential for predicting glioma molecular subtypes based on the capture of water molecular condition (8–10). This non-invasive and specific technique has attracted the interest of clinicians and radiologists. Several trials have supported the predictive potential of dMRI for the molecular classification of gliomas. For example, Zhang et al. (9) analyzed preoperative MRI data from 247 patients diagnosed with gliomas and found that the apparent diffusion coefficient value on DWI could predict glioma histological grade and IDH expression status. Similarly, Xiong et al. (10) reported that fractional anisotropy values on DTI were significantly different between IDH mutant and IDH wild-type gliomas in 90 patients. However, due to volume and mass effects, the parameter values derived from DWI and DTI may be influenced by tumor heterogeneity and the surrounding normal peritumoral tissue. While it is possible to define and analyze the tumor region at the voxel level, the influences of regional overlap and tumor heterogeneity cannot be entirely eliminated. Similarly, due to the mass effect of gliomas, normal brain tissue, nerve fiber bundles, and small blood vessels may be displaced or distorted (11, 12). We have identified tumor regions as accurately as possible using manual drawing and software-based analyses. However, irrelevant brain structures cannot be completely recognized or eliminated based on imaging data (13). Therefore, basic dMRI sequences, such as DWI and DTI, may not accurately capture the complex information crucial for the prediction of genetic status (14). Additionally, magnetic resonance spectroscopy and amide proton transfer imaging techniques can assist clinicians in predicting the gene expression status of gliomas by analyzing metabolite concentration and chemical environment (15, 16). Volume and mass effects still influence MRI-related analyses. Therefore, it is necessary to develop higher-resolution MRI technologies.
Diffusion kurtosis imaging (DKI) can reveal the microstructural complexity of tumor tissues and provide additional metrics related to the non-Gaussianity of water diffusion (17). Previous studies have shown that DKI can effectively distinguish between low-grade gliomas (LGG) and high-grade gliomas (HGG) (18). Additionally, recent meta-analyses have further supported the predictive value of DKI in differentiating glioma grades (Table 1). For instance, meta-analyses conducted by Huang et al. (19) and Abdalla et al. (20) included 270 and 460 patients, respectively, both confirming the high diagnostic accuracy of DKI in glioma grading. Furthermore, Falk et al. (21) reported that mean kurtosis (MK), the main parameter of DKI, can differentiate HGG from LGG with a sensitivity of 0.85 and a specificity of 0.92. Meanwhile, Luan and his team found similar results (22). Among these studies, Xu and his colleagues conducted the most comprehensive meta-analysis to date, incorporating the largest number of studies and patients (23). Their findings provided strong evidence supporting the value of DKI in the prediction of glioma grades. Although DKI can predict glioma grades (HGG or LGG) stably, the utility of DKI for predicting glioma genotypes, like IDH, ATRX, MGMT genetic statuses, remains controversial. Su and Xu (24, 25) found that mean diffusivity (MD), a DKI parameter, could predict IDH mutations, with higher MD values observed in IDH-mutant gliomas. In contrast, Zhao et al. (26) reported that DKI parameters failed to provide consistent and reliable results for differentiating the IDH status. To address these conflicting results, we conducted a meta-analysis to assess the predictive utility of DKI. Our aim was to determine whether DKI could be considered a promising noninvasive diagnostic method, contributing to improved diagnostic accuracy and molecular classification in glioma management (27).
Table 1
| First author | Registered number/conducted data | Diagnostic methods | Studies number | Patients number (LGG/HGG) | The pooled efficacy | Publish bias | Key findings |
|---|---|---|---|---|---|---|---|
| Falk Delgado A. | CRD 42017064204 |
N/A | 5 | 245 (108/137) | Sensitivity: 85% (95% CI, 74–92%) Specificity: 92% (95% CI, 81–96%) ROC curve: 0.94 |
Low | The DKI parameter MK had high accuracy in the discrimination between glioma grades. DKI could be added to the routine imaging protocol for work-up of suspected gliomas. |
| Xu C. | Up to December 15, 2020 | Histopathology or Clinical diagnosis | 13 | 706 (277/429) | Sensitivity: 88% (95% CI, 83–91%) Specificity: 91% (95% CI, 86–95%) ROC curve: 0.93 (95% CI, 0.90–0.95) |
Low | DKI demonstrated a high diagnostic performance for differentiation of LGG from HGG. |
| Luan J. | Up to 2019. | MRI technology | 16 | 675 (340/335) | Sensitivity: 88% (95% CI, 82–92%) Specificity: 95% (95% CI, 78–91%) ROC curve: 0.93 (95% CI, 0.91–0.95) |
Low | Quantitative parameters of DKI, especially MK, had high diagnostic accuracy for preoperative grading of gliomas. |
| Abdalla G. | CRD 42018099192 |
Histologic and immunohistochemistry examination | 9 | 460 (230/230) | Sensitivity: 87% (95% CI, 78–92%) Specificity: 85% (95% CI, 76–91%) ROC curve: 0.92 |
Low | DKI showed good diagnostic accuracy in the differentiation of HGG and LGG gliomas further supporting its potential role in clinical practice. |
| Huang R. | Up to April 31, 2018 | MRI technology | 5 | 270 (116/154) | Sensitivity: 91% (95% CI, 78–96%) Specificity: 91% (95% CI, 80–97%) ROC curve: 0.96 |
Low | This current meta-analysis provided evidences that DKI had the high diagnostic accuracy to differentiate HGG from LGG |
Meta-analyses investigating Diffusion Kurtosis Imaging (DKI) to predict low (LGG) vs. high-grade glioma (HGG).
Methods
A team consisting of two neuro-oncologists, two neurosurgeons, and a senior statistician meticulously designed, registered, and conducted the meta-analysis in accordance with the Preferred Reporting Items for Systematic Reviews and Meta-Analyses (PRISMA) guidelines (Supplementary Tables S1, S2). The analysis was prospectively registered in PROSPERO on July 24, 2024 (CRD 42024568923) (28).
Electronic search and eligibility criteria
An online literature search was conducted by a neuro-oncologist and a neurosurgical clinician (ZGH, with over 30 years of clinical experience, and HFZ, with 4 years of professional training as a neuro-oncologist) across five databases: PubMed, Web of Science, Cochrane Library, Embase, and Medline. The search covered the period from January 1, 1970, to July 25, 2024. The full search queries and step-by-step results are summarized in Supplementary Tables S3–S6. The inclusion criteria were as follows: (1) Histological grades and genotypes of gliomas must be identified through histopathological examination; (2) The included studies should provide detailed information on the patient population and the sensitivity and specificity rates of the diagnostic methods; (3) The DKI parameters must be derived from tumor tissue and include at least one of the following: MK or MD, along with the 95% confidence interval (95% CI); (4) The genetic status of patients reported in the article should encompass at least one of the following: IDH, 1p/19q, ATRX, or MGMT; and (5) The included articles must ensure the application of contemporary imaging technologies. Both prospective and retrospective observational cohort studies were eligible for inclusion in this meta-analysis. Comments, conference abstracts, reviews, case reports, duplicate articles, or articles lacking DKI parameters were progressively excluded from the search.
Data extraction and study quality assessment
To evaluate the diagnostic efficiency of DKI in glioma genotypes, a standardized table was established for data collection prior to the study. Two authors (HFZ and ZGH) independently performed a literature search and review, and documented the findings. Data extracted from the included studies were as follows: first author; publication year; trial type; population; number of patients with each genotype; mean age; World Health Organization criteria; histological grade; imaging vendors and strength; b-value and maximal b-value; repetition time; echo time; diffusion direction; MK; MD; and prediction efficacy (sensitivity and specificity). To mitigate selection bias, the reviewers compared results and analyzed any discrepancies at the conclusion of the extraction process. If contentious differences could not be reconciled, a senior researcher (JX) performed the second round of data extraction. The quality of the included studies was assessed using the Quality Assessment of Diagnostic Accuracy Studies-2 (QUADAS-2; Supplementary Tables S7, S8) (29).
Statistical analysis
Mean differences in MK and MD were summarized to analyze variations across various glioma genotypes through inverse variance meta-analysis using an appropriate model. If preliminary heterogeneity was assessed as low or moderate (I2 ≤ 50%), a fixed effects model was applied; conversely, if heterogeneity was high (I2 > 50%), a random effects model was adopted (30). To explore sources of heterogeneity, further subgroup analyses based on patient characteristics, imaging vendors, and pre-processing parameters were performed. The results of the τ2 statistic and χ2 test were examined to evaluate variance between studies. The I2 statistic was also utilized to assess heterogeneity in the subgroup analyses. To estimate the diagnostic accuracy of DKI for glioma genotypes, a bivariate random effects meta-analysis with a restricted maximum likelihood estimation method was used. A likelihood ratio scattergram was used to assess model fit effects. Publication bias was examined using a funnel plot and the Deek’s test. A Fagan nomogram was used to indicate post-test probabilities based on varying pre-test probabilities for clinical decision making. Forest plots of diagnostic scores, odds ratio, positive diagnostic likelihood ratio (PLR), and negative diagnostic likelihood ratio (NLR) were used to quantify the diagnostic effect. Statistical analyses were performed using Stata 17.0 Software, Revman 5.4 and MedCalc.1,2,3 MedCalc was a comprehensive statistical analysis software widely used in various medical studies, specifically for receiver operating characteristic (ROC) curve analysis (31). Compared with Stata and Review Manager, MedCalc can control for the influence of heterogeneity within different studies and the limitations of small experimental populations. The effects of heterogeneity were minimized to obtained more accurate results based on DeLong and Binomial exact methods by manually inputting data from each study. Differences with p < 0.05 were considered to be statistically significant (32, 33).
Results
Search strategy and included studies
No restrictions were imposed on study type to maximize the number of studies retrieved. The initial literature search retrieved 2061 studies, of which 112 were identified as relevant reviews, while 1924 were classified as unrelated research papers and were excluded after thorough evaluation. The online database search strategy subsequently identified 25 results, with 14 remaining after excluding 3 abstracts, 5 duplicate cohorts, and 3 studies that lacked essential information. Ultimately, therefore, 14 studies comprising 886 patients fulfilled the inclusion criteria and were included in the qualitative analysis (25, 26, 34–45). A PRISMA flow-diagram illustrating the screening process is presented in Figure 2. Patient characteristics, detailed imaging device parameters, and post-processing approaches are summarized in Tables 2, 3.
Figure 2
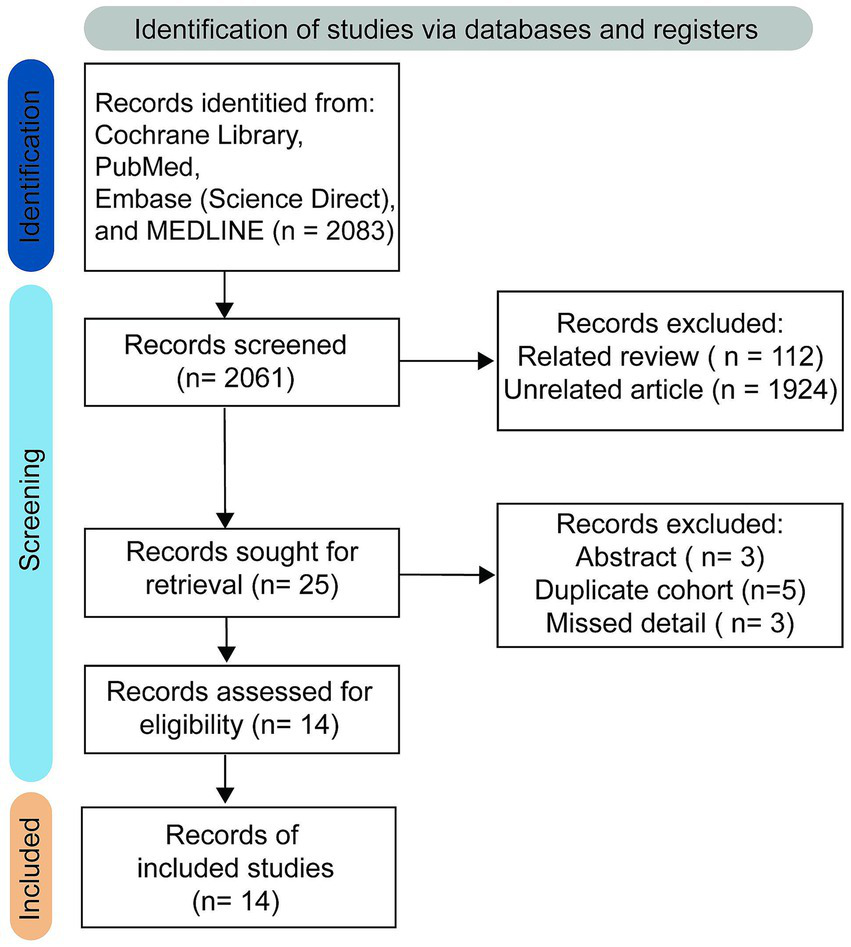
Study selection process.
Table 2
| First authora | Yearb | Trial type | Patients number | Mean age (Mean ± SD) | WHO criteria | Gradec | Imager vendord | The number of b-valuee | Maximal b value | Repetition/echo timee | The number of diffusion directions |
|---|---|---|---|---|---|---|---|---|---|---|---|
| Hempel JM_a | 2017 | Prospective | 77 | 51 ± 15 | 2016 | 0,29,26,19 | Biograph mMR | 6 | 2,500 | 5900/95 | 30 |
| Guo H | 2022 | Prospective | 62 | 52 ± 13 | 2016 | 0,14,20,28 | MAGNETOM Skyra | 10 | 3,000 | 4500/111 | 62 |
| Zeng S | 2023 | Retrospective | 70 | 47 ± 12 | 2021 | 0,19,11,39 | MAGNETOM Skyra | 11 | 3,000 | 3700/72 | N/A |
| Hempel JM_b | 2016 | Prospective | 61 | 50 ± 14 | 2007 | 0,25,15,10 | Biograph mMR | 6 | 2,500 | 5900/95 | 30 |
| Zhu H | 2023 | Retrospective | 81 | 47 ± 11 | 2016 | 0,28,17,36 | Discovery MR750 | 4 | 2,500 | 6500/85 | 25 |
| Wang X | 2020 | Prospective | 54 | 48 ± 15 | N/A | LGG:19; HGG:32 |
MAGNETOM Skyra | 6 | 2,500 | 3000/109 | 30 |
| Tan Y_a | 2019 | Retrospective | 58 | 49 ± 7 | 2016 | 0,24,15,19 | GE Signa HDxt | 3 | 2000 | 6500/11 | 30 |
| Qiu J | 2023 | Prospective | 40 | 55 ± 12 | N/A | 0,0,14,26 | Discovery MR750 | 3 | 2,500 | N/A | 60 |
| Tan Y_b | 2020 | Retrospective | 62 | 50 ± 13 | 2016 | LGG:26 HGG:36 | GE Signa HDxt | 3 | 2000 | 6500/85 | 30 |
| Zhao J | 2019 | Prospective | 52 | 45 ± 12 | 2016 | 0,24,8,20 | MAGNETOM Verio | 3 | 2000 | 5500/85 | 30 |
| Wang P | 2023 | Prospective | 67 | 50 ± 12 | 2021 | 0,22,20,25 | MAGNETOM Skyra | 3 | 2000 | 4200/101 | N/A |
| Xu Z | 2021 | Retrospective | 51 | 46 ± 15 | N/A | 0,13,17,21 | GE Signa HDxt | 3 | 2000 | 10,000/97 | 25 |
| Hempel JM_c | 2017 | Retrospective | 60 | 51 ± 15 | 2016 | 0,28,20,12 | Biograph mMR | 6 | 2,500 | 5900/95 | 30 |
| Xie Y | 2021 | Prospective | 91 | 47 ± 7 | 2016 | 0,27,20,44 | Discovery MR750 | 3 | 2,500 | 6500/85 | 25 |
Study details for included articles.
Some detail were not be shown due make the table more clear. aArticles published by the same first author are distinguished using an underscore followed by a letter; bYear of publication; cWHO Glioma Grade I, II, III, IV; dAll scanners in published articles were 3.0 Tesla; eb-value units in sec/mm2; Repetition/Echo Time in msec.
Table 3
| First author | Mean kurtosis (Mean ± SD, patient populations) | Mean diffusivity (Mean ± SD, patient populations) | ||||||
|---|---|---|---|---|---|---|---|---|
| IDH Mut./Wt. | ATRX_Del./Exp. | LOH 1p/19q_Y/N | MGMT_Me./Un. | IDH Mut./Wt. | ATRX_Del./Exp. | LOH 1p/19q_Y/N | MGMT_Me./Un. | |
| Hempel JM_a | 0.48 ± 0.11;47 0.71 ± 0.12;30 |
0.41 ± 0.07;25 0.64 ± 0.13;52 | 0.55 ± 0.09;22 0.58 ± 0.18;55 | 1.47 ± 0.38;47 1.44 ± 0.26;30 |
1.72 ± 0.29;25 1.33 ± 0.28;52 |
1.19 ± 0.25;22 1.57 ± 0.31;55 |
N/A | |
| Guo H et al. | 0.72 ± 0.19;18 0.70 ± 0.17;44 |
1.32 ± 0.36;18 1.46 ± 0.43;44 |
||||||
| Zeng S et al. | 0.56 ± 0.17;35 0.69 ± 0.14;35 |
|||||||
| Hempel JM_b | 0.43 ± 0.09;33 0.57 ± 0.10;16 |
0.41 ± 0.11;19 0.51 ± 0.10;26 |
0.47 ± 0.05;12 0.46 ± 0.13;23 |
0.50 ± 0.11;19 0.48 ± 0.14;15 |
1.82 ± 0.37;33 1.43 ± 0.39;16 |
1.90 ± 0.45;19 1.56 ± 0.29;26 | 1.63 ± 0.25;12 1.74 ± 0.45;23 | 1.65 ± 0.33;19 1.57 ± 0.48;15 |
| Zhu H et al.# | 0.51 ± 0.16;42 0.67 ± 0.18;39 |
|||||||
| Wang X | 0.55 ± 0.09;17 0.68 ± 0.16;34 |
0.60 ± 0.14;19 0.60 ± 0.15;32 |
0.65 ± 0.15;22 0.63 ± 0.15;29 |
1.69 ± 0.13;17 1.53 ± 0.27;34 |
1.58 ± 0.21;19 1.56 ± 0.26;32 |
1.52 ± 0.17;22 1.60 ± 0.28;29 |
||
| Tan Y_a | 0.48 ± 0.16;27 0.67 ± 0.13;31 |
1.49 ± 0.41;27 1.22 ± 0.26;31 |
||||||
| Qiu J | 0.67 ± 0.11;11 1.53 ± 0.25;29 |
1.42 ± 0.06;11 0.93 ± 0.08;29 |
||||||
| Tan Y_b | 0.48 ± 0.15;30 0.66 ± 0.14;32 |
0.56 ± 0.18;46 0.62 ± 0.14;16 |
0.90 ± 0.23;30 0.76 ± 0.24;32 |
0.85 ± 0.26;46 0.78 ± 0.17;16 |
||||
| Zhao J | 0.53 ± 0.05;28 0.69 ± 0.06;23 |
1.49 ± 0.10;28 1.34 ± 0.11;23 |
||||||
| Wang P | 0.57 ± 0.11;42 0.76 ± 0.13;25 |
0.54 ± 0.11;23 0.60 ± 0.12;17 |
1.19 ± 0.15;42 0.90 ± 0.13;25 |
1.20 ± 0.14;23 1.17 ± 0.17;17 |
||||
| Xu Z | 0.43 ± 0.15;25 0.63 ± 0.17;26 |
1.85 ± 0.34;25 1.47 ± 0.40;26 |
||||||
| Hempel JM_c | 0.34 ± 0.09;22 0.56 ± 0.10;22 |
|||||||
| Xie Y | 0.59 ± 0.13;42 0.80 ± 0.08;49 |
0.89 ± 0.36;42 0.64 ± 0.09;49 |
||||||
Diffusion metrics by glioma genotype for included articles.
IDH Mut./Wt., IDH Mutation or IDH wild type; ATRX_Del./Exp., ATRX Deletion or ATRX expression; LOH 1p/19q_Y/N, The loss of heterozygosity was/was not happened on Chromosome 1q and 19q; MGMT_Me./Un., the MGMT gene existed/did not appear methylated; SD, Standard Deviation.
The MK value of Zhu H et al. calculated by the DIPY Toolbox (https://www.dipy.org).
Assessment of quality and risk of bias
To determine whether the patients involved could be considered as part of the same population, the retrospective studies were classified according to their associated risks. Assessment according to The QUADAS-2 tool indicated a moderate risk of bias in 3 studies due of the type of clinical trial being conducted (36, 38, 45). Furthermore, the randomization process and outcome assessment in these 3 studies may have been influenced, prompting them to be categorized as “having concerns” in domains D1 and D4. Based on quality and risk of bias assessment, it was concluded that these studies could be included in the meta-analysis. No additional bias was identified according to the QUADAS-2 criteria.
Mean difference in MK and MD among various glioma genotypes
Based on the inverse variance random effects model, the mean difference in MK between the IDH mutant and wild genotype was −0.21 (95% CI −0.27 to −0.15; p < 0.001). The mean difference in MD between the IDH mutation and wild type was 0.22 (95% CI 0.11 to 0.33; p < 0.001) (Figure 3A). In the random effects model, the pooled mean differences in MK and MD exhibited high heterogeneity (I2 = 93 and 92%, respectively) (Supplementary Table S9). This means that the DKI parameter could significantly reflect the difference in molecular water conditions between patients with IDH mutation(s) and those with wild-type glioma. However, neither MK nor MD effectively reflected 1p/19q or MGMT expression. It is important to note that, although assessment of the MK prediction value based on ATRX status yielded disappointing results, MD exhibited a potential trend toward distinguishing ATRX expression status in the meta-analysis (mean difference 0.24 [95% CI −0.01 to 0.50]; p = 0.06), which may need further exploration using larger experimental sample sizes. To explore the source of heterogeneity in the mean difference related to IDH, funnel plot analysis was performed to evaluate publication bias (Figures 3B,C). The plot reveals clear asymmetry and the presence of an outlier study for MK. However, the analysis indicated that publication bias for MD was minimal. Further analyses will be conducted to investigate heterogeneity. It should be noted that, due to the limited number of data points for 1p/19q, MGMT, and ATRX status, publication bias was not assessed nor was heterogeneity or investigated in these cases.
Figure 3
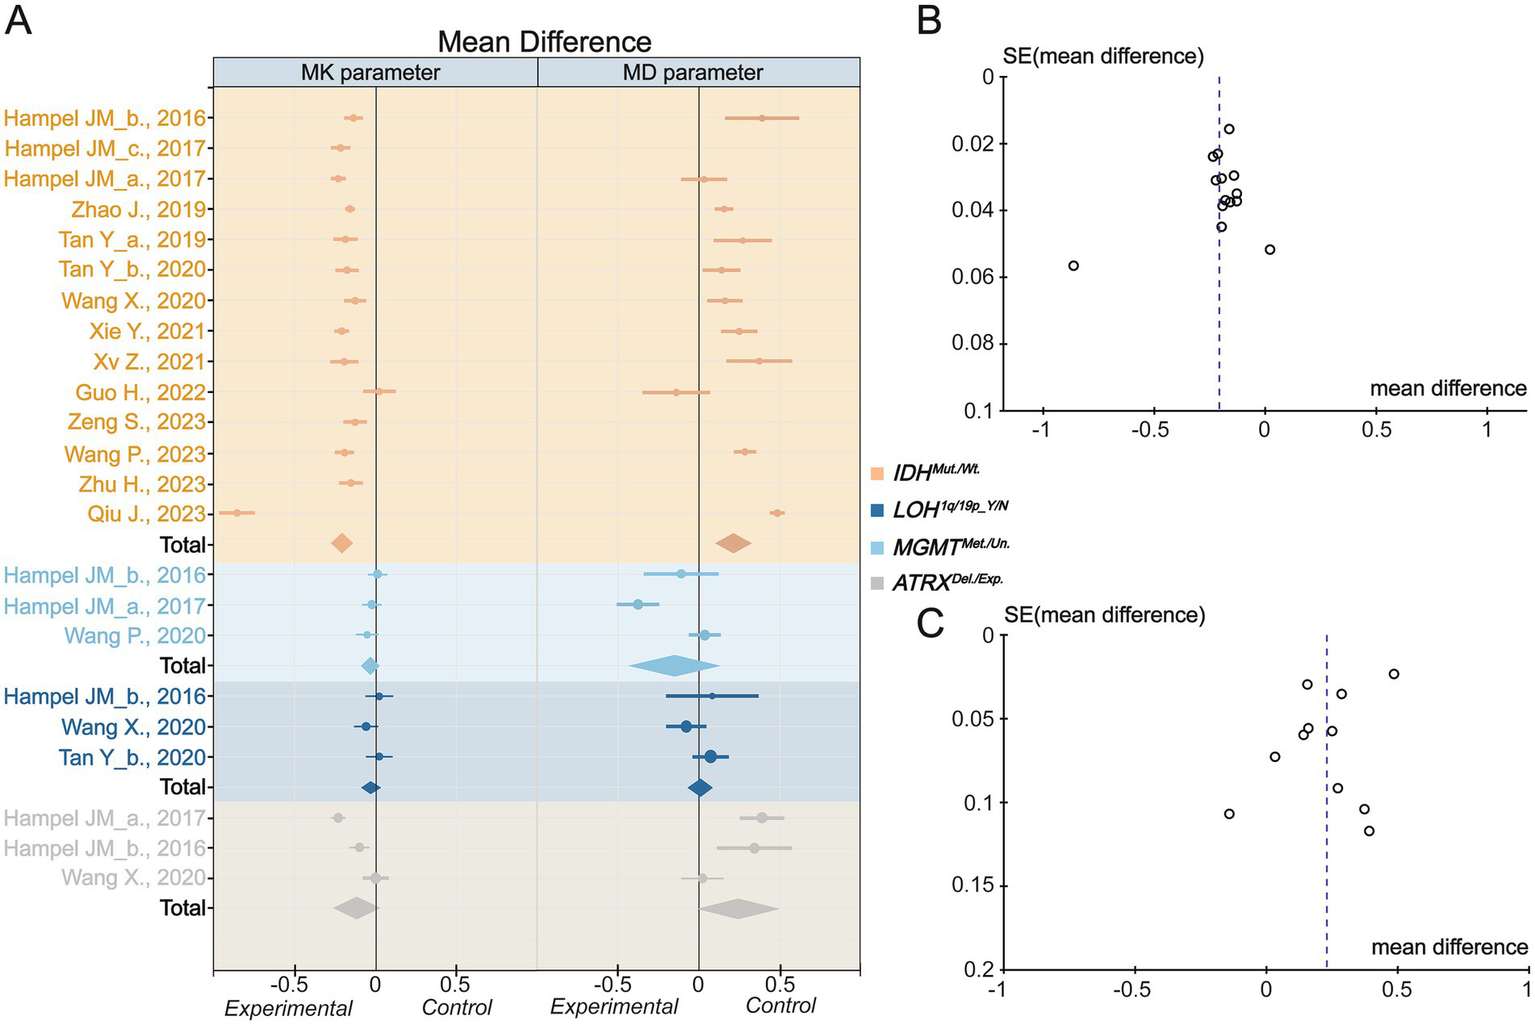
Inverse variance meta-analysis. (A) The mean difference for Mean Kurtosis and Mean Diffusivity in various genotypes. (B) The funnel plot of Mean Kurtosis. (C) The funnel plot of Mean Diffusivity. IDH_mut., IDH mutation type; IDH_wt., IDH wild type; LOH, Loss of Heterozygosity; Y, yes; N, no; MGMT_Me., MGMT methylation; MGMT_Un., MGMT Unmethylation; ATRX_Del., ATRX deletion; ATRX_Exp., ATRX expression. The Mean Kurtosis value of Zhu H et al. calculated by the DIPY Toolbox.
Heterogeneity resource and subgroup analysis
Based on inverse variance meta-analysis, it was essential to explore the heterogeneity of the mean difference in IDH genotypes. The heterogeneity of MK was lower in studies using specific imaging device parameters, including diffusion encoding direction ≤30 (I2 ≤ 0.5), maximal b value <2,500 s/mm2 (I2 = 0), repetition time (TR) ≥ 6,000 ms (I2 = 0), and echo time (TE) < 100 ms (I2 = 0.37). Similar outcomes were observed in the MK heterogeneity analysis (Table 4). Although the mean differences in MK and MD decreased slightly after subgroup analysis, their diagnostic utilities remained effective and stable in differentiating between IDH mutant and wild-type genotypes. However, due the low mean differences and limited number of studies, subgroup analyses were not performed for mean differences in the 1p/19q, ATRX, and MGMT genotypes.
Table 4
| Parameter | Subgroup of studies | The number of Studies | The number of patients | IDH status | Effect Estimate | τ 2 value | χ 2 value | Ι 2 value | Z value (p value) | |
|---|---|---|---|---|---|---|---|---|---|---|
| Mut. | Wild | |||||||||
| MK | Diffusion-encoding Direction = 25 | 3 | 223 | 114 | 109 | −0.20 [−0.23, −0.16] | 0 | 1.66 | 0 | 10.95 (p < 0.01) |
| Diffusion-encoding Direction = 30 | 7 | 392 | 204 | 188 | −0.18 [−0.21, −0.15] | 0 | 12.05 | 0.5 | 11.89 (p < 0.01) | |
| Diffusion-encoding Direction > 60 | 2 | 99 | 26 | 73 | −0.42 [−1.28, −0.44] | 0.39 | 132.49 | 0.99 | 0.95 (p = 0.34) | |
| Maximal b value < 2,500 s/mm2 | 5 | 289 | 152 | 137 | −0.17 [−0.20, −0.15] | 0 | 1.56 | 0 | 14.61 (p < 0.01) | |
| Maximal b value = 2,500 s/mm2 | 7 | 433 | 214 | 219 | −0.27 [−0.39, −0.16] | 0.02 | 145.83 | 0.96 | 4.71 (p < 0.01) | |
| Maximal b value > 2,500 s/mm2 | 2 | 132 | 53 | 79 | −0.06 [−0.21, 0.09] | 0.01 | 5.56 | 0.82 | 0.79 (p = 0.43) | |
| b value < 6 | 8 | 501 | 247 | 254 | −0.26 [−0.36, −0.17] | 0.02 | 144.61 | 0.95 | 5.32 (p < 0.01) | |
| b value ≥ 6 | 6 | 353 | 172 | 181 | −0.15 [−0.21, −0.09] | 0 | 26.90 | 0.81 | 4.70 (p < 0.01) | |
| Repetition time < 6,000 msec | 8 | 471 | 242 | 229 | −0.16 [−0.20, −0.12] | 0 | 27.88 | 0.75 | 7.72 (p < 0.01) | |
| Repetition time ≥ 6,000 msec | 5 | 343 | 166 | 177 | −0.19 [−0.22, −0.16] | 0 | 1.85 | 0.00 | 12.95 (p < 0.01) | |
| Echo time < 100 msec | 10 | 634 | 331 | 303 | −0.18 [−0.21, −0.16] | 0 | 14.31 | 0.37 | 15.72 (p < 0.01) | |
| Echo time ≥ 100 msec | 3 | 180 | 77 | 103 | −0.11 [−0.22, 0.00] | 0.01 | 13.03 | 0.85 | 1.94 (p = 0.05) | |
| MD | Diffusion-encoding Direction = 25 | 2 | 142 | 67 | 75 | 0.28 [0.17, 0.39] | 0 | 1.09 | 0.08 | 5.19 (p < 0.01) |
| Diffusion-encoding Direction = 30 | 6 | 348 | 182 | 166 | 0.16 [0.10, 0.23] | 0 | 8.53 | 0.41 | 4.94 (p < 0.01) | |
| Diffusion-encoding Direction > 60 | 2 | 102 | 29 | 73 | 0.18 [−0.43, 0.79] | 0.19 | 32.54 | 0.97 | 0.58 (p = 0.56) | |
| Maximal b value < 2,500 s/mm2 | 5 | 289 | 152 | 137 | 0.23 [0.14, 0.31] | 0.01 | 12.06 | 0.67 | 5.43 (p < 0.01) | |
| Maximal b value = 2,500 s/mm2 | 4 | 308 | 150 | 158 | 0.26 [0.07, 0.45] | 0.04 | 62.56 | 0.94 | 2.71 (p = 0.01) | |
| The number of b value < 6 | 7 | 420 | 205 | 215 | 0.28 [0.15, 0.40] | 0.03 | 90.62 | 0.93 | 4.32 (p < 0.01) | |
| The number of b value ≥ 6 | 4 | 239 | 115 | 124 | 0.11 [−0.07, 0.28] | 0.02 | 13.17 | 0.77 | 1.21 (p < 0.01) | |
| Repetition time < 6,000 msec | 6 | 357 | 185 | 172 | 0.15 [0.05, 0.26] | 0.01 | 25.80 | 0.81 | 2.96 (p < 0.01) | |
| Repetition time ≥ 6,000 msec | 4 | 262 | 124 | 138 | 0.24 [0.15, 0.32] | 0 | 4.46 | 0.33 | 5.25 (p < 0.01) | |
| Echo time < 100 msec | 7 | 439 | 232 | 207 | 0.20 [0.13, 0.28] | 0.01 | 14.36 | 0.58 | 5.19 (p < 0.01) | |
| Echo time ≥ 100 msec | 3 | 180 | 77 | 103 | 0.13 [−0.06, 0.32] | 0.02 | 15.79 | 0.87 | 1.30 (p = 0.19) | |
Subgroup analyses of heterogeneity in prediction of IDH status.
Bivariate model
To perform a bivariate restricted maximum likelihood meta-analysis, some studies that reported the necessary data for diagnostic meta-analysis, such as true positives, false positives, true negatives, false negatives, and area under the curve, were considered (25, 26, 34, 36, 37, 41, 42, 44, 45). When MK was used for predicting IDH status, the summary sensitivity and specificity were found to be 0.87 and 0.84, respectively (Figure 4A). The summary ROC (sROC) curve is presented in Figure 4B with an area under the curve of 0.88. Fagan’s nomogram indicated that individuals who tested positive for MK had an 85% probability of harboring the IDH mutant genotype (Figure 5A). The PLR and NLR were calculated to be 5.51 and 0.15, respectively (Supplementary Figure S1C). Furthermore, the sensitivity and specificity for MD prediction were 0.86 and 0.84 (Figure 4D), respectively, with an area under the sROC curve of 0.91 (Figure 4E). The PLR and NLR for MD were 5.21 and 0.17 (Supplementary Figure S1D). Fagan supported that the patients identified using MD would have an 84% likelihood of having IDH mutant gliomas after pathological examination (Figure 5B). The diagnostic scores and odds ratios supported the strong diagnostic value of both MK and MD (Supplementary Figure S1). Deek’s funnel plot indicated low heterogeneity for both MK and MD (Figures 4C,F). Bivariate meta-regression analysis revealed that factors, such as age, publication year, number of patients, percentage of LGG, b value, maximal b value, TR, TE, direction, and imaging vendor, did not significantly influence prediction accuracy (Table 5). Compared with the pooled sensitivity and specificity, the diagnostic values for MK and MD were inconsistent in terms of the area under the sROC curve. This discrepancy may be attributed to the inadequate curve fitting resulting from the small sample size and limited number of studies (Figures 6A,B). To obtain a more accurate result, MedCalc software was used to recalculate the areas under the sROC curve for the predictive values of MK and MD, which yielded values of 0.96 and 0.76, respectively (Figure 6C).
Figure 4
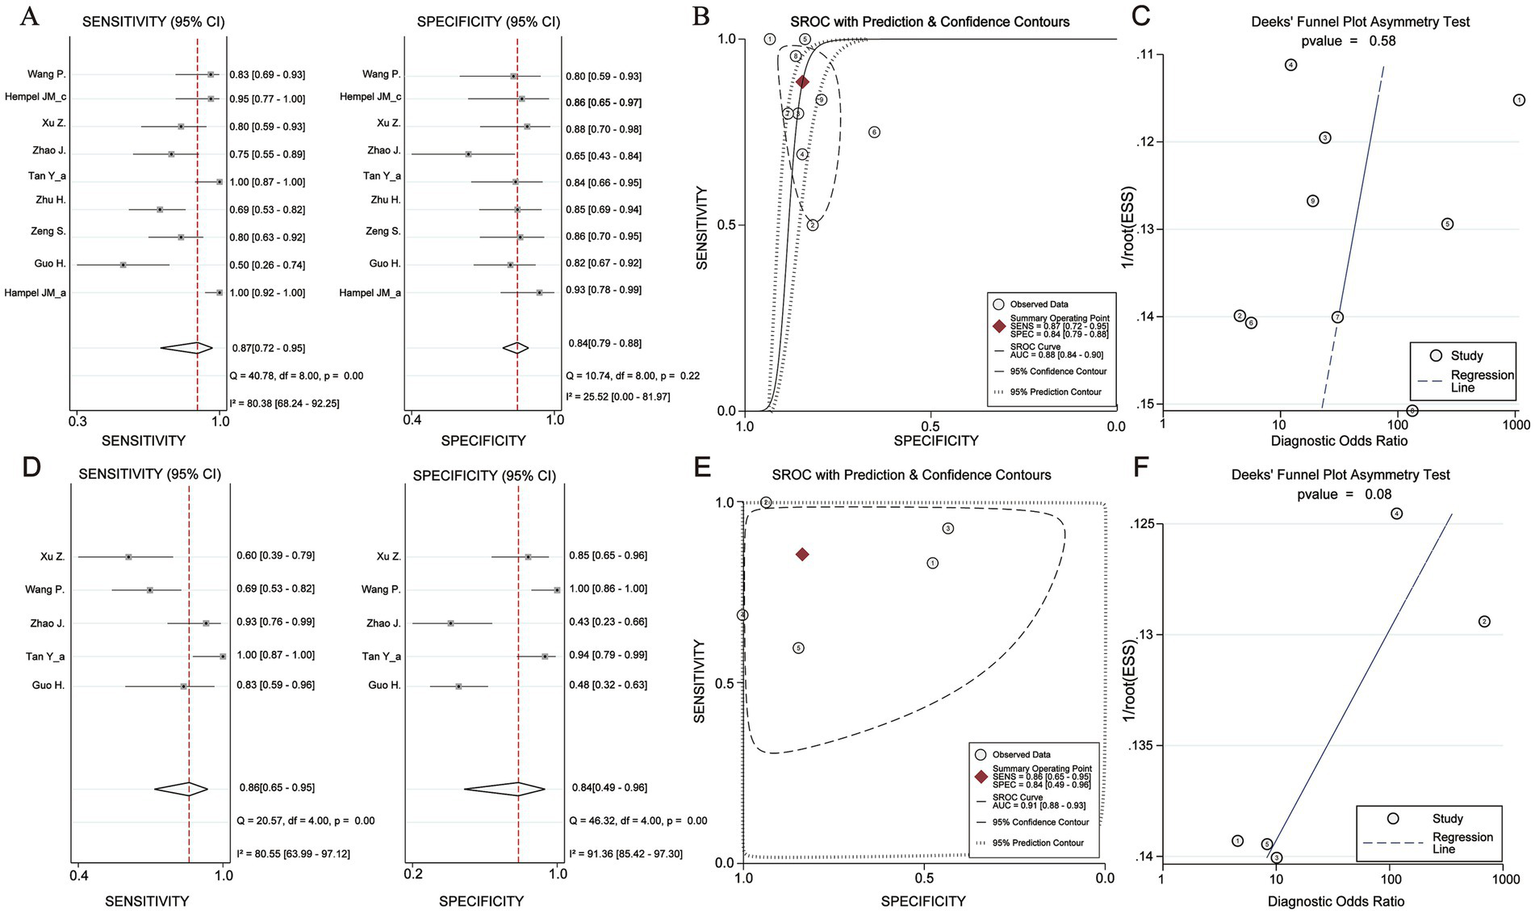
Diagnosis efficacy analysis of Mean Kurtosis and Mean Diffusivity basing on IDH status. (A) Sensitivity and Specificity effect. (B) Receiver operating characteristic curve with Prediction & Confidence Contours. (C) The Deek’s funnel plot. (D) Sensitivity and Specificity effect. (E) Receiver operating characteristic curve with Prediction & Confidence Contours. (F) The Deek’s funnel plot.
Figure 5
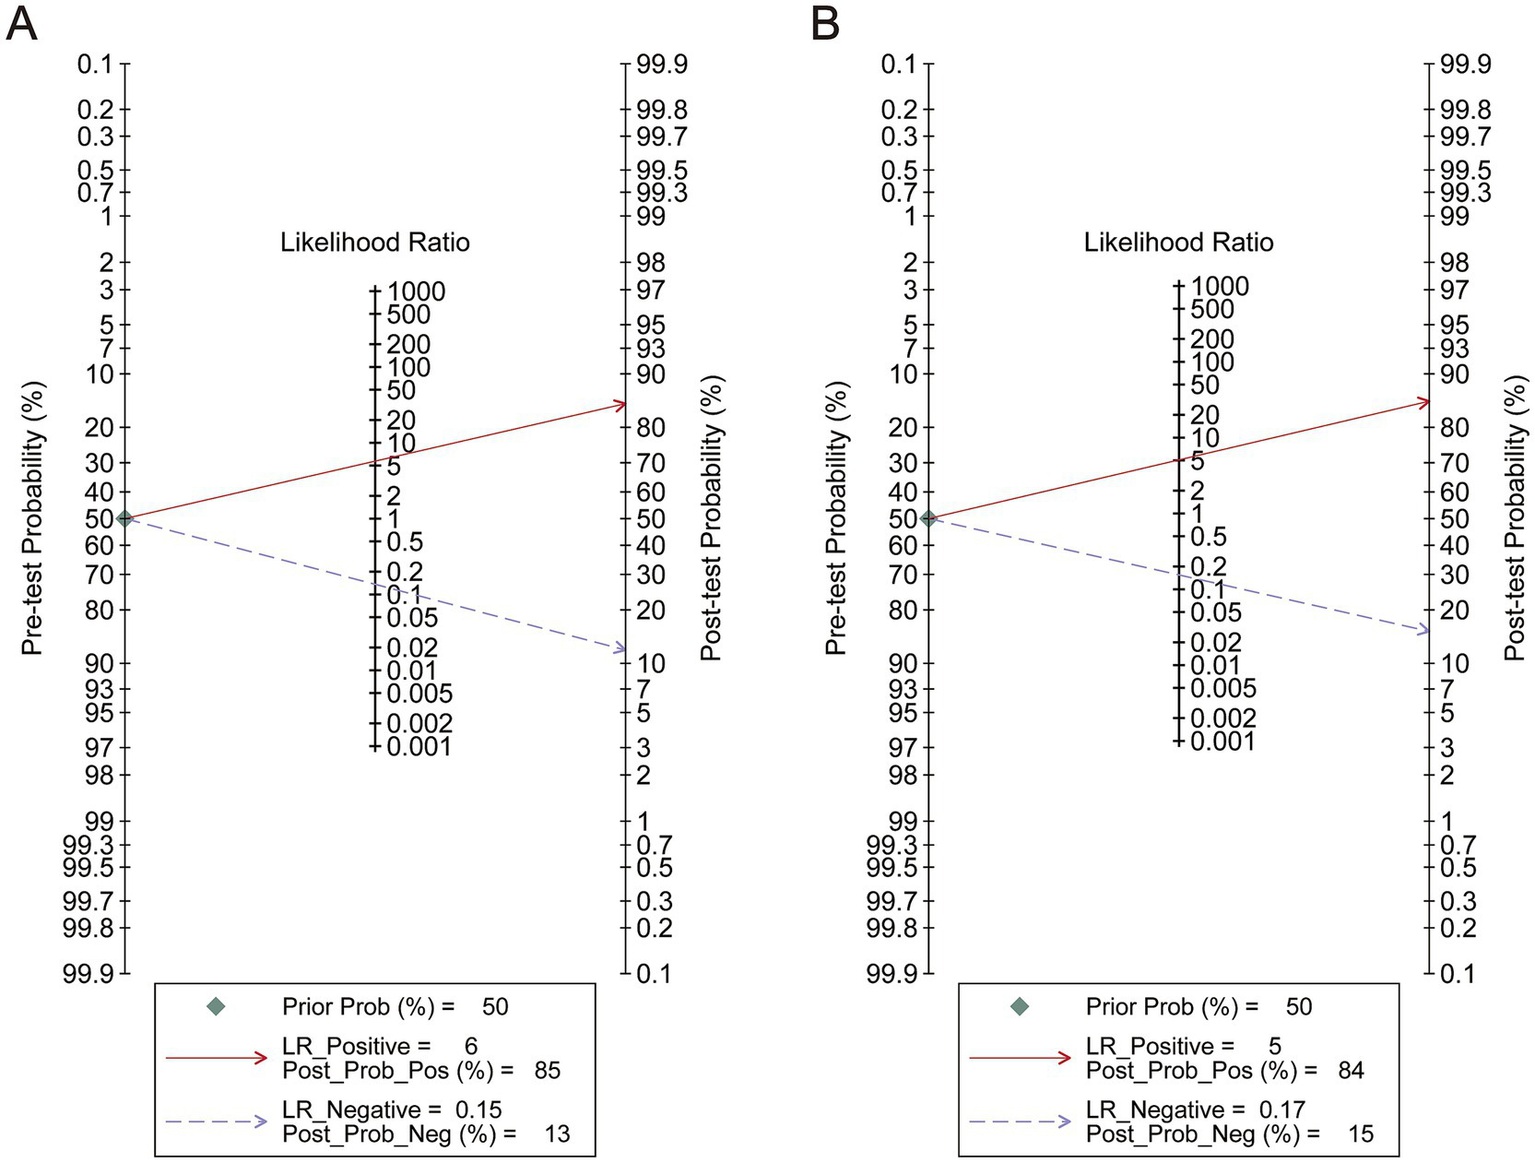
Analysis of pre-test probability. (A) The analysis of Mean Kurtosis. (B) The analysis of Mean Diffusivity.
Table 5
| DKI parameter | Characteristics | Coef. | Std. err. | t | p > |t| | 95% CI | |
|---|---|---|---|---|---|---|---|
| MK | Age | < −0.01 | 0.20 | −0.02 | 0.99 | −0.55 | 0.55 |
| Publish year | −0.18 | 0.24 | −0.65 | 0.55 | −0.83 | 0.52 | |
| The number of Patients | 0.001 | 0.05 | 0.02 | 0.98 | −0.13 | 0.13 | |
| LGG percent | 3.10 | 5.42 | 0.57 | 0.62 | −11.96 | 18.18 | |
| The number of b value | −0.02 | 0.15 | −0.10 | 0.93 | −0.44 | 0.41 | |
| Maximal b value | < −0.01 | < 0.01 | −0.65 | 0.55 | < −0.01 | < 0.01 | |
| Repetition time | 0 | 0 | 0.66 | 0.55 | < −0.01 | < 0.01 | |
| Echo time | −0.02 | 0.04 | −0.51 | 0.64 | −0.13 | 0.09 | |
| The number of (diffusion) directions | −0.04 | 0.04 | −1.07 | 0.36 | −0.15 | 0.08 | |
| Vendor A | 2.49 | 1.38 | 1.81 | 0.15 | −1.33 | 6.30 | |
| Vendor B | −1.14 | 0.81 | −1.41 | 0.23 | −3.40 | 1.11 | |
| Vendor C | −0.28 | 1.29 | −0.17 | 0.88 | −3.80 | 3.37 | |
| Vendor D | 0.92 | 1.32 | 0.70 | 0.52 | −2.75 | 4.60 | |
| MD | Age | −0.09 | 0.17 | −0.55 | 0.68 | −2.26 | 2.07 |
| Publish year | 0.15 | 0.24 | 0.60 | 0.66 | −2.96 | 3.25 | |
| The number of Patients | −0.03 | 0.04 | −0.70 | 0.61 | −0.49 | 0.44 | |
| LGG percent | −1.37 | 5.92 | −0.23 | 0.86 | −76.65 | 73.91 | |
| The number of b value | −0.22 | 0.29 | −0.76 | 0.59 | −3.94 | 3.50 | |
| Maximal b value | < −0.01 | < 0.01 | −0.76 | 0.59 | −0.02 | 0.02 | |
| Repetition time | 0 | 0 | −0.76 | 0.58 | < −0.01 | < 0.01 | |
| Echo time | < −0.01 | 0.01 | −0.48 | 0.72 | −0.15 | 0.14 | |
| The number of (diffusion) directions | −0.05 | 0.17 | −0.31 | 0.81 | −2.26 | 2.15 | |
| Vendor A | −0.67 | 0.88 | −0.76 | 0.59 | −11.83 | 10.49 | |
| Vendor B | − | − | − | − | − | − | |
| Vendor C | − | − | − | − | − | − | |
| Vendor D | 0.67 | 0.86 | 0.76 | 0.59 | −10.49 | 11.83 | |
Meta-regression analysis of diffusion kurtosis imaging prediction accuracy.
To avoid rater bias, MRI vendors were anonymized. For example, Vendor A was Biograph brand; Vendor B: Magnetom brand; Vendor C: Discovery brand; Vendor D: GE Signa brand. In the meta-regression analysis of MD, the Vendor B and C only was involved in the single included article. Thus, the influence of Vendor B and C could not be analyzed in the MD.
Figure 6
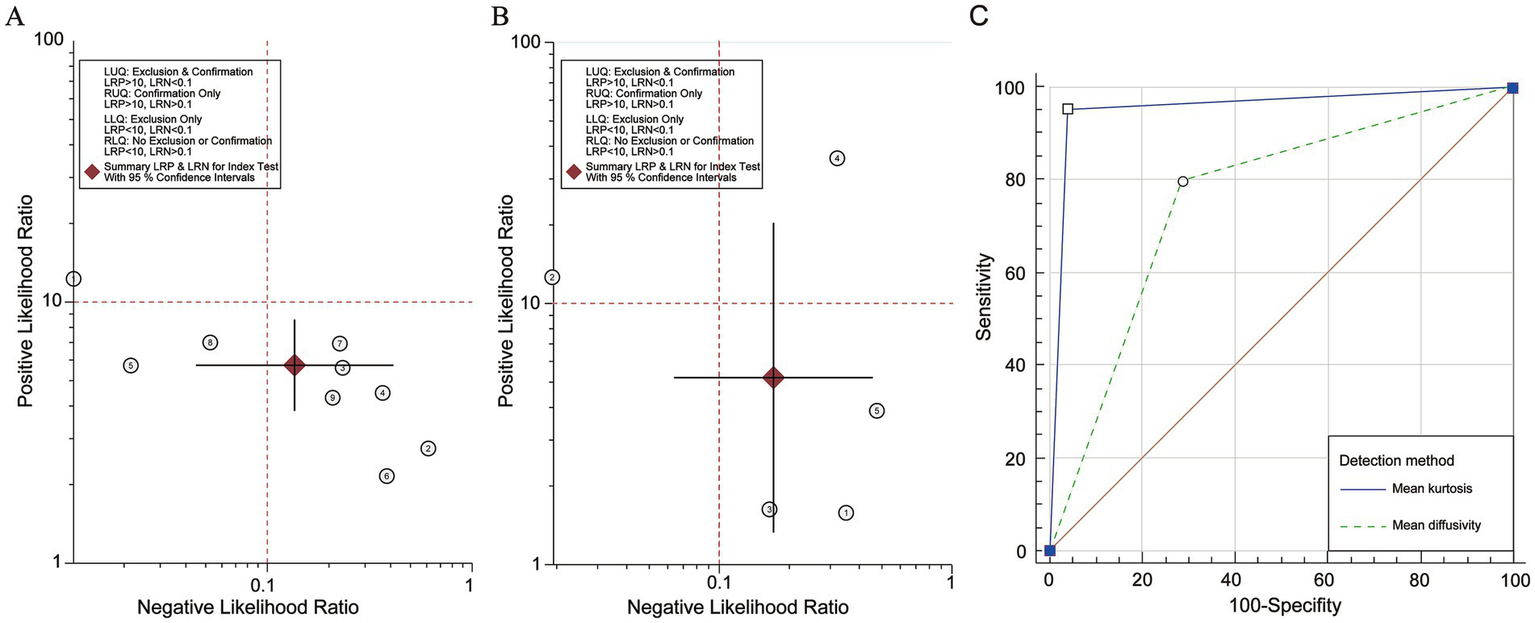
Likelihood ratio scatter gram and summarized Receiver Operating Characteristic analysis of Mean Kurtosis and Mean Diffusivity. (A) The likelihood ratio scatter gram of Mean Kurtosis. (B) The likelihood ratio scatter gram of Mean Diffusivity. (C) The re-calculation in MedCalc.
Discussion
The present meta-analysis included 14 clinical studies comprising 886 patients to evaluate the predictive value of DKI for the molecular classification of gliomas. Our findings indicated that MD and MK, as DKI parameters, could effectively distinguish specific molecular subtypes. Specifically, higher MK and lower MD values were associated with IDH status, underscoring the utility of these parameters for molecular prediction. The summarized sROC curve and meta-regression analyses, which accounted for relevant covariates, further confirmed the efficacy and stability of DKI parameters for predicting IDH status. Subgroup analyses provided insights into the sources of heterogeneity and the impact of imaging protocol adjustments. We found that TR, TE, maximal b-value, and diffusion-encoding direction played significant roles in reducing heterogeneity. A longer TR permits adequate longitudinal relaxation (T1) and signal recovery, thereby minimizing the influence of T1 effects on the diffusion parameters (46). A shorter TE reduces signal attenuation, yielding more stable measurements (47). Excessively low maximal b-values were found to improve signal quality, leading to more stable estimates of MK and MD (48). Although a lower diffusion direction could regulate heterogeneity, we considered a trade-off between heterogeneity, prediction value, and signal quality. Based on the I2 value and effect estimates from the subgroup analysis of heterogeneity, we inferred that, although a greater number of diffusion directions may lead to heterogeneity across different studies and patient populations, it also captured more complex and detailed information about water molecule movement. These enhanced data are valuable for predicting the genetic status of gliomas and for personalized medical treatment. Therefore, we recommend improving the quality of MRI images and reducing heterogeneity by adjusting scanning parameters, such as scan time, magnetic field intensity, and imaging sequence. The utility of DKI in predicting glioma molecular expression can be further improved by appropriately increasing the number of diffusion directions (49).
From a macroscopic physical structure perspective, as an imaging technique, DKI can detect diffusion information based on a non-Gaussian diffusion model and compute signal differences along several gradient directions to obtain a detailed signal that measures water diffusion (50). As critical parameters, MK and MD can capture and reflect different motion states of water molecules within diverse organizational structures. MK is typically associated with structural complexity and tends to increase when the diffusion pathways of water molecules become more intricate due to high cell density, cellular atypia, and alterations in the extracellular matrix. In contrast, the MD value reflects the degree of diffusion of all water molecules in each direction, indicating the diffusion ability of water molecules in tissues. A higher MD value represents an increase in the overall water molecule diffusion and a decrease in diffusion resistance (51–53). Furthermore, genetic status can influence tumor size, growth direction, texture, and blood supply, all of which can affect the diffusion of water molecules. These factors contribute to the predictive value of DKI parameters in determining molecular type.
From a genetic and microstructural perspective, previous studies have demonstrated that genetic expression status, particularly regarding IDH, can significantly influence cell metabolism and epigenetic changes (54, 55). For example, IDH-mutant gliomas are associated with the accumulation of metabolites, such as 2-hydroxyvalerate, which can elevate intracellular oxidative stress levels (56). IDH mutations inhibit histone demethylation and cell differentiation (57). However, wild-type IDH tumor tissue exhibited the opposite effect. These specific genetic statuses may influence the proliferative ability and the DKI characteristics of gliomas. Zhao et al. conducted further analyses and demonstrated that IDH wild-type gliomas exhibited high proliferative activity, which influenced tumor progression and MK and MD values in DKI. More specifically, the movement of water molecules in complex wild-type IDH tissues was hindered, leading to a lower diffusion coefficient and, consequently, a reduced MD value. Furthermore, the diffusion trajectory of water molecules was more irregular, causing a deviation from the Gaussian distribution and resulting in a higher MK value (26, 58, 59). These factors may explain why MK and MD can differentiate IDH conditions. However, DKI parameters appeared to be less effective in distinguishing specific genetic statuses, such as 1p/19q codeletion, MGMT, and ATRX. Based on the biological studies, we found that these genes did not significantly influence the diffusion characteristics of water molecules. For example, the mechanisms underlying 1p/19q codeletion and ATRX primarily regulate genomic stability and chromosomal structural changes (60). Additionally, the methylation status of MGMT mainly affects the sensitivity of patients with glioma to chemotherapeutic drugs (61). Thus, genetic alterations do not directly affect the tissue structure or diffusion characteristics of water molecules in tumors, leading to the conclusion that DKI may not accurately reflect the expression status of these genes within tumor structures.
Recent meta-analyses demonstrated that DKI can distinguish the LGG and HGG and provide valuable insights (Table 1). With advances in imaging technology, radiologists and clinicians want to identify whether the predictive utility of DKI in determining the molecular genetic status of gliomas is stable equally. Our analysis suggests that DKI and its parameters, particularly MK and MD, offer some utility in differentiating glioma molecular status. However, a model with stable accuracy has not yet been sufficiently tested. Therefore, we suggest that DKI should be of interest to researchers, and large-scale clinical trials and explorations should be conducted to compare it with other modes to identify which MRI mode yields more stable diagnostic utility. We believe that predictive capabilities will improve gradually in the future, paving the way for advances in the noninvasive molecular diagnosis of gliomas.
Compared with recent meta-analyses, our analysis further supported that DKI can predict the glioma molecular subtypes, especially IDH status. However, the present meta-analysis had some limitations. First, although we provided data supporting the utility of DKI parameters in predicting IDH status, the related-parameter(s) prediction thresholds remained unclear due to missing patient data and the insufficient sample size. Second, equally important genotyping, such as 1p/19q, ATRX, and MGMT, were not analyzed in this meta-analysis due to the absence of relevant information, which could not obtained despite attempts to contact the authors of the studies in question. As such, studies with larger populations are necessary to further investigate these parameters.
Conclusion
Our findings provide evidence supporting the predictive utility of DKI in glioma molecular classification, particularly regarding IDH status. We recommend that DKI and its associated parameters be explored in future clinical trials and compared with other modalities to identify more stable and valuable models. This will improve the accuracy and comprehensiveness of future diagnostic models.
Statements
Data availability statement
The original contributions presented in the study are included in the article/Supplementary material, further inquiries can be directed to the corresponding author.
Author contributions
HZ: Conceptualization, Data curation, Formal analysis, Investigation, Methodology, Writing – original draft. ZH: Supervision, Validation, Visualization, Writing – review & editing. QH: Formal analysis, Writing – original draft. XL: Investigation, Writing – original draft. JX: Conceptualization, Data curation, Formal analysis, Investigation, Methodology, Software, Supervision, Validation, Visualization, Writing – original draft, Writing – review & editing.
Funding
The author(s) declare that financial support was received for the research and/or publication of this article. This study was supported by the National Natural Science Foundation of China (82172028).
Conflict of interest
The authors declare that the research was conducted in the absence of any commercial or financial relationships that could be construed as a potential conflict of interest.
Generative AI statement
The author(s) declare that no Gen AI was used in the creation of this manuscript.
Publisher’s note
All claims expressed in this article are solely those of the authors and do not necessarily represent those of their affiliated organizations, or those of the publisher, the editors and the reviewers. Any product that may be evaluated in this article, or claim that may be made by its manufacturer, is not guaranteed or endorsed by the publisher.
Supplementary material
The Supplementary material for this article can be found online at: https://www.frontiersin.org/articles/10.3389/fneur.2025.1543619/full#supplementary-material
SUPPLEMENTARY FIGURE S1The quantification of Diffusion Kurtosis Imaging diagnostic effects. (A) The forest plots of diagnostic score, odds ratio in Mean Kurtosis. (B) The forest plots of diagnostic score, odds ratio in Mean Diffusivity. (C) The forest plots of positive diagnostic likelihood ratio and negative diagnostic likelihood ratio in Mean Kurtosis. (D) The forest plots of positive diagnostic likelihood ratio and negative diagnostic likelihood ratio in Mean Diffusivity.
Abbreviations
dMRI, diffusion magnetic resonance imaging; DKI, diffusion kurtosis imaging; QUADAS-2, Quality Assessment of Diagnostic Accuracy Studies 2; MK, mean kurtosis; MD, mean diffusivity; IDH, isocitrate dehydrogenase; CI, confidence interval; ATRX, α-thalassemia/mental retardation syndrome-X-linked; MGMT, O6-methylguanine-DNA-methyltransferase; DWI, diffusion-weighted imaging; DTI, diffusion tensor imaging; DKI, Diffusion kurtosis imaging; LGG, low-grade gliomas; HGG, high-grade gliomas; PRISMA, Preferred Reporting Items for Systematic Reviews and Meta-Analyses; QUADAS-2, Quality Assessment of Diagnostic Accuracy Studies-2; PLR, positive diagnostic likelihood ratio; NLR, negative diagnostic likelihood ratio; ROC, receiver operating characteristic.
Footnotes
1.^ https://www.stata-uk.com/software/stata
2.^ https://training.cochrane.org/online-learning/core-software
References
1.
Weller M Wen PY Chang SM Dirven L Lim M Monje M et al . Glioma. Nat Rev Dis Primers. (2024) 10:33. doi: 10.1038/s41572-024-00516-y
2.
Stumpo V Guida L Bellomo J van Niftrik CHB Sebök M Berhouma M et al . Hemodynamic imaging in cerebral diffuse glioma-part B: molecular correlates, treatment effect monitoring, prognosis, and future directions. Cancers. (2022) 14:1342. doi: 10.3390/cancers14051342
3.
Nicholson JG Fine HA . Diffuse glioma heterogeneity and its therapeutic implications. Cancer Discov. (2021) 11:575–90. doi: 10.1158/2159-8290.CD-20-1474
4.
Galbraith K Kumar A Abdullah KG Walker JM Adams SH Prior T et al . Molecular correlates of long survival in IDH-Wildtype glioblastoma cohorts. J Neuropathol Exp Neurol. (2020) 79:843–54. doi: 10.1093/jnen/nlaa059
5.
Iwadate Y Matsutani T Hara A Hirono S Ikegami S Kobayashi M et al . Eighty percent survival rate at 15 years for 1p/19q co-deleted oligodendroglioma treated with upfront chemotherapy irrespective of tumor grade. J Neuro Oncol. (2019) 141:205–11. doi: 10.1007/s11060-018-03027-5
6.
Sasaki H Kitamura Y Toda M Hirose Y Yoshida K . Oligodendroglioma, IDH-mutant and 1p/19q-codeleted-prognostic factors, standard of care and chemotherapy, and future perspectives with neoadjuvant strategy. Brain Tumor Pathol. (2024) 41:43–9. doi: 10.1007/s10014-024-00480-1
7.
Daristotle JL Zaki ST Lau LW Torres L Jr Zografos A Srinivasan P et al . Improving the adhesion, flexibility, and hemostatic efficacy of a sprayable polymer blend surgical sealant by incorporating silica particles. Acta Biomater. (2019) 90:205–16. doi: 10.1016/j.actbio.2019.04.015
8.
Blazejewska AI Fischl B Wald LL Polimeni JR . Intracortical smoothing of small-voxel fMRI data can provide increased detection power without spatial resolution losses compared to conventional large-voxel fMRI data. Neuroimage. (2019) 189:601–14. doi: 10.1016/j.neuroimage.2019.01.054
9.
Zhang HW Zhang HB Liu XL Deng HZ Zhang YZ Tang XM et al . Clinical assessment of magnetic resonance spectroscopy and diffusion-weighted imaging in diffuse glioma: insights into histological grading and IDH classification. Can Assoc Radiol J. (2024) 75:868–77. doi: 10.1177/08465371241238917
10.
Xiong J Tan WL Pan JW Wang Y Yin B Zhang J et al . Detecting isocitrate dehydrogenase gene mutations in oligodendroglial tumors using diffusion tensor imaging metrics and their correlations with proliferation and microvascular density. J Magn Reson Imaging. (2016) 43:45–54. doi: 10.1002/jmri.24958
11.
Kelm ND West KL Carson RP Gochberg DF Ess KC Does MD . Evaluation of diffusion kurtosis imaging in ex vivo hypomyelinated mouse brains. Neuroimage. (2016) 124:612–26. doi: 10.1016/j.neuroimage.2015.09.028
12.
Zhang F Breger A Cho KIK Ning L Westin CF O’Donnell LJ et al . Deep learning based segmentation of brain tissue from diffusion MRI. Neuroimage. (2021) 233:117934. doi: 10.1016/j.neuroimage.2021.117934
13.
Li Y Liu Y Liang Y Wei R Zhang W Yao W et al . Radiomics can differentiate high-grade glioma from brain metastasis: a systematic review and meta-analysis. Eur Radiol. (2022) 32:8039–51. doi: 10.1007/s00330-022-08828-x
14.
Yu Y Tan Y Xie C Hu Q Ouyang J Chen Y et al . Development and validation of a preoperative magnetic resonance imaging radiomics-based signature to predict axillary lymph node metastasis and disease-free survival in patients with early-stage breast cancer. JAMA Netw Open. (2020) 3:e2028086. doi: 10.1001/jamanetworkopen.2020.28086
15.
Nichelli L Cadin C Lazzari P Mathon B Touat M Sanson M et al . Incorporation of edited MRS into clinical practice may improve care of patients with IDH-mutant glioma. AJNR Am J Neuroradiol. (2025) 46:113–20. doi: 10.3174/ajnr.A8413
16.
Hou H Yu J Diao Y Xu M Li Z Song T et al . Diagnostic performance of multiparametric nonenhanced magnetic resonance imaging (MRI) in grading glioma and correlating IDH mutation status. Clin Radiol. (2025) 82:106791. doi: 10.1016/j.crad.2024.106791
17.
Li Z Luo Y Jiang H Meng N Huang Z Feng P et al . The value of diffusion kurtosis imaging, diffusion weighted imaging and 18F-FDG PET for differentiating benign and malignant solitary pulmonary lesions and predicting pathological grading. Front Oncol. (2022) 12:873669. doi: 10.3389/fonc.2022.873669
18.
Pang H Dang X Ren Y Yao Z Shen Y Feng X et al . DKI can distinguish high-grade gliomas from IDH1-mutant low-grade gliomas and correlate with their different nuclear-to-cytoplasm ratio: a localized biopsy-based study. Eur Radiol. (2024) 34:7539–51. doi: 10.1007/s00330-023-10325-8
19.
Huang R Chen Y Li W Zhang X . An evidence-based approach to assess the accuracy of diffusion kurtosis imaging in characterization of gliomas. Medicine. (2018) 97:e13068. doi: 10.1097/MD.0000000000013068
20.
Abdalla G Dixon L Sanverdi E Machado PM Kwong JSW Panovska-Griffiths J et al . The diagnostic role of diffusional kurtosis imaging in glioma grading and differentiation of gliomas from other intra-axial brain tumours: a systematic review with critical appraisal and meta-analysis. Neuroradiology. (2020) 62:791–802. doi: 10.1007/s00234-020-02425-9
21.
Falk Delgado A Nilsson M van Westen D Falk Delgado A . Glioma grade discrimination with MR diffusion kurtosis imaging: a meta-analysis of diagnostic accuracy. Radiology. (2018) 287:119–27. doi: 10.1148/radiol.2017171315
22.
Luan J Wu M Wang X Qiao L Guo G Zhang C . The diagnostic value of quantitative analysis of ASL, DSC-MRI and DKI in the grading of cerebral gliomas: a meta-analysis. Radiat Oncol. (2020) 15:204. doi: 10.1186/s13014-020-01643-y
23.
Xu C Li C Xing C Li J Jiang X . Efficacy of MR diffusion kurtosis imaging for differentiating low-grade from high-grade glioma before surgery: a systematic review and meta-analysis. Clin Neurol Neurosurg. (2022) 220:107373. doi: 10.1016/j.clineuro.2022.107373
24.
Su C Chen X Liu C Li S Jiang J Qin Y et al . T2-FLAIR, DWI and DKI radiomics satisfactorily predicts histological grade and Ki-67 proliferation index in gliomas. Am J Transl Res. (2021) 13:9182–94. PMID:
25.
Xu Z Ke C Liu J Xu S Han L Yang Y et al . Diagnostic performance between MR amide proton transfer (APT) and diffusion kurtosis imaging (DKI) in glioma grading and IDH mutation status prediction at 3 T. Eur J Radiol. (2021) 134:109466. doi: 10.1016/j.ejrad.2020.109466
26.
Zhao J Wang YL Li XB Hu MS Li ZH Song YK et al . Comparative analysis of the diffusion kurtosis imaging and diffusion tensor imaging in grading gliomas, predicting tumour cell proliferation and IDH-1 gene mutation status. J Neuro Oncol. (2019) 141:195–203. doi: 10.1007/s11060-018-03025-7
27.
Viallon M Cuvinciuc V Delattre B Merlini L Barnaure-Nachbar I Toso-Patel S et al . State-of-the-art MRI techniques in neuroradiology: principles, pitfalls, and clinical applications. Neuroradiology. (2015) 57:1075. doi: 10.1007/s00234-015-1548-y
28.
Sullivan SR Monahan MF Mitchell EL Spears AP Walsh S Szeszko JR et al . Group treatments for individuals at risk for suicide: a PRISMA scoping review (ScR). Psychiatry Res. (2021) 304:114108. doi: 10.1016/j.psychres.2021.114108
29.
Lee J Mulder F Leeflang M Wolff R Whiting P Bossuyt PM . QUAPAS: an adaptation of the QUADAS-2 tool to assess prognostic accuracy studies. Ann Intern Med. (2022) 175:1010–8. doi: 10.7326/M22-0276
30.
Higgins JPT Thomas J Chandler J Cumpston M Li T Page MJ et al . Cochrane handbook for systematic reviews of interventions. 2nd ed. Chichester (UK): John Wiley & Sons (2019).
31.
Schoonjans F Zalata A Depuydt CE Comhaire FH . Med Calc: a new computer program for medical statistics. Comput Methods Prog Biomed. (1995) 48:257–62. doi: 10.1016/0169-2607(95)01703-8
32.
DeLong ER DeLong DM Clarke-Pearson DL . Comparing the areas under two or more correlated receiver operating characteristic curves: a nonparametric approach. Biometrics. (1988) 44:837–45. doi: 10.2307/2531595
33.
Hanley JA McNeil BJ . The meaning and use of the area under a receiver operating characteristic (ROC) curve. Radiology. (1982) 143:29–36. doi: 10.1148/radiology.143.1.7063747
34.
Hempel JM Bisdas S Schittenhelm J Brendle C Bender B Wassmann H et al . In vivo molecular profiling of human glioma using diffusion kurtosis imaging. J Neuro Oncol. (2017) 131:103. doi: 10.1007/s11060-016-2281-z
35.
Hempel JM Schittenhelm J Brendle C Bender B Bier G Skardelly M et al . Histogram analysis of diffusion kurtosis imaging estimates for in vivo assessment of 2016 WHO glioma grades: a cross-sectional observational study. Eur J Radiol. (2017) 95:202–11. doi: 10.1016/j.ejrad.2017.08.008
36.
Hempel JM Schittenhelm J Bisdas S Brendle C Bender B Bier G et al . In vivo assessment of tumor heterogeneity in WHO 2016 glioma grades using diffusion kurtosis imaging: diagnostic performance and improvement of feasibility in routine clinical practice. J Neuroradiol. (2018) 45:32–40. doi: 10.1016/j.neurad.2017.07.005
37.
Tan Y Zhang H Wang X Qin J Wang L Yang G et al . Comparing the value of DKI and DTI in detecting isocitrate dehydrogenase genotype of astrocytomas. Clin Radiol. (2019) 74:314–20. doi: 10.1016/j.crad.2018.12.004
38.
Tan Y Mu W Wang XC Yang GQ Gillies RJ Zhang H . Whole-tumor radiomics analysis of DKI and DTI may improve the prediction of genotypes for astrocytomas: a preliminary study. Eur J Radiol. (2020) 124:108785. doi: 10.1016/j.ejrad.2019.108785
39.
Wang X Li F Wang D Zeng Q . Diffusion kurtosis imaging combined with molecular markers as a comprehensive approach to predict overall survival in patients with gliomas. Eur J Radiol. (2020) 128:108985. doi: 10.1016/j.ejrad.2020.108985
40.
Xie Y Li S Shen N Gan T Zhang S Liu WV et al . Assessment of Isocitrate dehydrogenase 1 genotype and cell proliferation in gliomas using multiple diffusion magnetic resonance imaging. Front Neurosci. (2021) 15:783361. doi: 10.3389/fnins.2021.783361
41.
Guo H Liu J Hu J Zhang HT Zhao W Gao M et al . Diagnostic performance of gliomas grading and IDH status decoding a comparison between 3D amide proton transfer APT and four diffusion-weighted MRI models. J Magn Reson Imaging. (2022) 56:1834–44. doi: 10.1002/jmri.28211
42.
Wang P He J Ma X Weng L Wu Q Zhao P et al . Applying MAP-MRI to identify the WHO grade and Main genetic features of adult-type diffuse gliomas: a comparison of three diffusion-weighted MRI models. Acad Radiol. (2023) 30:1238–46. doi: 10.1016/j.acra.2022.10.009
43.
Qiu J Zhu M Chen CY Luo Y Wen J . Diffusion heterogeneity and vascular perfusion in tumor and peritumoral areas for prediction of overall survival in patients with high-grade glioma. Magn Reson Imaging. (2023) 104:23–8. doi: 10.1016/j.mri.2023.09.004
44.
Zhu H Xie Y Li L Liu Y Li S Shen N et al . Diffusion along the perivascular space as a potential biomarker for glioma grading and isocitrate dehydrogenase 1 mutation status prediction. Quant Imaging Med Surg. (2023) 13:8259–73. doi: 10.21037/qims-23-541
45.
Zeng S Ma H Xie D Huang Y Yang J Lin F et al . Tumor multiregional mean apparent propagator (MAP) features in evaluating gliomas-a comparative study with diffusion kurtosis imaging (DKI). J Magn Reson Imaging. (2024) 60:1532–46. doi: 10.1002/jmri.29202
46.
Jespersen SN Olesen JL Hansen B Shemesh N . Diffusion time dependence of microstructural parameters in fixed spinal cord. Neuroimage. (2018) 182:329–42. doi: 10.1016/j.neuroimage.2017.08.039
47.
Jones DK . Precision and accuracy in diffusion tensor magnetic resonance imaging. Top Magn Reson Imaging. (2010) 21:87–99. doi: 10.1097/RMR.0b013e31821e56ac
48.
Zhang F Ning L O'Donnell LJ Pasternak O . MK-curve - characterizing the relation between mean kurtosis and alterations in the diffusion MRI signal. Neuroimage. (2019) 196:68–80. doi: 10.1016/j.neuroimage.2019.04.015
49.
Mekkaoui C Reese TG Jackowski MP Cauley SF Setsompop K Bhat H et al . Diffusion tractography of the entire left ventricle by using free-breathing accelerated simultaneous multisection imaging. Radiology. (2017) 282:850–6. doi: 10.1148/radiol.2016152613
50.
Rosenkrantz AB Padhani AR Chenevert TL Koh DM de Keyzer F Taouli B et al . Body diffusion kurtosis imaging: basic principles, applications, and considerations for clinical practice. J Magn Reson Imaging. (2015) 42:1190–202. doi: 10.1002/jmri.24985
51.
Van Cauter S Veraart J Sijbers J Peeters RR Himmelreich U De Keyzer F et al . Gliomas: diffusion kurtosis MR imaging in grading. Radiology. (2012) 263:492–501. doi: 10.1148/radiol.12110927
52.
Lu H Jensen JH Ramani A Helpern JA . Three-dimensional characterization of non-gaussian water diffusion in humans using diffusion kurtosis imaging. NMR Biomed. (2006) 19:236–47. doi: 10.1002/nbm.1020
53.
Beppu T Inoue T Shibata Y Kurose A Arai H Ogasawara K et al . Measurement of fractional anisotropy using diffusion tensor MRI in supratentorial astrocytic tumors. J Neuro Oncol. (2003) 63:109–16. doi: 10.1023/A:1023977520909
54.
Muller Bark J Karpe AV Doecke JD Leo P Jeffree RL Chua B et al . A pilot study: metabolic profiling of plasma and saliva samples from newly diagnosed glioblastoma patients. Cancer Med. (2023) 12:11427–37. doi: 10.1002/cam4.5857
55.
Chang LC Chiang SK Chen SE Hung MC . Targeting 2-oxoglutarate dehydrogenase for cancer treatment. Am J Cancer Res. (2022) 12:1436–55. PMID:
56.
Fack F Tardito S Hochart G Oudin A Zheng L Fritah S et al . Altered metabolic landscape in IDH-mutant gliomas affects phospholipid, energy, and oxidative stress pathways. EMBO Mol Med. (2017) 9:1681–95. doi: 10.15252/emmm.201707729
57.
Stadlbauer A Kinfe TM Eyüpoglu I Zimmermann M Kitzwögerer M Podar K et al . Tissue hypoxia and alterations in microvascular architecture predict glioblastoma recurrence in humans. Clin Cancer Res. (2021) 27:1641–9. doi: 10.1158/1078-0432.CCR-20-3580
58.
Alexander AL Lee JE Lazar M Field AS . Diffusion tensor imaging of the brain. Neurotherapeutics. (2007) 4:316–29. doi: 10.1016/j.nurt.2007.05.011
59.
Salat DH . Diffusion tensor imaging in the study of aging and age-associated neural disease In: Johansen-BergHBehrensTEJ, editors. Diffusion MRI: From quantitative measurement to in vivo neuroanatomy. 2nd ed. San Diego, CA: Elsevier (2014). 257–81.
60.
Koschmann C Calinescu AA Nunez FJ Mackay A Fazal-Salom J Thomas D et al . ATRX loss promotes tumor growth and impairs nonhomologous end joining DNA repair in glioma. Sci Transl Med. (2016) 8:328ra28. doi: 10.1126/scitranslmed.aac8228
61.
Zhang H Wang Y Zhao Y Liu T Wang Z Zhang N et al . PTX3 mediates the infiltration, migration, and inflammation-resolving-polarization of macrophages in glioblastoma. CNS Neurosci Ther. (2022) 28:1748–66. doi: 10.1111/cns.13913
Summary
Keywords
glioma genotype, molecular diagnosis, DKI, diagnostic accuracy, meta-analysis
Citation
Zhao H, Hou Z, He Q, Liu X and Xie J (2025) The diagnostic and prediction performance of MR diffusion kurtosis imaging in the glioma molecular classification: a systematic review and meta-analysis. Front. Neurol. 16:1543619. doi: 10.3389/fneur.2025.1543619
Received
11 December 2024
Accepted
07 April 2025
Published
25 April 2025
Volume
16 - 2025
Edited by
Kyle Carson Kern, University of California, Los Angeles, United States
Reviewed by
Claudia Testa, University of Bologna, Italy
Adil Bashir, Auburn University, United States
Updates
Copyright
© 2025 Zhao, Hou, He, Liu and Xie.
This is an open-access article distributed under the terms of the Creative Commons Attribution License (CC BY). The use, distribution or reproduction in other forums is permitted, provided the original author(s) and the copyright owner(s) are credited and that the original publication in this journal is cited, in accordance with accepted academic practice. No use, distribution or reproduction is permitted which does not comply with these terms.
*Correspondence: Jian Xie, xiejian0630@126.com
Disclaimer
All claims expressed in this article are solely those of the authors and do not necessarily represent those of their affiliated organizations, or those of the publisher, the editors and the reviewers. Any product that may be evaluated in this article or claim that may be made by its manufacturer is not guaranteed or endorsed by the publisher.