Abstract
Background:
The glucose-to-potassium ratio has shown promise as a biomarker in neurological disorders, but its prognostic value in acute ischemic stroke (AIS) after intravenous thrombolysis (IVT) continues to be uncertain. The study explores the relationship between admission GPR and 90-day functional outcomes in AIS patients undergoing IVT treatment.
Methods:
A retrospective analysis included 649 AIS patients undergoing IVT between May 2016 and December 2023. Baseline clinical, laboratory, and imaging data were analyzed. GPR was calculated from serum glucose and potassium levels at admission. A modified Rankin Scale score of 3 to 6 at 90 days was used to define poor functional outcomes. Logistic regression and restricted cubic splines assessed the GPR-outcome relationship, adjusting for confounders. Receiver operating characteristic (ROC) analysis evaluated GPR’s predictive value.
Results:
Among 649 patients, 174 (26.8%) had poor outcomes. Median GPR was significantly higher in these patients (2.14 vs. 1.88, p < 0.001). Higher GPR independently predicted negative consequences (OR, 1.821; 95% CI, 1.340–2.473, p < 0.001). Subgroup analysis indicated a stronger association in non-diabetic patients. ROC analysis demonstrated an area under the curve (AUC) of 0.631 (95% CI, 0.585–0.677, p < 0.001) for GPR in predicting poor functional outcomes.
Conclusion:
High GPR levels are independently linked to unfavorable 90-day functional outcomes in AIS patients who received IVT, suggesting its potential as a prognostic biomarker. Further studies are warranted to validate these findings.
Introduction
Ischemic stroke has become the second most common cause of death and the third largest factor in global disability. Among those who survive cerebrovascular disease, over 70% experience varying degrees of work-related impairment, contributing to a growing global socioeconomic burden (1–3). Statistical data indicate that approximately 2 million individuals in China are affected annually, with around 8 million individuals currently living with the condition (4). The advent of intravenous thrombolysis (IVT) has revolutionized the treatment of acute ischemic stroke (AIS), yet the functional outcomes of patients undergoing this therapy remain highly variable. Identifying reliable predictors of prognosis following IVT is crucial for guiding treatment decisions and optimizing outcomes (5).
Serum biomarkers have emerged as important tools in predicting stroke outcomes, as they reflect underlying pathophysiological processes. Among these, glucose and potassium are critical components of cellular metabolism and ionic homeostasis, respectively. Hyperglycemia has long been associated with poor outcomes in AIS, possibly due to increased oxidative stress, inflammation, and blood–brain barrier disruption (6, 7). Similarly, hypokalemia may exacerbate neuronal injury through ionic imbalances and impaired cellular repair mechanisms (8).
As a novel biomarker, the glucose to potassium ratio (GPR) has been proposed, incorporating the prognostic aspects of both glucose and potassium levels. Prior investigations have revealed that elevated GPR correlates with adverse results in various neurological diseases, including traumatic brain injury, intracranial hemorrhage, and ischemic stroke treated with endovascular thrombectomy (5, 6). However, its role in predicting functional outcomes after IVT in AIS has not been determined. Consequently, this investigation focused on examining how GPR correlates with functional outcomes at the 90-day mark following IVT through a retrospective study.
Methods and materials
Study participants and design
This study is a retrospective analysis involving patients with acute ischemic stroke who underwent IVT at Yangpu Hospital of Tongji University School of Medicine, between May 2016 and December 2023. The inclusion of patients was determined by the following criteria: (1) 18 years old or above; (2) confirmation of cerebral infarction via imaging; and (3) availability of data necessary for the calculation of the GPR. To ensure consistency among study participants, we excluded patients who were treated with a combination of intravenous alteplase and endovascular thrombectomy (bridging therapy), those with renal failure, those with an estimated glomerular filtration rate (eGFR) of less than 60 mL/min/1.73 m2, those undergoing hemodialysis or peritoneal dialysis, and those lacking complete medical history, imaging reports, laboratory results, and National Institutes of Health Stroke Scale (NIHSS) scores. The Heidelberg Bleeding Classification was used to diagnose symptomatic intracerebral hemorrhage (sICH) within 24 h of IVT (9). The study received approval (LL-2021-LW-003, February 22, 2021) from the ethics committee at Yangpu Hospital of Tongji University School of Medicine. Patient information was kept confidential at Yangpu Hospital of Tongji University School of Medicine. The clinical studies were carried out in accordance with the guidelines of the Declaration of Helsinki.
Baseline variable assessment
Patient records, encompassing admission data, were retrospectively analyzed to evaluate demographics, vascular risk factors, imaging, and laboratory data. A certified neurologist employed the NIHSS to assess baseline neurological deficits (10). Patient outcomes were gathered during clinic visits or telephone interviews conducted 3 months post-event. The main result was identified as poor functional status, indicated by a modified Rankin Scale (mRS) score between 3 and 6. Blood samples were taken from every patient prior to reperfusion therapy, and the GPR was computed by dividing the glucose concentration by the potassium concentration (11).
Statistical analysis
Depending on the normality of their distribution, quantitative variables were expressed as mean ± standard deviation (SD) or median with interquartile range (IQR), whereas categorical variables were presented as frequencies and percentages. Continuous variables were analyzed using t-tests or Mann–Whitney U tests, while categorical variables were assessed with chi-square tests or Fisher’s exact tests. The 90-day adverse outcome odds ratio (OR) and 95% confidence interval (CI) for each unit rise in GPR and its quartiles were analyzed using logistic regression models. Adjustments were made to the crude model for variables that had a p-value below 0.05 in the univariate analysis, including age, sex, diabetes, smoking, history of stroke or transient ischemic attack (TIA), atrial fibrillation, sICH, baseline NIHSS score, proportion of mRS scores of 0–2 upon admission, blood pressure of systolic, C-reactive protein (CRP), hemoglobin (HB), platelet count (PLT), red blood cell count (RBC), glycated hemoglobin (HBA1c) and cholesterol associated with high-density lipoproteins (HDL-C), excluding glucose and potassium due to collinearity concerns. Model 1 was further adjusted for the crude model variables and additional factors such as hypertension, coronary artery disease, onset-to-needle time (ONT), blood pressure of diastolic, white blood cell count (WBC), creatinine (CRE), total cholesterol (TC), triglycerides (TG), cholesterol associated with low-density lipoprotein (LDL-C) and homocysteine (Hcy). Model 2 retained all the variables from Model 1, excluding the proportion of mRS 0–2 scores, and replaced it with baseline mRS as a continuous variable. Furthermore, to investigate the association between the GPR and prognosis in specific populations, we conducted a subgroup analysis based on identified risk factors, including gender, age, NIHSS score, history of stroke or transient ischemic attack, diabetes, atrial fibrillation, hypertension, and coronary artery disease. To determine the predictive value of GPR for a poor functional outcome at 90 days, receiver operating curve (ROC) analysis was utilized. Ultimately, to examine the dose–response relationship between the GPR and clinical functional outcome, restricted cubic splines (RCS) were applied, using three knots at the 10th, 50th, and 90th percentiles, while adjusting for covariates in model 2 (12).
Data processing and analysis were performed using R version 4.4.0 (2024-04-24), along with Zstats 1.0.1 Statistical significance was determined by a two-sided p-value below 0.05.
Results
Basic features
Throughout the study, 764 patients with acute ischemic stroke were treated with IVT. Of these patients, 46 underwent bridging therapy, 40 did not have imaging confirmation of infarction, 21 presented with renal failure, 6 had incomplete laboratory data, and 2 were not followed up on. These cases were subsequently excluded from the analysis (Figure 1). Consequently, data from 649 patients were included and analyzed. The enrolled subjects’ demographic details, laboratory information, and clinical characteristics are compiled in Table 1. Participants in the cohort had a median age of 71, with an interquartile range of 62 to 84 years, and consisted of 410 men. The initial median NIHSS score was 4, with an interquartile range of 2 to 8. Based on the Heidelberg Bleeding Classification, 17 patients (2.6%) were diagnosed with sICH. The median GPR levels among enrolled patients were 1.93 (IQR:1.58–2.47).
Figure 1

Research flow chart.
Table 1
| Variables | Total population (n = 649) | Results after 90 days | p-value | |
|---|---|---|---|---|
| Favorable prognosis (mRS ≤ 2, n = 475) | Unfavorable prognosis (mRS > 3, n = 174) | |||
| Age (years), median (IQR) | 71 (62 ~ 84) | 68 (61 ~ 80) | 82 (70 ~ 88) | <0.001 |
| Male, n (%) | 410 (63.2) | 323 (68.0) | 87 (50.0) | <0.001 |
| Risk factors, n (%) | ||||
| Smoking | 285 (43.9) | 230 (48.4) | 55 (31.6) | <0.001 |
| Diabetes | 239 (36.8) | 162 (34.1) | 77 (44.3) | 0.018 |
| Stroke/TIA | 148 (22.8) | 94 (19.8) | 54 (31.0) | 0.002 |
| Hypertension | 471 (72.6) | 340 (71.6) | 131 (75.3) | 0.348 |
| Coronary artery disease | 120 (18.5) | 80 (16.8) | 40 (23.0) | 0.074 |
| Atrial fibrillation | 117 (18.0) | 61 (12.8) | 56 (32.2) | <0.001 |
| Clinical data | ||||
| Time from onset-to-needle (min), median (IQR) | 131 (125 ~ 137.5) | 131 (122 ~ 135) | 131 (131 ~ 142) | 0.083 |
| sICH, n (%) | 17 (2.6) | 6 (1.3) | 11 (6.3) | <0.001 |
| Systolic blood pressure (mmHg), median (IQR) | 157 (142 ~ 173) | 155 (141 ~ 171) | 161 (144 ~ 183) | 0.007 |
| Diastolic blood pressure (mmHg), median (IQR) | 86 (78 ~ 97) | 86 (78 ~ 97) | 86 (76 ~ 97) | 0.624 |
| NIHSS on admission, median (IQR) | 4 (2 ~ 8) | 4 (2 ~ 6) | 9 (5 ~ 16) | <0.001 |
| mRS 0–2 on admission, n (%) | 637 (98.2) | 475 (100.0) | 162 (93.1) | <0.001 |
| All-cause mortality at 90 days, n (%) | 38 (5.8) | 0 (0.0) | 38 (21.8) | <0.001 |
| Laboratory parameters, median (IQR) | ||||
| CRP, mg/L | 5.00 (3.05 ~ 5.06) | 5.00 (3.00 ~ 6.23) | 5.00 (4.00 ~ 8.35) | 0.007 |
| WBC, 109/L | 7.10 (5.90 ~ 8.50) | 7.10 (5.85 ~ 8.50) | 7.30 (5.90 ~ 8.50) | 0.976 |
| RBC, 1012/L | 4.60 (4.24 ~ 4.98) | 4.63 (4.28 ~ 5.01) | 4.52 (4.06 ~ 4.87) | 0.002 |
| PLT, 109/L | 206.00 (171.00 ~ 245.00) | 212.00 (173.00 ~ 247.00) | 195.50 (163.75 ~ 230.00) | 0.013 |
| HB, g/L | 141.00 (129.00 ~ 152.00) | 142.00 (131.00 ~ 153.00) | 137.00 (121.00 ~ 149.00) | <0.001 |
| HBA1c, % | 6.00 (5.70 ~ 6.60) | 6.00 (5.70 ~ 6.50) | 6.25 (5.80 ~ 7.40) | <0.001 |
| Glucose, mmol/L | 7.25 (6.17 ~ 9.27) | 7.05 (6.06 ~ 8.79) | 7.88 (6.64 ~ 10.01) | <0.001 |
| Potassium, mmol/L | 3.87 (3.57 ~ 4.16) | 3.88 (3.59 ~ 4.17) | 3.77 (3.53 ~ 4.08) | 0.031 |
| GPR | 1.93 (1.58 ~ 2.47) | 1.88 (1.52 ~ 2.37) | 2.14 (1.77 ~ 2.79) | <0.001 |
| TG, mmol/L | 1.18 (0.87 ~ 1.64) | 1.24 (0.88 ~ 1.66) | 1.13 (0.80 ~ 1.54) | 0.056 |
| TC, mmol/L | 4.56 (3.83 ~ 5.37) | 4.67 (3.83 ~ 5.39) | 4.47 (3.78 ~ 5.27) | 0.123 |
| HDL-C, mmol/L | 1.12 (0.95 ~ 1.33) | 1.15 (0.96 ~ 1.34) | 1.07 (0.90 ~ 1.27) | 0.011 |
| LDL-C, mmol/L | 2.91 (2.36 ~ 3.46) | 2.96 (2.39 ~ 3.49) | 2.87 (2.33 ~ 3.40) | 0.309 |
| CRE, mmol/L | 78.00 (65.00 ~ 95.00) | 77.00 (65.00 ~ 95.00) | 82.50 (67.00 ~ 93.25) | 0.349 |
| Hcy, mmol/L | 14.82 (11.21 ~ 20.41) | 14.94 (11.00 ~ 20.00) | 15.45 (12.69 ~ 21.84) | 0.071 |
Baseline information for patients experiencing both good and bad functional prognoses at 90 days.
TIA, transient ischemic attack; sICH, symptomatic intracerebral hemorrhage; NIHSS, National Institutes of Health stroke scale; CRP, C-reactive protein; WBC, white blood cell count; RBC, red blood cell count; PLT, platelet count; HB, hemoglobin; HBA1c, glycated hemoglobin; GPR, glucose-to-potassium ratio; TG, triglycerides; TC, total cholesterol; HDL-C, cholesterol associated with high-density lipoproteins; LDL-C, cholesterol associated with low-density lipoprotein; CRE, creatinine; Hcy, homocysteine.
Correlation between GPR and functional outcomes
In the 90-day follow-up period, 174 patients (26.8%) had negative functional outcomes. Univariate analysis indicated that patients with unfavorable functional outcomes were significantly older than those without (median age: 82 years versus 68 years; p < 0.001). Patients with negative functional outcomes had significantly higher rates of diabetes (34.1% compared to 22.1%; p = 0.018), stroke or TIA (31.0% compared to 19.8%; p = 0.002), and atrial fibrillation (32.2% compared to 12.8%; p < 0.001). Additionally, patients with negative functional outcomes also had elevated initial NIHSS scores (median: 9 versus 4; p < 0.001), systolic blood pressure (median: 161 mmHg versus 155mHg; p = 0.006), HbA1c (median: 6.25% versus 6.00%; p < 0.001), CRP levels (median: 5.00 mg/L versus 5.00 mg/L; p = 0.007), and GPR (median: 2.14 versus 1.88; p < 0.001). They also had a higher incidence of sICH (6.3% versus 1.3%; p < 0.001) and all-cause mortality (21.8% versus 0%; p < 0.001). Conversely, they had lower proportions of smokers (31.6% versus 48.4%; p < 0.001), baseline mRS scores of 0–2 (100.0% versus 93.1%; p < 0.001), and male patients (50.0% versus 68.0%; p < 0.001). Furthermore, they showed lower levels of RBC (median: 4.52 versus 4.63; p = 0.002), PLT (median: 195.5 versus 212.00; p = 0.013), HB (median: 137.00 versus 142.00; p < 0.001), and HDL-c (median: 1.07 versus 1.15; p = 0.011; Table 1).
After accounting for possible confounding factors in multivariate logistic analysis, an increased GPR was notably linked to a greater likelihood of a negative functional outcome after 90 days (OR, 1.821; 95% CI, 1.340–2.473, p < 0.001). The detailed results of univariate and multivariate logistic regression analyses for the evaluation of functional prognostic factors are provided in Supplementary Table S1. Analyzing GPR in categorical terms yielded similar findings (Table 2). Simultaneously, utilizing model 2, to depict the findings of the subgroup multivariate logistic regression analysis, we developed a forest plot. The findings indicate that GPR exerts a more pronounced influence on the outcomes of non-diabetic patients in comparison to those with diabetes (Figure 2). Then, the results of the ROC analysis indicated that, across all patients, for predicting a poor functional prognosis at 90 days, the AUC of the GPR was 0.631 (95% CI, 0.585–0.677, p < 0.001). A cutoff value of 1.745 was identified as optimal, showing a sensitivity of 41.7% and a specificity of 78.2% (Figure 3). Additionally, the RCS analysis showed that GPR is positively linearly associated with unfavorable functional outcomes after 90 days (p = 0.207 for no linearity; p < 0.001 for overall; Figure 4).
Table 2
| Univariate regression | Crude model | Model 1 | Model 2 | |||||
|---|---|---|---|---|---|---|---|---|
| OR (95% CI) | p-value | OR (95% CI) | p-value | OR (95% CI) | p-value | OR (95% CI) | p-value | |
| GPR levels | 1.806 (1.415–2.305) | <0.001 | 1.748 (1.300–2.352) | <0.001 | 1.951 (1.436–2.650) | <0.001 | 1.821 (1.340–2.473) | <0.001 |
| GPR level quartiles | ||||||||
| 1st | Reference | / | Reference | / | Reference | / | Reference | / |
| 2nd | 3.286 (1.832–5.894) | <0.001 | 2.082 (1.053–4.118) | 0.035 | 1.980 (0.997–3.932) | 0.051 | 2.235 (1.123–4.449) | 0.022 |
| 3rd | 3.097 (1.723–5.568) | <0.001 | 2.263 (1.153–4.441) | 0.018 | 2.421 (1.229–4.769) | 0.011 | 2.450 (1.236–4.858) | 0.010 |
| 4th | 4.341 (2.442–7.719) | <0.001 | 2.543 (1.245–5.196) | 0.010 | 2.898 (1.416–5.934) | 0.004 | 2.853 (1.378–5.906) | 0.005 |
Univariate and multivariate logistic regression analysis for the relationship between GPR levels and 90-day poor functional outcome.
Quartiles of GPR level: 1st GPR <1.582; 2nd GPR = 1.582 ~ 1.925; 3rd GPR = 1.925 ~ 2.471; 4th GPR ≥2.471.
Crude model: variables with a p-value below 0.05 in the univariate analysis of baseline information, including age, sex, history of stroke or TIA, atrial fibrillation and diabetes, smoking, sICH, baseline NIHSS, proportion of mRS 0–2 on admission, blood pressure of systolic, CRP, HB, PLT, RBC, HBA1c, and HDL-C, excluding 90-day all-cause mortality as well as glucose and potassium due to collinearity concerns.
Model 1: adjusted for the crude model variables and additional factors such as hypertension, coronary artery disease, ONT, diastolic blood pressure, WBC, CRE, TC, TG, LDL-C, and Hcy.
Model 2: retained all the variables from Model 1, excluding the proportion of mRS 0–2 scores, and replaced it with baseline mRS as a continuous variable.
Figure 2
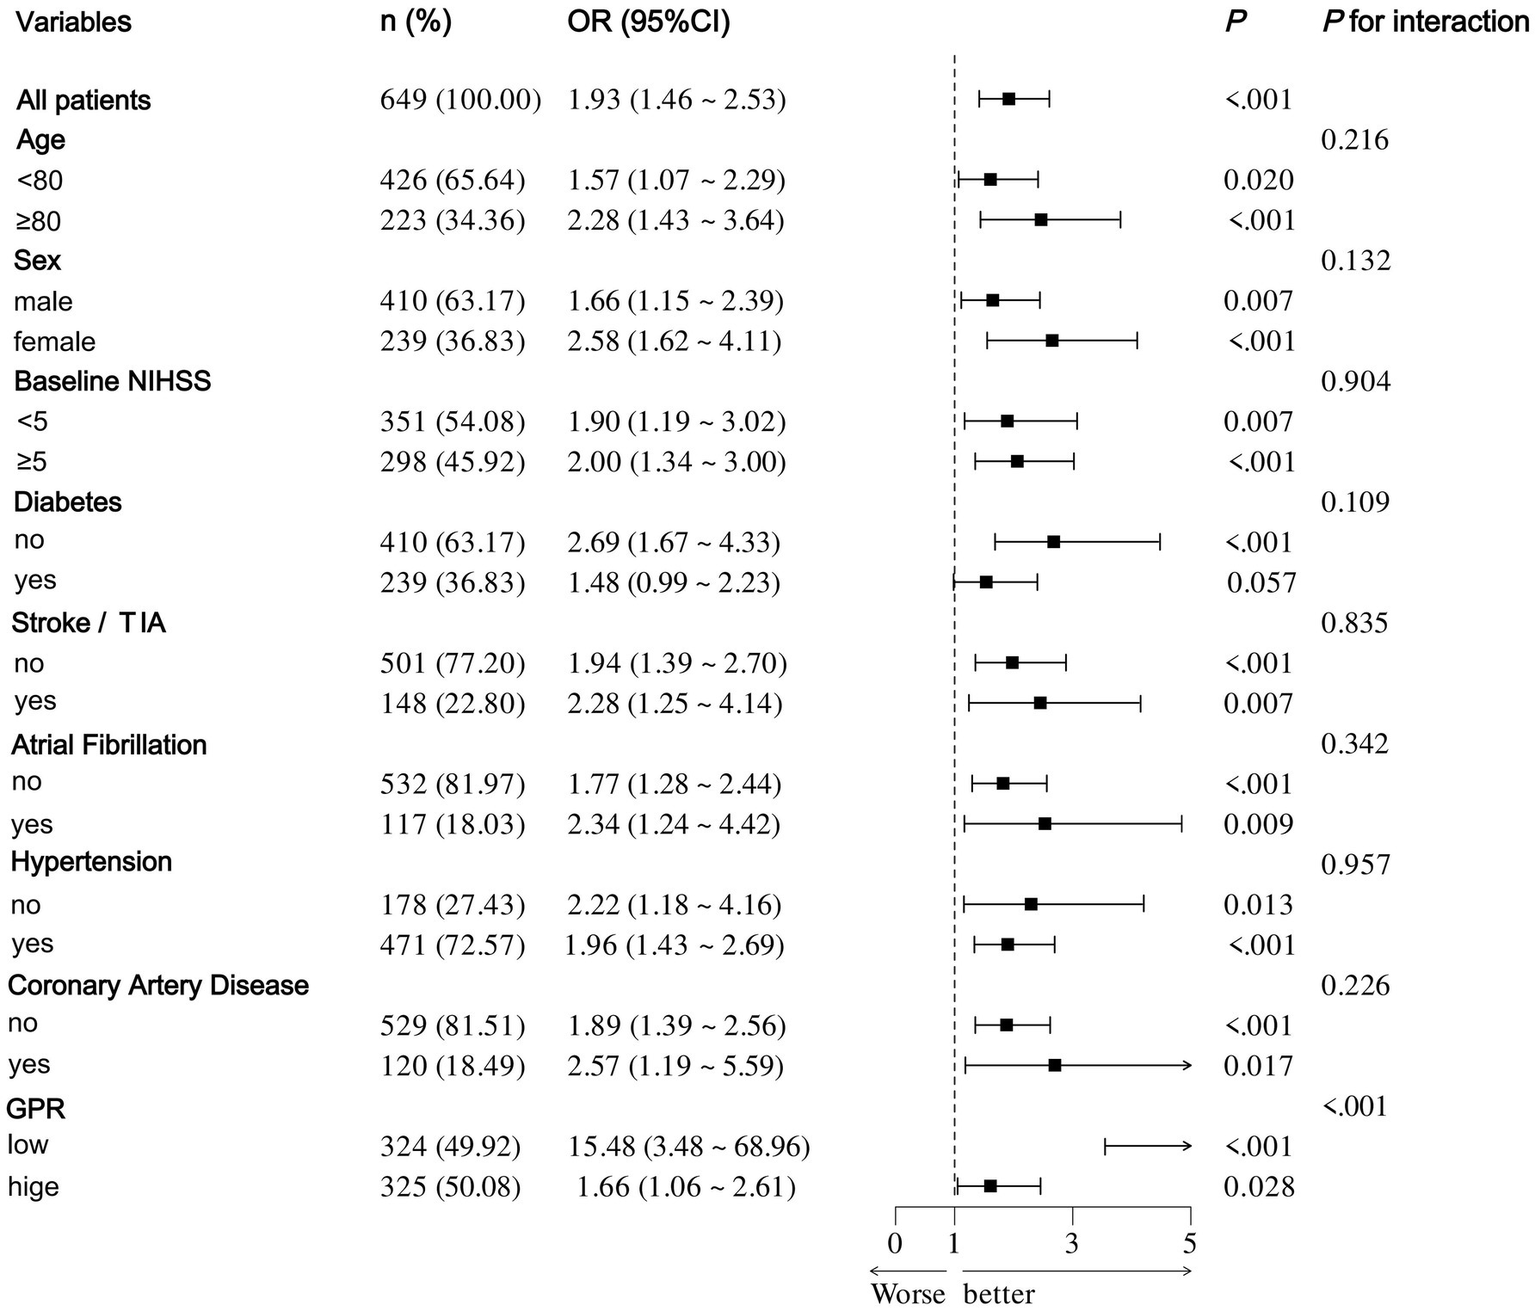
Forest plot of subgroup analysis by binary logistic regression of model 2.
Figure 3
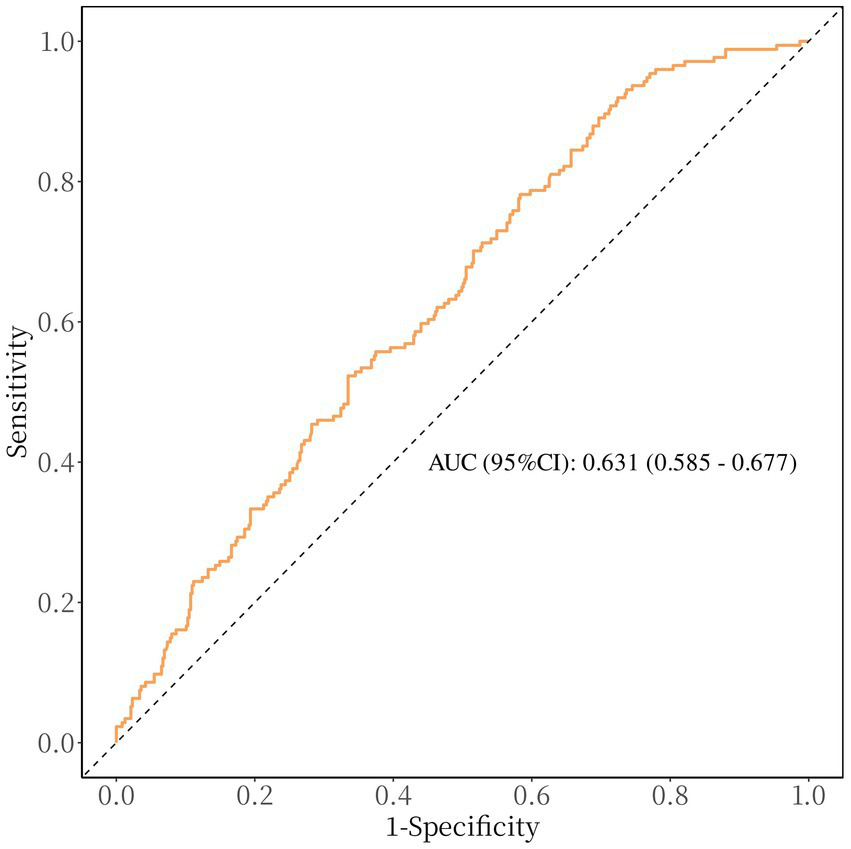
Receiver operating characteristic curve showing optimized cut-off for GPR in predicting poor functional outcomes (mRS 3–6). The optimal cutoff for predicting poor functional outcome is GPR ≥ 1.745 (sensitivity: 41.7%, specificity: 78.2%).
Figure 4
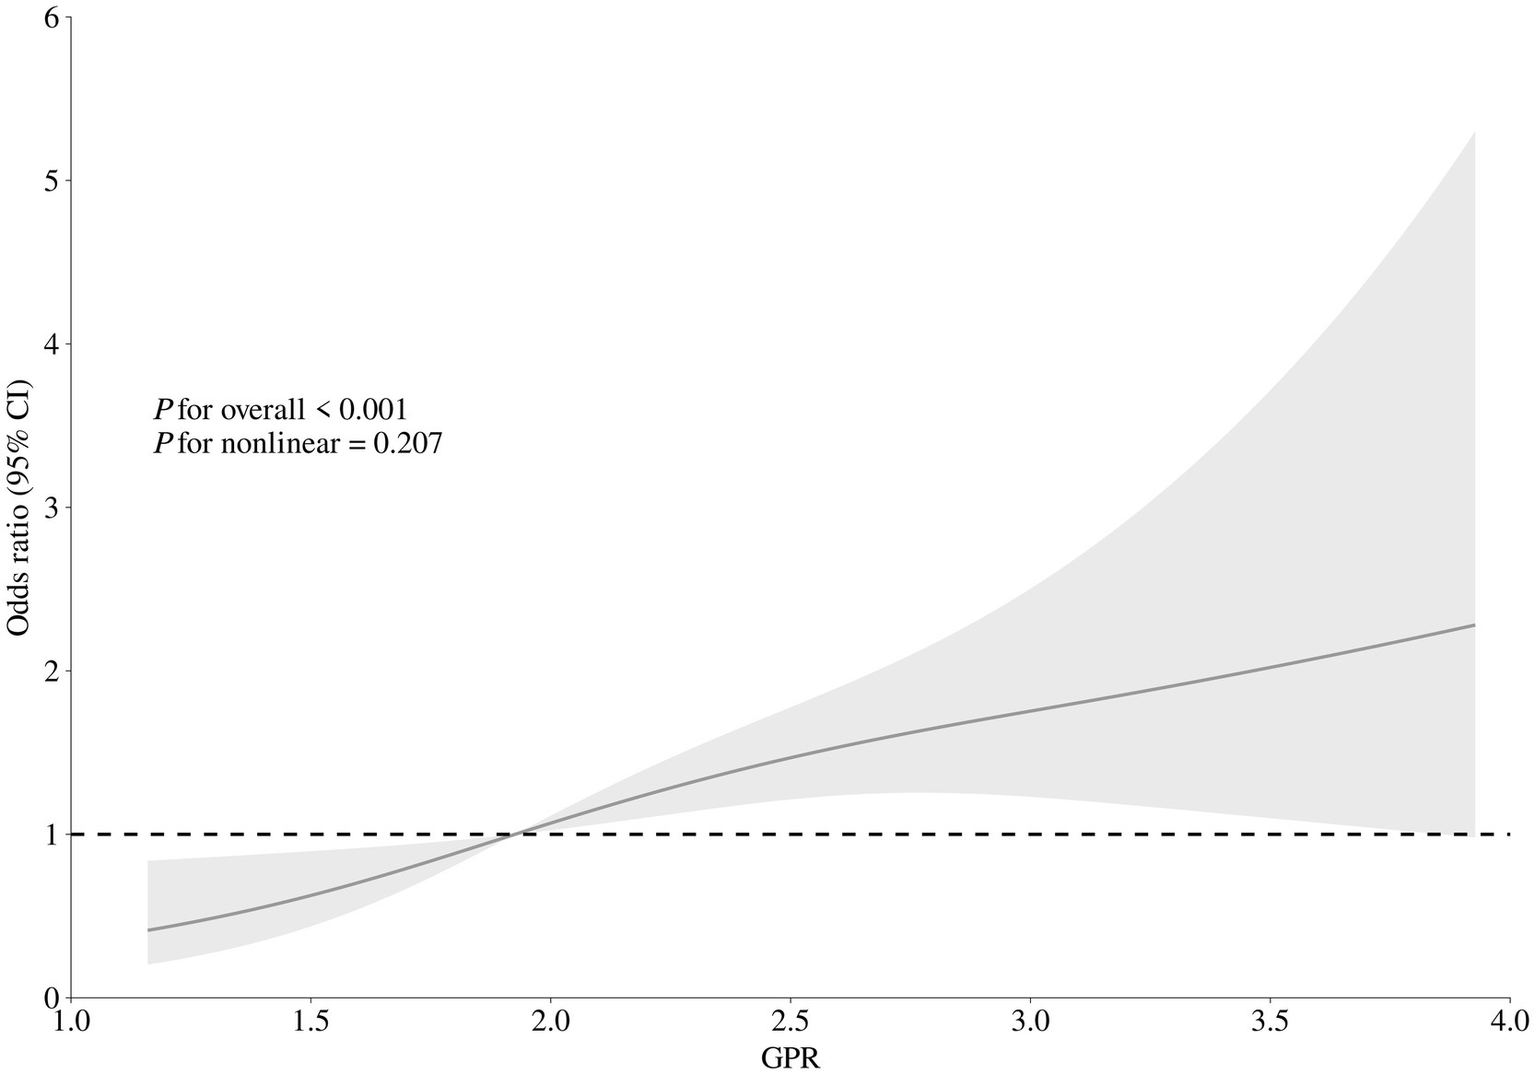
Correlation between GPR levels and risk of 90-day poor functional outcome. Odds ratio and 95% confidence intervals were derived from restricted cubic spline regression with three knots (at 10th, 50th, and 90th percentiles). The odds ratio was controlled for the same variables as model 2 in Table 2.
Discussion
The research indicates a notable correlation between GPR and the functional results in AIS patients receiving IVT. Importantly, this correlation persisted even after taking into account potential confounding factors. Higher GPR levels upon admission were linked to an increased likelihood of negative functional outcomes 90 days after treatment. When GPR was analyzed as a categorical variable, there was an observed trend of increasing odds ratio values from the first to the fourth quartile. The impact of GPR on results was more significant in patients without diabetes than in those with the condition.
Our findings are consistent with previous research on various neurological disorders. For example, an earlier study discovered that the GPR upon admission could accurately forecast mortality rate within 30 days for patients suffering from ischemic stroke (6). Earlier research has emphasized the connection between GPR and unfavorable outcomes post-endovascular thrombectomy (5). Moreover, GPR has been proposed as a potential outcome marker for critical brain injuries and intracranial hemorrhage (13–15). The literature suggests that there is a close relationship between GPR and the Glasgow Coma Scale score, as well as cerebral vasospasm, in cases of aneurysmal subarachnoid hemorrhage (16, 17). Additionally, GPR has been analyzed as a forecast for the outcome of sudden intracerebral bleeding (13). This is also linked to prognosis in instances of severe traumatic brain injuries requiring surgical intervention, such as acute subdural hematoma, traumatic subarachnoid hemorrhage, acute epidural hematoma, and brain contusion due to trauma (18). In this study, patients with ischemic stroke who received IVT and had a greater GPR at admission was associated with a greater likelihood of a poor functional outcome after 90 days, especially in non-diabetic individuals. However, the basic pathological mechanism remains incompletely explained.
The prognostic value of GPR builds upon previous findings regarding the individual roles of glucose and potassium in stroke outcomes. Post-stroke hyperglycemia is triggered by increased cortisol and catecholamine levels after an ischemic injury, associated with increased infarct size, oxidative stress, and disruption of the blood–brain barrier (7, 19). Early stroke mortality was independently linked to hyperglycemia, irrespective of diabetes status (20). Earlier research identified the connection between stress hyperglycemia ratio and patients’ clinical outcomes over 90 days, undergoing EVT for stroke caused by an acute blockage in a large vessel (19, 21). The results of this study are consistent with the latest guidelines issued by the European Stroke Organization (ESO) concerning intravenous thrombolysis for acute ischemic stroke. These guidelines underscore the importance of actively managing hyperglycemia with insulin in patients undergoing intravenous thrombolysis for acute ischemic stroke. Such management is crucial for optimizing therapeutic outcomes and enhancing patient prognosis (22). In the same way, serum potassium is vital for keeping the body’s internal environment stable and lowering the risk of stroke (23, 24). Hypokalemia has been linked to impaired neuronal repair, increased excitotoxicity, and heightened risk of recurrent stroke. According to Johnson et al., there is a linear relationship between potassium levels in the blood during early middle age and the potential for ischemic stroke, brain bleeding, and overall mortality (25). A study from China showed that decreased levels of serum potassium are connected to the risk of recurrent AIS or TIA (26).
The stress-related hypothalamic–pituitary–adrenal (HPA) axis and the renin-angiotensin-aldosterone system (RAAS) activation is reflected in high blood sugar and low potassium levels. Previous studies have demonstrated that the GPR serves as a marker for stress activity and RAAS response. A physiological mechanism through which GPR forecasts the 90-day results for patients who suffered an ischemic stroke after IVT includes the joint activation of the HPA axis and RAAS in reaction to stress. This interaction leads to overproduction of catecholamines, which increases serum glucose levels, thereby stimulating insulin secretion and facilitating the intracellular transport of serum potassium (27, 28). Consequently, by integrating these two parameters, it captures the synergistic effects of metabolic and ionic imbalance: the higher the GPR, the more severe the physiological damage.
While we found a connection between GPR and functional outcome after 90 days, some restrictions should be acknowledged. Firstly, there is a possibility of selection bias and ongoing confounding due to the study’s retrospective design. Secondly, GPR was measured only at admission, and serial measurements might better capture the dynamic changes in metabolic and ionic states during stroke progression. Finally, the study was performed in one place, potentially limiting the relevance of the outcomes. In conclusion, our study identifies serum GPR as a significant prognostic biomarker for poor functional outcomes in AIS patients treated with IVT. These results indicate that assessing GPR could be a useful parameter for tracking outcomes after IVT. Broader studies are necessary to fully understand these relationships, potentially assisting in identifying patients at high risk for adverse outcomes post-IVT and stressing the importance of glucose and potassium.
Statements
Data availability statement
The raw data supporting the conclusions of this article will be made available by the authors, without undue reservation.
Ethics statement
The studies involving humans were approved by the Ethics Committee of Yangpu Hospital of Tongji University School of Medicine. The studies were conducted in accordance with the local legislation and institutional requirements. The human samples used in this study were primarily isolated as part of our previous study for which ethical approval was obtained. Written informed consent for participation was not required from the participants or the participants’ legal guardians/next of kin in accordance with the national legislation and institutional requirements.
Author contributions
DZ: Formal analysis, Investigation, Methodology, Software, Validation, Visualization, Writing – original draft. RM: Data curation, Investigation, Methodology, Validation, Writing – original draft. XQ: Data curation, Investigation, Methodology, Validation, Writing – original draft. ZL: Data curation, Writing – original draft. XZ: Data curation, Writing – original draft. YD: Data curation, Writing – original draft. YH: Data curation, Writing – original draft. YY: Conceptualization, Funding acquisition, Project administration, Resources, Supervision, Writing – review & editing.
Funding
The author(s) declare that financial support was received for the research and/or publication of this article. This research was funded by a project grant from the Yangpu District Health Commission of Shanghai (Project No. YPM202305).
Conflict of interest
The authors declare that the research was conducted in the absence of any commercial or financial relationships that could be construed as a potential conflict of interest.
Generative AI statement
The authors declare that no Gen AI was used in the creation of this manuscript.
Publisher’s note
All claims expressed in this article are solely those of the authors and do not necessarily represent those of their affiliated organizations, or those of the publisher, the editors and the reviewers. Any product that may be evaluated in this article, or claim that may be made by its manufacturer, is not guaranteed or endorsed by the publisher.
Supplementary material
The Supplementary material for this article can be found online at: https://www.frontiersin.org/articles/10.3389/fneur.2025.1581747/full#supplementary-material
Footnotes
References
1.
Rochmah TN Rahmawati IT Dahlui M Budiarto W Bilqis N . Economic burden of stroke disease: a systematic review. Int J Environ Res Public Health. (2021) 18:7552. doi: 10.3390/ijerph18147552
2.
Thayabaranathan T Kim J Cadilhac DA Thrift AG Donnan GA Howard G et al . Global stroke statistics 2022. Int J Stroke. (2022) 17:946–56. doi: 10.1177/17474930221123175
3.
Feigin VL Brainin M Norrving B Martins S Sacco RL Hacke W et al . World stroke organization (WSO): global stroke fact sheet 2022. Int J Stroke. (2022) 17:18–29. doi: 10.1177/17474930211065917
4.
Yu J Liu F Cheng Y Wang J Ma W Chen C et al . Burden of ischemic stroke in mainland China and Taiwan province from 1990 to 2019: with forecast for the next 11 years. Int J Qual Health Care. (2023) 35:mzad079. doi: 10.1093/intqhc/mzad079
5.
Zhang Q Huang Z Chen S Yan E Zhang X Su M et al . Association between the serum glucose-to-potassium ratio and clinical outcomes in ischemic stroke patients after endovascular thrombectomy. Front Neurol. (2024) 15:1463365. doi: 10.3389/fneur.2024.1463365
6.
Lu Y Ma X Zhou X Wang Y . The association between serum glucose to potassium ratio on admission and short-term mortality in ischemic stroke patients. Sci Rep. (2022) 12:8233. doi: 10.1038/s41598-022-12393-0
7.
Dungan KM Braithwaite SS Preiser J-C . Stress hyperglycaemia. Lancet. (2009) 373:1798–807. doi: 10.1016/S0140-6736(09)60553-5
8.
Feick J Pham M März AG Vogt ML Strinitz M Stoll G et al . Distinct alterations in oxygenation, ion composition and Acid-Base balance in cerebral collaterals during large-vessel occlusion stroke. Clin Neuroradiol. (2023) 33:973–84. doi: 10.1007/s00062-023-01296-w
9.
Von Kummer R Broderick JP Campbell BCV Demchuk A Goyal M Hill MD et al . The Heidelberg bleeding classification: classification of bleeding events after ischemic stroke and reperfusion therapy. Stroke. (2015) 46:2981–6. doi: 10.1161/STROKEAHA.115.010049
10.
Sucharew H Khoury J Moomaw CJ Alwell K Kissela BM Belagaje S et al . Profiles of the National Institutes of Health stroke scale items as a predictor of patient outcome. Stroke. (2013) 44:2182–7. doi: 10.1161/STROKEAHA.113.001255
11.
Jung HM Paik JH Kim SY Hong DY . Association of Plasma Glucose to potassium ratio and mortality after aneurysmal subarachnoid hemorrhage. Front Neurol. (2021) 12:661689. doi: 10.3389/fneur.2021.661689
12.
Durrleman S Simon R . Flexible regression models with cubic splines. Stat Med. (1989) 8:551–61. doi: 10.1002/sim.4780080504
13.
Wu X-Y Zhuang Y-K Cai Y Dong X-Q Wang K-Y Du Q et al . Serum glucose and potassium ratio as a predictive factor for prognosis of acute intracerebral hemorrhage. J Int Med Res. (2021) 49:03000605211009689. doi: 10.1177/03000605211009689
14.
Zhou J Yang C-S Shen L-J Lv Q-W Xu Q-C . Usefulness of serum glucose and potassium ratio as a predictor for 30-day death among patients with severe traumatic brain injury. Clin Chim Acta. (2020) 506:166–71. doi: 10.1016/j.cca.2020.03.039
15.
Shibata A Matano F Saito N Fujiki Y Matsumoto H Mizunari T et al . Serum glucose-to-potassium ratio as a prognostic predictor for severe traumatic brain injury. J Nippon Med Sch. (2021) 88:342–6. doi: 10.1272/jnms.JNMS.2021_88-506
16.
Fujiki Y Matano F Mizunari T Murai Y Tateyama K Koketsu K et al . Serum glucose/potassium ratio as a clinical risk factor for aneurysmal subarachnoid hemorrhage. J Neurosurg. (2018) 129:870–5. doi: 10.3171/2017.5.JNS162799
17.
Matano F Fujiki Y Mizunari T Koketsu K Tamaki T Murai Y et al . Serum glucose and potassium ratio as risk factors for cerebral vasospasm after aneurysmal subarachnoid hemorrhage. J Stroke Cerebrovasc Dis. (2019) 28:1951–7. doi: 10.1016/j.jstrokecerebrovasdis.2019.03.041
18.
Tsuchiya R Ooigawa H Kimura T Tabata S Maeda T Sato H et al . Study of certain easily available biochemical markers in prognostication in severe traumatic brain injury requiring surgery. Surg Neurol Int. (2023) 14:410. doi: 10.25259/SNI_544_2023
19.
Rinkel LA Nguyen TTM Guglielmi V Groot AE Posthuma L Roos YBWEM et al . High admission glucose is associated with poor outcome after endovascular treatment for ischemic stroke. Stroke. (2020) 51:3215–23. doi: 10.1161/STROKEAHA.120.029944
20.
Farrokhnia N Bjork E Lindback J Terent A . Blood glucose in acute stroke, different therapeutic targets for diabetic and non-diabetic patients?Acta Neurol Scand. (2005) 112:81–7. doi: 10.1111/j.1600-0404.2005.00440.x
21.
Peng Z Song J Li L Guo C Yang J Kong W et al . Association between stress hyperglycemia and outcomes in patients with acute ischemic stroke due to large vessel occlusion. CNS Neurosci Ther. (2023) 29:2162–70. doi: 10.1111/cns.14163
22.
Berge E Whiteley W Audebert H De Marchis G Fonseca AC Padiglioni C et al . European stroke organisation (ESO) guidelines on intravenous thrombolysis for acute ischaemic stroke. Eur Stroke J. (2021) 6:I–LXII. doi: 10.1177/2396987321989865
23.
Weaver CM . Potassium and health. Adv Nutr. (2013) 4:368S–77S. doi: 10.3945/an.112.003533
24.
Vinceti M Filippini T Crippa A De Sesmaisons A Wise LA Orsini N . Meta-analysis of potassium intake and the risk of stroke. J Am Heart Assoc. (2016) 5:e004210. doi: 10.1161/JAHA.116.004210
25.
Johnson LS Mattsson N Sajadieh A Wollmer P Söderholm M . Serum potassium is positively associated with stroke and mortality in the large, population-based Malmö preventive project cohort. Stroke. (2017) 48:2973–8. doi: 10.1161/STROKEAHA.117.018148
26.
Wang A Cao S Tian X Zuo Y Meng X Chen P et al . Lower serum potassium levels at admission are associated with the risk of recurrent stroke in patients with acute ischemic stroke or transient ischemic attack. Cerebrovasc Dis. (2022) 51:304–12. doi: 10.1159/000520052
27.
Chen X-G Shi S-Y Hu L Chen Y Sun H-W Zhou L et al . Longitudinal changes in the hypothalamic–pituitary–adrenal axis and sympathetic nervous system are related to the prognosis of stroke. Front Neurol. (2022) 13:946593. doi: 10.3389/fneur.2022.946593
28.
El Husseini N Laskowitz DT . The role of neuroendocrine pathways in prognosis after stroke. Expert Rev Neurother. (2014) 14:217–32. doi: 10.1586/14737175.2014.877841
Summary
Keywords
intravenous thrombolysis, GPR, functional outcome, acute ischemic stroke, biomarkers
Citation
Zhang D, Ma R, Qin X, Li Z, Zhang X, Ding Y, Hu Y and Yue Y (2025) The glucose-to-potassium ratio: a predictor of poor functional outcomes in stroke patients receiving thrombolytic therapy. Front. Neurol. 16:1581747. doi: 10.3389/fneur.2025.1581747
Received
25 March 2025
Accepted
13 May 2025
Published
05 June 2025
Volume
16 - 2025
Edited by
Jinming Han, Capital Medical University, China
Reviewed by
Aleksandras Vilionskis, Vilnius University, Lithuania
Aikaterini Theodorou, University General Hospital Attikon, Greece
Updates
Copyright
© 2025 Zhang, Ma, Qin, Li, Zhang, Ding, Hu and Yue.
This is an open-access article distributed under the terms of the Creative Commons Attribution License (CC BY). The use, distribution or reproduction in other forums is permitted, provided the original author(s) and the copyright owner(s) are credited and that the original publication in this journal is cited, in accordance with accepted academic practice. No use, distribution or reproduction is permitted which does not comply with these terms.
*Correspondence: Yunhua Yue, yunhua.yue@tongji.edu.cn
†These authors have contributed equally to this work and share first authorship
Disclaimer
All claims expressed in this article are solely those of the authors and do not necessarily represent those of their affiliated organizations, or those of the publisher, the editors and the reviewers. Any product that may be evaluated in this article or claim that may be made by its manufacturer is not guaranteed or endorsed by the publisher.