Abstract
Objective:
Parkinson’s disease (PD) is a common neurodegenerative disorder, and the early and accurate differentiation of its motor subtypes is of significant importance for clinical diagnosis and treatment planning. Research has shown that deep brain nuclei such as the thalamus, caudate nucleus, putamen, and globus pallidus play a critical role in the pathogenesis of different motor subtypes of Parkinson’s disease. This study aims to utilize deep learning and radiomics technology to establish an automated method for differentiating motor subtypes of Parkinson’s disease.
Methods:
The data for this study were obtained from the Parkinson’s Progression Markers Initiative (PPMI) database, including a total of 135 Parkinson’s disease patients, comprising 43 cases of the Postural Instability/Gait Difficulty (PIGD) subtype and 92 cases of the Tremor Dominant (TD) subtype. High-resolution MRI scans were used to extract 2,264 radiomics features from 8 deep brain nuclei, including bilateral thalamus, caudate nucleus, putamen, and globus pallidus. After dimensionality reduction, five independent machine learning classifiers [AdaBoost, Bagging Decision Tree (BDT), Gaussian Process (GP), Logistic Regression (LR), and Random Forest (RF)] were trained on the training set and validated on the test set. Model performance was evaluated using the Area Under the Curve (AUC) metric.
Results:
After feature selection, 17 most discriminative radiomics features were retained. Among the models, the BDT-based diagnostic model demonstrated the best performance, achieving AUC values of 1.000 and 0.962 on the training and test sets, respectively. DeLong’s test results indicated that the BDT model significantly outperformed other models. Calibration curve analysis showed that the Parkinson’s disease subtype classification model based on MRI radiomics features exhibited good calibration and stability. Clinical decision curve analysis revealed that the BDT model demonstrated significant clinical net benefits across a wide probability range, indicating high clinical utility.
Conclusion:
The BDT model based on MRI radiomics features constructed in this study exhibited excellent performance in differentiating motor subtypes of Parkinson’s disease and can serve as an effective tool for clinical auxiliary diagnosis. This fully automated model is capable of processing MRI data and providing results within 3 min, offering an efficient and reliable solution for the early differentiation of Parkinson’s disease motor subtypes, with significant clinical application value.
1 Introduction
Parkinson’s disease (PD) is a complex, progressive neurodegenerative disorder characterized by an insidious onset, high morbidity, and significant disability rates, posing a severe challenge to global public health systems. PD not only threatens the physical and mental health of middle-aged and elderly people but also markedly reduces their quality of life (1). The primary clinical manifestations of PD include motor symptoms (e.g., tremor, rigidity, bradykinesia, and postural instability) and nonmotor symptoms (e.g., sleep disturbances, olfactory dysfunction, autonomic dysfunction, cognitive impairment, and psychiatric disorders). According to the World Health Organization (2), the global number of PD patients exceeded 11.9 million in 2021 and is projected to rise to 25.2 million by 2050, representing a 112% increase. With increasing population ageing, the prevalence of PD is growing at an annual rate of 1.7% (3), imposing a substantial burden on patients, families, and society (4). PD can be classified into two major subtypes on the basis of clinical symptoms: tremor-dominant (TD) and postural instability–gait disturbance (PIGD) (5). The former is characterized by resting tremor (4–6 Hz), rigidity, and bradykinesia, often accompanied by cogwheel rigidity, whereas the latter manifests as balance impairment (positive Romberg sign), freezing of gait, and festination, which are frequently associated with autonomic dysfunction. These subtypes exhibit significant differences in dopaminergic drug responsiveness, disease progression rates, and nonmotor symptom profiles (6, 7). Therefore, developing a rapid and objective diagnostic method to distinguish these subtypes is a critical unmet need for improving patient outcomes.
Currently, PD subtyping relies heavily on subjective clinical assessments, which are prone to cognitive biases and variability in patient cooperation. As a result, clinicians often accurately diagnose PD subtypes only at advanced disease stages (5), delaying targeted treatment. Magnetic resonance imaging (MRI), a noninvasive, radiation-free, high-resolution imaging technique, is widely used for diagnosing and staging neurological disorders. Previous studies have identified structural alterations in the thalamus, caudate nucleus, putamen, and globus pallidus as key factors underlying TD and PIGD subtypes (8, 9). For example, Rosenberg-Katz et al. (10) reported that TD is more closely associated with thalamic damage, whereas PIGD is associated with more severe nigrostriatal degeneration. Dehghan et al. (11) reported widespread grey matter atrophy in PIGD patients, particularly in the frontal lobe, supplementary motor area (SMA), and basal ganglia. Bunzeck et al. (12) demonstrated differences in iron deposition between PD subtypes, with TD patients showing higher basal ganglia iron levels than PIGD patients. However, these studies focused primarily on macroscopic changes and failed to capture subtle structural variations, which limits their diagnostic accuracy and contributes to clinical misclassification. Such misdiagnosis may delay optimal treatment or exacerbate symptoms due to the use of inappropriate medication (13). Moreover, the lack of understanding of microstructural changes hinders the discovery of novel biomarkers.
Radiomics, introduced by Lambin et al. (14), is a computer-aided imaging technique that quantifies subtle, visually imperceptible features in medical images to assist in disease diagnosis and differentiation. It has been widely applied to PD, Alzheimer’s disease (AD), and brain tumours (1, 15, 16). However, existing radiomic models suffer from low accuracy and time-consuming workflows, limiting their clinical adoption (17). Prior to this study, we developed a convolutional neural network (CNN)-based AI model for automated segmentation and measurement of 109 brain regions, completing the process in under 30 s. This study leverages this network to rapidly segment brain nuclei, extract radiomic features, and construct machine learning models to differentiate TD and PIGD.
2 Materials and methods
2.1 Participants
All PD patients in this study were recruited from the Parkinson’s Progression Markers Initiative (PPMI) database (18). The PPMI patients were newly diagnosed and had not received any medication for at least 6 h. PD diagnosis followed the Movement Disorder Society guidelines. T1-weighted MR images were acquired using a 3 T Siemens scanner with the following parameters: acquisition type = 3D; flip angle = 9.0°; field of view (FOV) = 256 × 256 mm; matrix = 256 × 256; repetition time (TR) = 2300.0 ms; echo time (TE) = 3.0 ms; slice thickness = 1.0 mm; and no slice gap. Exclusion criteria: Patients with head motion >2 mm/° during scans were excluded (n = 5). For mild motion, we used N4 bias correction and rigid registration. The study included 135 PD patients (43 PIGD, 92 TD), who were randomly divided into training (80%) and testing (20%) sets.
2.2 Brain subregion segmentation
Brain subregion segmentation was performed using a deep learning algorithm based on VB-NET. The preprocessing module performed a series of operations on the MR images for training and testing, including rotation, resampling, resizing, skull stripping, bias field correction, histogram matching, and intensity normalization. All images were standardized to 256 × 256 × 256 mm3 in the standard Cartesian LPI coordinate system, with intensity values scaled to (−1, 1). The network training module used an end-to-end deep convolutional neural network, with each sample image and its corresponding brain parcellation atlas as training data. The sample image served as the network input, with the output being the brain parcellation label matching the input image. The network parameters were adjusted on the basis of differences between the output and ground truth parcellations, with training continuing until convergence when the output labels matched the reference parcellations. The network adopted a coarse-to-fine cascaded segmentation strategy, progressively decomposing the complex brain segmentation problem. Upper-level networks provided additional information to enhance lower-level network performance, enabling hierarchical segmentation of large brain regions, medium regions, and fine substructures. The model was trained on 1,800 subjects and achieved a mean Dice coefficient of 0.92 against manual segmentations in 295 test cases. The detailed segmentation methodology is described in our previous publication.
The whole brain was automatically segmented into 109 subregions, including 22 temporal, 20 frontal, 12 parietal, and 8 occipital lobe regions; 8 cingulate and 2 insular subregions; 12 subcortical nuclei; white matter structures; ventricles; cerebellar structures; and other regions (Supplementary material 1). Each patient’s segmentation was completed in under 30 s.
2.3 Feature extraction and dimensionality reduction
This study employed the VB-NET deep learning model to automatically quantify the volumes of 109 brain subregions for each patient while simultaneously extracting 2,264 radiomics features from 8 deep brain nuclei (in the bilateral thalamus, caudate nucleus, putamen, and globus pallidus). These features comprehensively captured multidimensional information: 18 first-order statistics and 14 shape features precisely characterized basic morphological properties, reflecting nuclei size proportions and spatial configurations. Texture features were derived from a multimatrix analytical framework, including 21 grey-level cooccurrence matrix (GLCM) features, 16 grey-level run-length matrix (GLRLM) features, 16 grey-level size-zone matrix (GLSZM) features, 5 neighbouring grey-tone difference matrix (NGTDM) features, and 14 grey-level dependence matrix (GLDM) features, enabling in-depth analysis of voxel intensity distribution patterns. For advanced feature construction, we employed a multimodal filtering and frequency-domain transformation strategy to generate hierarchical feature subsets: 24 filters (including the box mean, additive Gaussian noise, binomial blur, etc., and Gaussian filters with σ = 0.5, 1, 1.5, 2) were applied for spatial convolution, whereas wavelet transforms extracted 8 directional frequency components (e.g., LLL, LLH) to construct features that integrate spatial and frequency-domain information. All radiomic features underwent z score normalization and complied with the Image Biomarker Standardization Initiative (IBSI) guidelines, with systematic evaluation of feature reproducibility to ensure scientific rigor and cross-cohort applicability.
Feature selection included Relief and least absolute shrinkage and selection operator (LASSO) methods to identify the most robust features. LASSO hyperparameters were optimized via grid search with stratified 5-fold cross-validation on the training set, selecting parameters yielding the highest cross-validated AUC.
2.4 Model construction and evaluation
Using the selected features, five independent machine learning classifiers (AdaBoost, BDT, GP, LR, RF) were trained on the training set and validated on the test set. Model performance was evaluated in terms of the mean accuracy, sensitivity (recall), specificity, precision with 95% confidence intervals (95% CI), F scores, and area under the receiver operating characteristic curve (AUC). Delong’s test was used to compare the performance between models. Calibration curves were used to assess the agreement between the predicted probabilities and actual outcomes, whereas decision curve analysis (DCA) was used to quantify the clinical net benefit across threshold probabilities to validate the clinical utility (Figure 1).
Figure 1
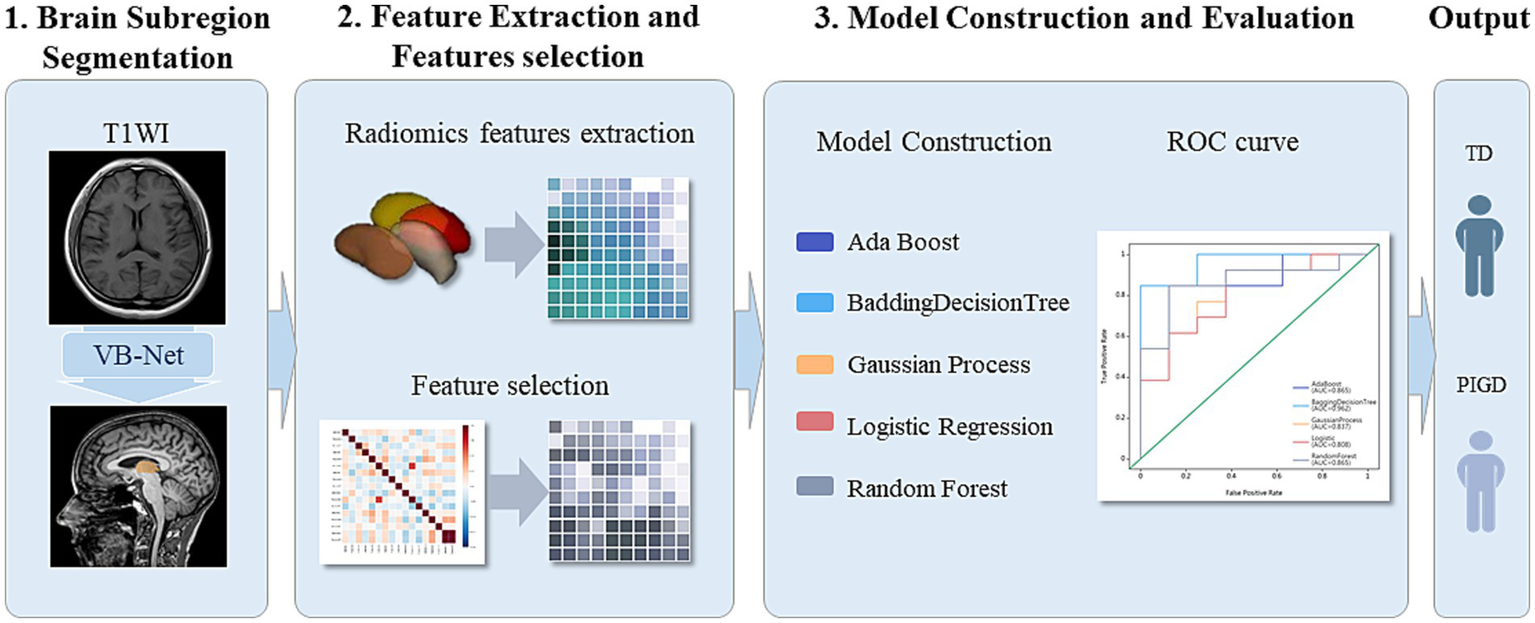
Flowchart of segmentation of deep brain nuclei (bilateral thalamus, caudate nucleus, putamen, and globus pallidus), radiomics feature extraction, and model construction.
2.5 Statistical analysis
Statistical analyses were performed using R (Version 4.0.4)and Python. For continuous variables, normality was first assessed, followed by Student’s t test for normally distributed data or the Mann–Whitney U test for nonnormally distributed data. Categorical variables were compared using chi-square tests, with two-tailed p < 0.05 considered statistically significant. For model comparisons, Delong’s test revealed significant differences in the AUC between classifiers’ ROC curves.
3 Results
The study included 135 PD patients (43 PIGD, 92 TD). In the training set, 2,264 radiomics features were extracted from 8 deep brain nuclei. Automated technology precisely quantified the volumes of 109 brain subregions for each patient. For bilateral thalamic regions, the maximum relevance minimum redundancy (MRMR) algorithm initially selected 1,000 representative features from 4,528 radiomic features. Recursive feature elimination cross-validation (RFECV) further refined these to 17 optimal features. Similar feature selection pipelines were applied to the caudate nucleus, putamen, and globus pallidus, yielding region-specific optimal feature sets. Finally, features from all regions were integrated: correlation coefficients first selected 2,195 highly associated features from the full set, MRMR reduced these to 1,000 key features, and RFECV ultimately identified 17 highly discriminative combined features for model construction.
On the basis of single-region (thalamus, caudate, putamen, globus pallidus) and combined features, we constructed 45 prediction models using five algorithms (AdaBoost, BDT, GP, LR, RF), with detailed performance metrics shown in Table 1. Delong’s test revealed that the BDT model with combined features (5 pallidal, 4 putaminal, and 4 caudate features) performed best, achieving training and testing AUCs of 1.000 and 0.962, respectively (Figure 2), demonstrating excellent classification and generalization capabilities. Calibration curves revealed high agreement between the predicted and actual probabilities (Figure 3), whereas DCA demonstrated significant net clinical benefit across decision thresholds (Figure 4), providing a quantitative tool for personalized treatment decisions (see Table2).
Table 1
| Radiomics features of regions | Models | AUC | Sensitivity | Specificity | Accuracy | ||||
|---|---|---|---|---|---|---|---|---|---|
| Training set | Testing set | Training set | Testing set | Training set | Testing set | Training set | Testing set | ||
| Caudatum L features | AdaBoost | 1 | 0.5 | 1 | 0.923 | 1 | 0.375 | 1 | 0.714 |
| BDT | 0.999 | 0.587 | 1 | 0.769 | 0.906 | 0.25 | 0.964 | 0.571 | |
| Gaussian Process | 0.885 | 0.644 | 0.904 | 1 | 0.688 | 0.375 | 0.821 | 0.762 | |
| Logistic | 0.944 | 0.587 | 0.981 | 0.846 | 0.688 | 0.375 | 0.869 | 0.667 | |
| Random Forest | 0.867 | 0.654 | 0.885 | 1 | 0.656 | 0.5 | 0.798 | 0.81 | |
| Caudatum R features | AdaBoost | 1 | 0.548 | 1 | 0.769 | 1 | 0.25 | 1 | 0.571 |
| BDT | 0.999 | 0.606 | 1 | 0.615 | 0.969 | 0.5 | 0.988 | 0.571 | |
| Gaussian Process | 0.889 | 0.481 | 0.942 | 0.692 | 0.656 | 0.125 | 0.833 | 0.476 | |
| Logistic | 0.867 | 0.538 | 0.942 | 0.692 | 0.594 | 0.125 | 0.81 | 0.476 | |
| Random Forest | 0.945 | 0.692 | 1 | 0.769 | 0.531 | 0.125 | 0.821 | 0.524 | |
| Pallidum L features | AdaBoost | 1 | 0.577 | 1 | 0.769 | 1 | 0.375 | 1 | 0.619 |
| BDT | 0.996 | 0.548 | 1 | 0.846 | 0.844 | 0.375 | 0.94 | 0.667 | |
| Gaussian Process | 0.893 | 0.673 | 0.981 | 0.846 | 0.594 | 0.125 | 0.833 | 0.571 | |
| Logistic | 0.812 | 0.673 | 0.865 | 0.769 | 0.5 | 0.375 | 0.726 | 0.619 | |
| Random Forest | 0.9 | 0.702 | 0.942 | 0.846 | 0.688 | 0.375 | 0.845 | 0.667 | |
| Pallidum R features | AdaBoost | 1 | 0.779 | 1 | 0.769 | 1 | 0.625 | 1 | 0.714 |
| BDT | 1 | 0.769 | 1 | 0.769 | 0.844 | 0.625 | 0.94 | 0.714 | |
| Gaussian Process | 0.859 | 0.769 | 0.904 | 0.846 | 0.594 | 0.625 | 0.786 | 0.762 | |
| Logistic | 0.834 | 0.75 | 0.904 | 0.846 | 0.562 | 0.5 | 0.774 | 0.714 | |
| Random Forest | 0.936 | 0.731 | 0.942 | 0.923 | 0.625 | 0.5 | 0.821 | 0.762 | |
| Putamen L features | AdaBoost | 1 | 0.76 | 1 | 0.846 | 1 | 0.5 | 1 | 0.714 |
| BDT | 0.993 | 0.808 | 1 | 0.769 | 0.875 | 0.5 | 0.952 | 0.667 | |
| Gaussian Process | 0.858 | 0.798 | 0.962 | 0.846 | 0.562 | 0.25 | 0.81 | 0.619 | |
| Logistic | 0.816 | 0.76 | 0.904 | 0.769 | 0.5 | 0.25 | 0.75 | 0.571 | |
| Random Forest | 0.922 | 0.885 | 0.981 | 0.846 | 0.688 | 0.25 | 0.869 | 0.619 | |
| Putamen R features | AdaBoost | 1 | 0.538 | 1 | 0.769 | 1 | 0.375 | 1 | 0.619 |
| BDT | 0.993 | 0.481 | 1 | 0.538 | 0.844 | 0.5 | 0.94 | 0.524 | |
| Gaussian Process | 0.832 | 0.577 | 0.904 | 0.692 | 0.594 | 0.25 | 0.786 | 0.524 | |
| Logistic | 0.82 | 0.606 | 0.865 | 0.692 | 0.625 | 0.375 | 0.774 | 0.571 | |
| Random Forest | 0.915 | 0.587 | 0.981 | 0.769 | 0.656 | 0.375 | 0.857 | 0.619 | |
| Thalamus L features | AdaBoost | 1 | 0.519 | 1 | 0.615 | 1 | 0.375 | 1 | 0.524 |
| BDT | 0.996 | 0.538 | 1 | 0.846 | 0.781 | 0.375 | 0.917 | 0.667 | |
| Gaussian Process | 0.802 | 0.625 | 0.942 | 0.846 | 0.406 | 0.375 | 0.738 | 0.667 | |
| Logistic | 0.802 | 0.625 | 0.885 | 0.846 | 0.531 | 0.375 | 0.75 | 0.667 | |
| Random Forest | 0.888 | 0.644 | 0.981 | 0.846 | 0.562 | 0.375 | 0.821 | 0.667 | |
| Thalamus R features | AdaBoost | 1 | 0.625 | 1 | 0.846 | 1 | 0.375 | 1 | 0.667 |
| BDT | 0.997 | 0.635 | 1 | 0.769 | 0.781 | 0.375 | 0.917 | 0.619 | |
| Gaussian Process | 0.865 | 0.644 | 0.981 | 0.769 | 0.562 | 0.375 | 0.821 | 0.619 | |
| Logistic | 0.925 | 0.635 | 0.962 | 0.846 | 0.531 | 0.375 | 0.798 | 0.667 | |
| Random Forest | 0.817 | 0.587 | 0.885 | 0.615 | 0.531 | 0.375 | 0.75 | 0.524 | |
| Combined features | AdaBoost | 1 | 0.865 | 1 | 0.846 | 1 | 0.5 | 1 | 0.714 |
| BDT | 1 | 0.962 | 1 | 0.923 | 0.969 | 0.75 | 0.988 | 0.857 | |
| Gaussian Process | 0.994 | 0.837 | 1 | 0.923 | 0.906 | 0.625 | 0.964 | 0.81 | |
| Logistic | 0.963 | 0.808 | 0.962 | 0.923 | 0.906 | 0.625 | 0.94 | 0.81 | |
| Random Forest | 0.984 | 0.865 | 1 | 0.923 | 0.812 | 0.5 | 0.929 | 0.762 | |
Detailed performance indicators of 45 predictive models.
BDT, Bagging Decision Tree; AUC, Area Under Curve.
Figure 2
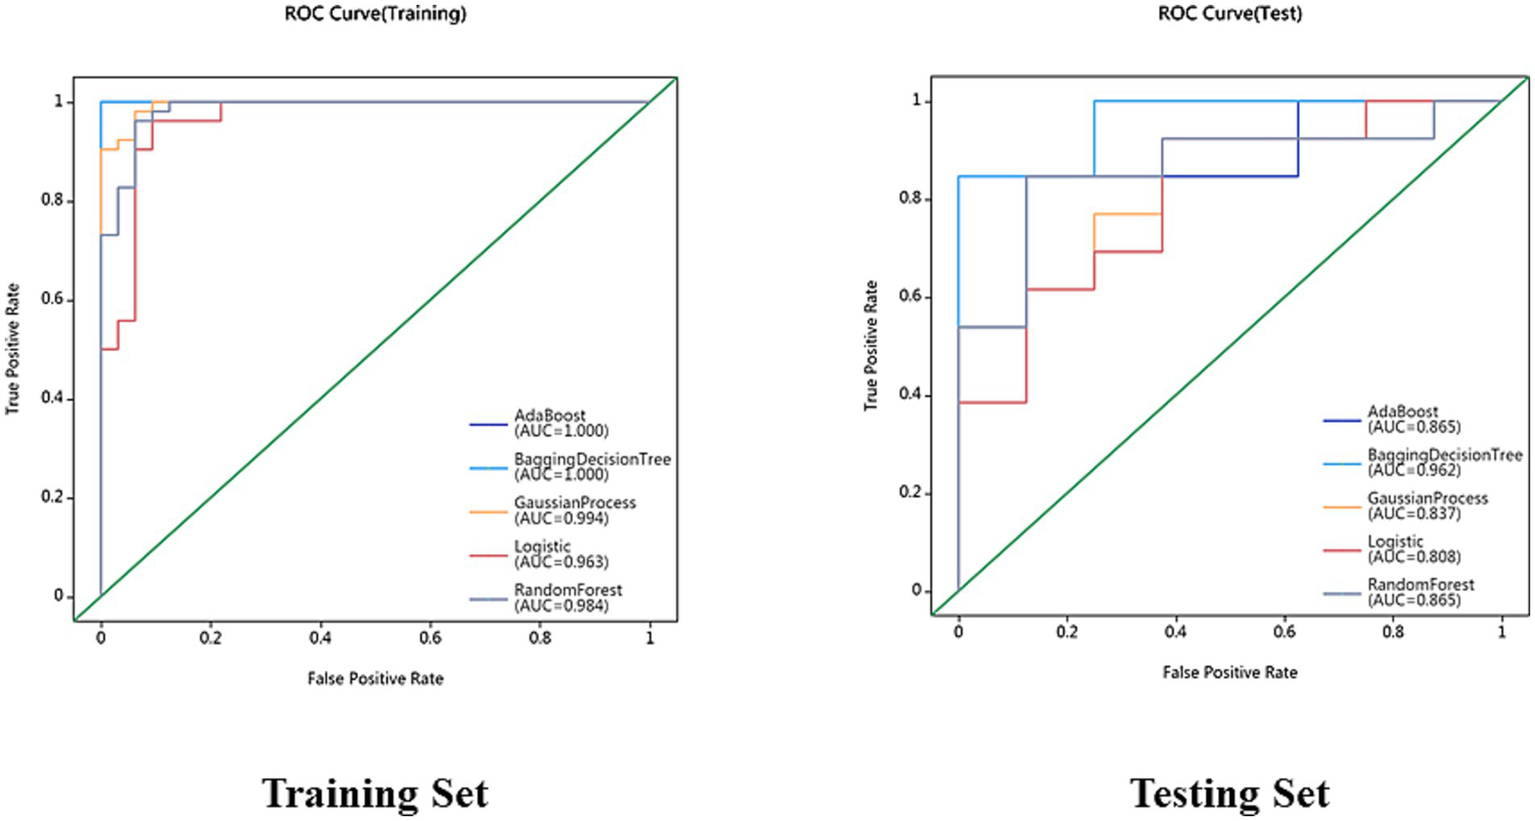
Receiver operating characteristic (ROC) curves for AdaBoost, BDT, GP, LR and RF models in the training set and testing set.
Figure 3
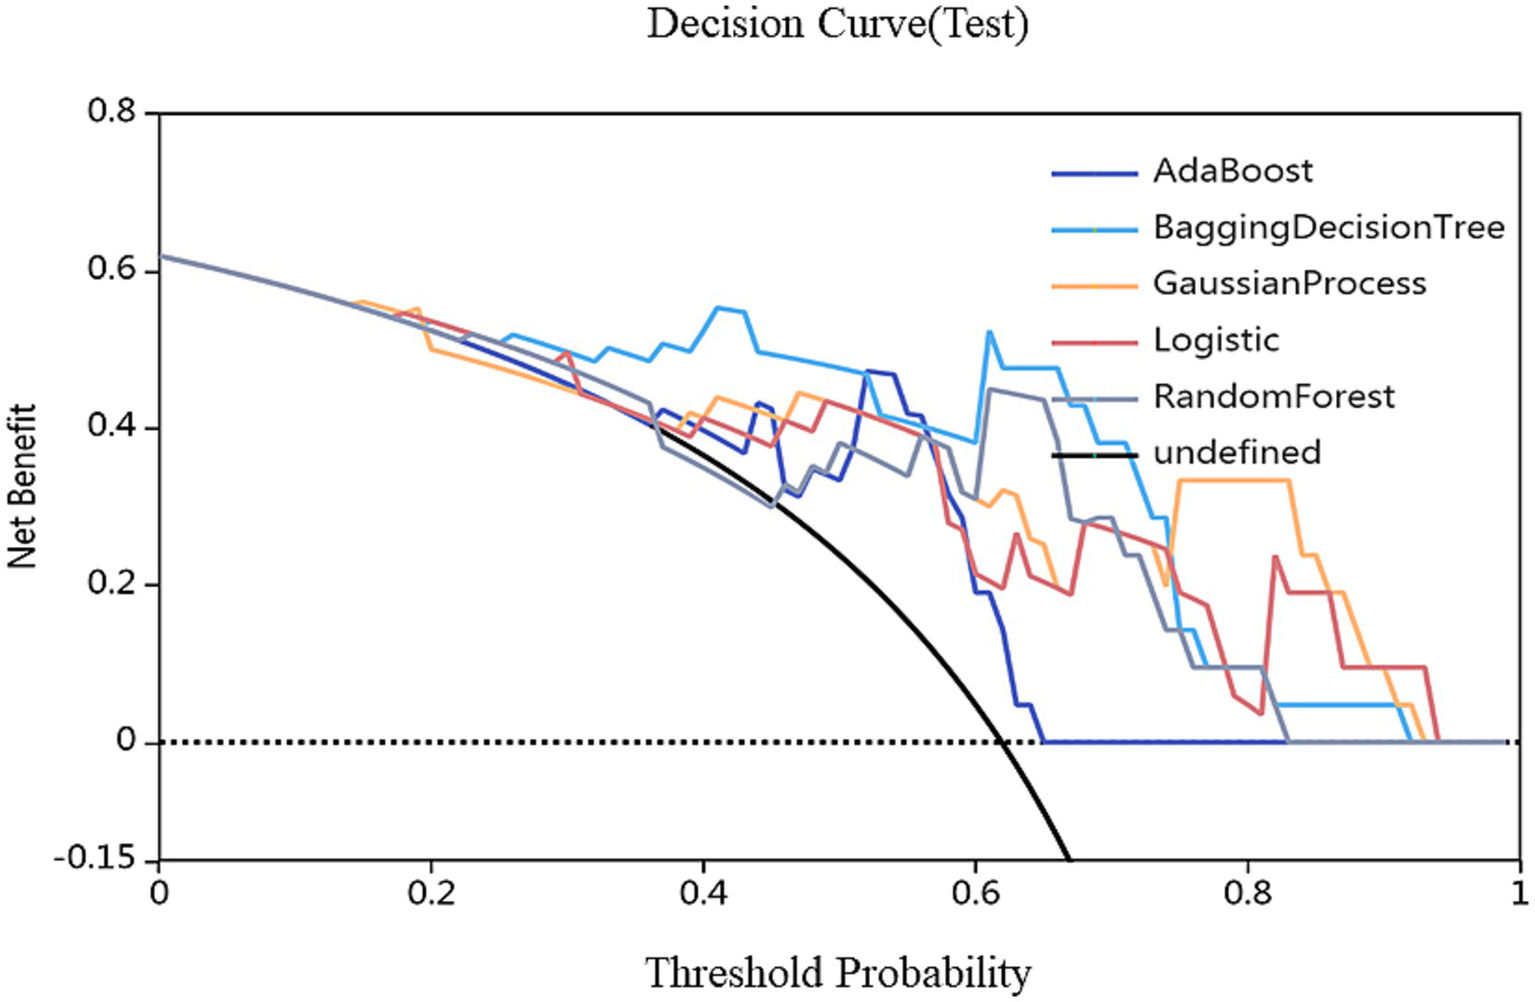
Decision curves of different models. The red, green, and blue lines represent the AdaBoost, BDT, GP, LR and RF models, respectively. The Y-axis represents the net benefit, and the X-axis represents the threshold probability. Compared with AdaBoost, GP, LR and RF models, BDT with combined features (5 pallidal, 4 putaminal, and 4 caudate features) performed best.
Figure 4
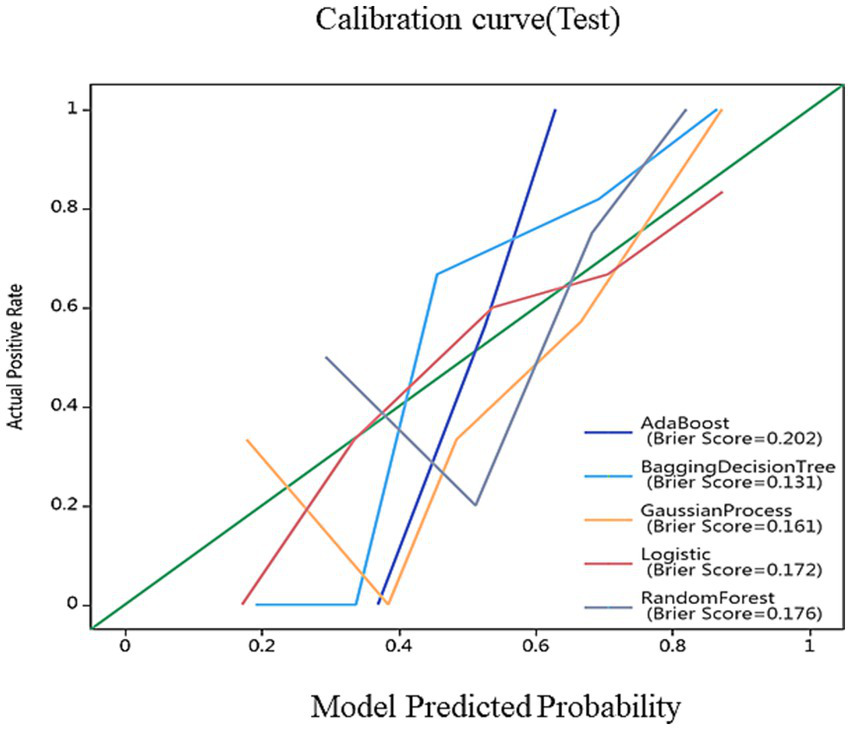
Calibration curves for nomogram goodness of fit. The 45° line represents a perfect match between the actual (Y-axis) and predicted (X-axis) probabilities of the bar graph. The closer the distance between the two curves, the higher the accuracy.
Table 2
| Feature name | Filter type | Feature class | Biological interpretation | IBSI compliant | Rank |
|---|---|---|---|---|---|
| Caudate_R_log_glszm_log-sigma-2-0-mm-3D-GrayLevelNonUniformity | Laplacian of Gaussian (σ = 2) | GLSZM | Heterogeneity of gray-level zones | Yes | 1 |
| Caudate_L_additivegaussiannoise_firstorder_Skewness | Additive Gaussian Noise | First-order | Intensity distribution asymmetry | Yes | 1 |
| Putamen_L_additivegaussiannoise_glrlm_ShortRunHighGrayLevelEmphasis | Additive Gaussian Noise | GLRLM | Presence of short bright runs (iron deposition?) | Yes | 1 |
| Caudate_L_boxsigmaimage_gldm_DependenceNonUniformityNormalized | Box Sigma | GLDM | Spatial consistency of gray-level dependencies | Yes | 1 |
| Caudate_L_boxsigmaimage_gldm_DependenceVariance | Box Sigma | GLDM | Variability in gray-level dependencies | Yes | 1 |
| Pallidum_R_boxmean_gldm_SmallDependenceLowGrayLevelEmphasis | Box Mean | GLDM | Small dark regions (possible microstructural gaps) | Yes | 1 |
| Caudate_R_boxmean_glszm_GrayLevelNonUniformity | Box Mean | GLSZM | Non-uniformity of gray-level zones | Yes | 1 |
| Thalamus_R_boxsigmaimage_glszm_SmallAreaEmphasis | Box Sigma | GLSZM | Prevalence of small areas (e.g., gliosis) | Yes | 1 |
| Pallidum_L_boxsigmaimage_glszm_SmallAreaEmphasis | Box Sigma | GLSZM | Small lesion-like structures | Yes | 1 |
| Pallidum_L_boxsigmaimage_glrlm_LongRunHighGrayLevelEmphasis | Box Sigma | GLRLM | Elongated bright regions (axonal integrity?) | Yes | 1 |
| Pallidum_L_log_firstorder_log-sigma-4-0-mm-3D-Skewness | Wavelet (LLL) | First-order | Intensity distribution tail direction | Yes | 1 |
| Caudate_R_boxsigmaimage_gldm_DependenceNonUniformityNormalized | Box Sigma | GLDM | Repeats spatial dependency measure | Yes | 2 |
| Pallidum_R_log_glrlm_log-sigma-4-0-mm-3D-ShortRunHighGrayLevelEmphasis | Wavelet (LLH) | GLRLM | Focal bright spots (iron clusters?) | Yes | 3 |
| Caudate_L_log_ngtdm_log-sigma-2-0-mm-3D-Contrast | Wavelet (LHL) | NGTDM | Local intensity variation | Yes | 4 |
| Caudate_L_log_glszm_log-sigma-2-0-mm-3D-GrayLevelNonUniformity | Wavelet (LHH) | GLSZM | Repeats heterogeneity measure | Yes | 5 |
| Putamen_L_additivegaussiannoise_glcm_Autocorrelation | Additive Gaussian Noise | GLCM | Pattern repetition (dopaminergic terminal density) | Yes | 6 |
| Pallidum_L_log_glrlm_log-sigma-4-0-mm-3D-ShortRunLowGrayLevelEmphasis | Wavelet (HLL) | GLRLM | Short dark runs (possible neuronal loss) | Yes | 7 |
Details of 17 selected features.
4 Discussion
TD and PIGD differ not only in motor symptoms (resting tremor vs. gait freezing) but also in nonmotor symptom patterns (e.g., sleep disturbances, autonomic dysfunction) (19), leading to varied responses to PD medications (e.g., dopamine agonists vs. levodopa) (20, 21) and novel therapies such as transcranial magnetic stimulation. However, current PD subtyping relies on clinical differentiation, which is often delayed until intermediate or advanced stages (18, 22), resulting in late intervention. Thus, establishing early, rapid, and accurate subtyping methods could optimize symptom management and enable timely targeted interventions.
This study implemented automated whole-brain subregion segmentation using VB-NET, a U-NET variant. As an efficient medical image segmentation model, VB-NET automatically learns spatial features and boundary information of brain subregions without manual annotation, reducing the processing time from hours to seconds while improving precision and consistency. Previous segmentation methods have relied on manual delineation or simple algorithms. For example, Jingnan et al. (23) manually outlined the caudate and putamen to calculate the striatal-to-occipital uptake ratios (SORs) of 18F-DOPA in PD patients versus controls. These manual approaches are time-consuming, subjective, and inconsistent. Crucially, our model uses routine 3D-T1WI without advanced functional imaging, significantly reducing costs and enhancing clinical accessibility. Furthermore, VB-NET automatically extracted 2,264 radiomics features from key nuclei (the caudate, putamen, globus pallidus, and thalamus), capturing multidimensional morphological and textural information. Five machine learning algorithms (AB, BDT, GP, LR, and RF) were employed for automated TD/PIGD classification and were validated on independent test sets. The BDT classifier achieved exceptional performance (training AUC = 1.000; testing AUC = 0.962), demonstrating high accuracy and generalizability. Compared with prior studies, this work represents the first fully automated TD/PIGD classification pipeline, eliminating subjective clinical assessments and completing diagnosis within 3 min—offering clinicians a rapid, objective tool for personalized treatment planning.
Feature selection identified 17 core radiomic features with distinct regional distributions: caudate (8), globus pallidus (6), putamen (2), and thalamus (1). This pattern aligns with PD pathophysiology: pallidal (6) and putaminal (2) texture features showed early pathological (24) sensitivity, with abnormalities detectable in preclinical stages (25) (e.g., REM sleep behaviour disorder), preceding macroscopic atrophy. TD was strongly correlated with putaminal texture features (26) (e.g., autocorrelation). As a key node in the direct pathway, putamen dysfunction directly contributes to classic PD motor symptoms (tremor, movement initiation difficulty) (27). There exist distinct patterns of iron deposition in the basal ganglia between Parkinson’s disease (PD) patients with postural instability/gait disorder (PIGD) and those with tremor dominance (TD). Compared with the TD group, the PIGD group exhibits significantly higher susceptibility values in the left putamen (PUT), particularly in patients whose major symptomatic side is the right limb. This indicates that the distribution of iron deposition in the basal ganglia is more extensive in the PIGD group, involving not only the substantia nigra (SN) but also regions such as the caudate nucleus (CN) and putamen, with a more severe degree of iron deposition in the putamen (28). From the perspective of the correlation between iron deposition and symptoms, the damaged putamen is likely to be the pathophysiological basis for gait and posture disorders in Parkinson’s disease. Reduced autocorrelation indicates disrupted textural periodicity, which is consistent with PET evidence of decreased dopamine receptor density (29), reflecting early synaptic degeneration. PIGD involved primarily pallidal (5) and thalamic (1) features. The globus pallidus, a core indirect pathway node, exhibits degeneration-related motor inhibition (rigidity, bradykinesia) (30). Changes in texture homogeneity may reflect iron deposition (T2*/SWI hypointensity) or neuronal loss (31), whereas the presence of thalamic abnormalities suggest upstream motor circuit disruption (32). GrayLevelNonUniformity frequently appeared in the bilateral caudate (Caudate_R, Caudate_L, Caudate_R_boxmean), indicating microstructural heterogeneity from neuronal loss, iron deposition, or uneven Lewy body distribution. SmallAreaEmphasis in the right thalamus (Thalamus_R) and left globus pallidus (Pallidum_L) suggested early microstructural changes (e.g., enlarged perivascular spaces, focal gliosis), matching histopathological “nonuniform degeneration” patterns. These features not only enabled high-accuracy classification but also revealed spatiotemporal patterns of basal ganglia involvement in PD subtypes—early putamen/pallidum texture changes driving motor subtype differentiation, with thalamic features contributing to circuit-level dysfunction. Thus, these radiomic features provide quantifiable imaging biomarkers for precise subtyping and pathological investigation.
Our study had several limitations. This study had a retrospective cross-sectional design. Future prospective longitudinal studies should examine whether feature changes predict disease conversion (e.g., PD to dementia). The PD sample size was relatively small. All the data were acquired on 3 T Siemens scanners, but model generalizability requires validation across multicentre datasets. Future studies need to further verify the stability and universality of the conclusions of this study by expanding the sample size (including multi center and multi-regional data) and conducting independent external cohort validation. The current research results cannot directly verify their predictive efficacy for subtype progression trajectories (such as the rate of motor symptom deterioration, patterns of cognitive decline, etc.). In the future, we will conduct a longitudinal follow-up study based on a multi-center cohort to verify the longitudinal stability and clinical practical value of potential predictive biomarkers. The sole focus of this study was imaging features. Future work should integrate clinical scores (UPDRS, MMSE) into diagnostic tools. Although radiomic features demonstrated high accuracy in PD subtyping, their underlying pathological basis requires further elucidation.
5 Conclusion
We developed an AI model that accurately differentiates PD subtypes within 3 min using routine MRI data. This fully automated approach significantly improves diagnostic efficiency and holds substantial clinical potential for precise PD subtyping.
Statements
Data availability statement
Publicly available datasets were analyzed in this study. This data can be found at: Parkinson’s Progression Markers Initiative (PPMI) database https://www.ppmi-info.org/.
Ethics statement
Ethical approval was not required for the study involving humans in accordance with the local legislation and institutional requirements. Written informed consent to participate in this study was not required from the participants or the participants’ legal guardians/next of kin in accordance with the national legislation and the institutional requirements.
Author contributions
DH: Conceptualization, Methodology, Writing – review & editing, Writing – original draft, Formal analysis, Project administration, Visualization, Resources, Validation. XW: Project administration, Data curation, Validation, Supervision, Investigation, Writing – original draft, Formal analysis. LX: Data curation, Resources, Writing – original draft, Writing – review & editing, Formal analysis. FC: Conceptualization, Resources, Writing – original draft, Software, Formal analysis, Methodology, Writing – review & editing, Data curation. YG: Methodology, Investigation, Formal analysis, Writing – review & editing. YL: Conceptualization, Investigation, Resources, Writing – original draft, Writing – review & editing, Data curation, Software. XH: Methodology, Writing – review & editing, Supervision, Writing – original draft, Software, Conceptualization, Project administration, Formal analysis, Resources.
Funding
The author(s) declare that no financial support was received for the research and/or publication of this article.
Conflict of interest
The authors declare that the research was conducted in the absence of any commercial or financial relationships that could be construed as a potential conflict of interest.
The reviewer QZ declared a shared parent affiliation with the authors DH and XH to the handling editor at the time of review.
Generative AI statement
The authors declare that no Gen AI was used in the creation of this manuscript.
Any alternative text (alt text) provided alongside figures in this article has been generated by Frontiers with the support of artificial intelligence and reasonable efforts have been made to ensure accuracy, including review by the authors wherever possible. If you identify any issues, please contact us.
Publisher’s note
All claims expressed in this article are solely those of the authors and do not necessarily represent those of their affiliated organizations, or those of the publisher, the editors and the reviewers. Any product that may be evaluated in this article, or claim that may be made by its manufacturer, is not guaranteed or endorsed by the publisher.
Supplementary material
The Supplementary material for this article can be found online at: https://www.frontiersin.org/articles/10.3389/fneur.2025.1650985/full#supplementary-material
References
1.
Hayes MT . Parkinson's disease and parkinsonism. Am J Med. (2019) 132:802–7. doi: 10.1016/j.amjmed.2019.03.001
2.
Su D Cui Y He C Yin P Bai R Zhu J et al . Projections for prevalence of Parkinson's disease and its driving factors in 195 countries and territories to 2050: modelling study of global burden of disease study 2021. BMJ (Clinical research ed). (2025) 388:e080952.doi: 10.1136/bmj-2023-080952
3.
Ben-Shlomo Y Darweesh S Llibre-Guerra J Marras C San Luciano M Tanner C . The epidemiology of Parkinson's disease. Lancet (London, England). (2024) 403:283–92. doi: 10.1016/S0140-6736(23)01419-8
4.
Heller J Dogan I Schulz JB Reetz K . Evidence for gender differences in cognition, emotion and quality of life in Parkinson's disease?Aging Dis. (2014) 5:63–75. doi: 10.14366/AD.2014.050063
5.
Thenganatt MA Jankovic J . Parkinson disease subtypes. JAMA Neurol. (2014) 71:499–504. doi: 10.1001/jamaneurol.2013.6233
6.
Pringsheim T Day GS Smith DB Rae-Grant A Licking N Armstrong MJ et al . Dopaminergic therapy for motor symptoms in early Parkinson disease practice guideline summary: a report of the AAN guideline subcommittee. Neurology. (2021) 97:942–57. doi: 10.1212/WNL.0000000000012868
7.
Küpeli Akkol E Tatlı Çankaya I Şeker Karatoprak G Carpar E Sobarzo-Sánchez E Capasso R . Natural compounds as medical strategies in the prevention and treatment of psychiatric disorders seen in neurological diseases. Front Pharmacol. (2021) 12:669638. doi: 10.3389/fphar.2021.669638
8.
Eisinger RS Hess CW Martinez-Ramirez D Almeida L Foote KD Okun MS et al . Motor subtype changes in early Parkinson's disease. Parkinsonism Relat Disord. (2017) 43:67–72. doi: 10.1016/j.parkreldis.2017.07.018
9.
Boonstra JT Michielse S Temel Y Hoogland G Jahanshahi A . Neuroimaging detectable differences between Parkinson's disease motor subtypes: a systematic review. Mov Disord Clin Pract. (2021) 8:175–92. doi: 10.1002/mdc3.13107
10.
Rosenberg-Katz K Herman T Jacob Y Giladi N Hendler T Hausdorff JM . Gray matter atrophy distinguishes between Parkinson disease motor subtypes. Neurology. (2013) 80:1476–84. doi: 10.1212/WNL.0b013e31828cfaa4
11.
Dehghan Y Sarbaz Y . Cortical complexity alterations in motor subtypes of Parkinson's disease: a surface-based morphometry analysis of fractal dimension. Eur J Neurosci. (2024) 60:7249–62. doi: 10.1111/ejn.16612
12.
Bunzeck N Singh-Curry V Eckart C Weiskopf N Perry RJ Bain PG et al . Motor phenotype and magnetic resonance measures of basal ganglia iron levels in Parkinson's disease. Parkinsonism Relat Disord. (2013) 19:1136–42. doi: 10.1016/j.parkreldis.2013.08.011
13.
Fox SH Katzenschlager R Lim SY Barton B de Bie RMA Seppi K et al . International Parkinson and movement disorder society evidence-based medicine review: update on treatments for the motor symptoms of Parkinson's disease. Mov Disord. (2018) 33:1248–66. doi: 10.1002/mds.27372
14.
Lambin P Rios-Velazquez E Leijenaar R Carvalho S van Stiphout RG Granton P et al . Radiomics: extracting more information from medical images using advanced feature analysis. Eur J Cancer. (2012) 48:441–6. doi: 10.1016/j.ejca.2011.11.036
15.
Khan S Barve KH Kumar MS . Recent advancements in pathogenesis, diagnostics and treatment of Alzheimer's disease. Curr Neuropharmacol. (2020) 18:1106–25. doi: 10.2174/1570159X18666200528142429
16.
Wang S Wang G Zhang W He J Sun W Yang M et al . MRI-based whole-tumor radiomics to classify the types of pediatric posterior fossa brain tumor. Neuro-Chirurgie. (2022) 68:601–7. doi: 10.1016/j.neuchi.2022.05.004
17.
Orlhac F Lecler A Savatovski J Goya-Outi J Nioche C Charbonneau F et al . How can we combat multicenter variability in MR radiomics? Validation of a correction procedure. Eur Radiol. (2021) 31:2272–80. doi: 10.1007/s00330-020-07284-9
18.
Marek K Jennings D Lasch S Siderowf A Tanner C Simuni T et al . The Parkinson progression marker initiative (PPMI). Prog Neurobiol. (2011) 95:629–35. doi: 10.1016/j.pneurobio.2011.09.005
19.
Herman T Weiss A Brozgol M Wilf-Yarkoni A Giladi N Hausdorff JM . Cognitive function and other non-motor features in non-demented Parkinson's disease motor subtypes. J Neural Transm. (1996) 122:1115–24. doi: 10.1007/s00702-014-1349-1
20.
Lee JW Song YS Kim H Ku BD Lee WW . Alteration of tremor dominant and postural instability gait difficulty subtypes during the progression of Parkinson's disease: analysis of the PPMI cohort. Front Neurol. (2019) 10:471. doi: 10.3389/fneur.2019.00471
21.
Pelicioni PHS Brodie MA Latt MD Menant JC Menz HB Fung VSC et al . Head and trunk stability during gait before and after levodopa intake in Parkinson's disease subtypes. Exp Gerontol. (2018) 111:78–85. doi: 10.1016/j.exger.2018.06.031
22.
Stebbins GT Goetz CG Burn DJ Jankovic J Khoo TK Tilley BC . How to identify tremor dominant and postural instability/gait difficulty groups with the movement disorder society unified Parkinson's disease rating scale: comparison with the unified Parkinson's disease rating scale. Mov Disord. (2013) 28:668–70. doi: 10.1002/mds.25383
23.
Jingnan W Yaping L Li H Fang L . Research progress of 6-[18F]fluoro-L-dopa PET/CT imaging. Chin J Nucl Med Mol Imaging. (2020) 40:113–7. doi: 10.3760/cma.j.issn.2095-2848.2020.02.012
24.
Bidesi NSR Vang Andersen I Windhorst AD Shalgunov V Herth MM . The role of neuroimaging in Parkinson's disease. J Neurochem. (2021) 159:660–89. doi: 10.1111/jnc.15516
25.
Tekriwal A Kern DS Tsai J Ince NF Wu J Thompson JA et al . REM sleep behaviour disorder: prodromal and mechanistic insights for Parkinson's disease. J Neurol Neurosurg Psychiatry. (2017) 88:445–51. doi: 10.1136/jnnp-2016-314471
26.
Si H Tian Y Wang X Li Y Liu X . Comparative study of diffusion kurtosis imaging in deep brain nucleus in different subtypes of Parkinson′s disease. Chin J Neurol. (2019) 52:379–86. doi: 10.3760/cma.j.issn.1006-7876.2019.05.004
27.
Luo CY Song W Chen Q Yang J Gong QY Shang HF . White matter microstructure damage in tremor-dominant Parkinson's disease patients. Neuroradiology. (2017) 59:1–8. doi: 10.1007/s00234-017-1846-7
28.
Zhang X Li L Qi L Fu Y Sun D Chen S et al . Distribution pattern of iron deposition in the basal ganglia of different motor subtypes of Parkinson's disease. Neurosci Lett. (2023) 807:137249. doi: 10.1016/j.neulet.2023.137249
29.
Niccolini F Su P Politis M . Dopamine receptor mapping with PET imaging in Parkinson's disease. J Neurol. (2014) 261:2251–63. doi: 10.1007/s00415-014-7302-2
30.
Nagae LM Honce JM Tanabe J Shelton E Sillau SH Berman BD . Microstructural changes within the basal ganglia differ between Parkinson disease subtypes. Front Neuroanat. (2016) 10:17. doi: 10.3389/fnana.2016.00017
31.
Jin J Su D Zhang J Lam JST Zhou J Feng T . Iron deposition in subcortical nuclei of Parkinson's disease: a meta-analysis of quantitative iron-sensitive magnetic resonance imaging studies. Chin Med J. (2025) 138:678–92. doi: 10.1097/CM9.0000000000003167
32.
Engeln M De Deurwaerdère P Li Q Bezard E Fernagut PO . Widespread monoaminergic dysregulation of both motor and non-motor circuits in parkinsonism and dyskinesia. Cereb Cortex. (2015) 25:2783–92. doi: 10.1093/cercor/bhu076
Summary
Keywords
Parkinson’s disease, motor subtypes, deep learning, radiomics, magnetic resonance imaging
Citation
Hui D, Wang X, Xie L, Chen F, Guo Y, Luo Y and He X (2025) Automatic differentiation of Parkinson’s disease motor subtypes based on deep learning and radiomics. Front. Neurol. 16:1650985. doi: 10.3389/fneur.2025.1650985
Received
20 June 2025
Accepted
18 August 2025
Published
04 September 2025
Volume
16 - 2025
Edited by
Demao Deng, Guangxi Academy of Medical Sciences, China
Reviewed by
Ying Chang, Capital Medical University, China
Qiyuan Zhu, Chongqing Medical University, China
Updates
Copyright
© 2025 Hui, Wang, Xie, Chen, Guo, Luo and He.
This is an open-access article distributed under the terms of the Creative Commons Attribution License (CC BY). The use, distribution or reproduction in other forums is permitted, provided the original author(s) and the copyright owner(s) are credited and that the original publication in this journal is cited, in accordance with accepted academic practice. No use, distribution or reproduction is permitted which does not comply with these terms.
*Correspondence: Xiaojing He, he_xiaojing@hospital.cqmu.edu.cn; Yaxi Luo, 33385540@qq.com; Yi Guo, yiguo_0909@sina.com
†These authors have contributed equally to this work
Disclaimer
All claims expressed in this article are solely those of the authors and do not necessarily represent those of their affiliated organizations, or those of the publisher, the editors and the reviewers. Any product that may be evaluated in this article or claim that may be made by its manufacturer is not guaranteed or endorsed by the publisher.