Abstract
Background:
Post-stroke hypostatic pneumonia (HP) significantly impairs neurological recovery and worsens prognosis in patients with acute ischemic stroke with large vessel occlusion (AIS-LVO). This study aimed to develop and validate a prognostic nomogram for predicting hypostatic pneumonia risk following endovascular therapy (EVT) in AIS-LVO patients.
Methods:
We retrospectively analyzed 650 consecutive AIS-LVO patients who underwent endovascular therapy with mechanical ventilation at Dongguan Hospital of Guangzhou University of Chinese Medicine from September 2018 to March 2025. After applying inclusion/exclusion criteria, 412 patients were randomly split into two groups: training (n = 288) and validation (n = 124), maintaining a 7:3 ratio. Using least absolute shrinkage and selection operator (LASSO) regression for feature selection followed by multivariable logistic regression, we identified independent predictors for nomogram construction. Model performance was assessed through the receiver operating characteristic curve (ROC), calibration curve, decision curve analysis (DCA), and clinical impact curve (CIC).
Results:
Four independent predictors were identified: admission Glasgow Coma Scale (GCS) score (OR 0.77, 95% CI 0.68–0.86), postoperative 48 h fever (OR 2.77, 95% CI 1.52–5.02), postoperative 48 h neutrophil-to-lymphocyte ratio (NLR) (OR 1.15, 95% CI 1.08–1.22), and ASPECTS (OR 0.74, 95% CI 0.63–0.87). The model had an area under the curve (AUC) of 0.829 (95% CI: 0.781–0.877) in the training cohort and 0.817 (95% CI 0.732–0.903) in the validation cohort, which means it was good at making predictions. Calibration curves revealed good alignment between predicted and observed probabilities in the training cohort. The validation cohort retained satisfactory calibration, with only modest overestimation of risk. DCA and CIC consistently indicated the nomogram’s applicability in diverse clinical settings.
Conclusion:
We developed and validated an effective nomogram incorporating four clinically accessible parameters to predict the risk of hypostatic pneumonia after EVT. This tool may facilitate early high-risk patient identification and guide preventive therapy to improve clinical outcomes.
1 Introduction
Stroke remains the second leading cause of global mortality, with ischemic stroke constituting the predominant subtype and imposing substantial socioeconomic burdens through long-term disability (1). While endovascular therapy (EVT) has significantly improved revascularization rates and functional prognosis in patients with acute ischemic stroke with large vessel occlusion (AIS-LVO) (2–5), post-procedural complications, particularly pneumonia, continue to compromise clinical benefits. Pneumonia complicates the hospitalization of 40% of critically ill acute stroke patients (6), and it is associated with exacerbated neurological injury mediated by systemic inflammation (7). Importantly, pneumonia may precipitate life-threatening complications including sepsis, multi-organ dysfunction, and death (7).
Among various pneumonia subtypes, hypostatic pneumonia (HP) represents a distinct clinical entity characterized by its unique pathophysiology and diagnostic challenges. HP develops due to prolonged immobilization, leading to gravitational pulmonary congestion, impaired mucociliary clearance, and subsequent bacterial colonization in dependent lung regions (8, 9). This condition is particularly prevalent in neurologically compromised populations, including post-stroke patients and elderly individuals with limited mobility (10). However, current diagnostic paradigms frequently fail to distinguish HP from other forms of pneumonia due to overlapping clinical features and nonspecific diagnostic criteria (e.g., radiographic infiltrates accompanied by fever, elevated or decreased leucocyte count) (8, 11). This diagnostic ambiguity often results in delayed recognition and suboptimal management.
The development of accurate prediction tools for post-EVT hypostatic pneumonia is further complicated by several knowledge gaps in existing literature. First, most studies have treated pneumonia as a homogeneous entity without accounting for subtype-specific risk factors. Second, no dedicated prediction models exist for hypostatic pneumonia. Current predictive tools primarily target general post-stroke pneumonia and lack validation for this distinct subtype. Third, methodological limitations including small sample sizes and inadequate variable selection techniques have constrained model performance.
To address these limitations, we developed and validated a novel nomogram incorporating both established clinical predictors and innovative inflammatory indices. Our approach features three key advancements: (1) explicit focus on hypostatic pneumonia as a distinct clinical endpoint, recognizing the synergistic effects of neurological impairment and post-procedural factors; (2) systematic integration of novel inflammatory biomarkers including neutrophil-to-lymphocyte ratio (NLR), systemic immune-inflammation index (SII), platelet-to-lymphocyte ratio (PLR), and systemic inflammatory response index (SIRI), with variable selection optimized through LASSO regression to mitigate multicollinearity; (3) nomogram development using a comparatively large, well-characterized cohort of EVT-treated AIS-LVO patients.
This study represents a significant step toward personalized risk assessment for post-EVT hypostatic pneumonia. By enabling early identification of high-risk patients, our nomogram may facilitate timely implementation of preventive strategies such as targeted respiratory therapy or prophylactic antibiotics, ultimately reducing pneumonia-related morbidity and mortality in this vulnerable population.
2 Methods
2.1 Study design and patient selection
We performed a retrospective analysis of patients with AIS-LVO who received EVT at Dongguan Hospital of Guangzhou University of Chinese Medicine (September 2018 to March 2025). The inclusion criteria were as follows: (1) confirmed LVO (internal carotid artery, M1/M2 middle cerebral artery, or basilar artery) by computed tomography angiography (CTA), magnetic resonance angiography (MRA), or digital subtraction angiography (DSA); (2) AIS diagnosis according to World Health Organization criteria with neuroimaging confirmation (computed tomography [CT] or magnetic resonance imaging [MRI]); (3) age ≥18 years; Exclusion criteria were: (1) pre-existing pulmonary or systemic infection (confirmed by microbiological or radiographic evidence); (2) severe comorbidities (e.g., end-stage organ failure, hematologic disorders); (3) immunocompromised status (HIV, immunosuppressant use, etc.); (4) modified Thrombolysis in Cerebral Infarction (mTICI) grade ≤ 2a without recanalization after EVT; (5) incomplete clinical data or loss to follow-up. After screening 650 patients, 412 met eligibility criteria and were subsequently allocated into a training cohort (n = 288) and a validation cohort (n = 124) in a 7:3 ratio. This research was approved by the Institutional Review Board of Dongguan Hospital (No. PJ[2025]88), with informed consent waived due to the retrospective use of anonymized data.
2.2 Outcome definition: hypostatic pneumonia
The HP was diagnosed within 7 days after EVT by two independent neurologists blinded to the predictors; any diagnostic discrepancies were arbitrated by a senior neurologist experienced in managing stroke complications. The diagnosis required simultaneous fulfillment of the following three criteria (8, 12, 13): (1) Clinical manifestations: ≥2 of cough, fever (>38 °C), purulent sputum, and deteriorated respiratory status, coupled with prolonged bed rest and reduced or absent sputum excretion; (2) Laboratory findings: Peripheral white blood cell (WBC) count >10 × 109/L or <4 × 10⁹/L; (3) Radiographic evidence: Chest X-ray showing irregular, tiny patchy high-density shadows (with blurred edges and uneven density) in the lower lung fields.
Given the lack of unified diagnostic guidelines for HP, this study established the diagnostic framework and observation window with reference to key literature (8, 12, 13): a comprehensive approach combining clinical, radiological, and laboratory assessments was adopted, along with a 7-day observation window. This window reflects how HP develops—specifically, HP is a secondary infection driven by pulmonary secretion accumulation from post-EVT immobilization.
2.3 Predictor variables and data collection
We identified 28 predictor variables for HP in EVT patients through literature retrieval, and these variables were then systematically extracted from electronic medical records. Meanwhile, multicollinearity tests were performed on these variables using SPSS software. The results showed that the variance inflation factor (VIF) of all variables was less than 10 (Supplementary Material 2), indicating no significant multicollinearity among the variables. These variables included: demographics (age, gender), medical history (hypertension, diabetes, atrial fibrillation, prior stroke, smoking, drinking), clinical status [dysphagia, postoperative 48 h fever, admission sbp, admission dbp, admission NIHSS (14), admission GCS, admission mRS (1, 15)], laboratory indicators [postoperative 24 h CRP, postoperative 24 h NLR (16), postoperative 24 h SII, postoperative 24 h SIRI (17), postoperative 24 h PLR, postoperative 24 h TyG, postoperative 24 h SHR], imaging/etiologic data [ASPECTS (18, 19), TOAST classification, fazekas scale, infarction site], and procedure-related parameters (operation time, symptom onset to puncture time).
2.4 Statistical analysis
The SPSS software (version 27.0), R software (version 4.2.3), and Origin 2024 were the primary tools utilized for data analysis and visualization. To reduce selection bias and ensure baseline balance between the training and validation cohorts, propensity score matching (PSM) was first conducted to adjust for confounders. Descriptive statistical analysis was then performed for 412 participants after PSM.
Continuous variables were presented as mean ± SD (normal distribution, independent samples t-test) or median (IQR) (non-normal distribution, Mann–Whitney U test). Categorical variables were reported as frequencies (%) and compared via chi-square test (expected frequency ≥5) or Fisher’s exact test (expected frequency <5). Two-sided p < 0.05 was statistically significant.
Missing values were present only for the stress hyperglycemia ratio (SHR) (21/412 cases, 5.10%), resulting in an overall missing rate <10%. Following confirmation of missing at random (MAR), multiple imputation (SPSS, 5 iterations) was used for handling. Sensitivity analysis confirmed model robustness, with consistent AUC (0.827 vs. 0.824) and no substantial differences in key metrics. Detailed comparisons are available in Supplementary Material 1.
Sample size was estimated using the Events Per Variable (EPV) principle for binary logistic regression-based predictive models. To construct a nomogram predicting HP in AIS-LVO patients after EVT (HP as the outcome), key parameters were set as follows: 4–6 expected independent variables, a minimum EPV of 10, an anticipated HP incidence of 35%, and a 70% training set proportion. This yielded a minimum required training set size of ~171.4 cases, translating to a total sample size of ~245 cases (before accounting for invalid samples). Considering a 10% reserve for invalid data, the final minimum total sample size was 273 cases. A total of 412 eligible patients were enrolled, meeting the sample size requirement.
Multicollinearity among all candidate predictor variables was diagnosed using the VIF. LASSO regression was applied for feature selection, with the optimal penalty parameter (lambda, λ₁se = 0.053) determined as the value that corresponds to the cross-validation error within one standard deviation of the minimum error. The variables selected by LASSO were incorporated into a multivariable logistic regression model, and multicollinearity was re-evaluated to ensure the stability of parameter estimates. For model performance assessment, discrimination was evaluated using the Receiver Operating Characteristic (ROC) curve and the Area Under the Curve (AUC); goodness-of-fit and calibration were comprehensively assessed via the Hosmer-Lemeshow test, calibration curves, and Brier score; additionally, Decision Curve Analysis (DCA) and Clinical Impact Curve (CIC) were utilized to evaluate the clinical net benefit across different decision thresholds, thereby verifying the model’s clinical utility.
3 Results
3.1 Study flow diagram
Figure 1 presents the participant selection flowchart. From an initial cohort of 650 patients with AIS-LVO who underwent EVT, 238 were excluded based on predefined criteria (detailed in Methods). The final analytical cohort comprised 412 patients, who were allocated to either the training cohort (n = 288) or validation cohort (n = 124) in a 7:3 ratio.
Figure 1

Study design flowchart.
3.2 Patient characteristics
To eliminate potential selection bias and ensure the comparability of baseline data between the training and validation cohorts, we first applied propensity score matching (PSM) to adjust for confounding factors. A total of 412 patients were recruited for this study, including 257 patients without HP (62.38%) and 155 patients with HP (37.62%). After PSM, the 412 patients were allocated into a training cohort (n = 288) and a validation cohort (n = 124) at a 7:3 ratio to ensure the reliability of subsequent model development and validation.
Table 1 presents the baseline characteristics of the two cohorts, including demographic data, clinical scores, laboratory indices, procedure-related variables, medical history, and clinical status. The “Statistic” and “P” columns show the results of differential analysis between the two cohorts. No statistically significant differences were observed in any variable (all p > 0.05), indicating that the training and validation cohorts were balanced and comparable, which guaranteed the validity of cross-validation for the prediction model.
Table 1
| Variable | Total (n = 412) | Training cohort (n = 288) |
Validation cohort (n = 124) |
Statistic | p-value |
|---|---|---|---|---|---|
| Hypostatic pneumonia, n (%) | χ 2 = 0.006 | 0.938 | |||
| No | 257 (62.38) | 180 (62.50) | 77 (62.10) | ||
| Yes | 155 (37.62) | 108 (37.50) | 47 (37.90) | ||
| Age, M (Q₁, Q₃) | 60.50 (51.00, 73.00) | 60.00 (51.00, 73.00) | 61.50 (49.75, 75.00) | Z = −0.307 | 0.759 |
| Admission GCS, M (Q₁, Q₃) | 15.00 (13.00, 15.00) | 15.00 (13.00, 15.00) | 15.00 (12.00, 15.00) | Z = −0.932 | 0.351 |
| Admission NIHSS, M (Q₁, Q₃) | 8.00 (4.00, 13.00) | 8.00 (4.00, 13.00) | 10.00 (5.00, 15.00) | Z = −1.567 | 0.117 |
| Admission ASPECTS, M (Q1, Q3) | 8.00 (6.75, 8.00) | 8.00 (7.00, 8.00) | 8.00 (6.00, 8.00) | Z = −0.059 | 0.953 |
| Admission SBP, M (Q₁, Q₃) | 150.00 (133.75, 166.00) | 150.00 (133.00, 165.00) | 146.00 (136.00, 166.00) | Z = −0.335 | 0.738 |
| Admission DBP, M (Q₁, Q₃) | 88.00 (79.00, 98.00) | 89.00 (79.00, 98.25) | 86.00 (78.00, 96.00) | Z = −0.784 | 0.433 |
| Postoperative 24 h SHR, M (Q₁, Q₃) | 1.03 (0.87, 1.26) | 1.04 (0.87, 1.28) | 1.01 (0.85, 1.20) | Z = −1.426 | 0.154 |
| Postoperative 24 h TyG, M (Q₁, Q₃) | 9.61 (9.24, 10.08) | 9.62 (9.24, 10.10) | 9.59 (9.27, 9.96) | Z = −0.888 | 0.375 |
| Postoperative 24 h CRP, M (Q₁, Q₃) | 4.40 (2.05, 12.59) | 4.19 (2.04, 11.40) | 5.30 (2.10, 12.79) | Z = −0.967 | 0.334 |
| Postoperative 24 h SII, M (Q₁, Q₃) | 1226.29 (809.86, 2190.32) | 1273.34 (844.80, 2179.22) | 1088.78 (747.49, 2214.91) | Z = −1.465 | 0.143 |
| Postoperative 24 h SIRI, M (Q₁, Q₃) | 2.11 (1.26, 3.85) | 2.10 (1.18, 3.73) | 2.11 (1.36, 4.04) | Z = −0.994 | 0.320 |
| Postoperative 24 h NLR, M (Q₁, Q₃) | 5.57 (3.55, 9.77) | 5.70 (3.52, 9.77) | 5.26 (3.64, 9.57) | Z = −0.428 | 0.669 |
| Postoperative 24 h PLR, M (Q₁, Q₃) | 164.87 (111.39, 249.04) | 168.54 (118.90, 255.35) | 158.21 (103.63, 242.30) | Z = −1.446 | 0.148 |
| Operation time (the interval from groin puncture to successful reperfusion), M (Q1, Q3) | 0.90 (0.73, 1.11) | 0.90 (0.73, 1.06) | 0.90 (0.71, 1.11) | Z = −0.072 | 0.943 |
| Symptom onset to puncture, M (Q1, Q3) | 5.25 (3.57, 8.35) | 5.28 (3.58, 8.56) | 5.25 (3.50, 8.04) | Z = −0.442 | 0.658 |
| Gender, n (%) | χ 2 = 0.349 | 0.554 | |||
| Female | 105 (25.49) | 71 (24.65) | 34 (27.42) | ||
| Male | 307 (74.51) | 217 (75.35) | 90 (72.58) | ||
| Hypertension, n (%) | χ 2 = 0.003 | 0.955 | |||
| No | 157 (38.11) | 110 (38.19) | 47 (37.90) | ||
| Yes | 255 (61.89) | 178 (61.81) | 77 (62.10) | ||
| Diabetes, n (%) | χ 2 = 0.085 | 0.771 | |||
| No | 303 (73.54) | 213 (73.96) | 90 (72.58) | ||
| Yes | 109 (26.46) | 75 (26.04) | 34 (27.42) | ||
| Previous stroke, n (%) | χ 2 = 1.066 | 0.302 | |||
| No | 341 (82.77) | 242 (84.03) | 99 (79.84) | ||
| Yes | 71 (17.23) | 46 (15.97) | 25 (20.16) | ||
| AF, n (%) | χ 2 = 0.140 | 0.708 | |||
| No | 348 (84.47) | 242 (84.03) | 106 (85.48) | ||
| Yes | 64 (15.53) | 46 (15.97) | 18 (14.52) | ||
| Smoking, n (%) | χ 2 = 0.406 | 0.524 | |||
| No | 262 (63.59) | 186 (64.58) | 76 (61.29) | ||
| Yes | 150 (36.41) | 102 (35.42) | 48 (38.71) | ||
| Drinking, n (%) | χ 2 = 0.368 | 0.544 | |||
| No | 333 (80.83) | 235 (81.60) | 98 (79.03) | ||
| Yes | 79 (19.17) | 53 (18.40) | 26 (20.97) | ||
| Postoperative 48 h fever, n (%) | χ 2 = 0.508 | 0.476 | |||
| No | 250 (60.68) | 178 (61.81) | 72 (58.06) | ||
| Yes | 162 (39.32) | 110 (38.19) | 52 (41.94) | ||
| Dysphagia, n (%) | χ 2 = 0.001 | 0.975 | |||
| No | 272 (66.02) | 190 (65.97) | 82 (66.13) | ||
| Yes | 140 (33.98) | 98 (34.03) | 42 (33.87) | ||
| TOAST, n (%) | χ 2 = 7.709 | 0.103 | |||
| LAA | 294 (71.36) | 210 (72.92) | 84 (67.74) | ||
| CE | 60 (14.56) | 38 (13.19) | 22 (17.74) | ||
| SAO | 12 (2.91) | 11 (3.82) | 1 (0.81) | ||
| SOE | 35 (8.5) | 20 (6.94) | 15 (12.10) | ||
| SUE | 11 (2.67) | 9 (3.12) | 2 (1.61) | ||
| Fazekas, n (%) | χ 2 = 0.911 | 0.823 | |||
| 0 (no lesion) | 126 (30.58) | 89 (30.90) | 37 (29.84) | ||
| 1 (mild lesion) | 187 (45.39) | 127 (44.10) | 60 (48.39) | ||
| 2 (Moderate lesion) | 69 (16.75) | 51 (17.71) | 18 (14.52) | ||
| 3 (severe lesion) | 30 (7.28) | 21 (7.29) | 9 (7.26) | ||
| Infarction site, n (%) | χ 2 = 1.306 | 0.253 | |||
| Anterior circulation | 336 (81.55) | 239 (82.99) | 97 (78.23) | ||
| Posterior circulation | 76 (18.45) | 49 (17.01) | 27 (21.77) | ||
| Admission mRS, n (%) | χ 2 = 0.984 | 0.321 | |||
| 0–2 (functional independence) | 103 (25) | 68 (23.61) | 35 (28.23) | ||
| 3–6 (functional dependence) | 309 (75) | 220 (76.39) | 89 (71.77) |
A comparison of the baseline characteristics between the training and validation cohorts (after propensity score matching).
IQR, interquartile range; NIHSS, National Institute of Health Stroke Scale; GCS, Glasgow Coma Scale; ASPECTS, Alberta Stroke Program Early CT Score; SBP, systolic blood pressure; DBP, diastolic blood pressure; SHR, stress hyperglycemia ratio; TyG, triglyceride-glucose index; CRP, C-reactive protein; NLR, neutrophil-to-lymphocyte ratio; SII, systemic immune-inflammatory index; SIRI, systemic inflammatory response index; PLR, platelet-to-lymphocyte ratio; AF, atrial fibrillation; TOAST, Trial of Org 10,172 in Acute Stroke Treatment; LAA, large-artery atherosclerosis; CE, cardioembolism; SAO, small artery occlusion; SOE, stroke of other determined etiology; SUE, stroke of undetermined etiology; mRS, modified Rankin Scale; Fazekas, Fazekas scale.
3.3 Selection of predictive factors for HP
LASSO regression was employed to screen 28 candidate variables, identifying predictive factors with non-zero coefficients (Figures 2A,B). Ten-fold cross-validation was performed to select the optimal λ value, which balanced model fit and parsimony. Ultimately, λ1se (λ = 0.053) was determined as the optimal threshold, leading to the identification of 6 predictive variables: postoperative 24 h fever, dysphagia, admission mRS, admission GCS, ASPECTS, and postoperative 24 h NLR.
Figure 2
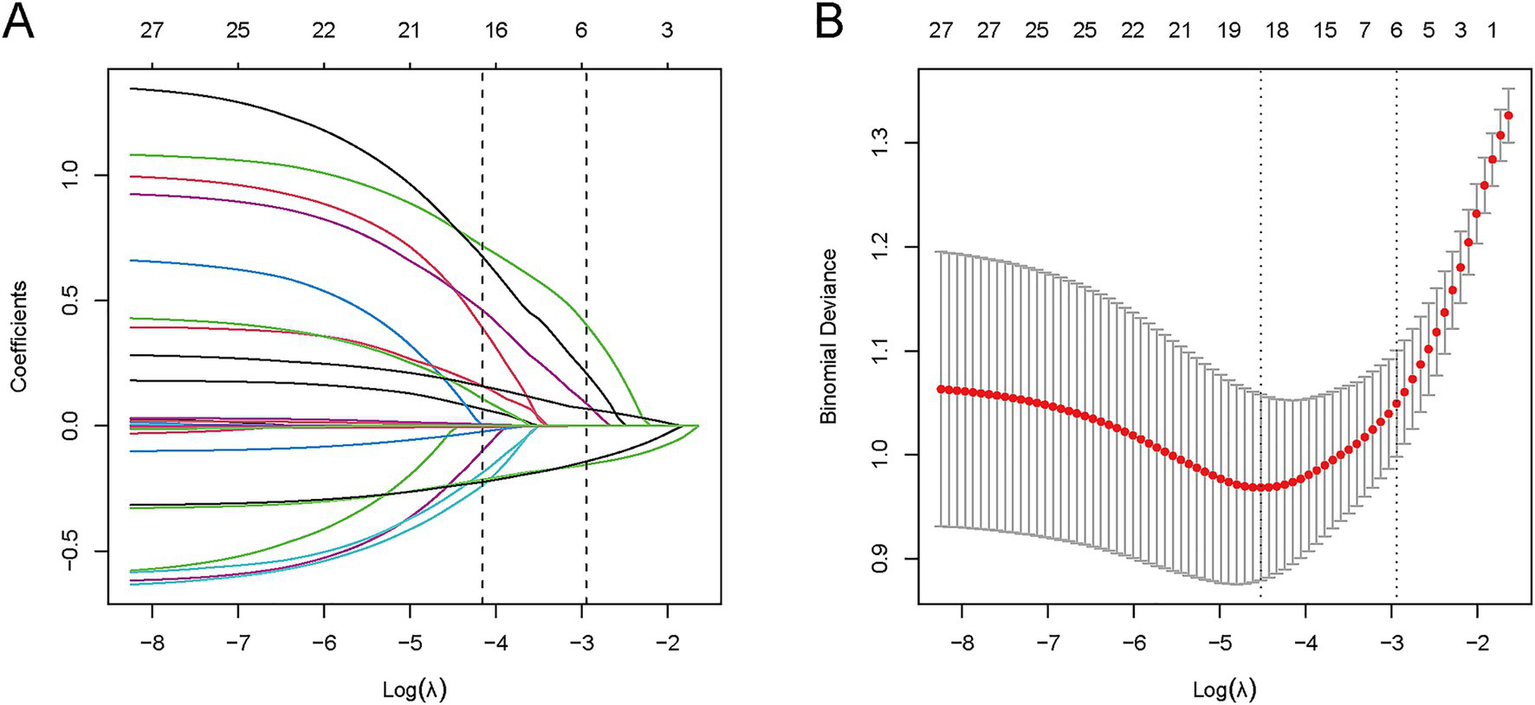
LASSO variable selection process for 28 candidate predictors. (A) Coefficient profile plot: LASSO coefficients of 28 features vs. log(λ); vertical dashed line indicates λ₁se (λ = 0.053), retaining 6 variables with non-zero coefficients. (B) Binomial deviance plot: Mean deviance (y-axis) vs. log(λ) (x-axis); vertical dashed line marks λ₁se (λ = 0.053) from 10-fold cross-validation, which balances model fit and parsimony.
Subsequently, these 6 LASSO-selected variables were subjected to multivariate logistic regression analysis, and four meaningful independent predictors were retained for the final model: postoperative 48 h fever, admission GCS, ASPECTS, and postoperative 24 h NLR. The model was constructed with hypostatic pneumonia (HP) occurrence as the dependent variable, targeting AIS-LVO patients who underwent EVT. Results showed that postoperative 48 h fever (OR = 2.77, p < 0.001) and postoperative 24 h NLR (OR = 1.15, p < 0.001) were independent risk factors for HP, while admission GCS (OR = 0.77, p < 0.001) and ASPECTS (OR = 0.74, p < 0.001) served as independent protective factors. Specifically, patients with postoperative 48 h fever or elevated postoperative 24 h NLR exhibited a higher risk of developing HP, whereas those with higher admission GCS scores or higher ASPECTS scores had a lower risk, as illustrated in Figure 3.
Figure 3

Results of multivariable logistic regression of hypostatic pneumonia after EVT.
3.4 Construction of the nomogram
Based on the results of multivariate logistic regression analysis, we constructed a nomogram for patients with HP after EVT (Figure 4A). Each specific value of the included variables corresponds to a respective score. After summing the scores of all variables to obtain a total score, a vertical line is drawn from this total score to estimate the probability of HP occurrence. To facilitate clinical use by physicians and patients, we have developed a web-based tool for this nomogram (Figure 4B), which is publicly accessible at: https://StrokePredMod.shinyapps.io/dynnomapp/.
Figure 4
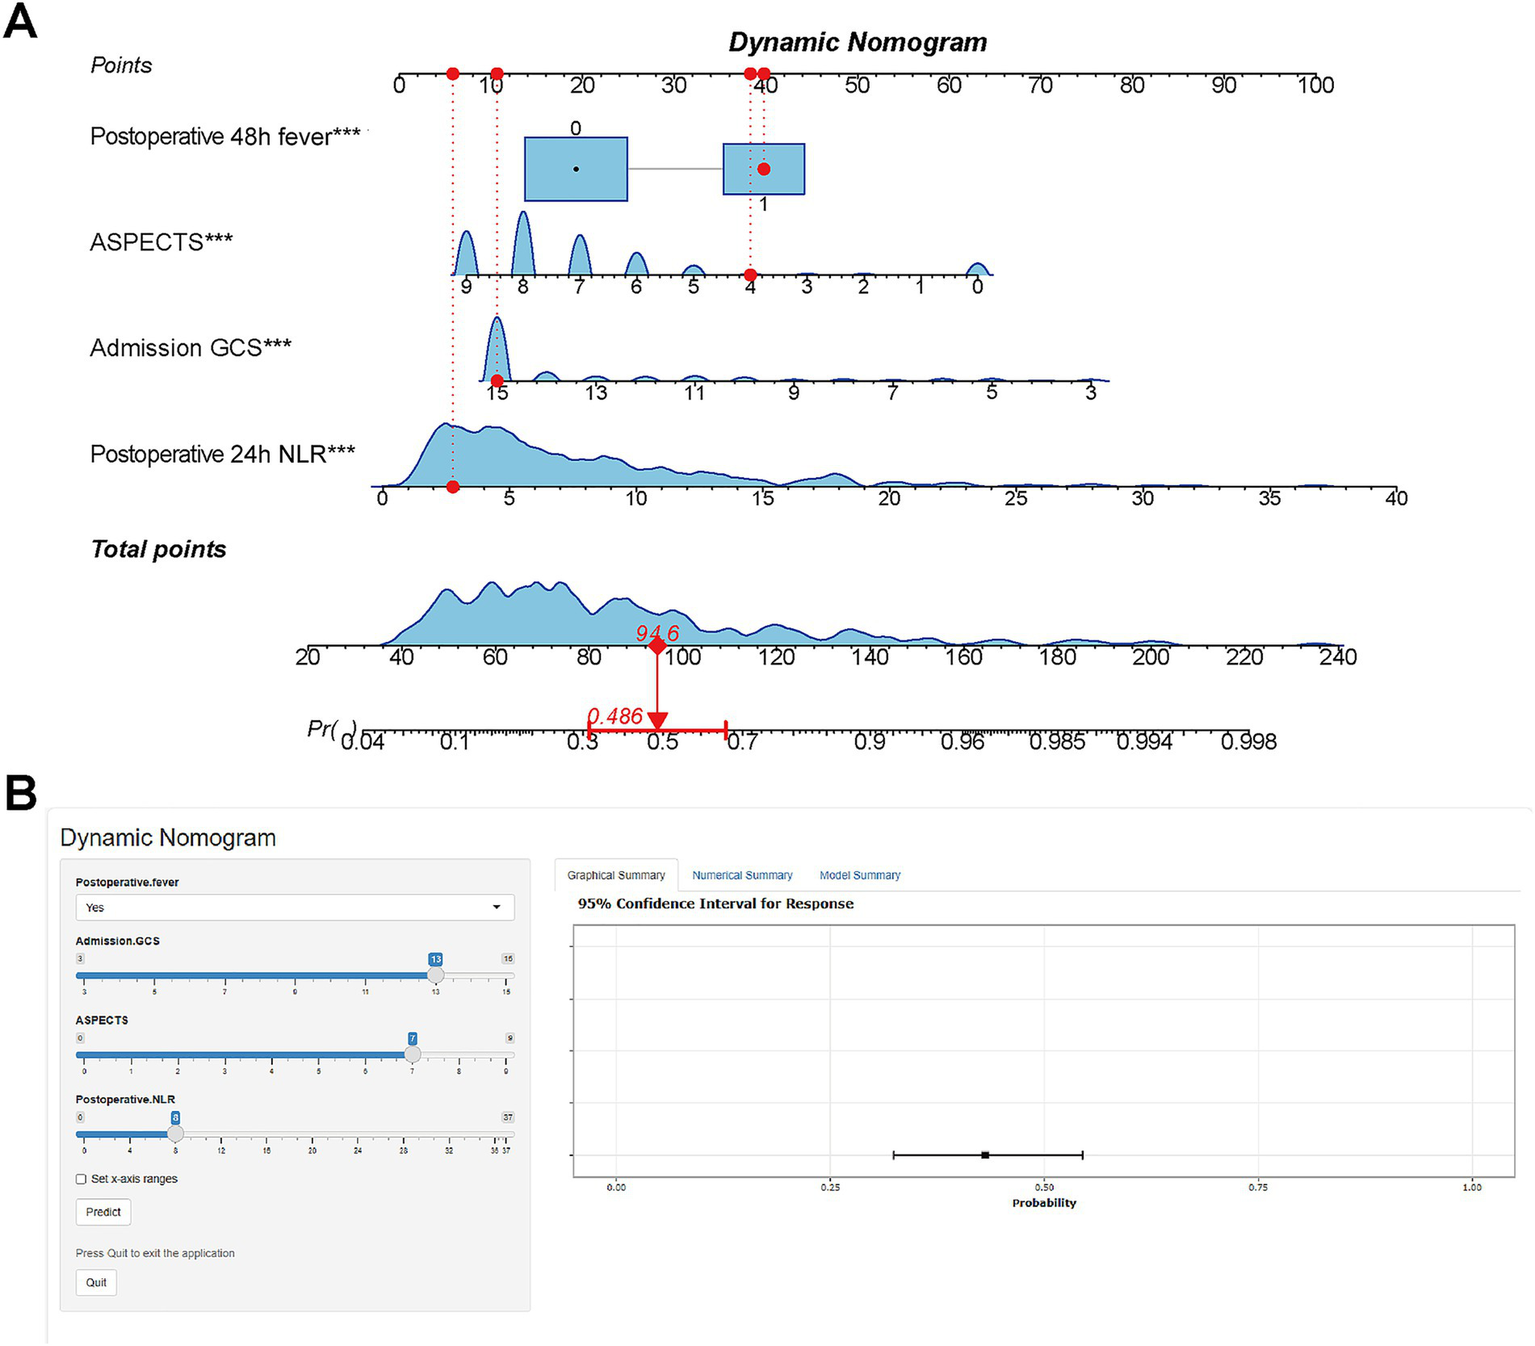
Nomogram for predicting HP risk in EVT patients. (A) Nomogram: variables assigned scores; total score estimates HP occurrence probability. (B) Web-based tool: Publicly accessible interactive nomogram for clinical use (https://StrokePredMod.shinyapps.io/dynnomapp/).
3.5 ROC validation of predictive model
To comprehensively assess the model’s discriminatory and diagnostic performance, we report key metrics including the area under the receiver operating characteristic curve (AUC), sensitivity (SEN), specificity (SPE), positive predictive value (PPV), and negative predictive value (NPV) at prespecified thresholds (0.219 for the training cohort and 0.494 for the validation cohort), each with 95% confidence intervals (CIs). As summarized in Table 2, the model achieved an AUC of 0.829 (training set) and 0.817 (validation set), indicating favorable discriminatory ability. At their respective thresholds, the training set showed SEN = 0.796, SPE = 0.706, PPV = 0.639, and NPV = 0.838; the validation set exhibited SEN = 0.638, SPE = 0.922, PPV = 0.802, and NPV = 0.802, all with corresponding 95% CIs. These results collectively demonstrate the model’s consistent and robust diagnostic performance across both cohorts (Figure 5).
Table 2
| Indicator | Training cohort (Cut-off = 0.219, 95% CI) |
Validation cohort (Cut-off = 0.494, 95% CI) |
|---|---|---|
| AUROC | 0.829 (0.781 ~ 0.877) | 0.817 (0.732 ~ 0.903) |
| Sensitivity | 0.796 (0.720 ~ 0.872) | 0.638 (0.501 ~ 0.776) |
| Specificity | 0.706 (0.639 ~ 0.772) | 0.922 (0.862 ~ 0.982) |
| PPV | 0.639 (0.538 ~ 0.739) | 0.802 (0.672 ~ 0.932) |
| NPV | 0.838 (0.785 ~ 0.889) | 0.802 (0.706 ~ 0.898) |
Diagnostic performance indicators of the model based on preset clinical decision thresholds.
CI, confidence interval; PPV, positive predictive value; NPV, negative predictive value.
Figure 5
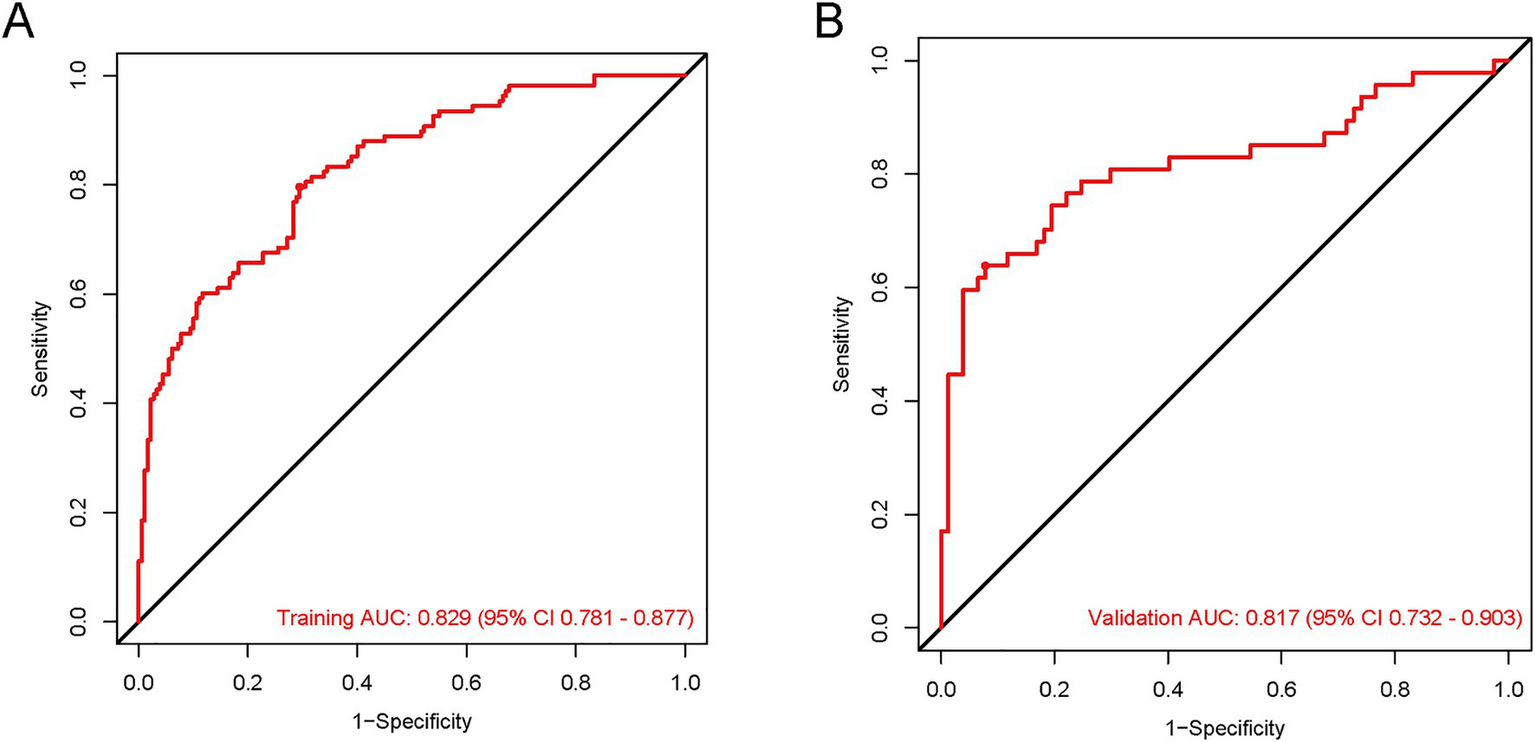
The ROC curves for the HP predictive nomogram in AIS-LVO patients after EVT. In the training cohort (A), the AUROC was 0.829 (95% CI: 0.781–0.877). For the validation cohort (B), the AUROC was 0.817 (95% CI: 0.732–0.903).
3.6 Measurement of model performance
To address model overfitting, this study employed the bootstrap optimism correction method and evaluated model performance via 10-fold cross-validation: First, a model was built on the entire original dataset and its apparent performance was recorded. Then, 1,000 bootstrap samples were generated through random sampling with replacement from the original dataset. For each sample, a logistic model was constructed, and its performance was evaluated both on the bootstrap sample and the original dataset. The difference between these two performances was calculated as the “optimism.” After 1,000 iterations, the average optimism was obtained and subtracted from the apparent performance of the original model to derive the optimism-corrected performance. For 10-fold cross-validation, the dataset was randomly divided into 10 equally sized subsets. In each iteration, one subset was used as the test set, while the remaining 9 subsets were combined to form the training set for model construction and evaluation. This process was repeated 10 times to ensure each subset served as the test set exactly once. Finally, the performance metrics were averaged across the 10 folds to robustly estimate the model’s generalization performance and mitigate the risk of overfitting (Table 3).
Table 3
| Measures | Fold cross-validation (CI 95%) | Bootstrap optimism-corrected (CI 95%) |
|---|---|---|
| AUROC | 0.822 (0.769–0.874) | 0.927 (0.910–0.952) |
| Sensitivity | 0.898 (0.850–0.946) | 0.961 (0.911–1.017) |
| Specificity | 0.596 (0.525–0.667) | 0.606 (0.519–0.694) |
| Accuracy | 0.784 (0.746–0.823) | 0.828 (0.802–0.858) |
| Precision | 0.786 (0.742–0.829) | 0.801 (0.765–0.836) |
| Recall | 0.898 (0.850–0.946) | 0.961 (0.911–1.017) |
Results of cross-validation and bootstrap analysis.
OR, odds ratio; CI, confidence interval.
3.7 Model performance and clinical value validation
To comprehensively validate the HP nomogram developed in this study, we systematically evaluated its performance across three critical dimensions: statistical calibration, clinical decision-making utility, and real-world clinical impact. Specifically, this section elaborates on: (1) the model’s ability to achieve agreement between predicted probabilities and actual HP incidence, as demonstrated by calibration curves (Figures 6A,B) and the Hosmer–Lemeshow test; (2) its net clinical benefit across a range of risk thresholds, illustrated via decision curve analysis (DCA, Figures 7A,B); and (3) its efficacy in stratifying and identifying high-risk patients, reflected by clinical impact curves (CIC, Figures 8A,B). Collectively, these findings confirm that the nomogram possesses reliable clinical utility in predicting postoperative HP following EVT in patients with AIS-LVO.
Figure 6
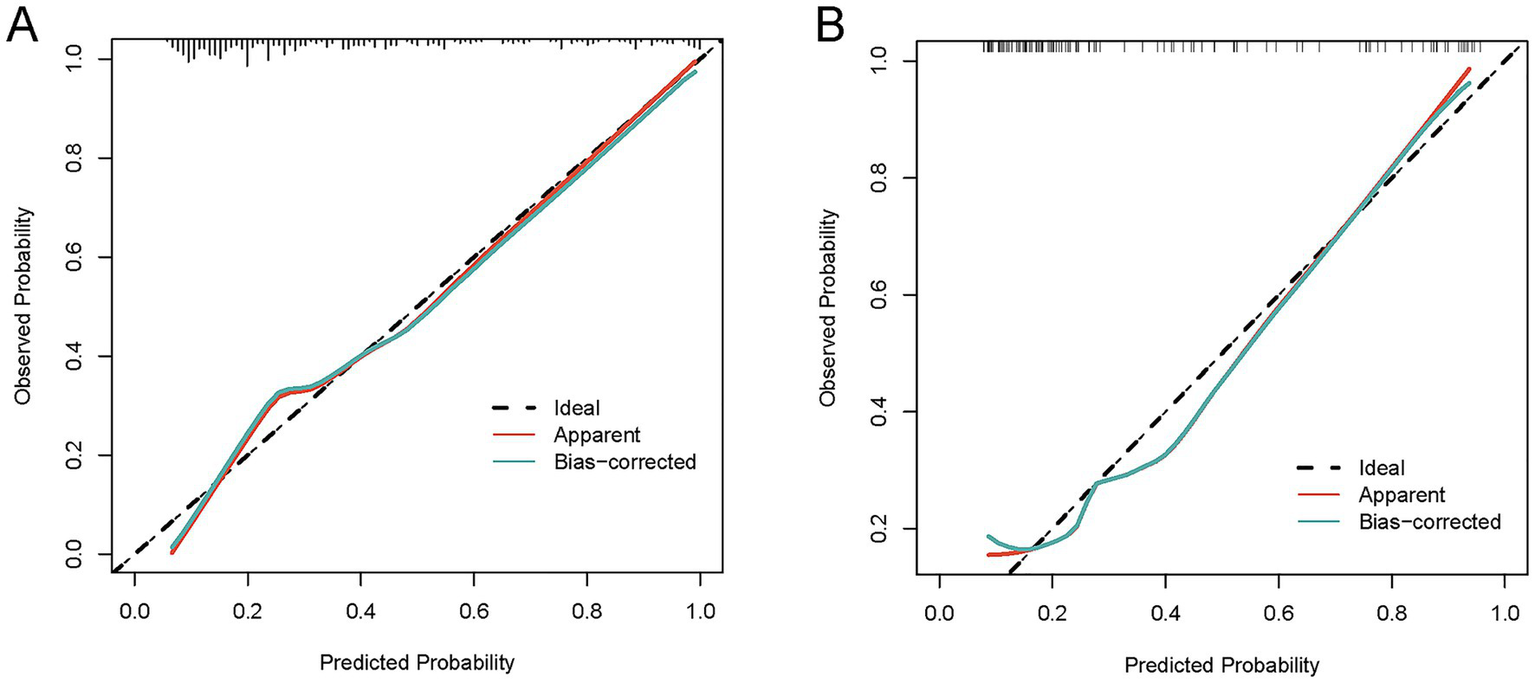
Calibration curves for the HP nomogram. In the training cohort (A), the calibration curve showed good alignment between the predicted probability curve and the ideal reference line. The Hosmer-Lemeshow test yielded χ2 = 8.9972, degrees of freedom (df) = 8, and p = 0.3425; the calibration slope was 0.9995, intercept was −0.042073, and Brier score was 0.1127. In the validation cohort (B), the calibration curve also demonstrated favorable alignment between the predicted probability curve and the ideal reference line. The Hosmer-Lemeshow test yielded χ2 = 6.4985, df = 8, and p = 0.5916; the calibration slope was 1.0582, intercept was 0.074823, and Brier score was 0.1506. These results indicate that the nomogram has reliable calibration performance in both cohorts, with predicted outcomes closely matching actual clinical observations.
Figure 7
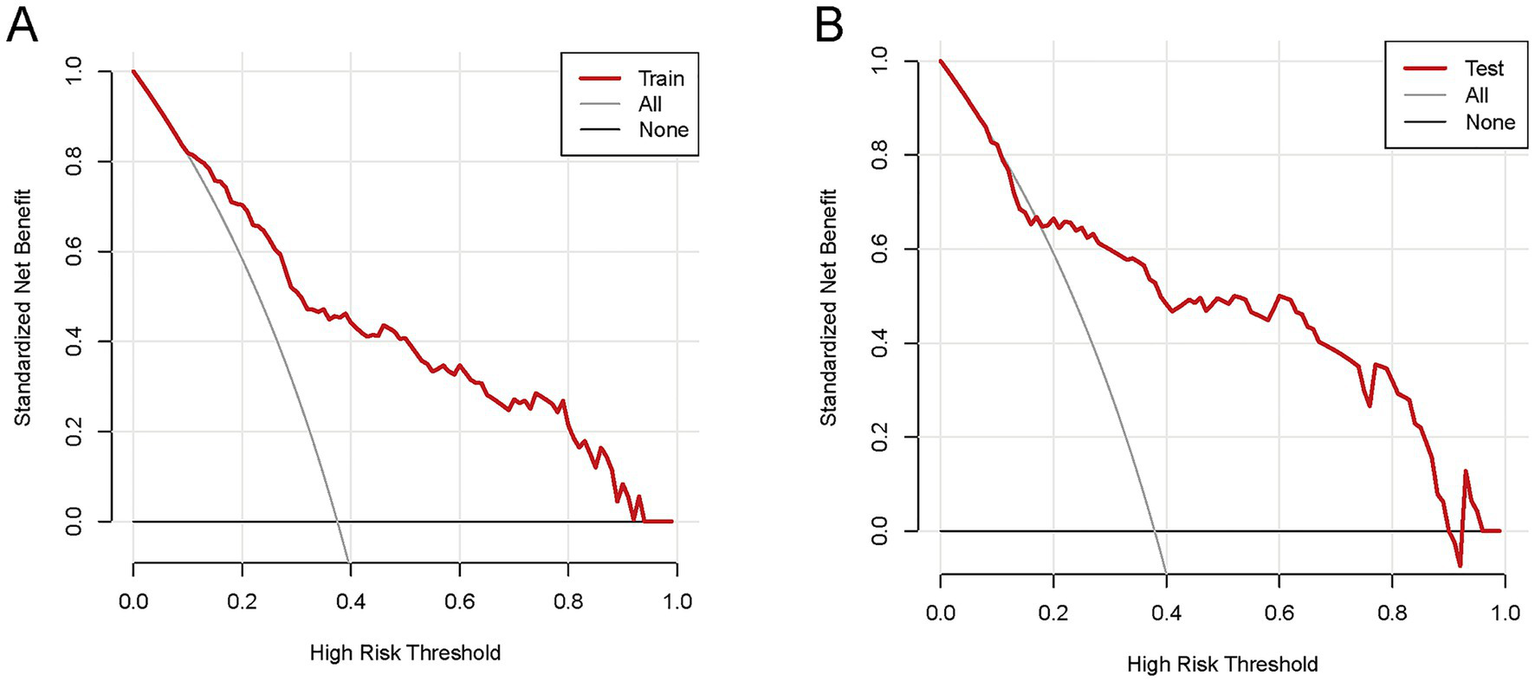
The DCA of the nomogram for predicting HP in AIS-LVO patients after EVT. In the training cohort (A), within the risk threshold range of 9–97%, the model’s net clinical benefit was higher than that of the two extreme strategies (“Treat all patients” and “Treat no patients”). In the validation cohort (B), within the risk threshold range of 11–94%, the model also yielded higher net clinical benefit than these two strategies. These results indicate that the nomogram exhibits reliable clinical utility in both cohorts, providing effective reference for clinical decision-making.
Figure 8
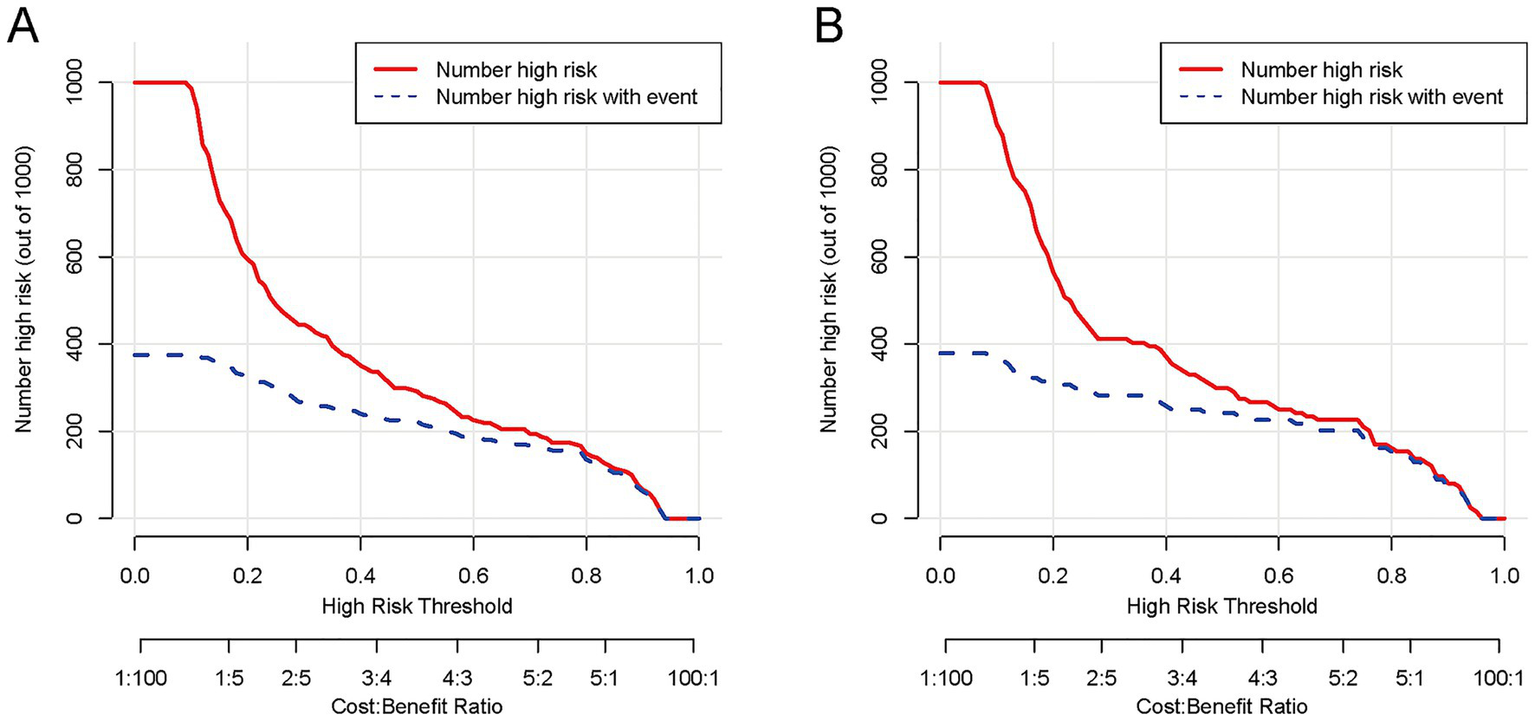
The CIC of the nomogram for predicting HP in AIS-LVO patients after EVT. In the training cohort (A), as the high-risk threshold increases, both the number of model-predicted high-risk patients (red solid line) and actual HP patients (blue dashed line) show a downward trend, with substantial overlap at ~80% threshold (minimizing overprediction). In the validation cohort (B), the curves exhibit a consistent downward trend with the training cohort, overlapping notably at ~80% threshold. These results indicate that the nomogram demonstrates reliable performance across both cohorts, efficiently identifying true HP patients while maintaining a low number needed to treat (NNT).
4 Discussion
Acute large vessel occlusion ischemic stroke (AIS-LVO) represents a critical neurological emergency with substantial morbidity and mortality (20, 21). Although endovascular therapy (EVT) is a primary treatment modality, postoperative hypostatic pneumonia (HP) can lead to prolonged hospitalization, increased economic burden for patients, and neurological recovery complications (22–24). Our study advances this field by developing and validating the first dedicated prediction model for hypostatic pneumonia specifically in EVT-treated AIS-LVO patients, employing rigorous statistical methodology and demonstrating robust clinical applicability.
Our nomogram identified four independent predictors of HP: (1) lower admission GCS scores, (2) postoperative 48 h fever, (3) elevated postoperative 24 h NLR, and (4) lower ASPECTS scores. These factors collectively reflect the multifactorial pathogenesis of HP, encompassing neurological impairment, systemic inflammation, and environmental exposure-related risks.
The association between impaired consciousness (as quantified by GCS) and pneumonia risk is mechanistically explained by the compromise of airway protective reflexes (25, 26). Our data corroborate previous findings while specifically establishing this relationship in the EVT population. The predictive value of postoperative fever likely reflects both systemic inflammatory response and blood–brain barrier disruption (27), and this pro-inflammatory microenvironment further exacerbates pulmonary secretion accumulation and immunosuppression induced by postoperative immobilization, creating favorable conditions for the development of HP (28). Our study extends current knowledge by demonstrating that early post-EVT fever carries particular prognostic significance, consistent with recent reports of EVT-specific complications (27, 29, 30).
A key methodological innovation of this study lies in the incorporation of the NLR as a practical and sensitive inflammatory marker for analysis. Unlike traditional laboratory parameters, NLR has been proven to be a more reliable indicator reflecting the balance between innate and adaptive immunity. Multiple studies have demonstrated a correlation between this parameter and the risk of nosocomial infections in critically ill patients (31, 32). NLR has been demonstrated to serve as a reflection of the status of systemic inflammation and immunological response (33). The inflammatory response induces the release of cytokines from immune cells, which leads to the creation of anti-inflammatory signals and the subsequent inhibition of cytokine production. This cascade of events serves to suppress infection and prevent disease advancement (34). Nonetheless, a prolonged inflammatory response has been shown to eventually deplete the immune system (35), thereby reducing systemic immunoreactivity, and suppressing systemic cellular immune responses (36). This, in turn, has been demonstrated to lead to an immediate reduction in peripheral blood lymphocyte subsets. This decrease was referred to as stroke-induced immunosuppression syndrome (SIDS). Our findings support the value of NLR in predicting HP following EVT for AIS-LVO patients: elevated NLR within 24 h postoperatively may reflect the dual effects of stroke-induced early inflammation and subsequent SIRS (17). This biphasic immune response creates a vulnerability window for HP—combined with core HP risk factors such as prolonged bed rest and reduced sputum excretion after EVT, suppressed cellular immunity further impairs the clearance of accumulated pulmonary secretions, while the early pro-inflammatory state lays the microenvironmental foundation for pulmonary infection. Collectively, these factors ultimately significantly increase the risk of HP.
Furthermore, NLR is a practical, accessible biomarker for helping to identify patients at higher risk for blood–brain barrier (BBB) disruption and worse prognosis. After ischemic stroke, there is a marked increase in neutrophil infiltration and a reduction in endothelial cell populations, indicating notable BBB disruption. And neutrophils release damage-associated molecular patterns (DAMPs) and matrix metalloproteinases (MMPs), which induce endothelial cell apoptosis and compromise BBB integrity (37). This, in turn, may lead to greater stroke severity, early neurological deterioration, and poor functional outcomes, while amplifying the systemic inflammatory response, further disrupting immune homeostasis and creating favorable conditions for the development of HP (37–39).
Our study also found that ASPECTS scores were negatively correlated with HP risk. As a standardized scale for assessing early ischemic infarction extent, ASPECTS scores directly reflect the size of the cerebral infarction core. From a pathophysiological perspective, lower ASPECTS scores (typically ≤5) indicate a larger infarction volume, which exacerbates the degree of neurological deficit—consistent with our finding that GCS scores are also an independent predictor (40). Expanded infarction can impair the brainstem swallowing center and cough reflex pathways, leading to dysphagia and decreased sputum excretion capacity, which increases the risk of aspiration and secretion accumulation, thereby elevating pneumonia risk (41–43). Meanwhile, large-area cerebral infarction (characterized by low ASPECTS scores) significantly increases the risk of pulmonary infection by triggering a series of immune responses, including leukocyte activation, pro-inflammatory cytokine release, and endothelial damage (40). The brain-pneumonia association involves immune pathways: low ASPECTS scores are correlated with elevated inflammatory markers (e.g., white blood cells, neutrophils, and NLR), indicating that severe ischemic injury can trigger a systemic inflammatory response and impair pulmonary defense (18, 40). Additionally, stroke-induced immunosuppression syndrome (SIDS), characterized by cell-mediated immune disorders and reduced cytokine production, creates a vulnerable window for bacterial invasion (44). This pathophysiological state of concurrent inflammation and immunosuppression highlights the mediating role of systemic inflammation and immunosuppression between brain injury and pneumonia, collectively forming a key bridge connecting severe brain injury and postoperative HP (45). These mechanisms explain the complementary predictive value of ASPECTS and postoperative NLR for pneumonia risk observed in our study.
5 Conclusion
The incidence of HP is significantly higher in AIS-LVO patients after EVT. This risk is associated with several factors: (1) lower admission GCS scores, (2) postoperative 48 h fever, (3) elevated postoperative 24 h NLR, and (4) lower ASPECTS scores. By using the scoring system to identify high-risk patients, clinicians can quickly implement targeted interventions, thereby preventing lung infections and improving patient prognosis.
6 Limitations
This study has certain limitations. (1) This study was a single-center retrospective investigation. Restricted by insufficient patient diversity across different clinical settings and populations, it inherently suffers from limited external validity and potential selection bias. Although we adopted two complementary methods—bootstrap optimism correction and 10-fold cross-validation—to reduce overfitting risk and enhance result robustness, and further strengthened internal validation and model stability through 1,000 bootstrap resamplings and coefficient of variation (CV) analysis (thereby improving the rigor of internal validation), external validation using multi-center independent datasets has not been performed. Therefore, future studies should prioritize this work to verify the generalizability of the model beyond the single-center population. (2) Due to the retrospective design, continuous dynamic follow-up data of laboratory indicators were unavailable. Although we minimized potential temporal ambiguity bias by strictly defining detection time points (e.g., NLR measured within 24 h after EVT) and excluding patients with preoperative baseline infections, the lack of longitudinal data still limits the evaluation of dynamic inflammatory responses. Additionally, inherent causal biases in observational data (such as unmeasured confounding variables or residual selection bias) cannot be completely eliminated, which may affect the validity of causal inference between predictors and HP risk. (3) Owing to limitations in retrospective data collection, key anatomical variables related to stroke prognosis and infection risk [e.g., involvement of vascular branches, collateral circulation status (e.g., ASITN/SIR grading)] were not included in the model. Furthermore, this study only focused on the short-term incidence of HP after EVT, and the long-term predictive performance of the model has not been evaluated. Future prospective multi-center studies should systematically incorporate anatomical and dynamic inflammatory indicators, extend the follow-up duration, and validate the model in diverse populations to further improve its completeness and predictive efficacy.
Statements
Data availability statement
The raw data supporting the conclusions of this article will be made available by the authors, without undue reservation.
Ethics statement
The studies involving humans were approved by the Ethical Committee of Dongguan Hospital of Guangzhou University of Chinese Medicine (Approval number: PJ [2025] No. 88). The studies were conducted in accordance with the local legislation and institutional requirement. The ethics committee/institutional review board waived the requirement of written informed consent for participation from the participants or the participants' legal guardians/next of kin due to the retrospective nature of the study.
Author contributions
JZ: Data curation, Validation, Conceptualization, Writing – review & editing, Software, Writing – original draft, Formal analysis, Visualization. WL: Writing – review & editing, Methodology, Formal analysis, Writing – original draft, Data curation, Conceptualization. YD: Writing – review & editing, Software, Visualization, Validation. XH: Writing – review & editing, Methodology, Software. JZhao: Formal analysis, Supervision, Writing – review & editing, Software. GL: Writing – review & editing, Data curation. ZC: Data curation, Writing – review & editing. KY: Writing – review & editing, Methodology. XW: Writing – review & editing, Data curation. BL: Data curation, Writing – review & editing. HD: Formal analysis, Writing – review & editing. ZL: Data curation, Writing – review & editing. ZZ: Supervision, Writing – review & editing, Investigation, Project administration. JC: Project administration, Investigation, Supervision, Writing – review & editing. QH: Supervision, Software, Investigation, Resources, Formal analysis, Project administration, Writing – review & editing. WN: Writing – review & editing, Investigation, Project administration, Funding acquisition, Resources.
Funding
The author(s) declared that financial support was not received for this work and/or its publication.
Conflict of interest
The author(s) declared that this work was conducted in the absence of any commercial or financial relationships that could be construed as a potential conflict of interest.
Generative AI statement
The author(s) declared that Generative AI was not used in the creation of this manuscript.
Any alternative text (alt text) provided alongside figures in this article has been generated by Frontiers with the support of artificial intelligence and reasonable efforts have been made to ensure accuracy, including review by the authors wherever possible. If you identify any issues, please contact us.
Publisher’s note
All claims expressed in this article are solely those of the authors and do not necessarily represent those of their affiliated organizations, or those of the publisher, the editors and the reviewers. Any product that may be evaluated in this article, or claim that may be made by its manufacturer, is not guaranteed or endorsed by the publisher.
Supplementary material
The Supplementary material for this article can be found online at: https://www.frontiersin.org/articles/10.3389/fneur.2025.1654147/full#supplementary-material
SUPPLEMENTARY MATERIAL 1Comparison of ROC values before and after data imputation in sensitivity analysis.
References
1.
GBD 2019 Stroke Collaborators. Global, regional, and national burden of stroke and its risk factors, 1990-2019: a systematic analysis for the global burden of disease study 2019. Lancet Neurol. (2021) 20:795–820. doi: 10.1016/s1474-4422(21)00252-0,
2.
Goyal M Demchuk AM Menon BK Eesa M Rempel JL Thornton J et al . Randomized assessment of rapid endovascular treatment of ischemic stroke. N Engl J Med. (2015) 372:1019–30. doi: 10.1056/Nejmoa1414905,
3.
Yoshimura S Sakai N Yamagami H Uchida K Beppu M Toyoda K et al . Endovascular therapy for acute stroke with a large ischemic region. N Engl J Med. (2022) 386:1303–13. doi: 10.1056/Nejmoa2118191,
4.
Bendszus M Fiehler J Subtil F Bonekamp S Aamodt AH Fuentes B et al . Endovascular thrombectomy for acute ischaemic stroke with established large infarct: multicentre, open-label, randomised trial. Lancet. (2023) 402:1753–63. doi: 10.1016/s0140-6736(23)02032-9,
5.
Huo X Ma G Tong X Zhang X Pan Y Nguyen TN et al . Trial of endovascular therapy for acute ischemic stroke with large infarct. N Engl J Med. (2023) 388:1272–83. doi: 10.1056/Nejmoa2213379,
6.
Badve MS Zhou Z Van De Beek D Anderson CS Hackett ML . Frequency of post-stroke pneumonia: systematic review and meta-analysis of observational studies. Int J Stroke. (2019) 14:125–36. doi: 10.1177/1747493018806196
7.
Ji R Shen H Pan Y Wang P Liu G Wang Y et al . Novel risk score to predict pneumonia after acute ischemic stroke. Stroke. (2013) 44:1303–9. doi: 10.1161/strokeaha.111.000598,
8.
Capel LH . Hypostatic pneumonia. Nurs Times. (1976) 72:485.
9.
Traver GA . The danger of hypostatic pneumonia. Nursing. (1974) 4:66–7.
10.
Lee HS Moon J Shin HR Ahn SJ Kim TJ Jun JS et al . Pneumonia in hospitalized neurologic patients: trends in pathogen distribution and antibiotic susceptibility. Antimicrob Resist Infect Control. (2019) 8:25. doi: 10.1186/s13756-019-0475-9,
11.
Effah CY Miao R Drokow EK Agboyibor C Qiao R Wu Y et al . Machine learning-assisted prediction of pneumonia based on non-invasive measures. Front Public Health. (2022) 10:938801. doi: 10.3389/fpubh.2022.938801,
12.
Warusevitane A Karunatilake D Sim J Smith C Roffe C . Early diagnosis of pneumonia in severe stroke: clinical features and the diagnostic role of C-reactive protein. PLoS One. (2016) 11:e0150269. doi: 10.1371/journal.pone.0150269,
13.
Song Y Zhang J Xing J Wang N Wang J . Comparison of high-flow nasal oxygen cannula therapy versus a standard oxygen face mask in patients with hypostatic pneumonia. J Int Med Res. (2021) 49:3000605211022279. doi: 10.1177/03000605211022279,
14.
Adams HP Davis PH Leira EC Chang KC Bendixen BH Clarke WR et al . Baseline Nih stroke scale score strongly predicts outcome after stroke: a report of the trial of org 10172 in acute stroke treatment (Toast). Neurology. (1999) 53:126–31. doi: 10.1212/wnl.53.1.126
15.
Saver JL Goyal M Van Der Lugt A Menon BK Majoie CBLM Dippel DW et al . Time to treatment with endovascular thrombectomy and outcomes from ischemic stroke: a meta-analysis. JAMA. (2016) 316:1279–88. doi: 10.1001/jama.2016.13647,
16.
Lin K Deng X Xiao Y Yang Z He Z Li X et al . Risk factors of stroke-associated pneumonia in patients with acute ischemic stroke treated by endovascular thrombectomy. BMC Neurol. (2025) 25:165. doi: 10.1186/s12883-025-04182-9,
17.
Ma F Li L Xu L Wu J Zhang A Liao J et al . The relationship between systemic inflammation index, systemic immune-inflammatory index, and inflammatory prognostic index and 90-day outcomes in acute ischemic stroke patients treated with intravenous thrombolysis. J Neuroinflammation. (2023) 20:220. doi: 10.1186/s12974-023-02890-y,
18.
Mourão AM Vicente LCC Abreu MNS Sant’Anna RV De Meira FCA Xavier RM d B et al . Clinical and molecular correlates of the ASPECTS in the acute phase of stroke. Arq Neuropsiquiatr. (2020) 78:262–8. doi: 10.1590/0004-282x20200001,
19.
Jiang C Fan Y Li Y Ma W . Study on the prognostic factors related to endovascular treatment of acute basilar artery occlusion within 24 hours of onset. J Investig Surg. (2025) 38:2442382. doi: 10.1080/08941939.2024.2442382,
20.
Hou S Zhang Y Xia Y Liu Y Deng X Wang W et al . Global, regional, and national epidemiology of ischemic stroke from 1990 to 2021. Eur J Neurol. (2024) 31:e16481. doi: 10.1111/ene.16481,
21.
Feigin VL Brainin M Norrving B Martins SO Pandian J Lindsay P et al . World stroke organization: global stroke fact sheet 2025. Int J Stroke. (2025) 20:132–44. doi: 10.1177/17474930241308142,
22.
De Jonge JC Takx RAP Kauw F de Jong PA Dankbaar JW van der Worp HB . Signs of pulmonary infection on admission chest computed tomography are associated with pneumonia or death in patients with acute stroke. Stroke. (2020) 51:1690–5. doi: 10.1161/strokeaha.120.028972,
23.
Herpich F Rincon F . Management of Acute Ischemic Stroke. Crit Care Med. (2020) 48:1654–63. doi: 10.1097/ccm.0000000000004597,
24.
Widimsky P Snyder K Sulzenko J Hopkins LN Stetkarova I . Acute ischaemic stroke: recent advances in reperfusion treatment. Eur Heart J. (2023) 44:1205–15. doi: 10.1093/eurheartj/ehac684,
25.
Deng Y Wang C Zhang Y . Risk factors for postoperative pneumonia in patients with posterior fossa meningioma after microsurgery. Heliyon. (2020) 6:e03880. doi: 10.1016/j.heliyon.2020.e03880,
26.
Kim JH Chung KM Lee JJ Choi HJ Kwon YS . Predictive modeling and integrated risk assessment of postoperative mortality and pneumonia in traumatic brain injury patients through clustering and machine learning: retrospective study. Biomedicine. (2023) 11:2880. doi: 10.3390/biomedicines11112880,
27.
Luo Y Chen M Fang J Dong S Ma M Bao J et al . Relationship between body temperature and early neurological deterioration after endovascular Thrombectomy for acute ischemic stroke with large vessel occlusion. Neurocrit Care. (2022) 37:399–409. doi: 10.1007/s12028-021-01416-9,
28.
Rombauts A Abelenda-Alonso G Cuervo G Gudiol C Carratalà J . Role of the inflammatory response in community-acquired pneumonia: clinical implications. Expert Rev Anti-Infect Ther. (2022) 20:1261–74. doi: 10.1080/14787210.2021.1834848,
29.
Krishnan R Mays W Elijovich L . Complications of mechanical Thrombectomy in acute ischemic stroke. Neurology. (2021) 97:S115–s25. doi: 10.1212/wnl.0000000000012803,
30.
Schaller-Paule MA Foerch C Bohmann FO Lapa S Misselwitz B Kohlhase K et al . Predicting poststroke pneumonia in patients with anterior large vessel occlusion: a prospective, population-based stroke registry analysis. Front Neurol. (2022) 13:824450. doi: 10.3389/fneur.2022.824450,
31.
Bartt R Sercy E Pirahanchi Y Frei D Jr Bar-Or D . Associations of neutrophil-lymphocyte ratios with reperfusion and functional outcomes in ischemic stroke after endovascular therapy. J Stroke Cerebrovasc Dis. (2022) 31:106843. doi: 10.1016/j.jstrokecerebrovasdis.2022.106843,
32.
Duan Z Wang H Wang Z Hao Y Zi W Yang D et al . Neutrophil-lymphocyte ratio predicts functional and safety outcomes after endovascular treatment for acute ischemic stroke. Cerebrovasc Dis. (2018) 45:221–7. doi: 10.1159/000489401,
33.
Yan D Dai C Xu R Huang Q Ren W . Predictive ability of systemic inflammation response index for the risk of pneumonia in patients with acute ischemic stroke. Gerontology. (2023) 69:181–8. doi: 10.1159/000524759,
34.
Johnston GR Webster NR . Cytokines and the immunomodulatory function of the vagus nerve. Br J Anaesth. (2009) 102:453–62. doi: 10.1093/bja/aep037,
35.
Shim R Wong CH . Ischemia, immunosuppression and infection--tackling the predicaments of post-stroke complications. Int J Mol Sci. (2016) 17:64. doi: 10.3390/ijms17010064,
36.
Liu DD Chu SF Chen C Yang PF Chen NH He X . Research progress in stroke-induced immunodepression syndrome (Sids) and stroke-associated pneumonia (sap). Neurochem Int. (2018) 114:42–54. doi: 10.1016/j.neuint.2018.01.002,
37.
Wang S Wang Y Wang S Sun Y du Y Zhang S et al . Single-cell Rna sequencing reveals S100A8/A9(hi) neutrophils-induced endothelial cell death and lymphocyte infiltration after ischemic stroke. Biochem Biophys Res Commun. (2024) 741:151023. doi: 10.1016/j.bbrc.2024.151023,
38.
Sarejloo S Kheradjoo H Haghi SE Es Haghi S Hosseini S Gargari MK et al . Neutrophil-to-lymphocyte ratio and early neurological deterioration in stroke patients: a systematic review and meta-analysis. Biomed Res Int. (2022) 2022:8656864. doi: 10.1155/2022/8656864,
39.
Xue J Huang W Chen X Li Q Cai Z Yu T et al . Neutrophil-to-lymphocyte ratio is a prognostic marker in acute ischemic stroke. J Stroke Cerebrovasc Dis. (2017) 26:650–7. doi: 10.1016/j.jstrokecerebrovasdis.2016.11.010,
40.
Zhao D Zhu J Cai Q Zeng F Fu X Hu K . The value of diffusion weighted imaging-Alberta stroke program early Ct score in predicting stroke-associated pneumonia in patients with acute cerebral infarction: a retrospective study. PeerJ. (2022) 10:e12789. doi: 10.7717/peerj.12789,
41.
Hoffmann S Harms H Ulm L Nabavi DG Mackert BM Schmehl I et al . Stroke-induced immunodepression and dysphagia independently predict stroke-associated pneumonia – the predict study. J Cereb Blood Flow Metab. (2017) 37:3671–82. doi: 10.1177/0271678x16671964,
42.
Krongsut S Soontornpun A Anusasnee N . Serial aspects to predict stroke-associated pneumonia after thrombolysis in patients with acute ischemic stroke. Front Neurol. (2024) 15:1364125. doi: 10.3389/fneur.2024.1364125,
43.
Yuan M Li Q Zhang R Zhang W Zou N Qin X et al . Risk factors for and impact of poststroke pneumonia in patients with acute ischemic stroke. Medicine. (2021) 100:e25213. doi: 10.1097/md.0000000000025213,
44.
Krongsut S Na-Ek N Soontornpun A Anusasnee N . Integrating the a(2)ds(2) score with 24-hour aspects and red cell distribution width for enhanced prediction of stroke-associated pneumonia following intravenous thrombolysis: model development and internal validation. Eur J Med Res. (2025) 30:28. doi: 10.1186/s40001-025-02282-3,
45.
Winklewski PJ Radkowski M Demkow U . Cross-talk between the inflammatory response, sympathetic activation and pulmonary infection in the ischemic stroke. J Neuroinflammation. (2014) 11:213. doi: 10.1186/s12974-014-0213-4,
Summary
Keywords
acute ischemic stroke with large vessel occlusion, endovascular therapy, hypostatic pneumonia, nomogram, postoperative complications
Citation
Zhu J, Liang W, Ding Y, He X, Zhao J, Li G, Chen Z, Yang K, Wu X, Liao B, Deng H, Liang Z, Zhao Z, Chen J, He Q and Ning W (2026) Development and validation of a prognostic nomogram for predicting hypostatic pneumonia risk in large vessel occlusion stroke after endovascular therapy patients. Front. Neurol. 16:1654147. doi: 10.3389/fneur.2025.1654147
Received
14 July 2025
Revised
09 December 2025
Accepted
10 December 2025
Published
07 January 2026
Volume
16 - 2025
Edited by
Marta Iacobucci, Umberto 1 Hospital, Italy
Reviewed by
Weixiong Zeng, Southern Medical University, China
Mingjun Pu, Mianyang Central Hospital, China
Updates
Copyright
© 2026 Zhu, Liang, Ding, He, Zhao, Li, Chen, Yang, Wu, Liao, Deng, Liang, Zhao, Chen, He and Ning.
This is an open-access article distributed under the terms of the Creative Commons Attribution License (CC BY). The use, distribution or reproduction in other forums is permitted, provided the original author(s) and the copyright owner(s) are credited and that the original publication in this journal is cited, in accordance with accepted academic practice. No use, distribution or reproduction is permitted which does not comply with these terms.
*Correspondence: Weimin Ning, naobingke36@163.com; Qiuxing He, heqiuxing93@126.com; Jingyi Chen, 13500091082@163.com
†These authors have contributed equally to this work and share first authorship
Disclaimer
All claims expressed in this article are solely those of the authors and do not necessarily represent those of their affiliated organizations, or those of the publisher, the editors and the reviewers. Any product that may be evaluated in this article or claim that may be made by its manufacturer is not guaranteed or endorsed by the publisher.