Abstract
Objective:
To evaluate the clinical utility of integrating baseline non-contrast computed tomography (NCCT) radiomics with clinical and surgical parameters for predicting 90-day postoperative functional outcomes in patients with spontaneous supratentorial intracerebral hemorrhage (sICH).
Materials and methods:
We retrospectively analyzed data from 220 patients with sICH who underwent surgical treatment from January 2022 to January 2025. Patients from Center 1 (n = 154) formed the training cohort, and those from Center 2 (n = 66) served as the validation cohort. Functional outcomes at 90 days were stratified using the modified Rankin Scale. Independent clinical risk factors were identified via univariate and multivariate analyses to construct a clinical model. Radiomics features extracted from baseline NCCT images were screened using elastic net regression with 10-fold cross-validation to generate a radiomics score (Radscore). A combined model was constructed by integrating Radscore into the clinical model, and its performance was evaluated using receiver operating characteristic curves, with visualization as a nomogram.
Results:
Six independent clinical risk factors (age, hydrocephalus, brain herniation, hematoma location, hematoma volume, surgical duration) and three optimal radiomics features (Flatness, Least axis length, VolumeCC) were identified. The combined model achieved the highest area under the receiver operating characteristic curve values: 0.882 in the training cohort and 0.865 in the validation cohort, outperforming the clinical model (0.844, 0.830) and Radscore (0.769, 0.743).
Conclusion:
NCCT radiomics integrated with clinical parameters effectively predicts 90-day postoperative outcomes in sICH. The combined model, visualized as a nomogram, aids preoperative risk stratification and personalized treatment.
Introduction
Spontaneous intracerebral hemorrhage (ICH) is a neurological emergency with high morbidity and mortality, imposing a heavy burden on patients, families, and society (1). Early surgical interventions, including craniotomy evacuation of hematoma and minimally invasive puncture drainage, have emerged as important therapeutic strategies to improve the quality of life of ICH patients. These interventions achieve benefits by rapidly reducing intracranial pressure, alleviating hematoma mass effect, and mitigating secondary brain injury (2). However, clinically significant interindividual variability in postoperative functional recovery is commonly observed, which may stem from baseline clinical conditions, surgical variables, and hematoma characteristics (3–5). This variability underscores the critical need for individualized prognostic evaluations to inform clinical decision-making (1).
Baseline clinical features play a pivotal role in influencing surgical decision-making and treatment outcomes. Studies have identified age and neurological deficits as independent risk factors for poor postoperative outcomes in ICH patients (6). Additionally, surgical approaches are closely related to outcomes: craniotomy is more effective for evacuating superficial lobar hematomas, while minimally invasive techniques (e.g., stereotactic puncture) offer advantages in minimizing damage to healthy brain tissue (1, 7). Nevertheless, existing research has predominantly focused on comparing the efficacy of individual surgical techniques, with a paucity of systematic investigations into the association between procedural details (e.g., surgical duration, intraoperative blood loss, transfusion volume) and clinical outcomes.
Hematoma characteristics also exert a significant impact on functional outcomes after ICH. Traditional computed tomography (CT) parameters, such as hematoma volume, location, and intraventricular extension, have been incorporated into various prognostic scoring systems, including the Intracerebral Hemorrhage Scale and Intracerebral Hemorrhage Functional Outcome Scale (8). Hematoma heterogeneity, encompassing features like irregular morphology and density variations, has also been reliably shown to predict poor outcomes in ICH patients (9). In recent years, radiomics has facilitated the quantitative characterization of hematoma heterogeneity by extracting high-throughput texture, morphological, and histogram features from CT images, demonstrating promising efficacy in predicting 90-day poor postoperative outcomes in spontaneous ICH patients (10, 11). However, radiomics studies on postoperative functional outcomes have been restricted to specific surgical techniques (e.g., craniotomy or stereotactic hematoma removal), highlighting an unmet need for more comprehensive predictive tools.
To address these gaps, the present study systematically integrates patients’ baseline clinical data, key surgical parameters, and radiomics features extracted from baseline hematoma images to develop and validate a predictive model for 90-day poor postoperative outcomes in spontaneous supratentorial intracerebral hemorrhage (sICH) patients undergoing diverse surgical approaches. This model aims to provide robust support for clinicians in preoperative risk stratification, postoperative recovery prediction, and the optimization of personalized treatment strategies.
Materials and methods
Study patients and clinical data
Patients with spontaneous sICH who had completed surgical treatment were retrospectively enrolled from two centers: Center 1 (the Second Affiliated Hospital of Chongqing Medical University, Chongqing, China) and Center 2 (People’s Hospital of Linshui County, Guang’an, China), with enrollment spanning from January 2022 to January 2025. SICH was diagnosed based on non-contrast computed tomography (NCCT) findings demonstrating parenchymal hemorrhage. Inclusion criteria were: (1) sICH confirmed by preoperative NCCT; (2) patients who underwent surgical intervention within 72 h of symptom onset. Exclusion criteria included: (1) secondary hemorrhage due to trauma, aneurysms, arteriovenous malformations, cerebral infarction, intracranial tumors, or coagulation disorders; (2) isolated intraventricular hemorrhage or concurrent cerebellar/brainstem hemorrhage; (3) severe imaging artifacts (e.g., metal or motion artifacts) affecting analysis; (4) loss to follow-up or missing key clinical or imaging data. Center 1 served as the training cohort, and Center 2 as the validation cohort.
Baseline NCCT images and clinical data were collected retrospectively, including demographic characteristics, medical history, admission vital signs, and laboratory results. Postoperative modified Rankin Scale (mRS) scores at 90 days were obtained via telephone interviews follow-up or review of electronic medical records. Patients were categorized into two groups: favorable outcome (mRS 0–3), which included mRS 0 (no neurological deficits), 1 (minor stroke-related symptoms), 2 (mild disability), and 3 (moderate disability); and poor outcome (mRS 4–6), which included mRS 4 (severe disability), 5 (profound disability), and 6 (death).
Surgical data
All patients were managed in accordance with the latest Chinese Guidelines for the Diagnosis and Treatment of Intracerebral Hemorrhage 2019 (12). For patients with lobar hemorrhage > 30 mL and located within 1 cm of the cortical surface, standard craniotomy for supratentorial hematoma evacuation or minimally invasive hematoma evacuation could be considered. When patients exhibited progressive neurological deterioration or life-threatening cerebral herniation, the attending chief or associate chief physician evaluated the necessity of surgery and determined the surgical approach. Included surgical modalities consisted of traditional craniotomy, microscopic hematoma evacuation, neuroendoscopic hematoma evacuation, and hematoma puncture or external ventricular drainage. Surgical data were collected for subsequent analysis, including time interval from preoperative NCCT to surgery, surgical timing (defined as the interval from symptom onset to surgery), surgical duration (defined as the total duration of the surgical procedure), intraoperative blood loss, and intraoperative blood transfusion volume.
Imaging acquisition
NCCT scans were performed using CT scanners (Philips Medical Systems; Canon Medical Systems) with standardized acquisition parameters: tube voltage 120 kV, tube current 250–300 mA, matrix 512 × 512, gantry rotation time 0.4–0.6 s, field of view 25 cm, and slice thickness 1 mm. All images were digitally stored in the picture archiving and communication system (PACS) for subsequent analysis.
Radiomics analysis
Image Segmentation: Baseline NCCT images were retrieved from PACS and exported in the format of digital imaging and communications in medicine. Hematoma regions were semi-automatically segmented using ITK-SNAP software (version 3.8.0, http://www.itksnap.org). Regions of interest (ROIs) were delineated by an experienced radiologist with ≥ 5 years of neuroimaging experience, who was blinded to clinical outcomes and follow-up data to avoid bias.
Image Preprocessing: To mitigate potential biases introduced by variations in scanning devices and acquisition parameters, NCCT images underwent preprocessing steps: (1) voxel resampling to a uniform spatial resolution of 1 × 1 × 1 mm3; (2) grayscale intensity discretization into 256 bins; (3) standardization of window settings to a width of 90 Hounsfield units (HU) and a level of 40 HU. These steps ensured consistent scaling and spatial resolution across all images, enhancing the comparability of extracted radiomics features.
Feature extraction
Radiomics feature extraction was performed using Python software (version 3.2). A total of 107 radiomics features were automatically extracted from each ROI, encompassing eight categories: 2D morphological features, 3D morphological features, first-order statistics, gray-level co-occurrence matrix, gray-level run-length matrix, gray-level size zone matrix, gray-level dependence matrix, and neighborhood gray-tone difference matrix.
To assess the stability of segmentation and feature extraction, 30 randomly selected NCCT images were re-annotated and re-analyzed by the same radiologist after 4 weeks interval and by another radiologist (with 2 years of working experience) using the same segmentation protocol using ITK-SNAP. Radiomics features were extracted from all sets of segmentations (the original, the intra-observer repeat, and the two inter-observer). Intraclass correlation coefficients (ICCs) were computed to evaluate feature consistency, with features exhibiting ICC ≥ 0.75 considered stable. Optimal features were further selected via elastic net regression with 10-fold cross-validation to reduce dimensionality and avoid overfitting.
Model construction and validation
In the training cohort, univariate analyses were first performed to identify clinical factors associated with 90-day poor outcomes, with factors showing p < 0.1 included in subsequent multivariate analysis. Features with statistical significance in multivariate analysis (p < 0.05) were retained to construct a clinical prediction model using logistic regression.
The radiomics score (Radscore) was calculated using the formula: Radscore, where denotes the i-th radiomics feature and represents its corresponding coefficient derived from elastic net regression. A combined model was then developed using logistic regression, by integrating the Radscore with the significant independent clinical risk factors identified from the multivariate analysis.
The combined model, Radscore and clinical model were validated in the validation cohort.
Statistical analysis
Statistical analyses were performed using SPSS software (version 19.0; IBM Corp., Armonk, NY, United States). Continuous data with normal distribution were presented as mean ± standard deviation and compared using independent samples t-tests; non-normally distributed continuous data were expressed as median (interquartile range) and compared using the Mann–Whitney U test. Categorical data were presented as counts (percentages) and compared using the χ2 test or Fisher’s exact test when expected cell counts were < 5.
Receiver operating characteristic (ROC) curves and AUCs were used to evaluate the predictive performance of the clinical model, Radscore, and the combined model. Differences in AUC between models were compared using the DeLong test. The optimal model was visualized as a nomogram. Calibration curves and decision curve analysis (DCA) were used to evaluate the model’s calibration and clinical utility, respectively. Statistical significance was set at p < 0.05.
Results
Clinical characterization
A total of 457 patients were screened at Center 1 (training cohort) and 224 at Center 2 (validation cohort), with 154 and 66 patients ultimately included, respectively. Exclusion criteria were consistent across both centers, with excluded patients distributed by reason as follows: secondary hemorrhage (212 in Center 1 vs. 104 in Center 2), isolated intraventricular or concurrent cerebellar/brainstem hemorrhage (40 vs. 18), severe imaging artifacts (6 vs. 4), and incomplete baseline data (45 vs. 32). In total, 303 patients were excluded from Center 1 and 158 from Center 2.
The distribution of surgical approaches in the training and validation cohorts was as follows: traditional craniotomy (33 [21.4%] vs. 11 [16.7%]), microscopic hematoma evacuation (48 [31.2%] vs. 20 [30.3%]), neuroendoscopic evacuation (32 [20.8%] vs. 11 [16.7%]), and hematoma puncture or external ventricular drainage (41 [26.6%] vs. 24 [36.4%]). No significant differences were observed in clinical data between the training and validation cohorts (all p > 0.05), indicating good consistency in patient demographics across cohorts (Table 1).
Table 1
| Variables | Center 1 (n = 154) | Center 2 (n = 66) | P |
|---|---|---|---|
| Age (y) | 58.85 ± 14.28 | 59.23 ± 13.34 | 0.855 |
| Male/Female | 115/39 | 49/17 | 1.000 |
| Hypertension | 93 (60.4%) | 47 (71.2%) | 0.169 |
| Coronary heart disease | 10 (6.5%) | 7 (10.6%) | 0.440 |
| Diabetes | 16 (10.4%) | 9 (13.6%) | 0.643 |
| Temperature (°C) | 36.5 (36.50, 36.68) | 36.5 (36.50, 36.70) | 0.640 |
| Systolic blood pressure (mmHg) | 172.80 ± 30.88 | 172.12 ± 29.36 | 0.880 |
| Diastolic blood pressure (mmHg) | 98.88 ± 19.32 | 101.584 ± 18.86 | 0.340 |
| GCS score | 9.00 (6.25, 13.00) | 8.00 (6.00, 12.00) | 0.447 |
| Pupil abnormality | 70 (45.5%) | 33 (50.0%) | 0.637 |
| Blood glucose (mmol/L) | 7.94 (6.80, 9.66) | 8.38 (6.93, 9.40) | 0.651 |
| D-Dimer (mg/L) | 345.85 (150.48, 799.40) | 420.00 (188.73, 951.42) | 0.477 |
| C-reactive protein (mg/L) | 3.31 (1.29, 6.50) | 3.45 (1.99, 10.52) | 0.105 |
| Neutrophil-lymphocyte ratio | 10.30 (6.44, 16.95) | 12.37 (7.35, 19.83) | 0.233 |
| Hemoglobin (g/L) | 133.51 ± 21.13 | 135.03 ± 20.66 | 0.642 |
| Platelet count (109/L) | 197.60 ± 65.23 | 201.55 ± 54.56 | 0.667 |
| Activated partial Thromboplastin time (s) | 33.20 (30.72, 35.77) | 33.05 (31.42, 35.50) | 0.858 |
| International normalized ratio | 0.98 (0.93, 1.03) | 0.98 (0.93, 1.03) | 0.889 |
| Fibrinogen (mg/dL) | 2.98 ± 0.76 | 3.10 ± 0.67 | 0.280 |
| Hematoma volume | 50.90 (39.08, 76.92) | 46.45 (28.47, 70.50) | 0.222 |
| Hematoma location | 0.918 | ||
| Lobar hematoma | 37 (24.0%) | 17 (25.8%) | |
| Deep hematoma | 117 (76.0%) | 49 (74.2%) | |
| Hydrocephalus | 39 (25.3%) | 20 (30.0%) | 0.550 |
| Subarachnoid hemorrhage | 26 (16.9%) | 9 (13.6%) | 0.688 |
| Intraventricular hemorrhage | 92 (59.7%) | 35 (53.0%) | 0.439 |
| Brain herniation | 36 (23.4%) | 20 (30.3%) | 0.362 |
| Midline shift | 70 (45.5%) | 30 (45.5%) | 1.000 |
| Time interval from NCCT to surgery (h) | 4.00 (2.00, 7.00) | 4.00 (3.00, 8.00) | 0.654 |
| Surgical approach | 0.467 | ||
| Minimally invasive surgery | 121 (78.6%) | 55 (83.3%) | |
| Craniotomy | 33 (21.4%) | 11 (16.7%) | |
| Surgical duration (h) | 3.09 ± 1.77 | 3.08 ± 1.76 | 0.984 |
| Intraoperative bleeding (mL) | 122.00 (52.00, 422.00) | 200.00 (36.75, 422.00) | 0.939 |
| Blood transfusion (mL) | 56.86 ± 159.68 | 36.82 ± 113.25 | 0.356 |
| mRS score | 4.00 (3.00, 4.00) | 4.00 (3.00, 4.75) | 0.553 |
| Poor outcome | 95 (61.7%) | 43 (65.2%) | 0.738 |
| Early rehabilitation | 32 (20.8%) | 8 (12.1%) | 0.182 |
| Flatness | 0.23 ± 0.99 | 0.21 ± 1.00 | 0.898 |
| Least axis length | 0.05 ± 0.90 | 0.26 ± 1.09 | 0.127 |
| VolumeCC | 0.06 ± 0.05 | 0.05 ± 0.03 | 0.251 |
| Radscore | 20.79 ± 77.11 | 20.24 ± 94.54 | 0.964 |
Baseline data of sICH patients in the center 1 and center 2.
Data are expressed as mean ± standard deviation, median (1st quartile, 3rd quartile), or frequency (percentage).
In the training cohort (n = 154), 95 patients (62.3%) experienced poor 90-day outcomes. Detailed baseline characteristics are summarized in Table 2. Compared with the favorable outcome subgroup in the training cohort, patients with poor outcomes exhibited several distinct features: older age (p = 0.006); lower admission Glasgow Coma Scale (GCS) scores (p < 0.001); reduced preoperative hemoglobin levels (p = 0.001); larger hematoma volumes (p < 0.001); a higher proportion of deep-seated hematomas (p = 0.004); shorter time intervals from NCCT to surgery (p = 0.029); longer surgical duration (p = 0.017); greater intraoperative blood loss (p = 0.009); higher mRS scores (p < 0.001); and increased rates of pupillary abnormalities (p = 0.002), hydrocephalus (p = 0.001), brain herniation (p < 0.001), and midline shift (p = 0.015).
Table 2
| Variables | Poor outcome (n = 95) | Favorable outcome (n = 59) | P |
|---|---|---|---|
| Age (y) | 61.35 ± 13.64 | 54.83 ± 14.49 | 0.006 |
| Male/Female | 68/27 | 47/12 | 0.352 |
| Hypertension | 63 (66.3%) | 30 (50.8%) | 0.082 |
| Coronary heart disease | 8 (8.4%) | 2 (3.4%) | 0.371 |
| Diabetes | 12 (12.6%) | 4 (6.8%) | 0.376 |
| Temperature (°C) | 36.5 (36.5, 36.7) | 36.5 (36.5, 36.6) | 0.070 |
| Systolic blood pressure (mmHg) | 174.33 ± 32.64 | 170.34 ± 27.91 | 0.438 |
| Diastolic blood pressure (mmHg) | 97.97 ± 19.15 | 100.34 ± 19.66 | 0.461 |
| GCS score | 8.00 (6.00, 11.00) | 12.00 (9.00, 13.5) | <0.001 |
| Pupil abnormality | 53 (55.8%) | 17 (28.8%) | 0.002 |
| Blood glucose (mmol/L) | 8.45 (7.00, 9.86) | 7.67 (6.35, 9.07) | 0.054 |
| D-Dimer (mg/L) | 361.30 (160.55, 1163.25) | 292.30 (142.70, 579.50) | 0.173 |
| C-reactive protein (mg/L) | 3.32 (1.44, 6.33) | 3.30 (1.05, 7.14) | 0.676 |
| Neutrophil-lymphocyte ratio | 10.10 (6.84, 16.90) | 10.52 (5.94, 16.71) | 0.595 |
| Hemoglobin (g/L) | 129.18 ± 22.27 | 140.49 ± 17.12 | 0.001 |
| Platelet count (109/L) | 194.25 ± 70.73 | 202.98 ± 55.40 | 0.421 |
| Activated partial thromboplastin time (s) | 33.30 (30.90, 36.00) | 33.20 (30.70, 35.10) | 0.433 |
| International normalized ratio | 0.99 (0.93, 1.05) | 0.97 (0.93, 1.00) | 0.220 |
| Fibrinogen (mg/dL) | 3.02 ± 0.87 | 2.91 ± 0.55 | 0.388 |
| Hematoma volume | 57.50 (43.30, 87.40) | 44.70 (27.90, 57.00) | <0.001 |
| Hematoma location | 0.004 | ||
| Lobar hematoma | 15 (15.8%) | 22 (37.3%) | |
| Deep hematoma | 80 (84.2%) | 37 (62.7%) | |
| Hydrocephalus | 33 (34.7%) | 6 (10.2%) | 0.001 |
| Subarachnoid hemorrhage | 16 (16.8%) | 10 (16.9%) | 1.000 |
| Intraventricular hemorrhage | 63 (66.3%) | 29 (49.2%) | 0.052 |
| Brain herniation | 33 (34.7%) | 3 (5.1%) | <0.001 |
| Midline shift | 51 (53.7%) | 19 (32.2%) | 0.015 |
| Time interval from NCCT to surgery (h) | 4.00 (2.00, 6.00) | 5.00 (3.00, 9.00) | 0.029 |
| Surgical approach | 0.319 | ||
| Minimally invasive surgery | 72 (75.8%) | 49 (83.1%) | |
| Craniotomy | 23 (24.2%) | 10 (16.9%) | |
| Surgical duration (h) | 3.36 ± 1.87 | 2.66 ± 1.53 | 0.017 |
| Intraoperative bleeding (mL) | 222.00 (103.50, 422.00) | 122.00 (22.00, 322.00) | 0.009 |
| Blood transfusion (mL) | 67.96 ± 172.91 | 38.98 ± 135.21 | 0.275 |
| mRS score | 4.00 (4.00, 5.00) | 3.00 (2.00, 3.00) | <0.001 |
| Early rehabilitation | 21 (22.1%) | 11 (18.6%) | 0.756 |
| Flatness | 0.52 ± 0.92 | −0.24 ± 0.93 | <0.001 |
| Least axis length | 0.24 ± 0.83 | −0.26 ± 0.92 | 0.001 |
| VolumeCC | 0.07 ± 0.05 | 0.04 ± 0.02 | 0.001 |
| Radscore | 48.33 ± 64.63 | −23.55 ± 75.33 | <0.001 |
Baseline data of sICH patients in the training cohort.
Data are expressed as mean ± standard deviation, median (1st quartile, 3rd quartile), or frequency (percentage).
Multivariate analysis identified six independent predictors of poor 90-day outcomes: presence of hydrocephalus (p = 0.023), presence of brain herniation (p = 0.040), hematoma location (p = 0.027), hematoma volume (p = 0.016), and surgical duration (p = 0.025) (Table 3).
Table 3
| Variables | OR | 95% CI | P |
|---|---|---|---|
| Age | 1.040 | 1.005 ~ 1.077 | 0.026 |
| GCS score | 0.903 | 0.768 ~ 1.062 | 0.219 |
| Pupil abnormality | 1.783 | 0.623 ~ 5.104 | 0.281 |
| Hemoglobin | 0.980 | 0.958 ~ 1.003 | 0.087 |
| Hydrocephalus | 0.236 | 0.068 ~ 0.823 | 0.023 |
| Brain herniation | 0.179 | 0.035 ~ 0.923 | 0.040 |
| Midline shift | 0.917 | 0.336 ~ 2.500 | 0.865 |
| Hematoma location | 0.309 | 0.109 ~ 0.875 | 0.027 |
| Hematoma volume | 1.030 | 1.006 ~ 1.055 | 0.016 |
| Time interval from NCCT to surgery | 0.989 | 0.944 ~ 1.036 | 0.630 |
| Surgical duration | 1.549 | 1.057 ~ 2.271 | 0.025 |
| Intraoperative bleeding | 0.999 | 0.996 ~ 1.002 | 0.385 |
Multivariate analysis for poor outcome in the training cohort.
Radiomics analysis
Elastic net regression with 10-fold cross-validation was used to select optimal radiomics features from the training cohort, resulting in three stable features: Flatness, Least axis length, and VolumeCC. These features were incorporated to calculate the Radscore.
In the training cohort, the mean Radscore was significantly lower in the favorable outcome subgroup (−23.55 ± 75.33) compared with the poor outcome subgroup (48.33 ± 64.63; p < 0.001). A consistent pattern was observed in the validation cohort: the favorable outcome subgroup had a lower mean Radscore (−30.39 ± 77.31) than the poor outcome subgroup (47.33 ± 92.44; p = 0.001). After adjusting for clinical risk factors, Radscore remained an independent predictor of poor 90-day outcomes in sICH patients (odds ratio [OR] = 1.015; 95% confidence interval [CI]: 1.007–1.023; p < 0.001).
Reproducibility analyses confirmed the stability of both segmentations and radiomics features. Intra- and inter-observer analyses demonstrated that 104/107 (97.2%) and 100/107 (93.5%) features, respectively, exhibited ICCs greater than 0.75. All three features constituting the Radscore showed good reproducibility: Flatness (intra-observer ICC = 0.97 [95% CI: 0.942–0.987]; inter-observer ICC = 0.96 [95% CI: 0.911–0.979]), Least axis length (intra-observer ICC = 0.95 [95% CI: 0.889–0.974]; inter-observer ICC = 0.92 [95% CI: 0.840–0.961]), and VolumeCC (intra-observer ICC = 0.94 [95% CI: 0.870–0.969]; inter-observer ICC = 0.91 [95% CI: 0.828–0.958]). Critically, the composite Radscore itself also demonstrated exceptional intra-observer stability and inter-observer stability, with ICCs of 0.97 [95% CI: 0.930–0.984] and 0.95 [95% CI: 0.894–0.975].
Model prediction performance
The combined model (integrating clinical factors and Radscore) showed the highest predictive performance (Figure 1), with AUCs of 0.882 (95% CI: 0.820–0.928) in the training cohort and 0.865 (95% CI: 0.758–0.936) in the validation cohort. The clinical model alone achieved AUCs of 0.844 (95% CI: 0.777–0.898) in the training cohort and 0.830 (95% CI: 0.718–0.911) in the validation cohort, while Radscore alone yielded AUCs of 0.769 (95% CI: 0.694–0.833) and 0.743 (95% CI: 0.621–0.843) in the training and the validation cohorts, respectively.
Figure 1

ROC curves of the predictive model in the training cohort (A) and the validation cohort (B).
DeLong tests revealed that the combined model had a significantly higher AUC than Radscore alone in both the training cohort (p = 0.002) and the validation cohort (p = 0.044). However, no significant differences in AUC were observed between the combined model and the clinical model in either the training cohort (p = 0.068) or the validation cohort (p = 0.262). Similarly, no significant differences were found between the clinical model and Radscore in the training cohort (p = 0.140) or the validation cohort (p = 0.268).
Nomogram and evaluation curves
The combined model was visualized as a user-friendly nomogram to facilitate clinical application (Figure 2). Calibration curves demonstrated good agreement between predicted probabilities of poor 90-day outcomes and observed outcomes in both the training and the validation cohorts (Figure 3A). DCA confirmed that the combined model provided a high net benefit across a range of threshold probabilities, supporting its clinical utility (Figure 3B).
Figure 2
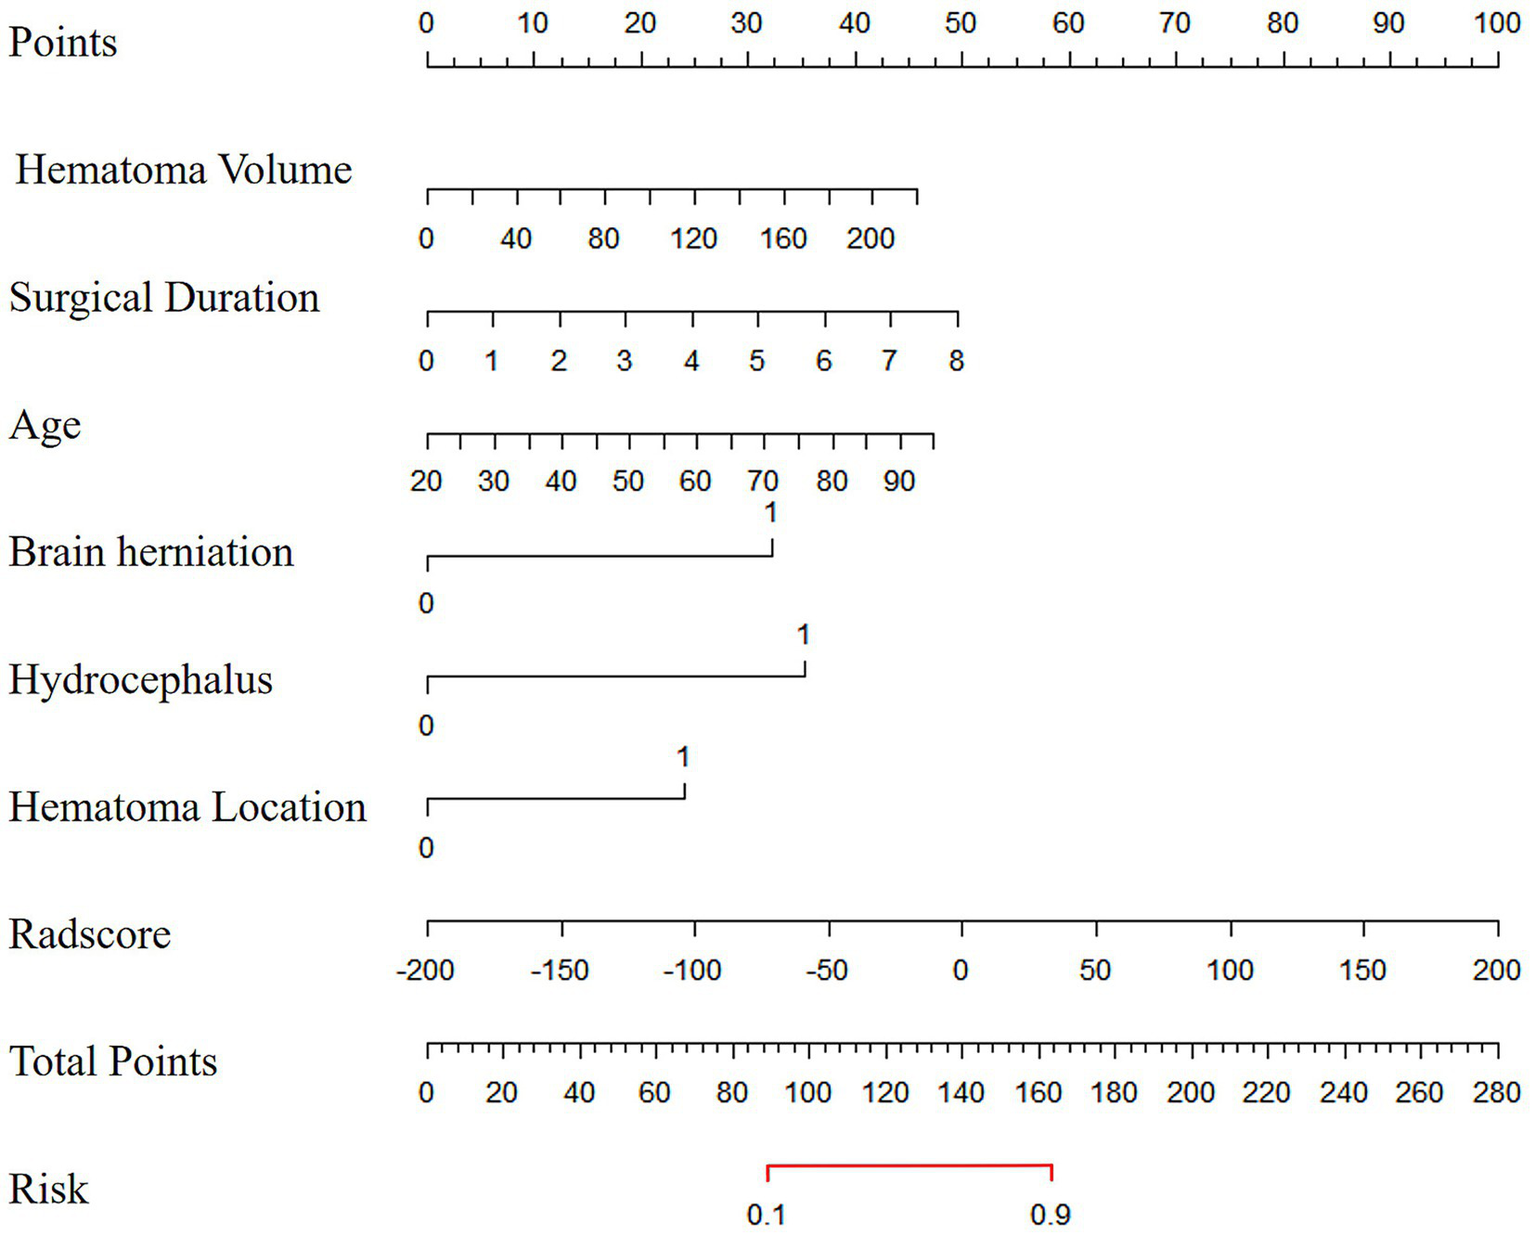
The nomogram diagram of the combined model.
Figure 3

Calibration curves (A) and decision curves (B) of the combined model in the validation cohort.
Discussion
This double-center study advances the field of sICH prognosis by systematically examining the relationships between baseline clinical characteristics, surgical parameters, hematoma radiomics features, and 90-day postoperative functional outcomes. We identified six independent clinical risk factors and three optimal radiomics features, then developed multiple predictive models for 90-day outcomes. Notably, the combined model demonstrated superior predictive performance, offering a practical tool to identify sICH patients at high risk of poor postoperative outcomes and support clinical decision-making.
Our analysis revealed that age, hydrocephalus, brain herniation, hematoma location, hematoma volume, and surgical duration are independent risk factors for poor 90-day postoperative outcomes in sICH patients. A key novel finding is that surgical duration emerges as an independent predictor of adverse functional outcomes, a relationship not previously highlighted in sICH research. Prolonged surgery may heighten the risks of surgical site infection (13) while exacerbating mechanical trauma or ischemia–reperfusion injury to brain tissue. This observation underscores the importance of preoperative planning: clinicians should estimate expected durations for different surgical approaches (e.g., craniotomy vs. minimally invasive puncture) using clinical and imaging data, then select strategies to minimize surgical time and tailor individualized plans, potentially improving postoperative recovery.
Consistent with prior studies (3), age was confirmed as an independent risk factor, likely due to age-related declines in organ reserve, higher burdens of comorbidities such as hypertension and hyperglycemia, and reduced surgical tolerance and recovery capacity in older patients. Hydrocephalus, a common sICH complication, was also linked to poor outcomes, aligning with findings by Bhattathiri et al. (14); its pathogenic mechanism may involve secondary injury from disrupted cerebrospinal fluid circulation. Brain herniation, by compressing cranial nerves and vasculature, can induce hemorrhage or ischemia, worsening neurological damage, and impairing outcomes (15).
We further observed that deep-seated hematomas correlate with worse functional outcomes compared to superficial hematomas, consistent with earlier reports (16). This may reflect greater vulnerability of functional fiber bundles to deep hemorrhage. For example, thalamic sICH often involves intraventricular extension and brainstem compression, exacerbating motor dysfunction (17). Larger baseline hematoma volumes also predicted poor outcomes, supporting previous evidence that hematoma size correlates with neurological injury severity (18). Collectively, these findings highlight that preoperative assessment of clinical and imaging features, including estimated surgical duration, can inform surgical planning to optimize patient outcomes.
Discussion on radiomics analysis results
From 107 radiomics features extracted from baseline NCCT images, we identified three optimal features, including Flatness, Least axis length, and VolumeCC, that strongly correlate with 90-day poor outcomes. The Flatness, which quantifies the ratio of the largest to smallest principal components of hematoma shape, reflects the degree of hematoma flattening in a given plane; higher values indicate more pronounced flattening. This feature has previously been shown to outperform some clinical factors in predicting postoperative outcomes (10), underscoring its value in capturing subtle morphological characteristics relevant to prognosis. The Least axis length, derived from the shortest axis of the ellipse enclosing the ROI, was validated as a prognostic marker, consistent with Zhang et al.’s work linking this feature to 180-day outcomes in spontaneous thalamic hemorrhage (19). The VolumeCC, calculated by multiplying ROI voxel count by single voxel volume, offers advantages over traditional methods like the ABC/2 formula; as noted by Alexander et al. (20), computer-assisted volume analysis better supports surgical decision-making by improving accuracy in evaluating indications and midline shift.
Notably, our feature selection yielded a parsimonious set of three features, a number fewer than the 5–8 predictors in many previous hemorrhage prognostic models (10), yet these features demonstrated strong statistical significance as independent risk factors. Together, they quantify hematoma morphology across multiple dimensions, with significant positive correlations with 90-day poor outcomes, aligning with Li et al.’s theory that hematoma morphological characteristics influence clinical prognosis (21). This quantitative framework provides clinicians with objective evidence to refine surgical indication assessment and develop personalized treatment plans.
Discussion on the performance of the prediction model
Historically, sICH outcome prediction has relied primarily on clinical indicators. For example, a deep learning-based model for hypertensive ICH, incorporating 64 clinical variables, achieved an AUC of 0.997 in the training cohort and 0.884 in the validation cohort, outperforming traditional scoring systems (22). In recent years, radiomics has enhanced predictive accuracy; Radscore has been validated as an independent predictor of hematoma expansion (23), and Zhang et al. developed a prognostic model with an AUC of 0.870 that remained robust in multicenter validation (10).
Integrating radiomics features with clinical variables enhances model performance, a finding supported by Huang et al., who demonstrated that adding radiomics features significantly improved the predictive accuracy of clinical models (24). In the current study, we constructed a Radscore using three selected features (Flatness, Least axis length, and VolumeCC) and then developed a combined model by integrating this Radscore with key clinical predictors. This combined model achieved AUC values of 0.882 in the training cohort and 0.865 in the validation cohort, outperforming the standalone Radscore model (0.769, 0.743) and the clinical model (0.844, 0.830). These results align with Zhang et al.’s observations that models integrating radiomics scores with clinical factors outperform single-modality models (19), highlighting the value of combining clinical insights with intrinsic hematoma features. Viet et al. similarly emphasized the superiority of clinical-imaging combined models, noting the limitations of relying solely on radiomics features (25), a conclusion reinforced by our data confirming the combined model’s stronger discriminative ability. This integrative approach represents a more effective predictive strategy, supporting precision medicine and optimizing surgical decision-making. Radiomics captures subtle heterogeneity in hematoma morphology, providing rich imaging-derived information to inform surgical planning. Additionally, our combined model exhibits strong calibration and clinical applicability; its conversion into a nomogram facilitates preoperative individualized risk assessment, making it a practical tool for clinical use. Based on the model’s predictions, patients with a favorable prognosis may confidently undergo standard surgical evacuation, whereas high-risk patients could be considered for less invasive strategies to minimize trauma, with the acceptance of potentially less complete evacuation.
Limitations
This study has several limitations. First, its retrospective design and relatively small sample size may restrict the model’s external validity. Although the statistical methods employed are commonly used, future studies could benefit from more advanced variable selection techniques to improve model stability. Second, several potentially influential variables were not included, such as anesthesia modality, intraoperative blood pressure management, congestive cardiac failure, cerebral amyloid angiopathy, prior use of anticoagulant or antiplatelet medications, and mean continuous blood pressure measurements from intensive care or stroke unit settings. Their absence may affect the predictive accuracy of the model. Future prospective studies should emphasize standardized collection of these comprehensive clinical variables across participating centers to improve the generalizability and clinical utility of predictive models. Third, the radiomics workflow remains a significant barrier to clinical translation. The reliance on manual feature extraction using Python-based tools renders the process time-consuming and poorly standardized. Future efforts should therefore focus on developing streamlined, automated solutions to facilitate practical implementation in routine clinical settings.
Conclusion
The combined model constructed in this study can effectively predict 90-day postoperative outcomes in sICH patients. By integrating clinical risk factors with quantitative radiomics features, this model supports preoperative risk stratification and personalized treatment planning, offering valuable clinical utility for optimizing sICH management.
Statements
Data availability statement
The original contributions presented in the study are included in the article/supplementary material, further inquiries can be directed to the corresponding author.
Ethics statement
The studies involving humans were approved by Ethics Committee of the People’s Hospital of Linshui County and the Second Affiliated Hospital of Chongqing Medical University. The studies were conducted in accordance with the local legislation and institutional requirements. The ethics committee/institutional review board waived the requirement of written informed consent for participation from the participants or the participants’ legal guardians/next of kin because Informed consent was waived due to the retrospective nature of the study. Written informed consent was not obtained from the individual(s) for the publication of any potentially identifiable images or data included in this article because Informed consent was waived due to the retrospective nature of the study.
Author contributions
WJ: Investigation, Conceptualization, Writing – review & editing, Software, Methodology, Formal analysis, Data curation, Visualization, Writing – original draft, Project administration. CZ: Writing – original draft, Software, Writing – review & editing, Investigation, Project administration, Methodology, Formal analysis, Data curation, Visualization, Conceptualization. JW: Resources, Data curation, Conceptualization, Writing – review & editing, Methodology. HX: Methodology, Software, Project administration, Resources, Validation, Writing – review & editing, Conceptualization. ZZ: Conceptualization, Funding acquisition, Methodology, Project administration, Resources, Supervision, Validation, Writing – review & editing.
Funding
The author(s) declared that financial support was received for this work and/or its publication. This work was supported by Chongqing medical scientific research project (joint project of Chongqing Health Commission and Science and Technology Bureau) (grant no. 2025MSXM009) and Natural Science Foundation of Chongqing, China (grant no. CSTB2022NSCQ-MSX0116).
Conflict of interest
The author(s) declared that this work was conducted in the absence of any commercial or financial relationships that could be construed as a potential conflict of interest.
Generative AI statement
The author(s) declared that Generative AI was not used in the creation of this manuscript.
Any alternative text (alt text) provided alongside figures in this article has been generated by Frontiers with the support of artificial intelligence and reasonable efforts have been made to ensure accuracy, including review by the authors wherever possible. If you identify any issues, please contact us.
Publisher’s note
All claims expressed in this article are solely those of the authors and do not necessarily represent those of their affiliated organizations, or those of the publisher, the editors and the reviewers. Any product that may be evaluated in this article, or claim that may be made by its manufacturer, is not guaranteed or endorsed by the publisher.
References
1.
Steven MG Wendy CZ Charlotte C Dar D Brandon F Joshua NG et al . Guideline for the management of patients with spontaneous intracerebral hemorrhage: a guideline from the american heart association/american stroke association. Stroke. (2022) 53:e282–361. doi: 10.1161/STR.0000000000000407
2.
Oliver PG Karl S . Surgery or conservative therapy for cerebral haemorrhage?Lancet. (2013) 382:377–8. doi: 10.1016/S0140-6736(13)61087-9
3.
Amel H Parmenion PT Andreas F Niklas M . Favorable clinical outcome following surgical evacuation of deep-seated and lobar supratentorial intracerebral hemorrhage: a retrospective single-center analysis of 123 cases. Acta Neurochir. (2018) 160:1737–47. doi: 10.1007/s00701-018-3622-9,
4.
Jun S Xuefei S Ruixiang G Guangfu D Xiaochun J . Risk factors for postoperative rebleeding and short-term prognosis of spontaneous cerebellar hemorrhage. Risk Manag Healthc Policy. (2021) 14:2045–53. doi: 10.2147/RMHP.S309286
5.
Yi-Chieh W Hsiang-Chih L Jang-Chun L Yu-Ching C Da-Tong J Dueng-Yuan H et al . Risk factors of postoperative hydrocephalus following decompressive craniectomy for spontaneous intracranial hemorrhages and intraventricular hemorrhage. Medicine (Baltimore). (2022) 101:e31086. doi: 10.1097/MD.0000000000031086
6.
João P Ana Sofia C José Manuel A José Manuel A Carla F . Intracerebral hemorrhage outcome: A comprehensive update. J Neurol Sci. (2019) 398:54–66. doi: 10.1016/j.jns.2019.01.013
7.
Yongjun Y Wenqiang C Yongfu C Fanfan C Jiancheng L Xiangyu W et al . Prognostic data analysis of surgical treatments for intracerebral hemorrhage. Neurosurg Rev. (2022) 45:2733–44. doi: 10.1007/s10143-022-01785-5
8.
Tiago G Sara P Pedro C Gabriel A Inês A Paulo Castro C et al . Assessment and comparison of the four Most extensively validated prognostic scales for intracerebral Hemorrhage: systematic review with Meta-analysis. Neurocrit Care. (2018) 30:449–66. doi: 10.1007/s12028-018-0633-6
9.
Andrea M Francesco A Gregoire B Andreas C . Noncontrast CT markers of intracerebral hemorrhage expansion and poor outcome: A meta-analysis. Neurology. (2020) 95:632–43. doi: 10.1212/WNL.0000000000010660
10.
Kangwei Z Xiang Z Qian X Xinyun W Baoqing Y Jinxi M et al . Outcome prediction of spontaneous supratentorial intracerebral Hemorrhage after surgical treatment based on non-contrast computed tomography: A Multicenter study. J Clin Med. (2023) 12:1580. doi: 10.3390/jcm12041580
11.
Jinwei L Cong L Junsun D Yang Z Hongmou C Xianlei Y et al . Predicting the 90-day prognosis of stereotactic brain hemorrhage patients by multiple machine learning using radiomic features combined with clinical features. Front Surg. (2024) 11:1344263. doi: 10.3389/fsurg.2024.1344263
12.
Chinese Society of N, Chinese Stroke S. Chinese guidelines for diagnosis and treatment of acute intracerebral hemorrhage 2019. Chin J Neurol. (2019) 52:994–1005. doi: 10.3760/cma.j.issn.1006-7876.2019.12.003
13.
Hang C Brian Po-Han C Ireena MS Nicole CF Chris GC Piet H . Prolonged operative duration increases risk of surgical site infections: a systematic review. Surg Infect. (2017) 18:722–35. doi: 10.1089/sur.2017.089
14.
Bhattathiri PS Gregson B Prasad KS Mendelow AD STICH Investigators . Intraventricular hemorrhage and hydrocephalus after spontaneous intracerebral hemorrhage: results from the STICH trial. Acta Neurochir Suppl. (2006) 96:65–8. doi: 10.1007/3-211-30714-1_16
15.
Berta RG José Ignacio ML Antonio Carlos HV Juan Alberto GM Oralia Cristina RR Roberto CA et al . Types of cerebral herniation and their imaging features. Radiographics. (2019) 39:1598–1610. doi: 10.1148/rg.2019190018
16.
Kangwei Z Lai W Xiang Z Baoqing Y Jinxi M Peijun W . Risk factors for poor outcomes of spontaneous supratentorial cerebral hemorrhage after surgery. J Neurol. (2021) 269:3015–25. doi: 10.1007/s00415-021-10888-w,
17.
Vahid E Pouya T-F Lucia R-L Dheeraj G Hasan A Adrian P-J et al . Influence of intracerebral hemorrhage location on outcomes in patients with severe intraventricular hemorrhage. Stroke. (2019) 50:1688–95. doi: 10.1161/STROKEAHA.118.024187
18.
Mingxing L Zijun W Xiankun M Yong Z Xiaoqun H Luo L et al . Predictive nomogram for unfavorable outcome of spontaneous intracerebral hemorrhage. World Neurosurg. (2022) 164:e1111–22. doi: 10.1016/j.wneu.2022.05.111
19.
Xi Z Yiwei Z Jie Z Yansong L Shang G Haopeng Z et al . Development and validation of a clinical-radiomics nomogram for predicting 180-day functional outcomes in patients with spontaneous thalamic hemorrhage. Neurosurg Rev. (2025) 48:496. doi: 10.1007/s10143-025-03653-4
20.
Alexander F-S Anders L Anders H , David NWMarcMMikaelSet alVolumetric assessment of traumatic intracranial hematomas: is ABC/2 reliable?J Neurotrauma2024;41:2545–2553. doi: 10.1089/neu.2024.0248.
21.
Qi L Wen-Song Y Sheng-Li C Fu-Rong L Fa-Jin L Xi H et al . Black hole sign predicts poor outcome in patients with intracerebral hemorrhage. Cerebrovasc Dis. (2018) 45:48–53. doi: 10.1159/000486163
22.
Masahito K Yukinari K Akihiro N Yasunaga Y Toshiya U . Postsurgical functional outcome prediction model using deep learning framework (prediction one, Sony network communications Inc.) for hypertensive intracerebral hemorrhage. Surg Neurol Int. (2021) 12:203. doi: 10.25259/SNI_222_2021
23.
Zhiming Z Xiaojia W Yuanyuan C Yuanxin T Yu Z Tianxing H et al . The relationship between perihematomal edema and hematoma expansion in acute spontaneous intracerebral hemorrhage: an exploratory radiomics analysis study. Front Neurosci. (2024) 18:1394795. doi: 10.3389/fnins.2024.1394795
24.
Xiaoyu H Dan W Qiaoying Z Yaqiong M Hui Z Shenglin L et al . Radiomics for prediction of intracerebral hemorrhage outcomes: a retrospective multicenter study. Neuroimage Clin. (2022) 36:103242. doi: 10.1016/j.nicl.2022.103242
25.
Viet Huan L Quang Hien K Tran Nguyen Tuan M Van Hiep N Van Long L Nguyen Quoc Khanh L . Development and validation of CT-based radiomics signature for overall survival prediction in multi-organ cancer. J Digit Imaging. (2023) 36:911–22. doi: 10.1007/s10278-023-00778-0
Summary
Keywords
spontaneous intracerebral hemorrhage, radiomics, non-contrast computed tomography, prognosis, postoperative
Citation
Jiang W, Zhou C, Wang J, Xu H and Zhou Z (2025) Predicting 90-day postoperative outcomes in spontaneous supratentorial intracerebral hemorrhage: a double-center study of clinical-radiomics integration using non-contrast CT. Front. Neurol. 16:1674276. doi: 10.3389/fneur.2025.1674276
Received
11 August 2025
Revised
20 November 2025
Accepted
03 December 2025
Published
16 December 2025
Volume
16 - 2025
Edited by
Ken Butcher, University of Alberta, Canada
Reviewed by
Leibo Liu, The George Institute for Global Health, Australia
Chris Kwan, Prince of Wales Hospital and Community Health Services, Australia
Updates
Copyright
© 2025 Jiang, Zhou, Wang, Xu and Zhou.
This is an open-access article distributed under the terms of the Creative Commons Attribution License (CC BY). The use, distribution or reproduction in other forums is permitted, provided the original author(s) and the copyright owner(s) are credited and that the original publication in this journal is cited, in accordance with accepted academic practice. No use, distribution or reproduction is permitted which does not comply with these terms.
*Correspondence: Zhiming Zhou, 303730@hospital.cqmu.edu.cn
†These authors have contributed equally to this work and share first authorship
Disclaimer
All claims expressed in this article are solely those of the authors and do not necessarily represent those of their affiliated organizations, or those of the publisher, the editors and the reviewers. Any product that may be evaluated in this article or claim that may be made by its manufacturer is not guaranteed or endorsed by the publisher.