Abstract
Introduction:
Mild traumatic brain injury (mTBI) is a heterogeneous condition with long-term sequelae, yet diagnosis in the chronic stage remains limited by reliance on acute criteria and subjective reports. Objective biomarkers are needed, as current blood-based markers show diagnostic value primarily in the acute and subacute phases. Resting-state EEG (RS-EEG) can capture large-scale network disruptions through functional connectivity (FC) and microstate analysis, but its role in chronic mTBI is unclear.
Methods:
We tested whether RS-EEG features distinguish chronic mTBI from controls and predict symptom burden. This observational case–control study included 44 participants (18 chronic mTBI, 26 controls). Source-reconstructed EEG was analyzed for spectral power, microstate metrics, and FC using the Multivariate Interaction Measure (MIM). Elastic Net and XGBoost models classified injury status and predicted symptom severity, with feature robustness evaluated across full and reduced electrode montages.
Results:
Participants with mTBI showed no group differences in spectral power or microstate metrics but demonstrated significantly elevated FC across theta, beta, gamma, and broadband frequencies. Connectivity increases were stable across reduced montages and persisted up to 8 years post-injury. Classification models using MIM achieved AUCs of 0.79–0.89 for injury status and 0.82–0.87 for symptom severity, outperforming demographic models. Resting-state EEG FC provides a sensitive biomarker of chronic mTBI, distinguishing cases from controls and correlating with symptom severity.
Discussion:
The persistence of network alterations years after injury suggests lasting changes in brain activity associated with chronic symptom burden. These findings support the use of RS-EEG–derived FC as a noninvasive and scalable biomarker of chronic mTBI.
Introduction
Mild traumatic brain injury (mTBI) is a heterogeneous neurological condition with potential for persistent symptoms and neurophysiological disruption (1). Yet, diagnosis in the chronic stage remains challenging. Definitions of “chronic” mTBI vary across studies, with proposed thresholds ranging from ≥3 to ≥12 months post-injury (2–5). At this stage, acute measures such as the Glasgow Coma Scale (GCS) are not administered, and neuroimaging is often not obtained, leaving clinicians to rely on symptom reports that may not reflect underlying brain dysfunction. Up to 35–53% of individuals remain symptomatic more than 5–10 years post-injury (4, 6), emphasizing the need for objective biomarkers to detect and monitor chronic impairment.
The recently proposed clinical-biomarker-imaging modifiers (CBI-M) framework highlights the importance of functional biomarkers to complement symptom-based criteria to enhance classification accuracy (7). While blood-based biomarkers such as glial fibrillary acidic protein (GFAP) and ubiquitin C-terminal hydrolase L1 (UCH-L1) show diagnostic utility in the acute (within 24 h) and subacute (within 3 months) phases of mTBI (8), their role in identifying or monitoring long-term dysfunction (>6 months–1 year) remains underexplored. Neurophysiological measures, particularly resting-state EEG (RS-EEG), offer a scalable and noninvasive alternative for probing persistent network dysfunction.
RS-EEG provides a window into large-scale brain dynamics. Functional connectivity (FC) analyses quantify the efficiency of communication between brain regions, while microstate analysis characterizes rapid transitions between global brain states (9, 10). Both FC and microstates show alterations across neurological and psychiatric disorders, with changes manifesting as either increases or decreases depending on the condition (11–15). However, their utility in chronic mTBI, particularly in individuals with diverse injury mechanisms and extended post-injury durations, remains unclear. mTBI is known to disrupt distributed cortical hubs involved in attention, sensory integration, and executive function (16), and our prior work in this cohort identified atypical auditory and visual evoked responses years after injury (17, 18), suggesting that sensory processing deficits may reflect broader network dysfunction.
To address this gap, we hypothesized that individuals with chronic mTBI would show altered RS-EEG connectivity and microstate dynamics, reflecting persistent network disruption. Because scalp EEG signals can be spatially ambiguous, we applied source reconstruction to enhance anatomical specificity, enabling biologically interpretable network-level analyses. We further tested whether these features could classify injury status, predict symptom burden, and remain robust under reduced electrode montages, supporting their potential as clinically scalable biomarkers.
Materials and methods
Participants
This observational case–control diagnostic study enrolled adults aged 18–72 with either a history of mild traumatic brain injury (mTBI; GCS 13–15) or no history of head injury (controls). Exclusion criteria included severe TBI (GCS < 13), eye or ear disease (e.g., Meniere’s disease, glaucoma), metallic implants incompatible with neuroimaging, pregnancy, or age <18. All participants had normal hearing thresholds and 20/20 best-corrected visual acuity. Corrective lenses were permitted.
A total of 65 individuals were recruited, with 28 participants with mTBI (mean age 35, SD = 13.08, range = 19–72, 13 female) and 34 controls (mean age 39, SD = 11.34, range = 23–71, 25 female) included after exclusions (Figure 1). Out of 62 included participants, resting-state EEGs were completed for 23 participants with mTBI and 29 controls (Figure 1). mTBI history was confirmed via medical records or structured history, including injury mechanism and treatment. Mechanisms included motor vehicle accidents (n = 9), falls (n = 7), non-violent blunt trauma (n = 3), and sports injuries (n = 4). The average time since last mTBI was 7.25 ± 6.71 years.
Figure 1

Participant recruitment and study flowchart. Adult participants (≥18 years) provided written informed consent before any study procedures. Individuals were eligible if they had a history of mild traumatic brain injury (mTBI; Glasgow Coma Scale [GCS] 13–15) or no history of mTBI (controls). Exclusion criteria included eye or ear disease, moderate/severe TBI (GCS < 13), contraindications to MRI, age <18 years, or pregnancy. Three participants were excluded before study completion. The final sample included 62 participants (28 mTBI, 34 controls), with resting-state EEG data available for a subset (23 mTBI, 29 controls) due to attrition in the multi-day study design.
The study was approved by the Vanderbilt University Medical Center Institutional Review Board (IRB #171061). Written informed consent was obtained from all participants before any study procedures, including screening for inclusion and exclusion criteria, data collection, or analysis. All participants voluntarily participated and were compensated for their time in accordance with IRB guidelines.
Procedure
Participants completed the Neurobehavioral Symptom Inventory (NSI), a validated 22-item self-report measure of post-concussive symptoms (19). Resting-state EEG (RS-EEG) was recorded in a quiet, sound-treated room. Data were collected with a 128-channel hydrocel net (Electrical Geodesics, Inc., Eugene, OR) at 1,000 Hz, referenced to Cz. Electrode impedances were kept <50 kΩ. Recordings included 3 min eyes-open (EO) followed by 3 min eyes-closed (EC). The fixed order minimized drowsiness and artifact variability. During EO, participants fixated on a central cross to reduce eye movements. Condition transitions were signaled by a 500 Hz auditory beep, with event markers inserted into the EEG file for alignment. This was part of a larger study, components of which have been published elsewhere (17, 18).
EEG preprocessing and source reconstruction
Preprocessing
Data were preprocessed in MATLAB (MathWorks, Natick, MA) using EEGLAB (20) and a customized version of the Maryland Analysis of Developmental EEG (MADE) pipeline (21). As part of the MADE pipeline, signals were bandpass filtered at 0.1–50 Hz using the FIRfilt plugin (22), then segmented into 2,000-ms epochs. Bad channels were identified and interpolated, and epochs with >10% interpolated electrodes or >±100 μV amplitude were rejected. The Fully Automated Statistical Thresholding for EEG artifact Rejection (FASTER) algorithm aided channel-level artifact detection (23), and artifact-related independent components were identified using ADJUST (24). Eyes-closed recordings were used for primary analyses due to lower artifact susceptibility (25).
Source reconstruction
Source reconstruction was performed using ROIConnect (EEGLAB plugin) with the Montreal Neurological Institute (MNI) Boundary Element Model and the Colin27 template (26–28). Cortical activity was estimated via exact low-resolution electromagnetic tomography (eLORETA) and parcellated into Desikan-Killiany atlas regions to extract biologically interpretable ROI time series (29, 30). All subsequent analyses of spectral power, microstates, and functional connectivity were conducted using these source-reconstructed ROI time series.
EEG analyses
Power spectra analysis
Power spectral density (PSD) was computed to assess frequency-specific neural oscillations, given prior reports of spectral alterations in neurotrauma (31, 32). Data were analyzed in EEGLAB with 20,000 permutations and False Discovery Rate (FDR) correction (p < 0.05) (33). The FOOOF toolbox was used to separate narrowband oscillations from the aperiodic 1/f component (34). Power was examined across delta (1–4 Hz), theta (4–8 Hz), alpha (8–12 Hz), beta (13–30 Hz), and gamma (30–50 Hz) bands.
Microstate analysis
Microstate analysis across 1–50 Hz was conducted in MicrostateLab (EEGLAB plugin) (35). Global Field Power peaks were clustered (k = 4–7) using k-means, with optimal solutions selected via meta-criteria in Cartool (36). Group-averaged maps were matched to canonical templates based on the highest correlation, and temporal dynamics (duration, coverage, occurrence) were derived by back-fitting. Group differences were assessed using Topographic Analysis of Variance (TANOVA) in RAGU with 100,000 permutations and FDR correction (37).
Functional connectivity (MIM)
Functional connectivity was computed using the Multivariate Interaction Measure (MIM), which reduces the impact of volume conduction by focusing on non-instantaneous interactions in the frequency domain. Connectivity was estimated for the broadband range (1–50 Hz) and standard frequency bands (delta [1–4 Hz], theta [4–8 Hz], alpha [8–12 Hz], beta [13–30 Hz], gamma [30–50 Hz]). Outliers were capped at 3 × IQR to reduce undue influence. Group differences were tested with type III ANCOVA controlling for age and sex. Because Levene’s test indicated heteroscedasticity, robust standard errors were applied (38). Effect sizes were estimated with bootstrapped partial η2 and 95% confidence intervals.
Reduced ROI analysis
To evaluate clinical scalability, we repeated FC analyses using reduced ROI subsets designed to approximate sparse EEG montages. These subsets reflect electrode coverage commonly used in clinical visual and auditory recordings but were applied here to resting-state EEG. No evoked potentials were recorded. The selected regions prioritize accessible electrode locations and target sensory systems that have previously been shown to exhibit deficits in mTBI (17, 18). The reduced sets included (1) occipital (visual), (2) superior temporal (auditory), and (3) frontoparietal regions (Figure 2). Results were FDR-corrected across frequency bands and montage conditions.
Figure 2
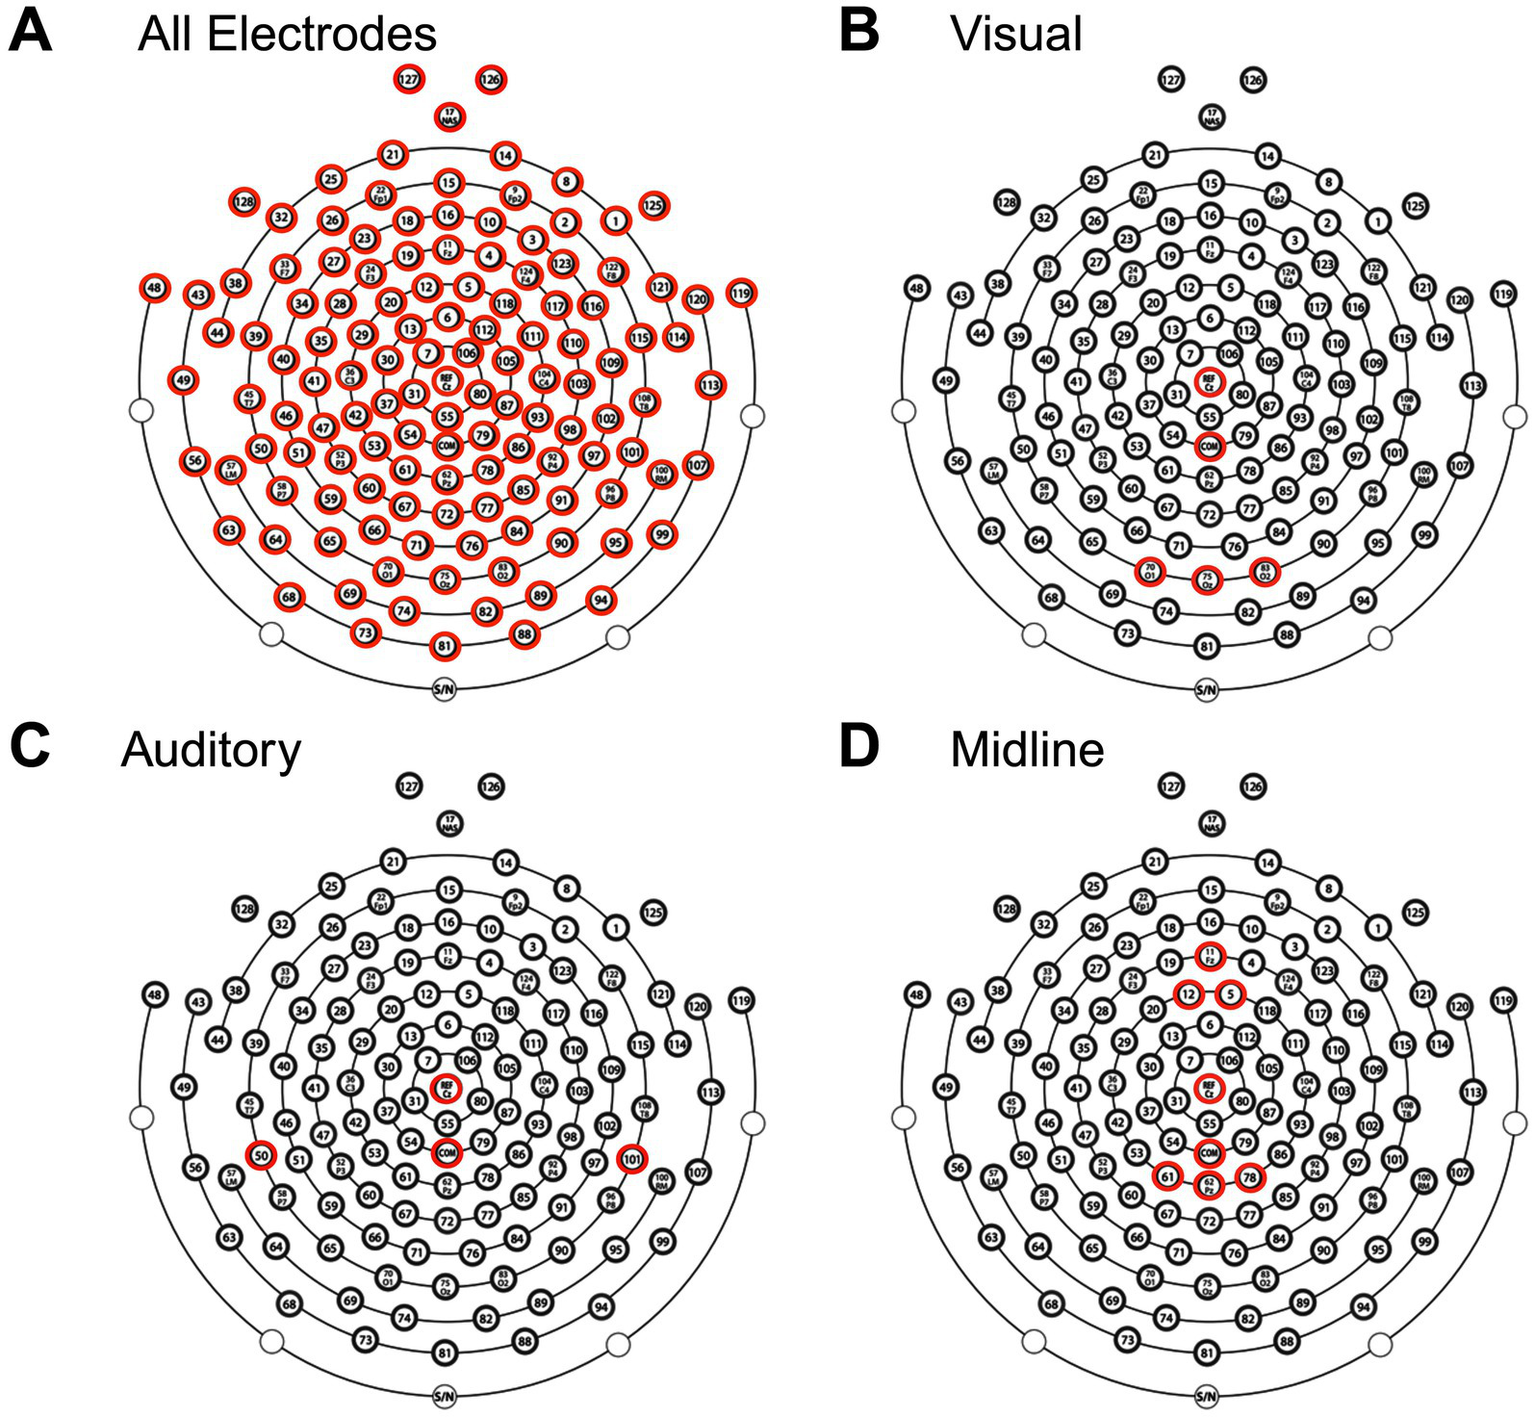
Electrode selection for EEG analysis. Topographical layout of the EEG cap showing electrodes included in four analyses: (A) All electrodes, (B) visual subset, (C) auditory subset, and (D) midline subset. Highlighted electrodes (red) indicate those used in each respective analysis, including the reference (Cz) and common ground electrode (COM).
Classifier analysis
To evaluate whether FC features distinguished chronic mTBI from controls, we applied three complementary classification methods: (1) threshold-based cutoffs, which use a single optimal decision boundary (Youden’s index) to maximize sensitivity and specificity (39); (2) Elastic Net logistic regression, a linear model that combines L1/L2 regularization to handle correlated predictors and reduce overfitting (40); and (3) XGBoost gradient-boosted decision trees, a nonlinear ensemble method capable of modeling higher-order feature interactions (41). This combination allowed comparison of simple interpretable models versus more flexible machine learning approaches. MIM values were z-scored for Elastic Net but left unscaled for XGBoost. Hyperparameters were tuned with 5-fold cross-validation. Classification performance was quantified with ROC receiver operating characteristic (ROC) curves and area under the curve (AUC, 95% CIs from 20,000 bootstraps). Model significance was assessed with 20,000 permutation tests of shuffled labels. Models were implemented in MATLAB (Elastic Net) and Python (XGBoost with scikit-learn and xgboost).
Symptom severity prediction analysis
Associations between FC and post-concussive symptoms were examined using NSI total score. Linear regression tested whether MIM values predicted total NSI scores (controlling for age and sex). For secondary analyses, participants were dichotomized into no-mild (NSI total score <25) vs. moderate–severe (NSI total score ≥25) symptom groups, and classification was performed using Elastic Net and XGBoost. Models were tuned with 5-fold cross-validation, and performance was quantified with ROC AUCs (95% CIs via 20,000 bootstraps). Statistical significance was assessed with 20,000 label-permutation tests.
Results
After exclusions for incomplete recordings (n = 5, 2 controls) and excessive artifacts (n = 3, 1 control), 44 participants were included in the final analysis. The control group (n = 26) had a mean age of 39.6 years (SD = 11.5) and was 73% female, while the mild TBI group (n = 18) had a mean age of 32.0 years (SD = 11.4) and was 50% female. Age distributions were compared between included and excluded participants. For mTBI participants, Shapiro–Wilk indicated non-normality in the included group (p = 0.003), so a Mann–Whitney U test was used. Excluded cases were significantly older (U = 53.0, p = 0.041). For controls, both groups were approximately normal (p > 0.07), and Welch’s t-test showed no difference (t = 0.88, p = 0.39). Thus, the final analysis sample contained younger mTBI participants relative to excluded cases, while control demographics were preserved. To account for this potential confound, age was included as a covariate in all analyses.
Among mTBI participants, the average time since their last mTBI was 7.7 years (SD = 7.0), consistent with chronic-phase recovery. Injury mechanisms are detailed in Table 1. There were no significant differences in injury time or mechanism between excluded and included participants with mTBI (p > 0.05).
Table 1
| Variable | Control (n = 26) | mTBI (n = 18) |
|---|---|---|
| Age, mean (SD) | 39.6 (11.5) | 32.0 (11.4) |
| Sex, % Female | 73% | 50% |
| # of mTBIs, n (%) | ||
| 1 | – | 9 (50%) |
| 2 | – | 1 (6%) |
| 3 | – | 6 (33%) |
| 4 | – | 2 (11%) |
| Did not report | – | 0 (0%) |
| Years since last mTBI, n (%) | ||
| <1 | – | 1 (6%) |
| 1–2.9 | – | 6 (33%) |
| 3–6.9 | – | 2 (11%) |
| 7–9.9 | – | 2 (11%) |
| >10 | – | 6 (33%) |
| Did not report | – | 1 (6%) |
Participant demographics.
mTBI, mild traumatic brain injury.
After preprocessing, average data retention was lower in cases than controls (mTBI: mean = 0.68, SD = 0.32; Control: mean = 0.92, SD = 0.12; Mann–Whitney U test, p = 0.009). For eyes-open EEG, retention did not differ between groups (mTBI: mean = 0.78, SD = 0.28; Control: mean = 0.86, SD = 0.17; Mann–Whitney U test, p = 0.424). Retention was lower in mTBI participants during eyes-closed recordings, likely reflecting increased artifact, but all participants retained adequate data for valid analysis. Moreover, the consistency of eyes-open retention across groups suggests that the observed group differences are not attributable to general data quality disparities.
Resting-state spectral power is preserved after chronic mTBI
No significant group differences were observed in eyes-closed resting-state power spectra across the full 0–50 Hz range (p > 0.05; Figure 3A), indicating that overall spectral content remained comparable between mTBI and control participants. This pattern held after removing the aperiodic background using FOOOF, isolating true oscillatory components. Group comparisons of the periodic spectra also revealed no significant differences (p > 0.05; Figure 3B), suggesting that mTBI does not produce broad alterations in canonical frequency bands during rest.
Figure 3
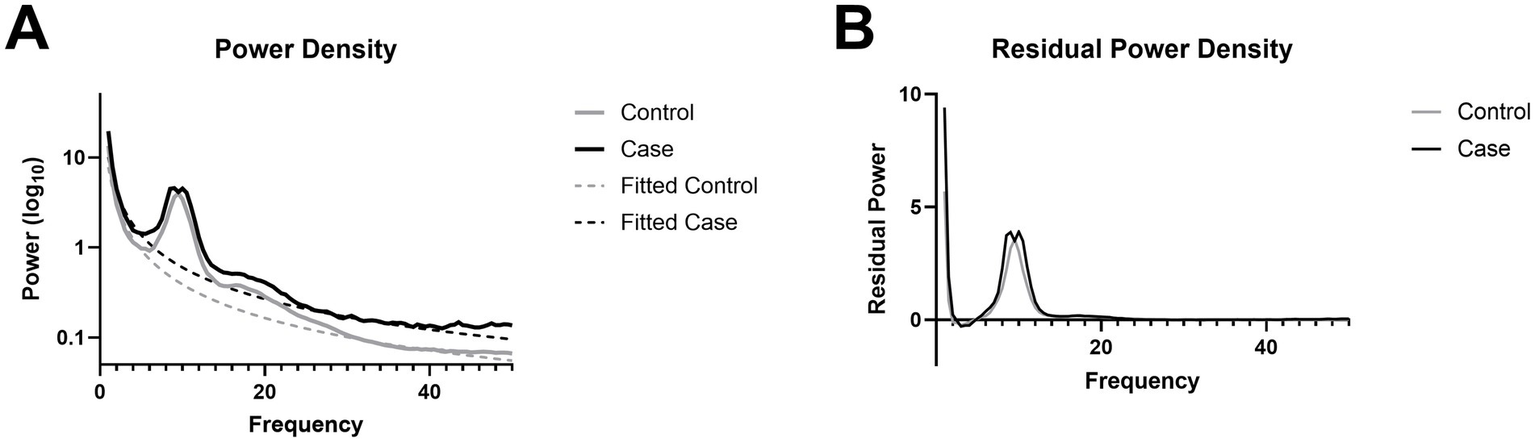
Power spectral density. (A) Power spectra with an aperiodic fit overlay. (B) Periodic residual from the removal of the aperiodic fit from raw power spectra.
Microstate topographies and temporal dynamics are unaltered after chronic mTBI
Microstate topographies, reflecting canonical spatial configurations of scalp potential fields, were statistically indistinguishable between the mTBI and control groups across 5 optimal microstates, as assessed using TANOVA (Figures 4A,B). This indicates that the overall spatial organization of microstates was preserved in individuals with chronic mTBI. Further, the temporal dynamics of the backfitted microstate sequences, including duration, occurrence, coverage, global explained variance, and transition probabilities, also showed no significant group differences (Figures 4C–F), suggesting preserved microstate temporal dynamics in individuals with chronic mTBI.
Figure 4
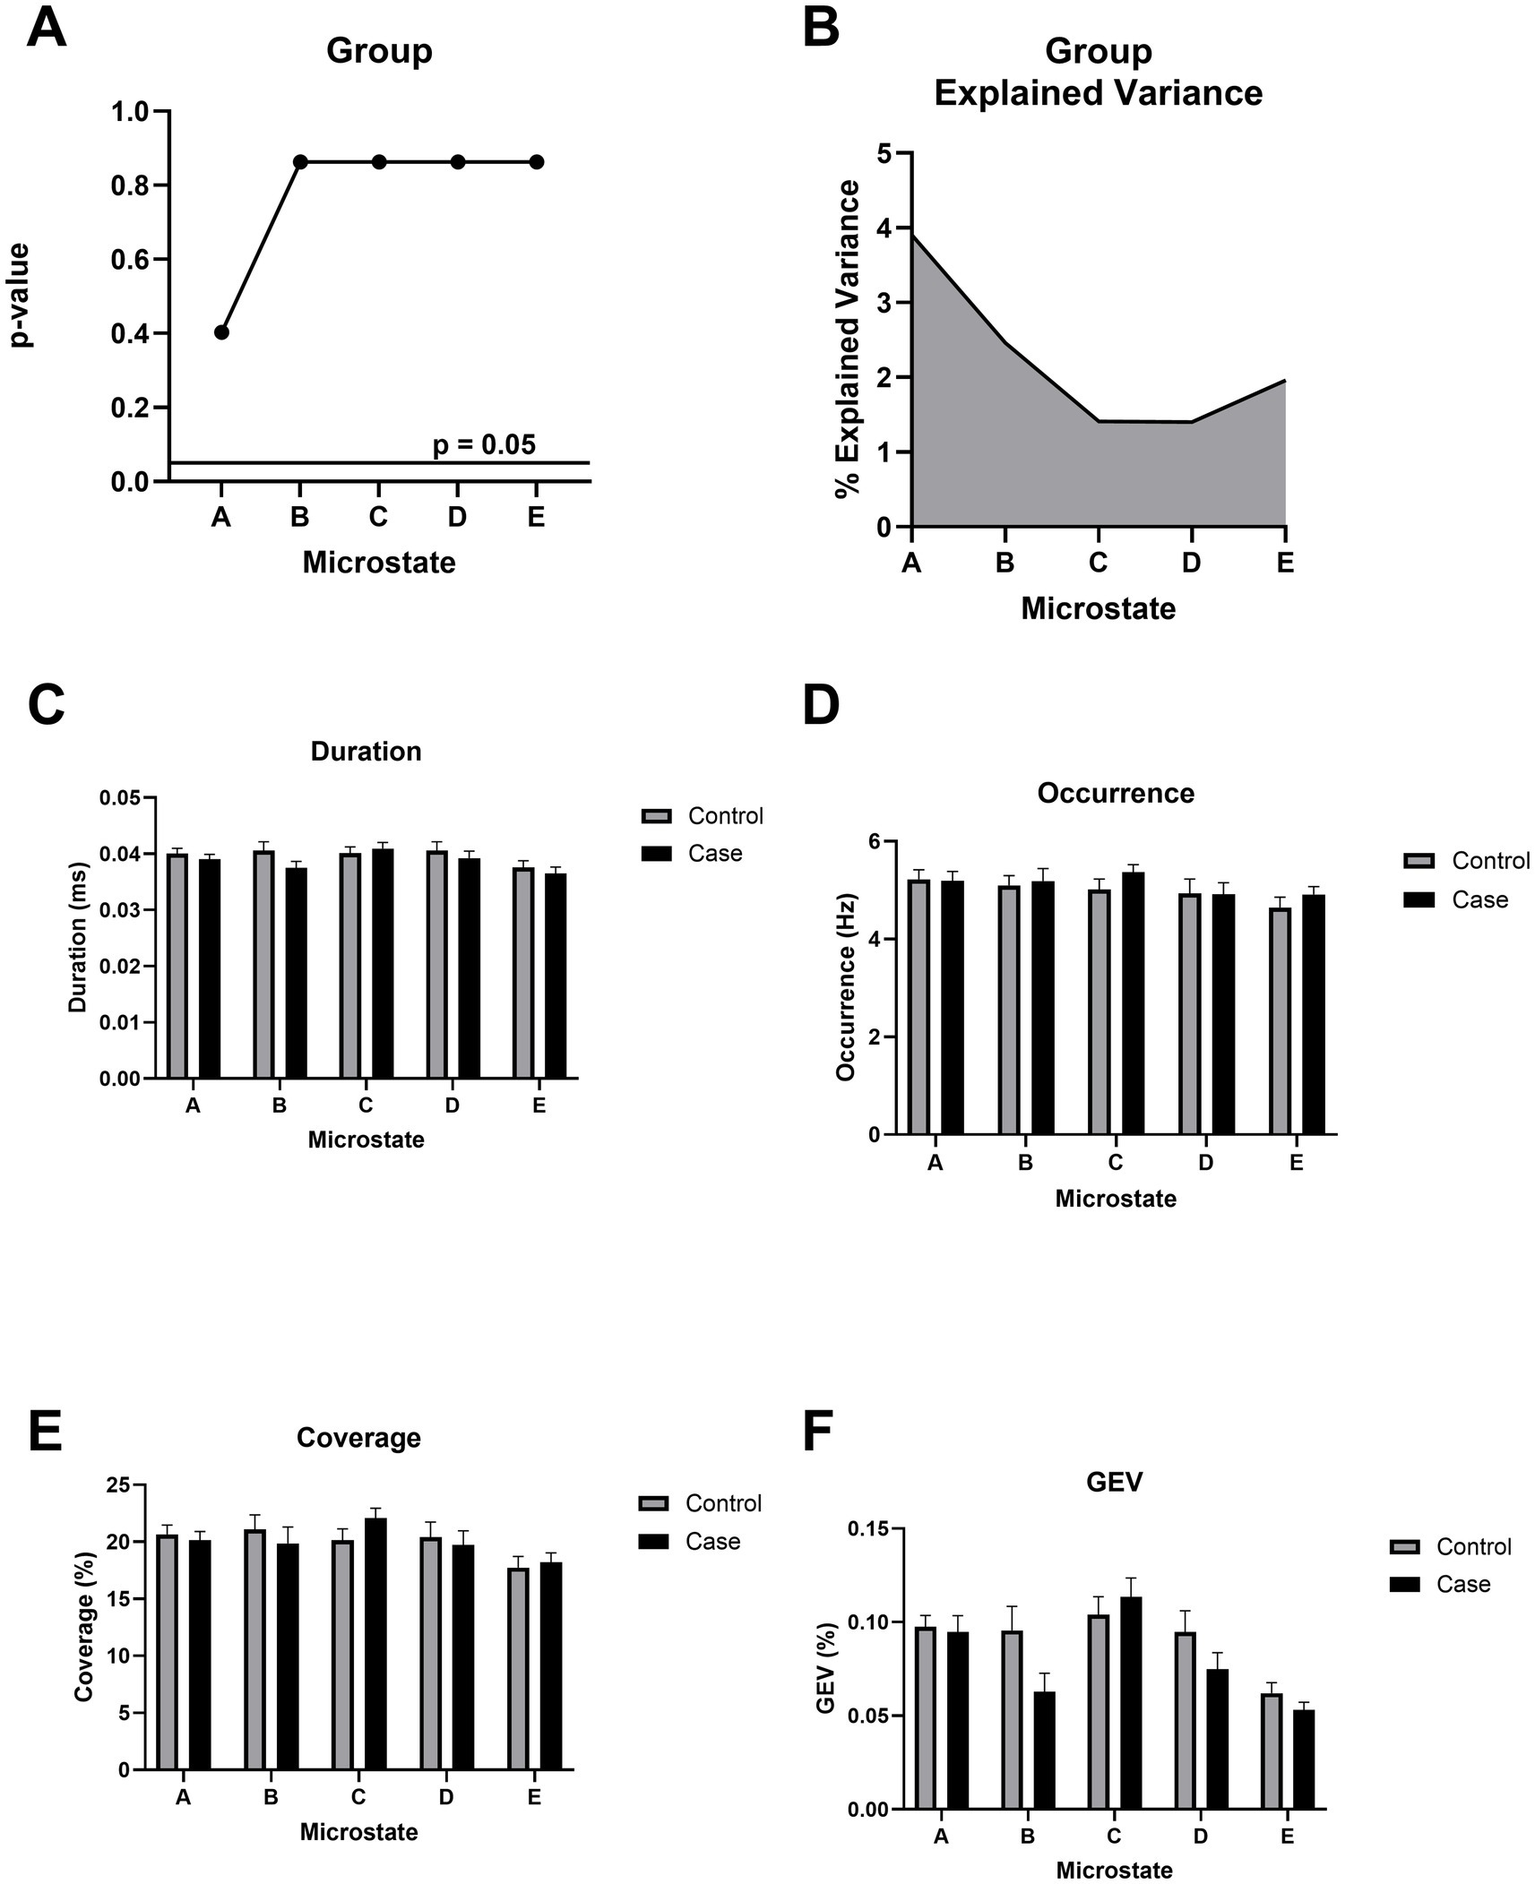
Microstate topographical analysis of variance (TANOVA). (A)p-value of the topographical difference based on group (mild TBI/control) across all microstates. All p-values use FDR correction. (B) Cumulative explained variance (CEV) based on group. (C) Duration (in ms) reflects the average length of each microstate. (D) Occurrence (in Hz) represents the frequency of each microstate per second. (E) Coverage denotes the proportion of total time occupied by each microstate. (F) Global explained variance (GEV) quantifies the proportion of EEG variance explained by each microstate. No significant group differences were observed across any microstate metric (A–F).
Chronic mTBI is associated with widespread cortical hyperconnectivity
The mild TBI group exhibited significantly higher functional connectivity compared to controls across all frequencies and within the theta, beta, and gamma bands (p < 0.05), with no group differences in the delta or alpha bands (Figure 5A). In frequency bands showing significant effects, group membership (i.e., mTBI or control) accounted for an average of 21% of the variance (Figure 5B). These group differences remained robust when using reduced ROI subsets approximating clinically relevant EEG configurations, including occipital (visual), superior temporal (auditory), and midline-only montages (Figure 5C). Across these subsets, group explained an average of 23% of the variance in connectivity, again reflecting increased connectivity in the mTBI group relative to controls (Figure 5D).
Figure 5
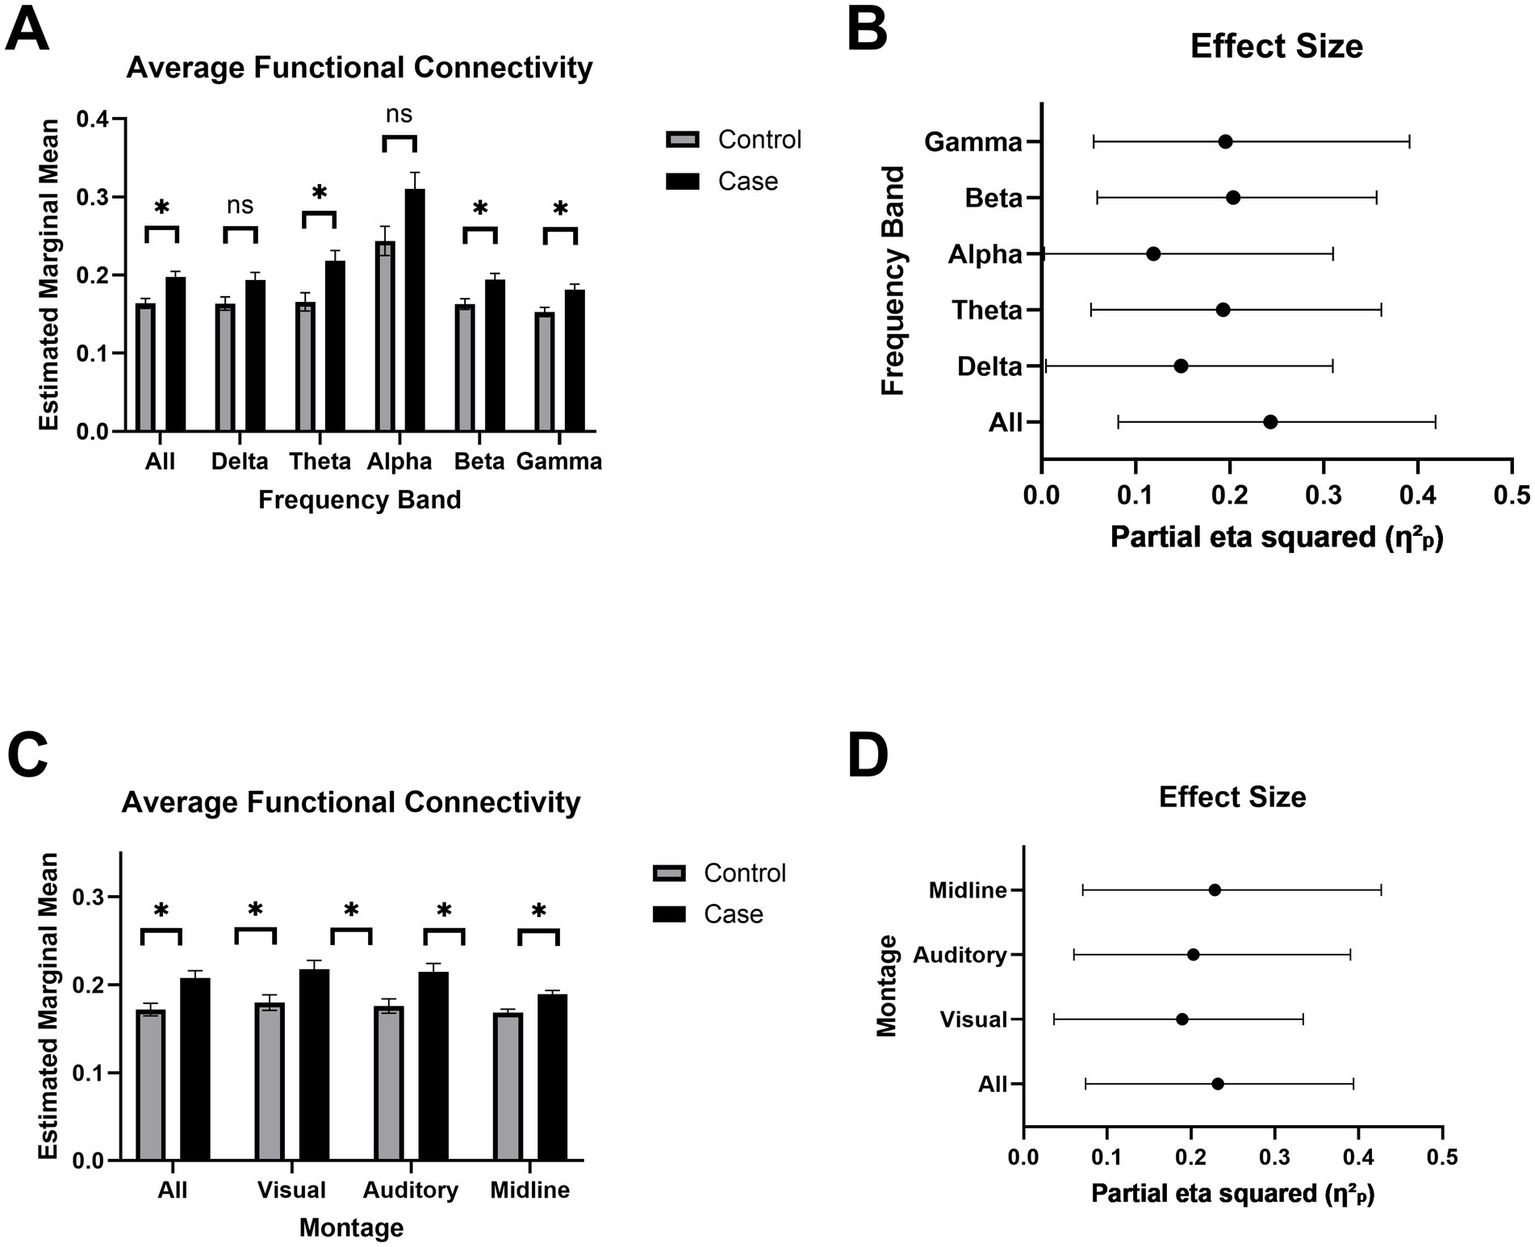
Increase in estimated functional connectivity. (A) Estimated marginal mean MIM (multivariate interaction measure) across frequency bands: delta (1–4 Hz), theta (4–7 Hz), alpha (8–12 Hz), beta (13–30 Hz), and gamma (30–45 Hz). Bars represent mean ± SEM for each group. Asterisks indicate FDR-corrected statistical significance between groups (p < 0.05 = *, p < 0.01 = **, p < 0.001 = ***). (B) Effect sizes for each frequency band are reported as partial eta squared (η2p), indicating the proportion of variance accounted for by MIM. Bars represent mean ± SEM for each group. (C) Estimated marginal mean MIM across subregions to simulate alternative EEG montages. (D) Effect sizes for each montage are reported as partial eta squared (η2p), indicating the proportion of variance accounted for by MIM.
Machine learning captures robust differences in functional connectivity after chronic mTBI
We evaluated the utility of functional connectivity (MIM) for classifying chronic mTBI from control participants using three classification approaches: a threshold-based classifier, Elastic Net regression, and XGBoost. Using the raw MIM values, the optimal threshold (0.174) yielded an AUC of 0.793 (95% CI: 0.615–0.940) (Figure 6A). The Elastic Net model (α = 0.03) produced a similar AUC of 0.790 (95% CI: 0.524–1.000) (Figure 6C). Both the threshold-based and Elastic Net models are acceptable and close to the 0.8 threshold commonly interpreted as excellent classification performance (42) (Figures 6B, D). The XGBoost model achieved the highest accuracy with an AUC of 0.887 (95% CI: 0.785–0.943) (Figure 6E). SHAP analysis indicated that higher MIM values were strongly associated with increased likelihood of mTBI classification (Figure 6F), reinforcing the discriminative power of functional connectivity, even in more complex models. All permutation tests yielded p-values less than 0.05, confirming that the observed AUCs were unlikely to occur by chance (Supplementary Figures S2A–C).
Figure 6
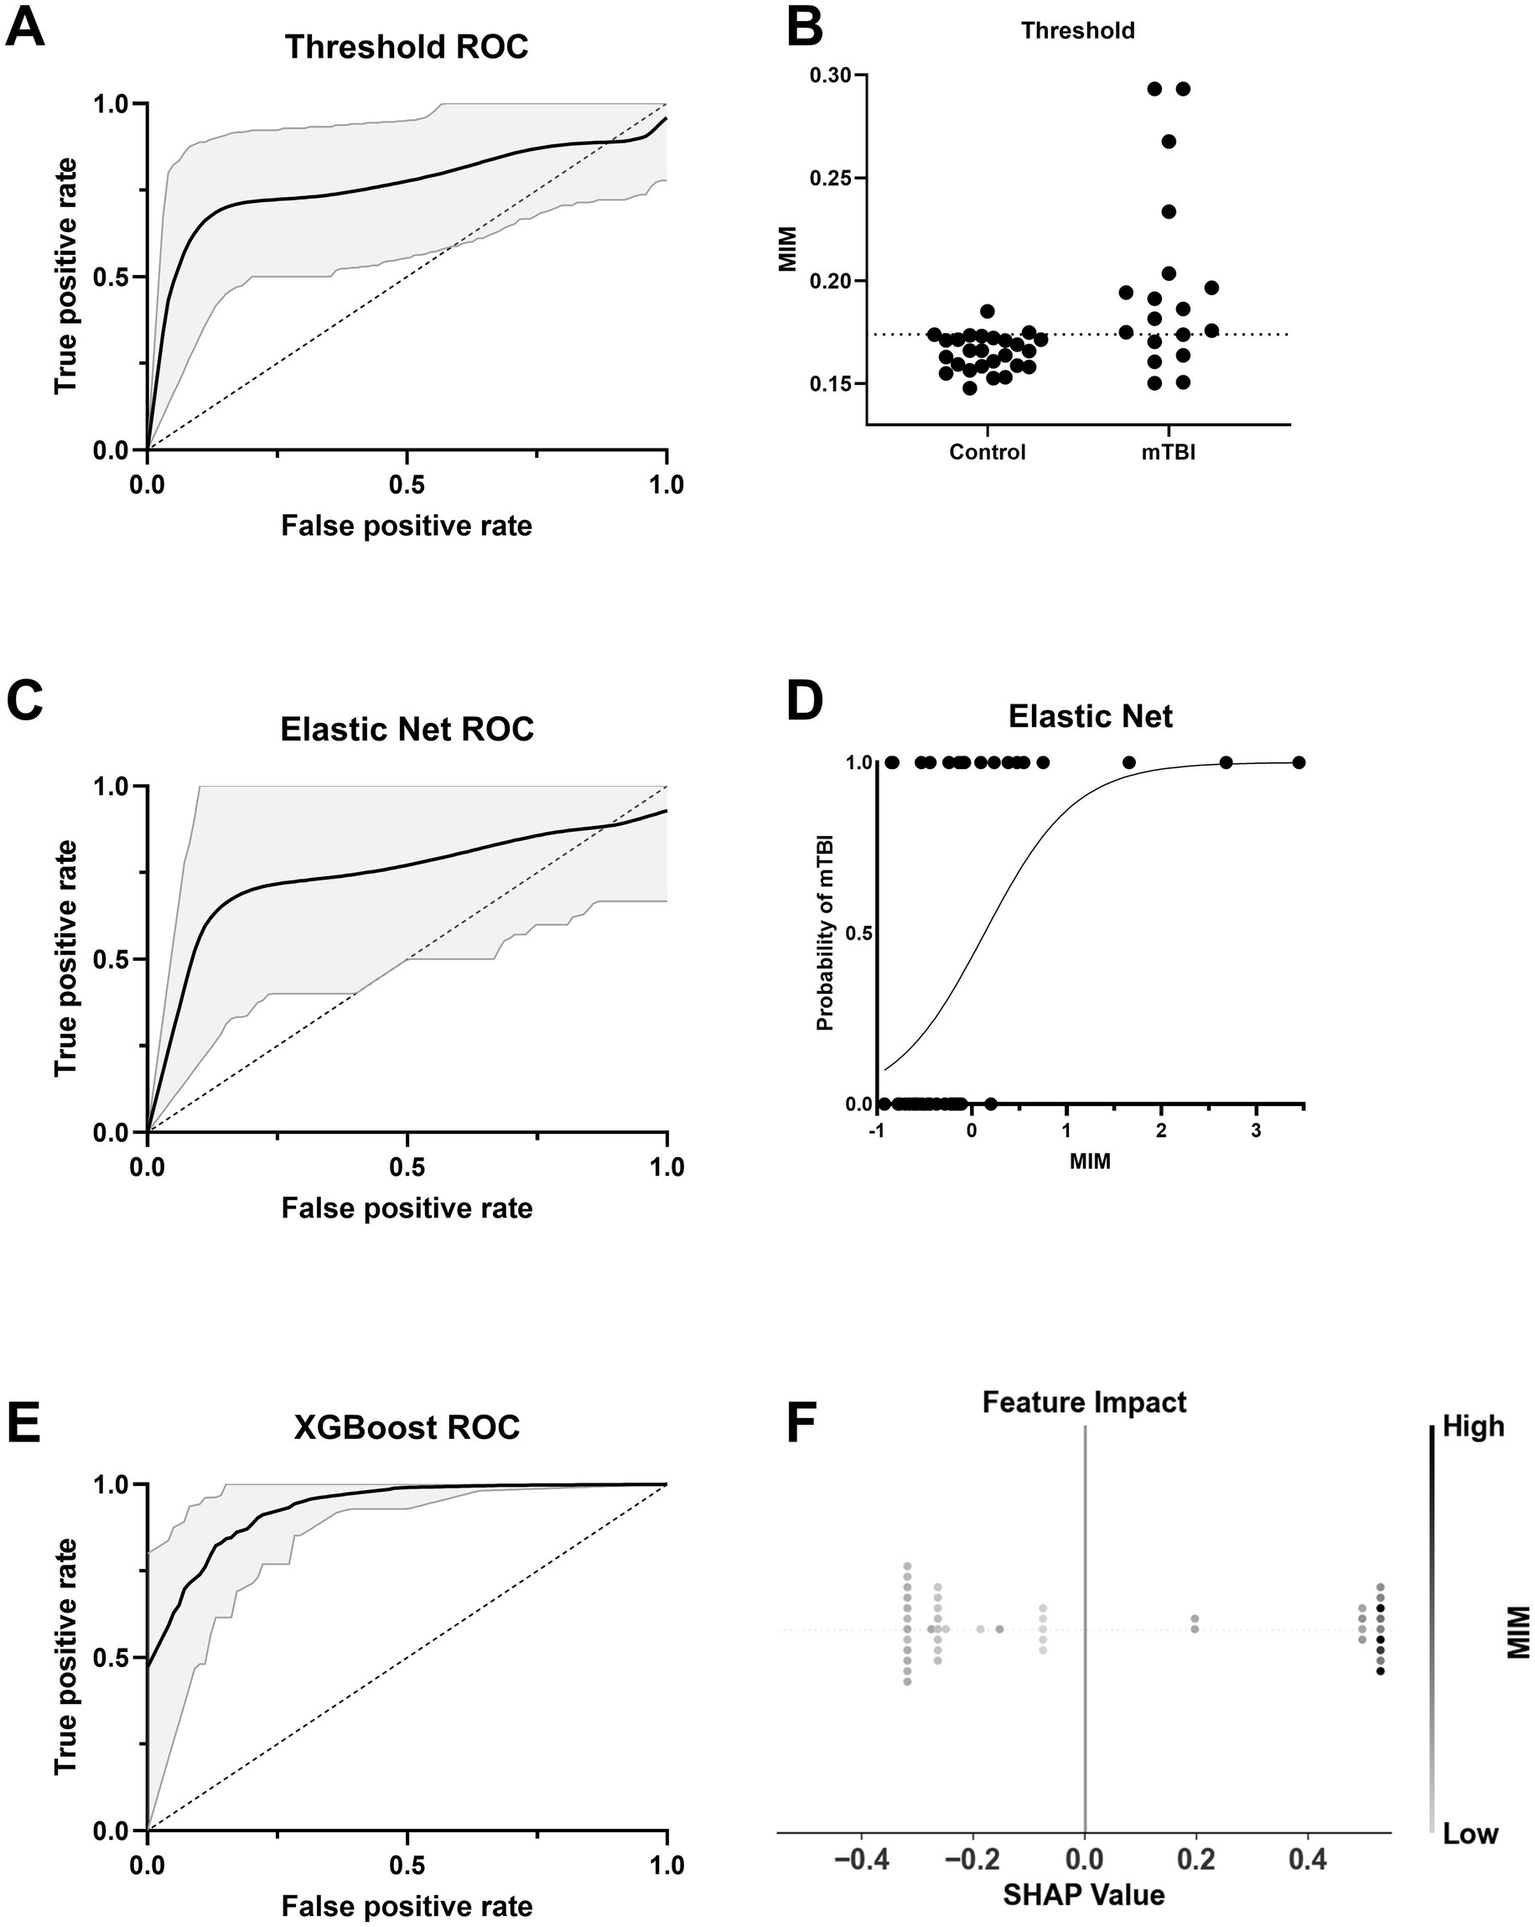
Classifier performance and interpretability for group prediction based on MIM. (A) ROC curve for a threshold-based classifier using the optimal Youden’s J statistic from z-scored MIM. The black line indicates the mean ROC curve across 20,000 bootstraps, with 95% confidence interval shaded in gray. (B) Distribution of normalized MIM values across Control and mTBI groups. The dashed line indicates the optimal threshold used in A. (C) ROC curve for an Elastic Net classifier using MIM as the predictor. The solid line shows the average ROC across bootstraps, with 95% CI shaded. (D) Probability curve for Elastic Net classifier output as a function of MIM. The logistic decision function exhibits a higher probability of mTBI with increasing MIM. (E) ROC curve for an XGBoost classifier using MIM as the predictor. (F) SHAP summary plot from the XGBoost model. Each dot represents an individual’s SHAP value, indicating feature impact on model output, with color based on the strength of z-scored MIM.
Model performance varied when age and sex covariates were included. Elastic Net performance decreased slightly, with an AUC of 0.765 (95% CI: 0.517–0.967) (Supplementary Figure S3A), possibly due to overfitting or noise introduced by additional predictors in the context of a modest sample size. In contrast, XGBoost performance improved, reaching an AUC of 0.901 (95% CI: 0.844–0.944) (Supplementary Figure S3C), suggesting better accommodation of additional covariates. Permutation tests again confirmed model significance (p < 0.05) (Supplementary Figures S3B,D). When MIM was removed from the models, performance declined substantially: the Elastic Net dropped to an AUC of 0.641 (95% CI: 0.438–0.867) and XGBoost to 0.835 (95% CI: 0.701–0.912; Supplementary Figures S4A,C). Despite this, models remained statistically significant (p < 0.05). Collectively, these results highlight MIM’s strong predictive contribution across models.
Cortical hyperconnectivity after chronic mTBI reflects neurobehavioral symptom severity
MIM significantly predicted total symptom burden as measured by the Neurobehavioral Symptom Inventory (NSI) total score in a linear regression model (Figure 7A). Symptoms were distributed across emotional, cognitive, sensory, and vestibular domains (Figure 7B). MIM also effectively distinguished mTBI patients with moderate to severe symptoms (NSI total score ≥ 25) from those with mild or no symptoms (NSI total score < 25) when used as a predictor in both Elastic Net logistic regression (AUC = 0.824 [95% CI: 0.33–1]) and XGBoost classifier models (AUC = 0.865 [95% CI: 0.80–0.95]; Figures 7C,E). Permutation testing confirmed that the observed model performance was statistically significant (p < 0.05; Figures 7D,F).
Figure 7
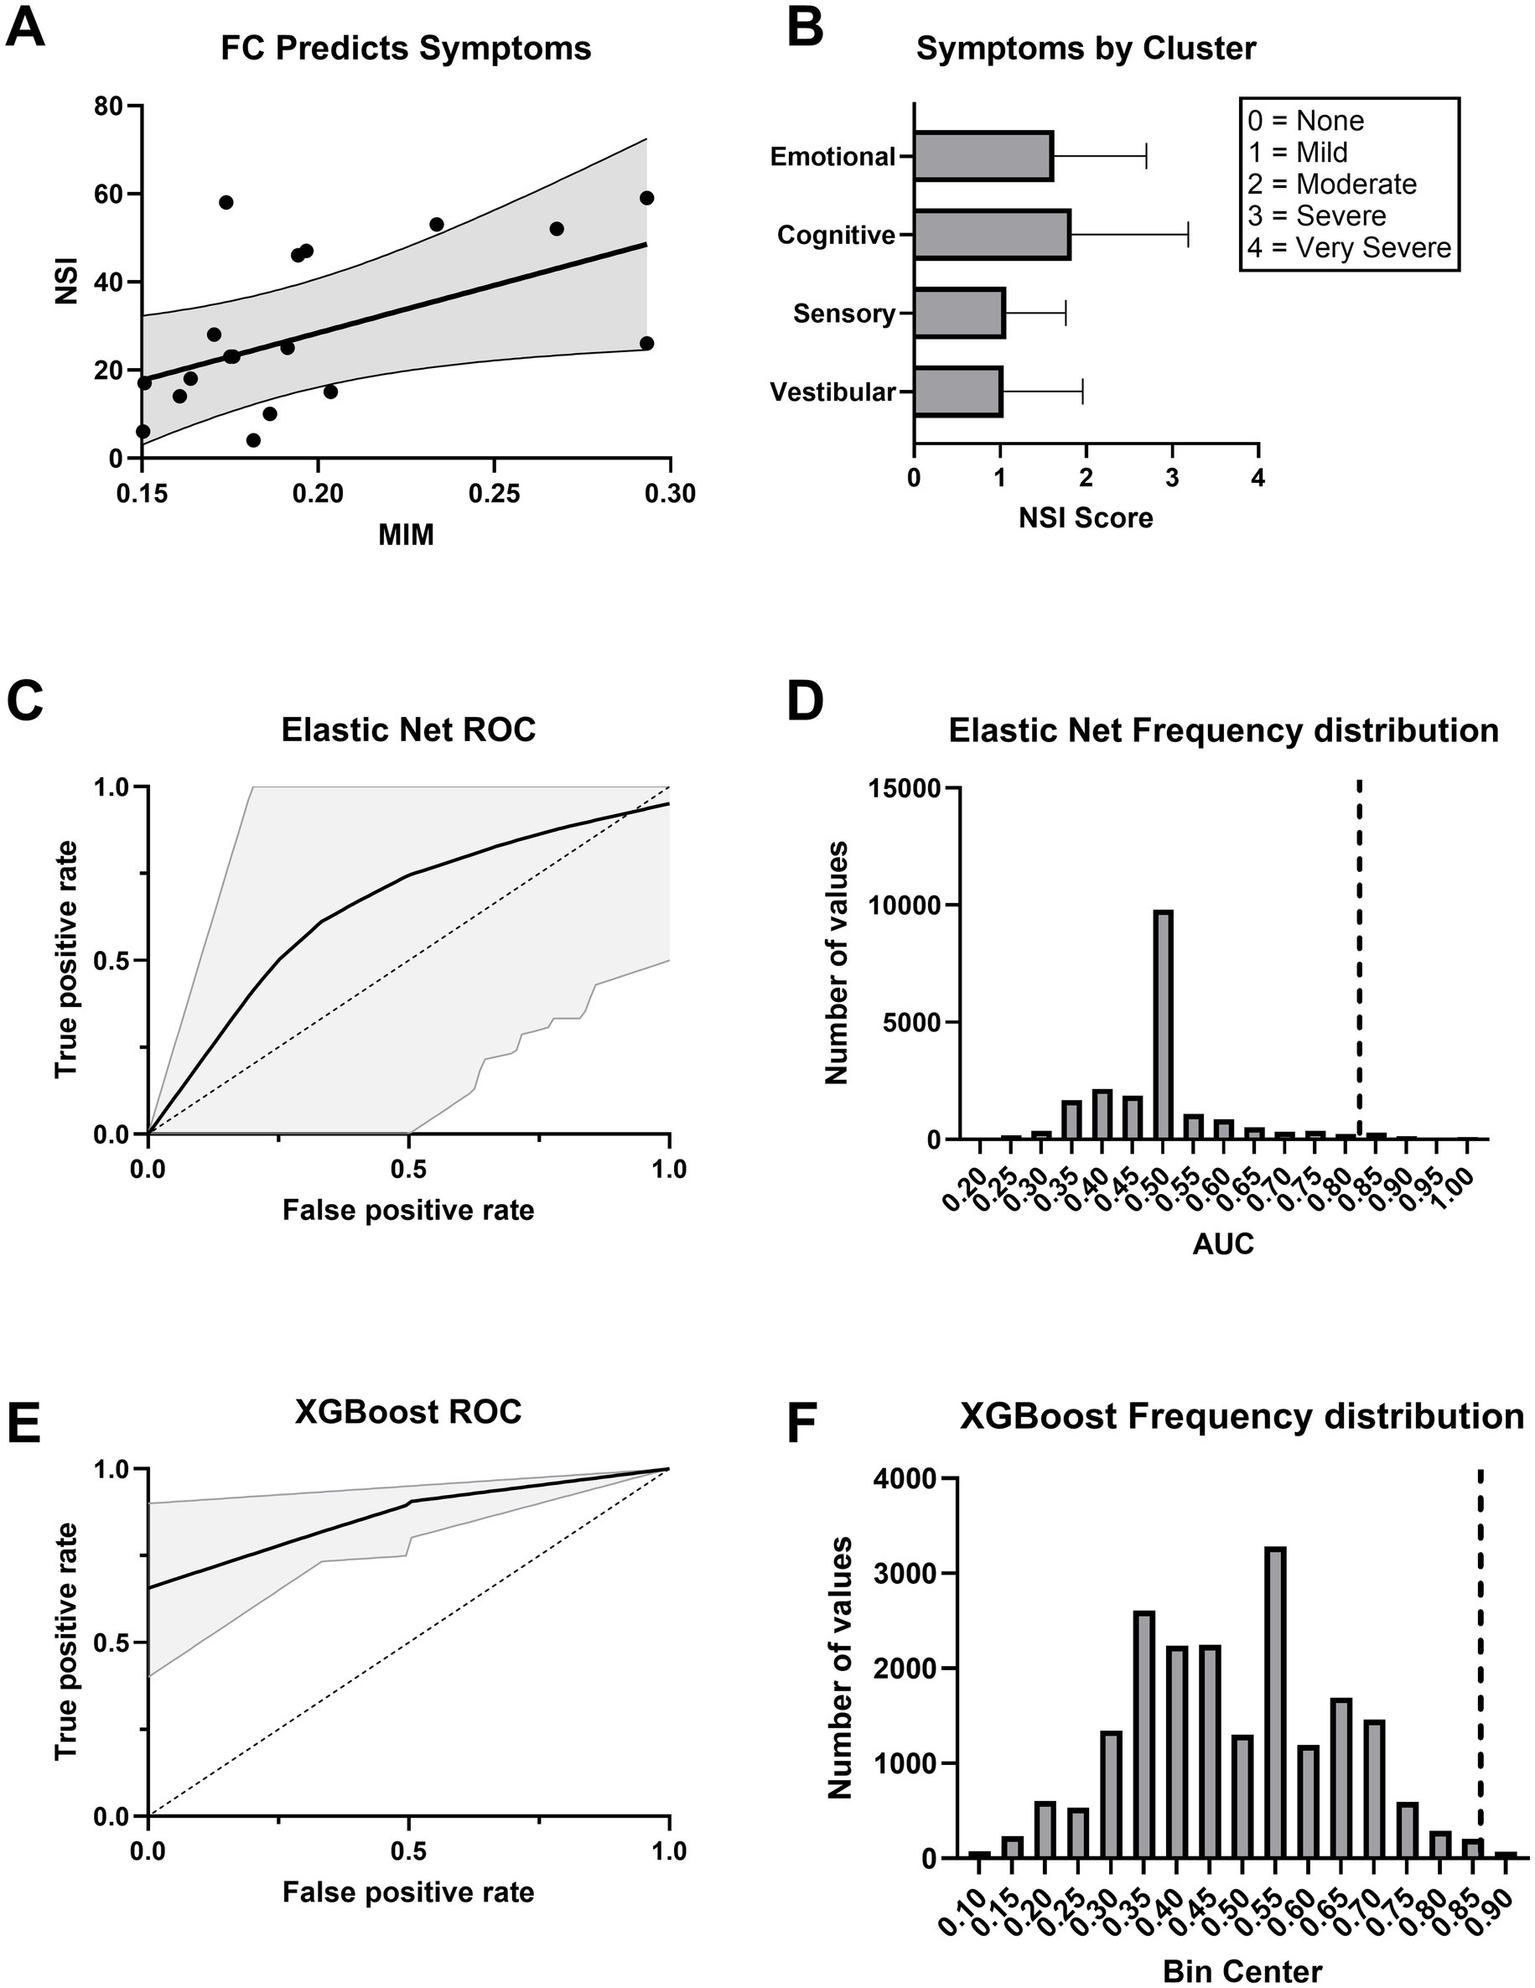
Functional connectivity explains neurobehavioral symptoms. (A) Higher functional connectivity (MIM) predicts greater symptom severity as measured by the Neurobehavioral Symptom Inventory (NSI). The regression line is shown with 95% confidence intervals. (B) Average NSI scores across symptom clusters. Scores are rated on a 0–4 scale, with 0 = None, 1 = Mild, 2 = Moderate, 3 = Severe, and 4 = Very Severe. Error bars represent ±1 SEM. (C) ROC curve for an Elastic Net logistic regression classifier trained on MIM. The black line indicates the mean ROC curve across 20,000 bootstraps, with 95% confidence interval shaded in gray. (D) Histogram displaying the frequency of AUC values under the null hypothesis for the Elastic Net model. The dashed vertical line indicates the observed AUC for the true model in each case. The observed AUC had statistically significant model performance above chance (p < 0.05). (E) ROC curve for an XGBoost classifier trained on MIM. The black line indicates the mean ROC curve across 20,000 bootstraps, with 95% confidence interval shaded in gray. (F) Histogram displaying the frequency of AUC values under the null hypothesis for the XGBoost model. The dashed vertical line indicates the observed AUC for the true model in each case. The observed AUC had statistically significant model performance above chance (p < 0.05).
Model performance declined when demographic covariates were added. The Elastic Net model, including MIM, age, and sex, yielded an AUC of 0.661 (95% CI: 0–1) and did not reach statistical significance (p = 0.125; Supplementary Figures S5A,B). A model using only age and sex performed worse than chance (AUC = 0.421, 95% CI: 0–0.583; p = 0.698; Supplementary Figures S6A,B). In contrast, the XGBoost model that included MIM, age, and sex maintained strong performance (AUC = 0.874, 95% CI: 0.733–1; p < 0.05; Supplementary Figures S5C,D), while the XGBoost model trained solely on demographics showed reduced accuracy (AUC = 0.732, 95% CI: 0.625–0.833) and was not statistically significant (p = 0.147; Supplementary Figures S6C,D). These results demonstrate that including MIM as a predictor significantly improved classification of symptom severity, reinforcing its potential utility as a functional biomarker in chronic mTBI.
Discussion
Overview and key findings
This study investigated whether RS-EEG features, including spectral power, microstate metrics, and functional connectivity, can differentiate individuals with chronic mTBI from healthy controls. Using source-reconstructed RS-EEG, we first assessed group-level differences. Subsequently, we utilized machine learning models to evaluate the capability of FC metrics to classify injury status and predict symptom severity. Although spectral power and microstate metrics did not reveal significant differences between groups, functional connectivity measured via MIM demonstrated robust and widespread hyperconnectivity in the mTBI group. These were identified up to nearly 8 years post-injury and significantly predicted symptom severity and injury status, highlighting EEG-derived connectivity as an ongoing challenge for mTBI patients that may contribute to chronic symptomology.
Spectral power and microstate metrics lack sensitivity in chronic mTBI
No group differences in spectral power were observed, consistent with prior reports in both the subacute (<3 months) and chronic (>10 years) phases (32, 43). Although group means were unchanged, spectral measures have been linked to symptoms, including associations with memory, injury severity, and psychological problems (32, 43). Other studies, however, have identified abnormalities, such as increased theta and reduced beta power in the acute phase, altered frontal alpha/beta asymmetry persisting beyond 9 months, and reduced beta with elevated delta/gamma activity in adolescents up to 12 months post-injury (31, 44, 45). These discrepancies, together with the fact that spectral power primarily reflects local rather than network-level activity (16), suggest limited sensitivity to the distributed network disruptions typical of mTBI. Accordingly, spectral power appears to have low value for screening or longitudinal monitoring, and measures of functional connectivity may provide greater specificity and clinical relevance.
Similarly, canonical EEG microstate metrics showed no group differences. Spatial configurations and temporal parameters (duration, occurrence, coverage) were preserved in chronic mTBI. Effects have been reported when analyses were stratified by symptom severity, including shorter microstate durations and reduced alpha/theta activation in patients with moderate-to-severe neuropsychological impairments (46). However, because such effects are not evident at the group level, canonical microstates also appear limited as stand-alone biomarkers. By contrast, network-based microstates derived from MEG, defined from whole-brain connectivity rather than scalp voltage maps, have shown higher classification accuracy (47). While this approach may better capture large-scale network disruptions, MEG’s cost and limited availability constrain its clinical feasibility.
Persistent functional hyperconnectivity in chronic mTBI
Our MIM-based functional connectivity analysis revealed significant and widespread increases in broadband, theta, beta, and gamma bands in the mTBI group. This pattern is strikingly similar to Wu et al., who also reported increased connectivity in theta, beta, and gamma, but not alpha or delta, in professional boxers with a history of repetitive mTBI (48). The alignment across studies may reflect shared neural signatures of chronic-stage injury, as both examined participants more than a year post-injury and with likely cumulative exposure. One distinction is that Wu et al. observed hemisphere-specific effects, with stronger FC in the right hemisphere, potentially reflecting asymmetric head impacts in boxing. Our cohort’s more varied injury mechanisms may have produced a more bilateral pattern.
In contrast, studies of patients in the acute-to-subacute phase have sometimes reported reduced connectivity across multiple frequency bands (47). Such decreases are less common than early hyperconnectivity, which is often observed soon after injury and is thought to reflect compensatory recruitment of alternative pathways (16). Methodological differences may also play a role. Dynamic MEG-based analyses may be more sensitive to localized hub or long-range disruptions, whereas static EEG-based approaches capture broader global patterns. Stage of injury, analytic method, and sample characteristics likely explain why reductions are more apparent acutely, while chronic-phase data, including the present results, tend to show hyperconnectivity.
The compensatory hyperconnectivity model suggests that early increases in connectivity support recovery, but persistence into the chronic phase may signal inefficient signaling, maladaptive reorganization, or ongoing dysregulation (16). The absence of alpha and delta effects in chronic cohorts may further indicate that these bands are more sensitive to acute-stage disruptions, while later variability reflects divergent recovery trajectories and injury profiles. Source-level EEG connectivity metrics such as MIM align more closely with anatomical networks than traditional sensor-level approaches (49), reinforcing the validity of the present findings. Future multimodal work combining EEG with diffusion MRI will be critical to determine whether chronic hyperconnectivity reflects sustained compensation, unresolved structural injury, or contributes to long-term metabolic stress and neurodegenerative risk.
Several biological mechanisms may contribute to the persistent hyperconnectivity observed here. Chronic mTBI is associated with diffuse axonal injury, synaptic dysfunction, and disruptions in long-range white matter pathways, any of which can impair the efficiency of information transfer across cortical networks. Such disconnection may lead to increased functional coupling as networks recruit additional regions to maintain performance. Altered excitatory–inhibitory balance, including reduced GABAergic inhibition or chronic low-grade neuroinflammation, may also elevate baseline synchrony and increase directional connectivity. Whether these changes are compensatory or maladaptive likely depends on the stage of injury. Hyperconnectivity may initially support cognitive resilience by engaging alternative pathways, but persistent elevations years after injury may instead reflect inefficient signaling, increased metabolic demand, or reduced network specialization. The strong association with symptom burden in the present study is more consistent with a maladaptive or inefficient reorganization than a purely compensatory response.
MIM accurately classifies mTBI and tracks symptom burden
The multivariate interaction measure (MIM) robustly discriminated individuals with chronic mTBI from controls across multiple modeling approaches. A single-threshold decision rule (MIM > 0.174) achieved an AUC of 0.80, indicating strong sensitivity and specificity. More complex models, including penalized logistic regression and XGBoost, yielded similar performance and consistently identified elevated MIM as the most important predictor. Adding demographic variables such as age and sex provided little improvement, suggesting that MIM captures an injury-related signal independent of demographic factors. Thus, a single EEG-derived connectivity measure can accurately identify chronic mTBI, highlighting its promise as a simple and reliable screening tool.
These results are consistent with broader neuroimaging work showing that connectivity-based measures can classify TBI with high accuracy across modalities, including MEG, DTI, and resting-state fMRI (47, 50, 51). Unlike these approaches, which require high-cost imaging or high-density MEG/EEG, MIM maintained strong performance even with lower-density electrode arrays, underscoring its translational potential for clinical and field settings. Importantly, MIM also predicted individual symptom severity on the Neurobehavioral Symptom Inventory, with greater global connectivity associated with higher symptom burden. This relationship may reflect inefficient signaling or compensatory reorganization contributing to persistent cognitive and sensory difficulties. Longitudinal studies are needed to determine whether MIM changes track recovery or treatment response.
Clinical applications
These findings indicate that RS-EEG functional connectivity, quantified by MIM, has two potential clinical uses. First, elevated MIM provides a diagnostic signal, distinguishing individuals with chronic mTBI from controls with high accuracy even years after injury. Although the AUC values observed here are strong for research settings (AUC ≈ 0.79–0.89), they do not yet meet the performance thresholds typically required for clinical adoption, which include consistently higher accuracy (often greater than 0.85 to 0.90) and external validation. External validation refers to demonstrating that the model performs equivalently in fully independent cohorts, ideally collected at different sites or using different recording systems. Second, because connectivity strength scales with symptom burden, MIM also has utility for monitoring symptom severity over time. Although longitudinal studies are needed before applying MIM to treatment-response tracking, the current results support its use as both a diagnostic aid and a symptom-monitoring biomarker in chronic mTBI.
Comparison with existing biomarkers
It is important to consider how RS-EEG functional connectivity compares with currently available blood and imaging biomarkers. Blood-based markers such as GFAP and UCH-L1 primarily detect acute cellular injury, including astrocytic and axonal damage, but these signals diminish rapidly and show limited utility for identifying persistent dysfunction in the chronic stage. Structural MRI is often normal in individuals with chronic mTBI, and even advanced diffusion or functional MRI detects abnormalities in only a subset of patients. These modalities capture structural or microstructural injury but may not reflect how well cortical systems communicate once cellular-level processes have stabilized. In contrast, RS-EEG connectivity indexes distributed network function and reveals alterations in large-scale communication that can persist long after cellular injury has resolved. This distinction is important because chronic symptoms may arise not from ongoing cell damage but from lingering inefficiencies in network-level coordination. Thus, EEG-based functional connectivity provides a complementary biomarker that detects physiologic abnormalities often missed by blood or imaging assays, and it may be particularly valuable for characterizing chronic-stage dysfunction where existing biomarkers have limited sensitivity.
Interpreting EEG functional connectivity relative to MRI-based measures
FC derived from EEG and from functional MRI reflects fundamentally different physiological processes and should not be expected to show strong correspondence. EEG-based connectivity captures fast, frequency-specific interactions driven by neuronal synchronization, whereas fMRI-based connectivity reflects slow (<0.1 Hz) hemodynamic correlations that are only indirectly related to neural activity (52, 53). As a result, correspondence between EEG and fMRI connectivity is limited and varies with frequency band, brain region, analytic method, and behavioral state (54, 55). Conflicting findings in the TBI literature likely arise from these methodological differences, as well as heterogeneity in injury stage, outcome measures, and population studied. In particular, pediatric and adult TBI differ in neurodevelopmental context and compensatory capacity, limiting direct generalization across age groups. These considerations highlight the need to interpret EEG- and MRI-based connectivity as complementary, modality-specific biomarkers rather than interchangeable measures, especially for point-of-care and chronic-stage assessment.
Limitations
This study has several limitations. First, the relatively small sample size, particularly within the mTBI group (n = 18), limits statistical power and constrains the generalizability of the findings. Although the observed effects were supported by cross-validation and permutation testing, larger and more demographically diverse cohorts will be essential to confirm the robustness and reproducibility of the connectivity patterns and model performance. Second, because this was a cross-sectional study, we cannot determine the temporal stability of RS-EEG abnormalities or whether they change with recovery or treatment. Third, the absence of an independent external validation cohort prevents evaluation of model generalizability across different sites, populations, and recording systems. Finally, although we controlled for age and sex, other potential confounders (e.g., sleep, medications, comorbidities) may also influence RS-EEG measures. These limitations highlight the need for larger, longitudinal, multisite studies to validate RS-EEG functional connectivity as a clinically actionable biomarker for chronic mTBI.
Future directions towards scalable, non-invasive biomarkers of chronic mTBI
EEG offers advantages in accessibility, cost-efficiency, and scalability relative to imaging modalities such as fMRI or MEG, positioning it well for longitudinal and field-based applications. The present findings indicate that functional EEG measures, particularly MIM, may serve as durable indicators of persistent network disruption in chronic mTBI. Importantly, the robust effects observed even with reduced montages suggest that lower-density or portable systems could yield clinically meaningful information, supporting real-world feasibility.
Future research should prioritize replication in larger and more diverse cohorts, along with longitudinal designs that assess whether RS-EEG hyperconnectivity remains stable, resolves, or evolves over time and whether it predicts cognitive or functional outcomes. Mechanistic studies integrating EEG with complementary modalities such as fMRI, PET, or diffusion MRI will also be important for clarifying whether elevated connectivity reflects compensatory reorganization, inefficient signaling, or other chronic neurophysiological processes.
If validated in larger and independent cohorts, this approach may help address an unmet need in neurotrauma services for objective, scalable functional biomarkers suitable for deployment in major trauma centers, as highlighted in the DASIC matrix for traumatic brain injury care (56). By emphasizing non-invasive, low-burden acquisition and robustness to reduced electrode coverage, this work aligns with priorities for improving post-acute and chronic TBI assessment outside of specialized imaging facilities.
Conclusion
Overall, our findings demonstrate that functional connectivity, quantified by MIM, is highly sensitive to chronic mTBI. This hyperconnectivity effectively distinguishes individuals with mTBI from healthy controls and robustly predicts symptom severity across multiple machine learning approaches. Resting-state EEG combined with MIM offers an accessible, accurate tool for detecting network-level disruptions in patients with chronic mTBI. With further validation, RS-EEG could be incorporated into NIH and DoD biomarker frameworks that emphasize multimodal characterization of TBI. In particular, RS-EEG aligns with the functional biomarker domain of the CBI-M initiative (7) and may complement clinical, blood-based, and imaging modifiers to improve chronic-stage classification and support more comprehensive assessment pathways for persistent brain dysfunction.
Statements
Data availability statement
The datasets presented in this study can be found in the the Federal Interagency Traumatic Brain Injury Research (FITBIR) repository, further inquiries can be directed to the corresponding author.
Ethics statement
The studies involving humans were approved by Vanderbilt University Institutional Review Board. The studies were conducted in accordance with the local legislation and institutional requirements. The participants provided their written informed consent to participate in this study.
Author contributions
WM: Writing – original draft, Formal analysis. AC: Supervision, Writing – review & editing, Formal analysis. AK: Writing – review & editing, Supervision. TR: Funding acquisition, Writing – review & editing, Conceptualization, Supervision.
Funding
The author(s) declared that financial support was received for this work and/or its publication. This work was supported by the Department of Defense [W81XWH-17-2-0055, W911NF2120078, HT9425-24-1-0563, HT9425-25-1-0529]; the National Institutes of Health [NEI R01EY036252, NEI P30EY008126 (VVRC), NEI T32EY007135 (AC)]; the Marlene and Spencer Hays Directorship; the Potocsnak Discovery Grant in Regenerative Medicine; the Ret. Maj. General Stephen L. Jones, MD Fund; and the Research to Prevent Blindness, Inc. Unrestricted Funds (VEI). The authors thank Beth Miller, Catherine Diethelm, and Logan Crawford for assistance with participant recruitment, scheduling, and performing EEG recordings for this study. The Cartool software (cartoolcommunity.unige.ch) used in our analyses was programmed by Denis Brunet, from the Functional Brain Mapping Laboratory (FBMLab), Geneva, Switzerland, and is supported by the Center for Biomedical Imaging (CIBM) of Geneva and Lausanne. This study was approved by the Vanderbilt Institutional Review Board and the Department of Defense Human Research Protections Okice. All patients were consented according to regulatory approved procedures prior to assessments.
Conflict of interest
The author(s) declared that this work was conducted in the absence of any commercial or financial relationships that could be construed as a potential conflict of interest.
Generative AI statement
The author(s) declared that Generative AI was not used in the creation of this manuscript.
Any alternative text (alt text) provided alongside figures in this article has been generated by Frontiers with the support of artificial intelligence and reasonable efforts have been made to ensure accuracy, including review by the authors wherever possible. If you identify any issues, please contact us.
Publisher’s note
All claims expressed in this article are solely those of the authors and do not necessarily represent those of their affiliated organizations, or those of the publisher, the editors and the reviewers. Any product that may be evaluated in this article, or claim that may be made by its manufacturer, is not guaranteed or endorsed by the publisher.
Supplementary material
The Supplementary material for this article can be found online at: https://www.frontiersin.org/articles/10.3389/fneur.2025.1721726/full#supplementary-material
SUPPLEMENTARY FIGURE S1Mean Microstate Topographical Plots by Group. Topographical representations of the mean EEG microstates (A–E) for the case and control groups. Each scalp map shows the average spatial distribution of electrical potentials associated with the corresponding microstate.
SUPPLEMENTARY FIGURE S2Permutation distributions of AUC (Area Under the Curve) values for each model. Histograms display the frequency of AUC values under the null hypothesis for all three models (A–C). The dashed vertical line indicates the observed AUC for the true model in each case. In all comparisons, the observed AUC had statistically significant model performance above chance (p < 0.05).
SUPPLEMENTARY FIGURE S3Performance of group classifier models including Age and Sex Covariates. (A) ROC curve for an Elastic Net logistic regression classifier trained on MIM, age, and sex. The black line indicates the mean ROC curve across 20,000 bootstraps, with 95% confidence interval shaded in gray. (B) Histogram displaying the frequency of AUC values under the null hypothesis for the elastic net model. The dashed vertical line indicates the observed AUC for the true model in each case. The observed AUC had statistically significant model performance above chance (p < 0.05). (C) ROC curve for an XGBoost classifier trained on MIM, age, and sex. The black line indicates the mean ROC curve across 20,000 bootstraps, with 95% confidence interval shaded in gray. D: Histogram displaying the frequency of AUC values under the null hypothesis for the XGBoost model. The dashed vertical line indicates the observed AUC for the true model in each case. The observed AUC had statistically significant model performance above chance (p < 0.05).
SUPPLEMENTARY FIGURE S4Performance of demographic group classifier models (Age and Sex Predictors only). (A) ROC curve for an Elastic Net logistic regression classifier trained on age and sex. The black line indicates the mean ROC curve across 20,000 bootstraps, with 95% confidence interval shaded in gray. (B) Histogram displaying the frequency of AUC values under the null hypothesis for the Elastic Net model. The dashed vertical line indicates the observed AUC for the true model in each case. The observed AUC had statistically significant model performance above chance (p < 0.05). (C) ROC curve for an XGBoost classifier trained on age and sex. The black line indicates the mean ROC curve across 20,000 bootstraps, with 95% confidence interval shaded in gray. (D) Histogram displaying the frequency of AUC values under the null hypothesis for the XGBoost model. The dashed vertical line indicates the observed AUC for the true model in each case. The observed AUC had statistically significant model performance above chance (p < 0.05).
SUPPLEMENTARY FIGURE S5Performance of symptom classifier models including Age and Sex Covariates. (A) ROC curve for an Elastic Net logistic regression classifier trained on MIM, age, and sex. The black line indicates the mean ROC curve across 20,000 bootstraps, with 95% confidence interval shaded in gray. (B) Histogram displaying the frequency of AUC values under the null hypothesis for the elastic net model. The dashed vertical line indicates the observed AUC for the true model in each case. The observed model did not perform significantly above chance (p = 0.125). (C) ROC curve for an XGBoost classifier trained on MIM, age, and sex. The black line indicates the mean ROC curve across 20,000 bootstraps, with 95% confidence interval shaded in gray. (D) Histogram displaying the frequency of AUC values under the null hypothesis for the XGBoost model. The dashed vertical line indicates the observed AUC for the true model in each case. The observed AUC had statistically significant model performance above chance (p < 0.05).
SUPPLEMENTARY FIGURE S6Performance of symptom classifier models trained on demographics. (A) ROC curve for an Elastic Net logistic regression classifier trained on age and sex. The black line indicates the mean ROC curve across 20,000 bootstraps, with 95% confidence interval shaded in gray. (B) Histogram displaying the frequency of AUC values under the null hypothesis for the Elastic Net model. The dashed vertical line indicates the observed AUC for the true model in each case. The observed model did not perform significantly above chance (p = 0.698). (C) ROC curve for an XGBoost classifier trained on age and sex. The black line indicates the mean ROC curve across 20,000 bootstraps, with 95% confidence interval shaded in gray. (D) Histogram displaying the frequency of AUC values under the null hypothesis for the XGBoost model. The dashed vertical line indicates the observed AUC for the true model in each case. The observed model did not perform significantly above chance (p = 0.147).
References
1.
Bazarian JJ Blyth B Cimpello L . Bench to bedside: evidence for brain injury after concussion—looking beyond the computed tomography scan. Acad Emerg Med. (2006) 13:199–214. doi: 10.1197/j.aem.2005.07.031,
2.
McInnes K Friesen CL MacKenzie DE Westwood DA Boe SG . Mild traumatic brain injury (mTBI) and chronic cognitive impairment: a scoping review. PLoS One. (2017) 12:e0174847. doi: 10.1371/journal.pone.0174847
3.
Silverberg ND Iverson GL . Is rest after concussion “the best medicine?”: recommendations for activity resumption following concussion in athletes, civilians, and military service members. J Head Trauma Rehab. (2013) 28:250–9. doi: 10.1097/HTR.0b013e31825ad658,
4.
Theadom A Jones K Starkey N Barker-Collo S Ameratunga S Faulkner J et al . Symptoms and engagement in anti-social behavior 10 years after mild traumatic brain injury within a community civilian sample: a prospective cohort study with age-sex matched control group. Arch Phys Med Rehabil. (2024) 105:295–302. doi: 10.1016/j.apmr.2023.07.016,
5.
Maas AIR Menon DK Manley GT Abrams M Åkerlund C Andelic N et al . Traumatic brain injury: progress and challenges in prevention, clinical care, and research. Lancet Neurol. (2022) 21:1004–60. doi: 10.1016/S1474-4422(22)00309-X,
6.
Nelson LD Temkin NR Barber J Brett BL Okonkwo DO McCrea MA et al . Functional recovery, symptoms, and quality of life 1 to 5 years after traumatic brain injury. JAMA Netw Open. (2023) 6:e233660. doi: 10.1001/jamanetworkopen.2023.3660
7.
Manley GT Dams-O’Connor K Alosco ML Awwad HO Bazarian JJ Bragge P et al . A new characterisation of acute traumatic brain injury: the NIH-NINDS TBI classification and nomenclature initiative. Lancet Neurol. (2025) 24:512–23. doi: 10.1016/S1474-4422(25)00154-1,
8.
Wang KK Yang Z Zhu T Shi Y Rubenstein R Tyndall JA et al . An update on diagnostic and prognostic biomarkers for traumatic brain injury. Expert Rev Mol Diagn. (2018) 18:165–80. doi: 10.1080/14737159.2018.1428089,
9.
Michel CM Koenig T . EEG microstates as a tool for studying the temporal dynamics of whole-brain neuronal networks: a review. NeuroImage. (2018) 180:577–93. doi: 10.1016/j.neuroimage.2017.11.062,
10.
Tarailis P Koenig T Michel CM Griškova-Bulanova I . The functional aspects of resting EEG microstates: a systematic review. Brain Topogr. (2024) 37:181–217. doi: 10.1007/s10548-023-00958-9,
11.
Asha SA Sudalaimani C Devanand P Alexander G Sanjeev VT et al . Analysis of EEG microstates as biomarkers in neuropsychological processes - review. Comput Biol Med. (2024) 173:108266. doi: 10.1016/j.compbiomed.2024.108266
12.
Dharan AL Bowden SC Lai A Peterson ADH Cheung MWL Woldman W et al . Resting-state functional connectivity in the idiopathic generalized epilepsies: a systematic review and meta-analysis of EEG and MEG studies. Epilepsy Behav. (2021) 124:108336. doi: 10.1016/j.yebeh.2021.108336,
13.
Miljevic A Bailey NW Murphy OW Perera MPN Fitzgerald PB . Alterations in EEG functional connectivity in individuals with depression: a systematic review. J Affect Disord. (2023) 328:287–302. doi: 10.1016/j.jad.2023.01.126,
14.
Wang J Barstein J Ethridge LE Mosconi MW Takarae Y Sweeney JA . Resting state EEG abnormalities in autism spectrum disorders. J Neurodev Disord. (2013) 5:5–24. doi: 10.1186/1866-1955-5-24,
15.
Kucikova L Kalabizadeh H Motsi KG Rashid S O’Brien JT Taylor JP et al . A systematic literature review of fMRI and EEG resting-state functional connectivity in dementia with Lewy bodies: underlying mechanisms, clinical manifestation, and methodological considerations. Ageing Res Rev. (2024) 93:102159. doi: 10.1016/j.arr.2023.102159,
16.
Hillary FG Grafman JH . Injured brains and adaptive networks: the benefits and costs of hyperconnectivity. Trends Cogn Sci. (2017) 21:385–401. doi: 10.1016/j.tics.2017.03.003,
17.
Stahl AN Racca JM Kerley CI Anderson A Landman B Hood LJ et al . Comprehensive behavioral and physiologic assessment of peripheral and central auditory function in individuals with mild traumatic brain injury. Hear Res. (2024) 441:108928. doi: 10.1016/j.heares.2023.108928,
18.
Rasdall MA Cho C Stahl AN Tovar DA Lavin P Kerley CI et al . Primary visual pathway changes in individuals with chronic mild traumatic brain injury. JAMA Ophthalmol. (2025) 143:33–42. doi: 10.1001/jamaophthalmol.2024.5076,
19.
Vanderploeg RD Silva MA Soble JR Curtiss G Belanger HG Donnell AJ et al . The structure of Postconcussion symptoms on the neurobehavioral symptom inventory: a comparison of alternative models. J Head Trauma Rehabil. (2015) 30:1–11. doi: 10.1097/HTR.0000000000000009,
20.
Delorme A Makeig S . EEGLAB: an open source toolbox for analysis of single-trial EEG dynamics including independent component analysis. J Neurosci Methods. (2004) 134:9–21. doi: 10.1016/j.jneumeth.2003.10.009,
21.
Debnath R Buzzell GA Morales S Bowers ME Leach SC Fox NA . The Maryland analysis of developmental EEG (MADE) pipeline. Psychophysiology. (2020) 57:e13580. doi: 10.1111/psyp.13580,
22.
Widmann A Schröger E Maess B . Digital filter design for electrophysiological data – a practical approach. J Neurosci Methods. (2015) 250:34–46. doi: 10.1016/j.jneumeth.2014.08.002,
23.
Nolan H Whelan R Reilly RB . FASTER: fully automated statistical thresholding for EEG artifact rejection. J Neurosci Methods. (2010) 192:152–62. doi: 10.1016/j.jneumeth.2010.07.015,
24.
Mognon A Jovicich J Bruzzone L Buiatti M . ADJUST: an automatic EEG artifact detector based on the joint use of spatial and temporal features. Psychophysiology. (2011) 48:229–40. doi: 10.1111/j.1469-8986.2010.01061.x,
25.
Yilmaz G Ungan P Sebik O Uginčius P Türker KS . Interference of tonic muscle activity on the EEG: a single motor unit study. Front Hum Neurosci. (2014) 8:504. doi: 10.3389/fnhum.2014.00504
26.
Pellegrini F Delorme A Nikulin V Haufe S . Identifying good practices for detecting inter-regional linear functional connectivity from EEG. NeuroImage. (2023) 277:120218. doi: 10.1016/j.neuroimage.2023.120218
27.
Oostenveld R Stegeman DF Praamstra P van Oosterom A . Brain symmetry and topographic analysis of lateralized event-related potentials. Clin Neurophysiol. (2003) 114:1194–202. doi: 10.1016/S1388-2457(03)00059-2,
28.
Holmes CJ Hoge R Collins L Woods R Toga AW Evans AC . Enhancement of MR images using registration for signal averaging. J Comput Assist Tomogr. (1998) 22:324–33. doi: 10.1097/00004728-199803000-00032,
29.
Pascual-Marqui RD Lehmann D Koukkou M Kochi K Anderer P Saletu B et al . Assessing interactions in the brain with exact low-resolution electromagnetic tomography. Philos Trans R Soc Lond A Math Phys Eng Sci. (2011) 369:3768–84. doi: 10.1098/rsta.2011.0081
30.
Desikan RS Ségonne F Fischl B Quinn BT Dickerson BC Blacker D et al . An automated labeling system for subdividing the human cerebral cortex on MRI scans into gyral based regions of interest. NeuroImage. (2006) 31:968–80. doi: 10.1016/j.neuroimage.2006.01.021,
31.
Nwakamma MC Stillman AM Gabard-Durnam LJ Cavanagh JF Hillman CH Morris TP . Slowing of parameterized resting-state electroencephalography after mild traumatic brain injury. Neurotrauma Rep. (2024) 5:448–61. doi: 10.1089/neur.2024.0004,
32.
Franke LM Perera RA Sponheim SR . Long-term resting EEG correlates of repetitive mild traumatic brain injury and loss of consciousness: alterations in alpha-beta power. Front Neurol. (2023) 14:1241481. doi: 10.3389/fneur.2023.1241481,
33.
Benjamini Y Hochberg Y . Controlling the false discovery rate: a practical and powerful approach to multiple testing. J R Stat Soc Ser B (Methodol). (1995) 57:289–300. doi: 10.1111/j.2517-6161.1995.tb02031.x
34.
Donoghue T Haller M Peterson EJ Varma P Sebastian P Gao R et al . Parameterizing neural power spectra into periodic and aperiodic components. Nat Neurosci. (2020) 23:1655–65. doi: 10.1038/s41593-020-00744-x,
35.
Nagabhushan Kalburgi S Kleinert T Aryan D Nash K Schiller B Koenig T . MICROSTATELAB: the EEGLAB toolbox for resting-state microstate analysis. Brain Topogr. (2024) 37:621–45. doi: 10.1007/s10548-023-01003-5,
36.
Bréchet L Brunet D Birot G Gruetter R Michel CM Jorge J . Capturing the spatiotemporal dynamics of self-generated, task-initiated thoughts with EEG and fMRI. NeuroImage. (2019) 194:82–92. doi: 10.1016/j.neuroimage.2019.03.029
37.
Koenig T Kottlow M Stein M Melie-García L . Ragu: a free tool for the analysis of EEG and MEG event-related scalp field data using global randomization statistics. Comput Intell Neurosci. (2011) 2011:938925. doi: 10.1155/2011/938925,
38.
Wilcox RR . Introduction to robust estimation and hypothesis testing. Boston: Academic Press (2011). 713 p.
39.
Youden WJ . Index for rating diagnostic tests. Cancer. (1950) 3:32–5. doi: 10.1002/1097-0142(1950)3:1<32::AID-CNCR2820030106>3.0.CO;2-3,
40.
Zou H Hastie T . Regularization and variable selection via the elastic net. J R Stat Soc Ser B Stat Methodol. (2005) 67:301–20. doi: 10.1111/j.1467-9868.2005.00503.x
41.
Chen T Guestrin C . XGBoost: a scalable tree boosting system In: Proceedings of the 22nd ACM SIGKDD international conference on knowledge discovery and data mining. New York, NY, USA: Association for Computing Machinery (2016). 785–94.
42.
Mandrekar JN . Receiver operating characteristic curve in diagnostic test assessment. J Thorac Oncol. (2010) 5:1315–6. doi: 10.1097/JTO.0b013e3181ec173d,
43.
Ueda M Ueno K Yuri T Aoki Y Hata M Inoue T et al . EEG oscillatory activity and resting-state networks associated with neurocognitive function in mild traumatic brain injury. Clin EEG Neurosci. (2025) 56:271–81. doi: 10.1177/15500594241290858,
44.
Moore RD Sauve W Ellemberg D . Neurophysiological correlates of persistent psycho-affective alterations in athletes with a history of concussion. Brain Imaging Behav. (2016) 10:1108–16. doi: 10.1007/s11682-015-9473-6,
45.
Munia TTK Gendreau JL Verma AK Johnson BD Romanick M Tavakolian K et al . Preliminary results of residual deficits observed in athletes with concussion history: combined EEG and cognitive study. Annu Int Conf IEEE Eng Med Biol Soc. (2016) 2016:41–4. doi: 10.1109/EMBC.2016.7590635,
46.
Corradini PL Persinger MA . Spectral power, source localization and microstates to quantify chronic deficits from ‘mild’ closed head injury: correlation with classic neuropsychological tests. Brain Inj. (2014) 28:1317–27. doi: 10.3109/02699052.2014.916819,
47.
Antonakakis M Dimitriadis SI Zervakis M Papanicolaou AC Zouridakis G . Aberrant whole-brain transitions and dynamics of spontaneous network microstates in mild traumatic brain injury. Front Comput Neurosci. (2020) 13:1–19. doi: 10.3389/fncom.2019.00090
48.
Wu S Fu Z Wang S Zheng F Qiu W Xu G et al . Disrupted functional brain network architecture in sufferers with boxing-related repeated mild traumatic brain injury: a resting-state EEG study. J Integr Neurosci. (2024) 23:1–15. doi: 10.31083/j.jin2305102
49.
Babaeeghazvini P Rueda-Delgado LM Gooijers J Swinnen SP Daffertshofer A . Brain structural and functional connectivity: a review of combined works of diffusion magnetic resonance imaging and electro-encephalography. Front Hum Neurosci. (2021) 15:1–23. doi: 10.3389/fnhum.2021.721206
50.
Harrington DL Hsu PY Theilmann RJ Angeles-Quinto A Robb-Swan A Nichols S et al . Detection of chronic blast-related mild traumatic brain injury with diffusion tensor imaging and support vector machines. Diagnostics (Basel). (2022) 12:987. doi: 10.3390/diagnostics12040987,
51.
Vergara VM Mayer AR Damaraju E Kiehl KA Calhoun V . Detection of mild traumatic brain injury by machine learning classification using resting state functional network connectivity and fractional anisotropy. J Neurotrauma. (2017) 34:1045–53. doi: 10.1089/neu.2016.4526,
52.
Logothetis NK Pauls J Augath M Trinath T Oeltermann A . Neurophysiological investigation of the basis of the fMRI signal. Nature. (2001) 412:150–7. doi: 10.1038/35084005,
53.
Buzsáki G Anastassiou CA Koch C . The origin of extracellular fields and currents— EG, ECoG, LFP and spikes. Nat Rev Neurosci. (2012) 13:407–20. doi: 10.1038/nrn3241,
54.
Deligianni F Centeno M Carmichael DW Clayden JD . Relating resting-state fMRI and EEG whole-brain connectomes across frequency bands. Front Neurosci. (2014) 8:1–16. doi: 10.3389/fnins.2014.00258
55.
Wirsich J Iannotti GR Ridley B Shamshiri EA Sheybani L Grouiller F et al . Altered correlation of concurrently recorded EEG-fMRI connectomes in temporal lobe epilepsy. Netw Neurosci. (2024) 8:466–85. doi: 10.1162/netn_a_00362,
56.
Dasic D Morgan L Panezai A Syrmos N Ligarotti GKI Zaed I et al . A scoping review on the challenges, improvement programs, and relevant output metrics for neurotrauma services in major trauma centers. Surg Neurol Int. (2022) 13:171. doi: 10.25259/SNI_203_2022,
Summary
Keywords
mild TBI, resting-state EEG, multivariate interaction measure, functional connectivity, machine learning, classification, biomarker
Citation
Marshall WJ, Conner AN, Key AP and Rex TS (2026) Resting-state EEG and machine learning to investigate cortical connectivity as a biomarker in chronic mTBI. Front. Neurol. 16:1721726. doi: 10.3389/fneur.2025.1721726
Received
09 October 2025
Revised
15 December 2025
Accepted
26 December 2025
Published
26 January 2026
Volume
16 - 2025
Edited by
Deborah Shear, Central Michigan University, United States
Reviewed by
Mario Ganau, Oxford University Hospitals NHS Trust, United Kingdom
Yorito Hattori, National Cerebral and Cardiovascular Center (Japan), Japan
Updates
Copyright
© 2026 Marshall, Conner, Key and Rex.
This is an open-access article distributed under the terms of the Creative Commons Attribution License (CC BY). The use, distribution or reproduction in other forums is permitted, provided the original author(s) and the copyright owner(s) are credited and that the original publication in this journal is cited, in accordance with accepted academic practice. No use, distribution or reproduction is permitted which does not comply with these terms.
*Correspondence: Tonia S. Rex, tonia.rex@vumc.org
†These authors have contributed equally to this work
Disclaimer
All claims expressed in this article are solely those of the authors and do not necessarily represent those of their affiliated organizations, or those of the publisher, the editors and the reviewers. Any product that may be evaluated in this article or claim that may be made by its manufacturer is not guaranteed or endorsed by the publisher.