Abstract
Introduction:
Accurate neuroprognostication following cardiac arrest is essential for clinical decision-making; however, the comparative diagnostic performance of continuous electroencephalography (cEEG) and routine electroencephalography (rEEG) remains uncertain. Although cEEG is preferred for the detection of dynamic electrographic abnormalities such as nonconvulsive status epilepticus, the implementation of this technique is limited by high resource demands. Whether rEEG, a typically brief (20–30 min) recording, provides comparable prognostic accuracy is still debated.
Methods:
We searched PubMed, Embase, Web of Science, and the Cochrane Library from January 2010 to December 2024 for studies relating to comatose post-cardiac arrest patients. Methodological quality was assessed using quality assessment of diagnostic accuracy studies 2 (QUADAS-2) and QUADAS-C. Statistical analyses were performed using Stata v18.0, with pooled sensitivity, specificity, and area under the summary receiver operating characteristic (SROC) curve (AUC) was estimated using random-effects models.
Results:
Sixteen studies (5,895 patients) were included. cEEG exhibited a pooled sensitivity of 0.53 [95% confidence interval (CI): 0.45–0.61] and specificity of 0.99 (95% CI: 0.97–1.00; AUC = 0.85). rEEG yielded a sensitivity of 0.50 (95% CI: 0.42–0.58) and a specificity of 0.97 (95% CI: 0.92–0.99; AUC = 0.75). Sensitivity analyses confirmed robustness while Deeks’ test indicated low publication bias (cEEG: p = 0.48; rEEG: p = 0.05).
Discussion:
Despite the theoretical advantages of cEEG in monitoring evolving brain activity, rEEG demonstrated comparable diagnostic performance, particularly in specificity, with substantially lower resource requirements. Our findings suggest that rEEG may serve as a feasible alternative or complementary tool to cEEG, especially in resource-constrained or time-sensitive settings, thereby supporting more accessible EEG-based neuroprognostication.
Systematic review registration:
https://www.crd.york.ac.uk/PROSPERO/view/CRD420251151755, CRD420251151755.
1 Introduction
Cardiac arrest (CA) is one of the leading cardiovascular emergencies worldwide, resulting in up to 20% of global deaths (1, 2). The pathogenesis of CA is complex and is characterized primarily by systemic multi-organ ischemia–reperfusion injury, which frequently culminates in organ dysfunction or failure (3). Over recent years, continual refinements in the concepts of cardiopulmonary resuscitation and the optimization of advanced life support systems have markedly increased the rate of return of spontaneous circulation (ROSC) to approximately 37% (95% confidence interval: 23–54%) (4). Nevertheless, despite improved survival, 45–70% of resuscitated patients develop hypoxic–ischemic brain injury, and approximately 30% of patients ultimately sustain severe neurological impairment, reflected by Cerebral Performance Category (CPC) scores of 3–5 (5, 6). This type of brain injury leads to disorders of consciousness and cognition and, given the high medical costs and intensive caregiving requirements, constitutes a central challenge in neurocritical care.
During prognostic assessment after CA, a number of variables, including age, initial cardiac rhythm (shockable versus non-shockable), and secondary seizures, including nonconvulsive status epilepticus (NCSE), can influence neurological outcomes via distinct mechanisms. Recent evidence demonstrated that among patients with ventricular fibrillation (VF), one-month survival and the proportion of patients achieving a CPC 1–2 were 23 and 17%, respectively, whereas the corresponding figures for patients with pulseless electrical activity (PEA) were 9 and 3% (7). These data indicated that VF is associated with a better neurological prognosis than PEA.
No single clinical indicator can fully capture the dynamic evolution of brain injury. Accordingly, international guidelines, such as those of the American Heart Association and the European Resuscitation Council, strongly recommend multimodal assessment integrating clinical features, neurophysiological data, molecular biomarkers, and neuroimaging (8). This multimodal approach improves prognostication after CA, particularly with respect to neurological recovery. By providing continuous and real-time information on cortical activity, electroencephalography (EEG) provides unique advantages for evaluating the severity of brain injury and informing prognosis (9), and thus is crucial in multimodal evaluation frameworks.
First, EEG has significant value for early-warning value and can identify early abnormalities such as an unreactive background, status epilepticus, and low-voltage patterns, which are closely associated with poor outcomes (10). Previous studies have shown that early EEG monitoring within 24 h exhibits high sensitivity and specificity for predicting neurological outcomes after CA (11). Moreover, the absence of EEG reactivity is regarded as an independent predictor of an unfavorable prognosis (12). Second, compared with clinical examinations that are subject to observer variability, quantitative techniques, such as spectral analysis, provide objective and quantifiable EEG parameters, such as high-frequency spikes and connectivity alterations that more accurately reflect brain function (13). Third, EEG is flexible and can be used alone or combined with clinical indicators (e.g., pupillary reflexes, pain responses), imaging (e.g., computed tomography, magnetic resonance imaging), and biomarkers [e.g., neuron-specific enolase (NSE)] to construct multimodal predictive models (14) that substantially enhance accuracy. Finally, standardized EEG terminology developed by the American Clinical Neurophysiology Society (ACNS) provides consistent evaluative criteria across studies (15), thus improving the practicality and comparability of EEG in multimodal prognostication. Collectively, these features reinforce EEG as an indispensable tool for neuroprognostic assessment following CA.
Over recent years, research has increasingly focused on comparing rEEG (16), typically a single 20–30-min recording, with cEEG (17), which generally lasts 24–48 h or even several days. Relative to rEEG, recent evidence has shown that cEEG provides higher sensitivity for detecting seizures (particularly NCSE) and for characterizing background EEG patterns; accordingly, the ACNS recommends cEEG monitoring for CA patients (18).
Despite these advantages, cEEG faces several limitations in clinical practice. First, resource consumption and cost are substantially higher than for rEEG, including sustained monitoring equipment, specialized personnel, and greater hospital resources; these factors particularly limit the adoption of this strategy in resource-constrained settings. Second, although cEEG provides more detailed EEG information, the incremental clinical value of this technique has yet to be fully validated and previous studies have not consistently demonstrated that cEEG improves patient outcomes. Therefore, existing evidence is insufficient to support the universal promotion of cEEG across all clinical scenarios (19).
In contrast, rEEG demonstrates unique practical value. For patients who cannot tolerate prolonged monitoring, repeated rEEG recordings can efficiently obtain key prognostic information (20). Existing studies further suggest that rEEG performs comparably to cEEG in terms of prognostic discrimination (21, 22), with superior cost-effectiveness in resource-limited or cost-sensitive contexts (23, 24). These findings provide a robust clinical rationale for optimizing EEG monitoring strategies to achieve precise yet economical patient management.
The current controversy over whether cEEG is superior to rEEG centers on whether intensifying monitoring improves prognostic assessment in a meaningful manner. Due to the lack of large, rigorously designed, multicenter, randomized and controlled trials, conclusive evidence that cEEG outperforms rEEG for prognostication is still lacking. Therefore, in the present study, we used meta-analytic methods to comprehensively compare the diagnostic value of rEEG versus cEEG for predicting outcomes after CA. Our findings are expected to guide the clinical selection of optimal EEG monitoring strategies under varying conditions, balancing diagnostic accuracy with rational resource allocation.
2 Materials and methods
This systematic review was conducted in accordance with the Preferred Reporting Items for Systematic Reviews and Meta-Analyses (PRISMA) guidelines (25) for diagnostic test accuracy reviews (Supplementary material) and was prospectively registered in PROSPERO (Reference: CRD420251151755).
2.1 Inclusion criteria
2.1.1 Patient population
The inclusion criteria were as follows: (1) patients admitted with coma following CA; patients with unresponsive wakefulness syndrome or a Glasgow Coma Scale (GCS) score ≤8 were considered comatose; and (2) studies including patients with hypoxic coma due to causes other than CA.
The exclusion criteria were as follows: (1) individuals younger than 18 years; (2) patients with a previous history of epilepsy or related disorders; and (3) failure to achieve sustained ROSC after admission.
2.1.2 Interventions
Differences in standard in-hospital care after admission, such as targeted temperature management, were not considered in this review. Eligible cohorts were those in which EEG assessment (primarily cEEG and rEEG) was performed.
2.1.3 Outcomes
The primary outcome was the neurological outcome rated at specified time points after admission using the CPC scale; CPC 1–2 was defined as a favorable outcome, and CPC 3–5 as an unfavorable outcome (26).
The secondary outcomes included mortality, quality-of-life, and adverse events.
2.1.4 Study designs
Eligible designs included randomized controlled trials, prospective nonrandomized studies, observational studies, cohort studies, and retrospective studies that met the above inclusion criteria. Meta-analyses, systematic reviews, narrative reviews, pathology reports, and conference abstracts were excluded because methodological quality could not be adequately assessed.
2.1.5 Scope of EEG assessment
The meta-analysis presented focuses on comparing the overall diagnostic performance of two EEG monitoring modalities (cEEG vs. rEEG) for predicting unfavorable outcomes after cardiac arrest. However, this study does not aim to evaluate the sensitivity, specificity, or prognostic value of individual EEG patterns separately. Individual EEG patterns include, but are not limited to, unreactive background, NCSE, low-voltage patterns, and spectral abnormalities. We synthesized the diagnostic accuracy of each EEG modality, instead of analyzing specific EEG patterns. The scope of the study aligns with the core objectives, providing evidence for the rational selection of EEG monitoring strategies in clinical practice.
2.2 Search strategy and selection criteria
Following the PICO framework (participants, interventions, comparisons and outcomes) (27) and with reference to other systematic reviews comparing the cEEG and rEEG detection rates of prognostic indicators in CA, we developed a comprehensive search strategy. We searched PubMed, Embase, Web of Science, and the Cochrane Library for literature published from January 1 2010 to December 31, 2024. The strategy was developed collaboratively by LJY, LX, and YYH and reviewed by an experienced neurologist (HNT) to enhance search quality. Population terms (“Heart arrest,” “Hypoxia-Ischemia, Brain,” or “Coma”) were combined with intervention terms (“cEEG” or “rEEG”). Specific details of the search strategy are provided in Supplementary material. Initial records were imported into EndNote v20.0 (Clarivate, Philadelphia, PA, United States). Two independent authors (LJY and YYH) screened titles and abstracts against eligibility criteria to identify potentially relevant studies, followed by independent full-text review of jointly selected records to minimize bias. Discrepancies were adjudicated by a third reviewer (LX).
2.3 Data extraction and quality assessment
Two independent reviewers (LJY and JZH) extracted data into a standardized MS Excel form (Microsoft Corporation, Redmond, WA, United States), including authorship, publication year, study design, population characteristics, and diagnostic contingency data [true positive (TP), false positive (FP), false negative (FN), and true negative (TN)]. Eligible trials were appraised using the QUADAS-2 checklist (Supplementary material) and its comparative extension (QUADAS-C) across four domains: patient selection, index test, reference standard, and flow/timing (28, 29). Risk of bias (RoB) was judged for each domain, and applicability concerns were evaluated for the first three domains. For patient selection, studies that did not specify consecutive or random recruitment were considered to be associated with a high RoB. For the index test domain, if EEG readers analyzing cEEG or rEEG patterns were not blinded to the patient’s clinical context, other neuroprognostic test results, or final outcomes, interpretive bias was considered present and such studies were rated as been associated with a high RoB. For the reference standard, because all included studies used commonly accepted prognostic tools [e.g., CPC, modified Rankin Scale (mRS), or neurological examination] as primary endpoints, and because these assessments were independent of EEG interpretation without the incorporation of index-test results, the RoB for this domain was deemed low for all studies. With regards to flow and timing, studies that did not clearly report the timing of EEG relative to CA occurrence, the completion of resuscitation, or the completion of temperature management were considered to provide incomplete information relating to patient flow and scheduling and were rated as having a high RoB in this domain. When insufficient information precluded the complete evaluation of any domain, RoB was judged as unclear. All papers were assessed independently by two authors (LJY and JZH), with disagreements resolved by a third author (LX).
2.4 Statistical methods
We performed meta-analyses using Stata v18 (StataCorp, College Station, TX, United States). For each study included in our final analysis, we estimated pooled sensitivity, specificity, diagnostic odds ratio (DOR) with 95% confidence intervals (CIs), and the area under the SROC curve (AUC) to evaluate diagnostic accuracy. Pooled estimates are reported with 95% CIs and all tests were two-sided with statistical significance set at p < 0.05. Between-study heterogeneity was assessed using the I2 statistic (30). AUC values were interpreted as follows: 0.5, non-informative test; 0.5–0.7, low accuracy; 0.7–0.9, moderate accuracy; 0.9–1.0, high accuracy; and 1.0, perfect test (31). Given substantial heterogeneity, random-effects models were applied for sensitivity analyses. Publication bias was assessed using Deeks’ test.
2.5 Handling of multiple data points from a single study
For studies reporting predictive performance at multiple time points after CA, we treated each EEG assessment as an independent data point in the quantitative synthesis. This decision was based on the clinical and biological premise that recordings obtained at different time windows capture distinct pathophysiological stages of post–cardiac arrest brain injury and are interpreted within different clinical decision-making contexts; thus, they effectively address related but non-identical prognostic questions. Accordingly, these time-specific estimates were included separately and pooled using random-effects models. The robustness of the resulting summary estimates was further evaluated through sensitivity analyses.
3 Results
3.1 Literature search results
A total of 3,070 records were identified in our initial search: PubMed (n = 618), Embase (n = 1,700), Web of Science (n = 715), and Cochrane Library (n = 37). After removing duplicates and screening titles/abstracts, 240 studies were retained for full-text review. Of these, 224 did not meet the inclusion criteria and were excluded, leaving 16 studies for inclusion in our final review. Specific details are provided in Figure 1.
Figure 1

Flow diagram for study selection.
3.2 Baseline characteristics of the included literature
Following the predefined inclusion and exclusion criteria, 16 studies were ultimately included, comprising a total of 5,895 patients. Definitions of unfavorable outcome varied across studies. Thirteen studies (81.3%) used CPC 3–5 as the definition of an unfavorable outcome; one study (6.3%) used CPC 4–5; the remaining two studies adopted alternative endpoints: one used mRS 4–5, and one used the Glasgow-Pittsburgh cerebral performance classification (GCS-M) 1–3. With respect to design, 12 studies (75.0%) were prospective and four were retrospective. A summary of study characteristics is provided in Table 1.
Table 1
| Author/year | Country | Timing of outcome assessment | Design | Primary disease | Age | Female gender | No. of patience | Main outcome | Definition of poor outcome |
|---|---|---|---|---|---|---|---|---|---|
| Backman et al. (41) | Sweden | N/A | Prospective cohort study | CA | 63 (56–70) | 32 | 207 | CPC | CPC1-2 vs. CPC3-5 |
| Scarpino et al. (42) | Italy | 2016.6.1–2018.6.1 | Prospective cohort study | CA | 48–71 | 130 | 396 | CPC | CPC1-3 vs. CPC4-5 |
| Turella et al. (34) | Austria | N/A | Prospective cohort study | CA | 65 | 176 | 873 | mRS | mRS0-3 vs. mRS4-5 |
| Admiraal et al. (35) | Netherlands | 2015.4–2018.2 | Prospective cohort study | CA | 62 | 160 | 186 | CPC | CPC1-2 vs. CPC3-5 |
| Bang et al. (40) | South Korea | 2015.10–2018.12 | Prospective cohort study | CA | 59 | N/A | 1,327 | GCS-M | GCS-M4-6 vs. GCS-M1-3 |
| Barth et al. (45) | Switzerland | 2016.1–2019.3 | Retrospective cohort study | CA | 58/65 | 89 | 114 | CPC | CPC1-2 vs. CPC3-5 |
| Benghanem et al. (46) | France | 2007–2016 | Retrospective cohort study | CA | 63 | 428 | 552 | CPC | CPC1-2 vs. CPC3-5 |
| Broman et al. (44) | Europe and Australia | 2010–2013 | Prospective cohort study | CA | 66 | 142 | 169 | CPC | CPC1-2 vs. CPC3-5 |
| Glimmerveen et al. (32) | Netherlands | 2010.6–2017.11 | Prospective cohort study | CA | 68/74 | N/A | N/A | CPC | CPC1-2 vs. CPC3-5 |
| Keijzer et al. (38) | Netherlands | 2010.6–2018.6 | Prospective cohort study | CA | 60/65 | 163 | 683 | CPC | CPC1-2 vs. CPC3-5 |
| Kim et al. (33) | South Korea | 2015.10–2018.12 | Prospective cohort study | CA | 58(46–69) | 145 | 489 | CPC | CPC1-2 vs. CPC3-5 |
| Westhall et al. (43) | Sweden | 2010.11–2013.1 | Prospective cohort study | CA | 67 ± 11 | 42 | 202 | CPC | CPC1-2 vs. CPC3-5 |
| Park et al. (39) | South Korea | 2018.5–2022.6 | Retrospective cohort study | CA | 57(40–68) | 34 | 130 | CPC | CPC1-2 vs. CPC3-5 |
| Rossetti et al. (21) | Switzerland | 2009.4–2016.3 | Prospective cohort study | CA | 61.2/61.8 | 102 | 357 | CPC | CPC1-2 vs. CPC3-5 |
| Peluso et al. (37) | Belgium | 2016.1–2019.3 | Retrospective cohort study | CA | 65 (54–72) | 43 | 138 | CPC | CPC1-2 vs. CPC3-5 |
| Qing et al. (13) | United States | 2013.11–2019.10 | Prospective cohort study | CA | 44.5(32–54) | 23 | 72 | CPC | CPC1-2 vs. CPC3-5 |
Characteristics of the included studies in the meta-analysis.
3.3 Quality assessment of included literature
Figure 2 summarize QUADAS-2 and QUADAS-C assessments, indicating mixed methodological quality. In QUADAS-2, the proportions rated with a low RoB in the cEEG subgroup were 75.0% (patient selection), 62.5% (index test), 100% (reference standard), and 53.1% (flow/timing); in the rEEG subgroup these proportions were 90.6, 58.3, 100, and 46.9%, respectively. In QUADAS-C comparative evaluations, the proportions rated with a low RoB were 20.0% (patient selection), 67.6% (index test), 97.0% (reference standard), and 64.5% (flow/timing). Major sources of RoB were evident in flow/timing, for which 46.9% (cEEG) and 53.1% (rEEG) of studies exhibited high or unclear bias. RoB was also prominent with regards to patient selection, with 80.0% of studies in QUADAS-C exhibiting high or unclear bias, largely due to nonconsecutive or nonrandom patient inclusion. Because all studies used accepted prognostic tools (CPC, mRS, or neurological examination) as primary endpoints, the reference-standard domain generally demonstrated good applicability and was rated as having a low RoB across studies.
Figure 2
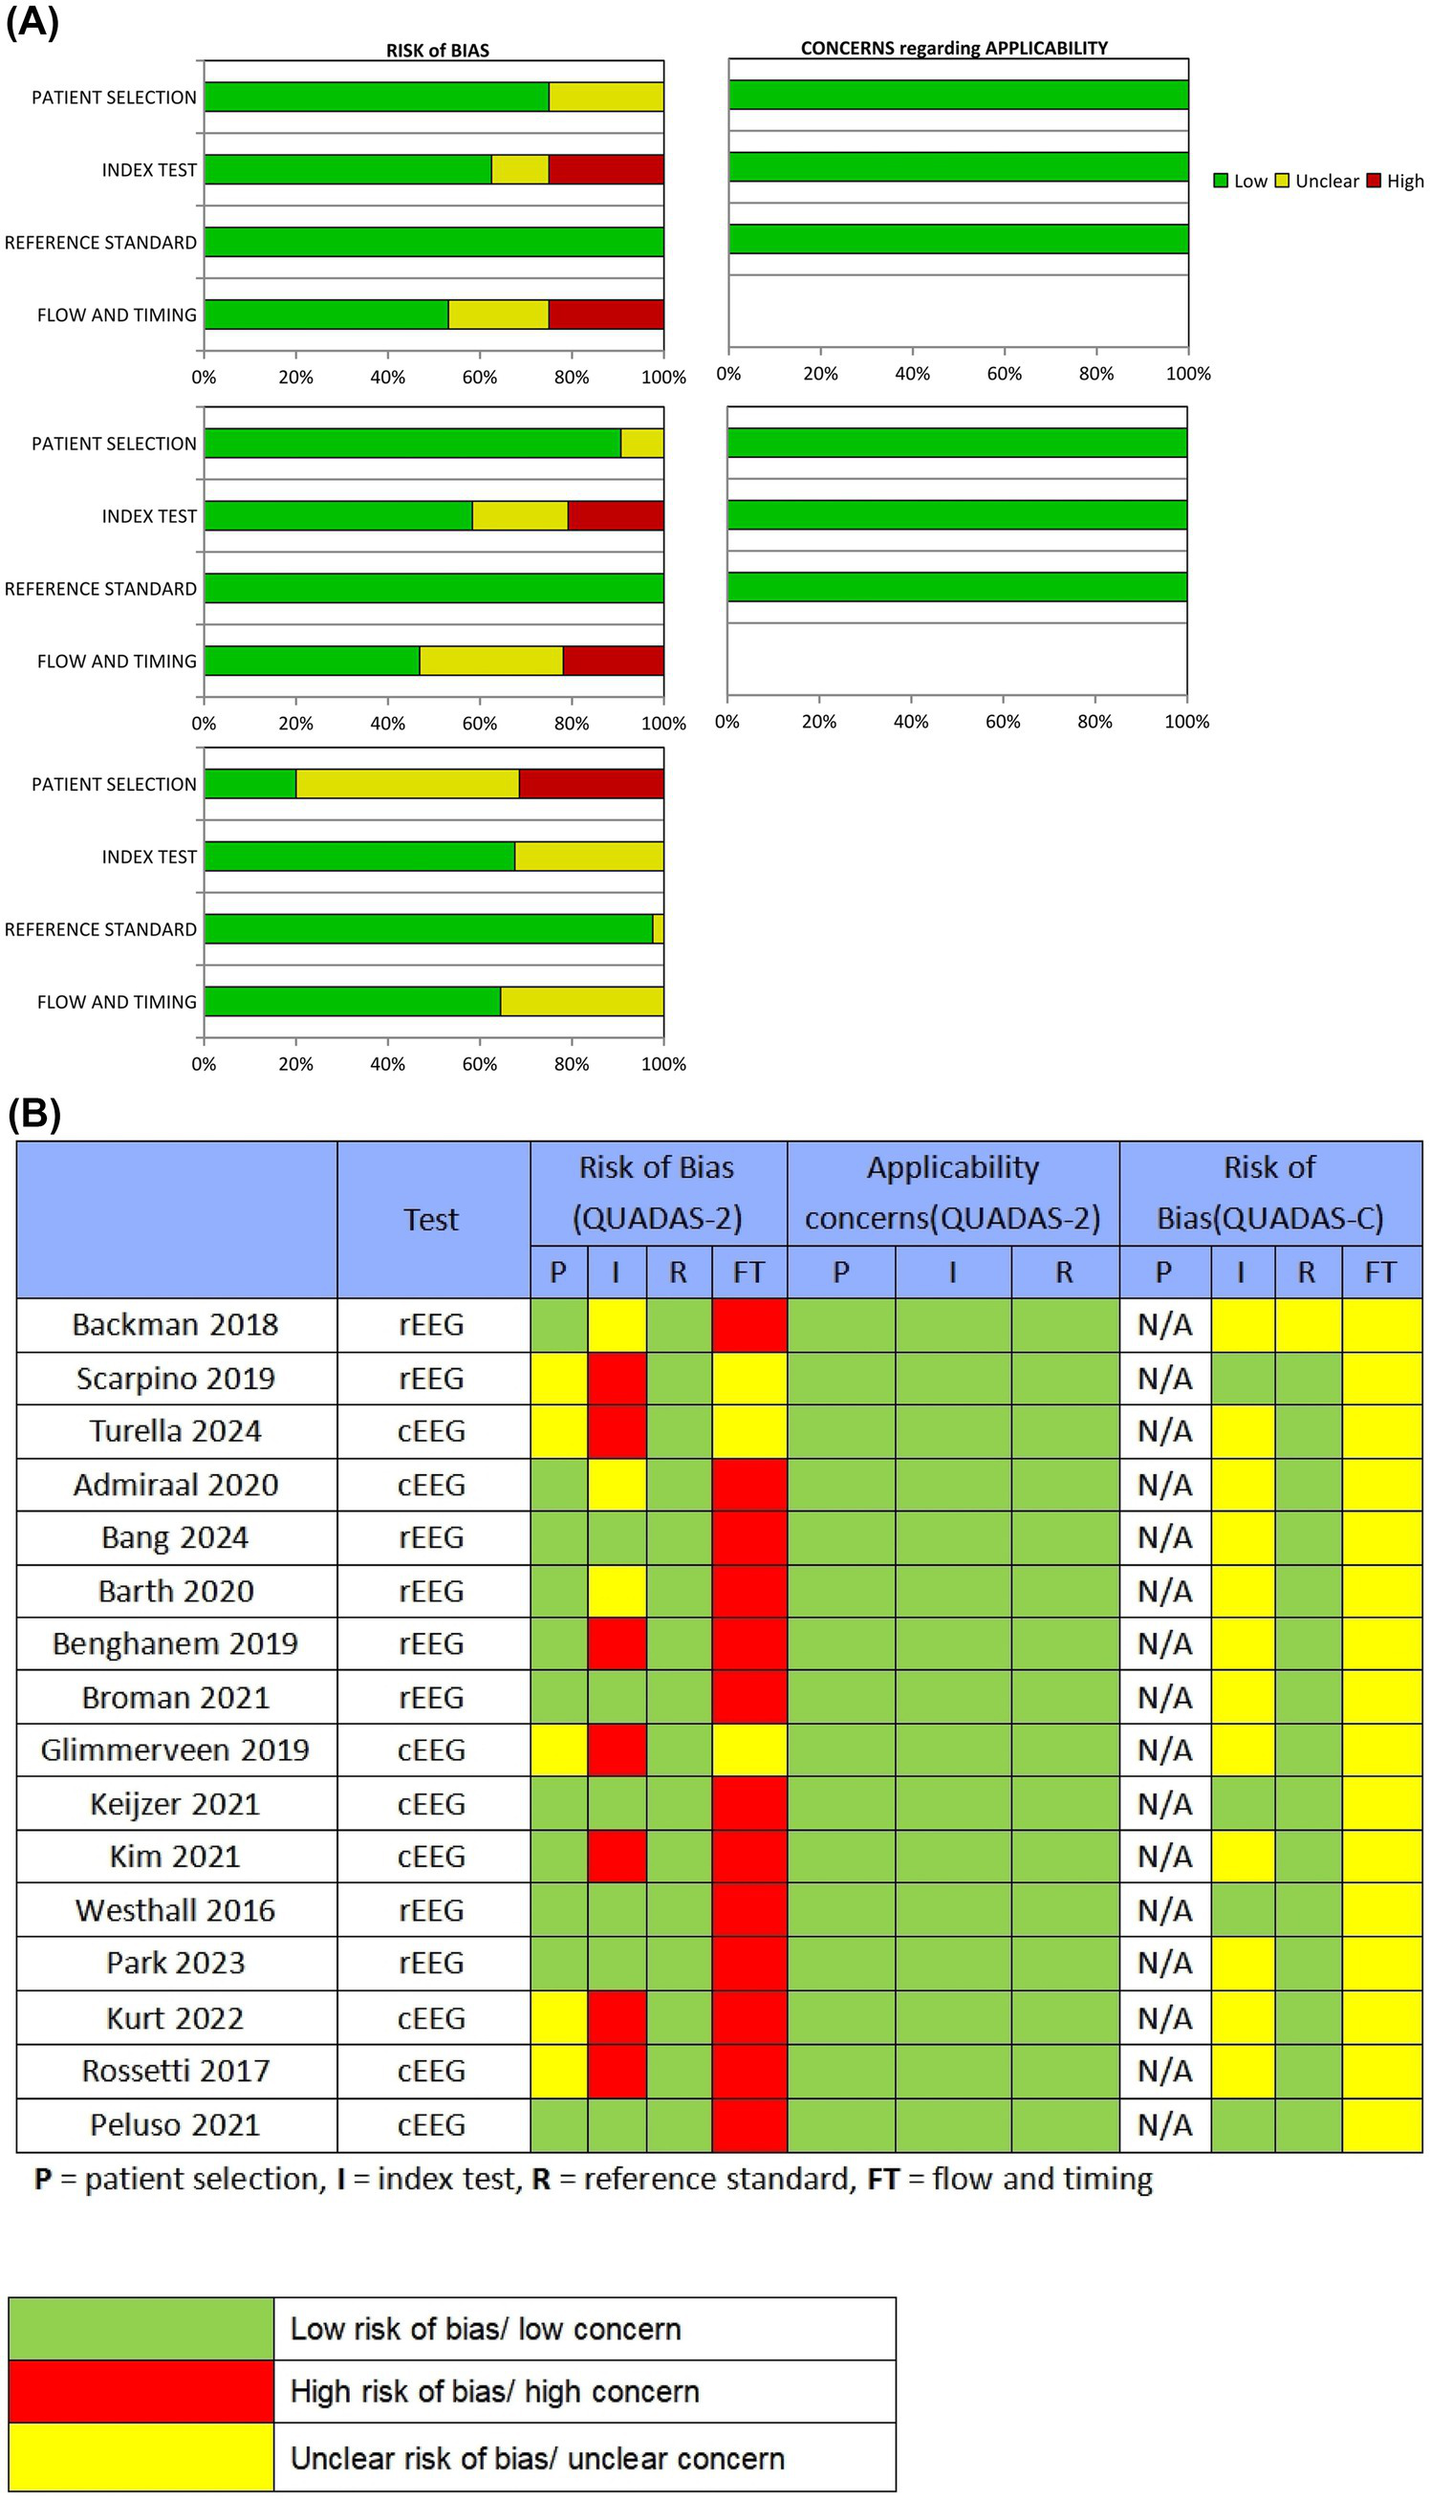
Quality assessment of the included studies. (A) Review authors’ judgments presented as percentages for the included studies; (B) Review authors’ judgments for each individual study. P = patient selection, I = index test, R = reference standard, FT = flow and timing.
3.4 Analysis of diagnostic performance
We conducted diagnostic meta-analyses on eight studies of cEEG and eight studies of rEEG; analysis indicated that both monitoring strategies exhibited high diagnostic accuracy for predicting outcomes after CA.
3.4.1 Diagnostic performance of cEEG
Based on the pooled analysis of eight studies (13, 32–38), the combined sensitivity of cEEG for predicting unfavorable outcomes after CA was 0.53 (95% CI: 0.45–0.61; I2 = 94.63%), thus indicating moderate sensitivity for identifying patients with unfavorable outcomes. The combined specificity was 0.99 (95% CI: 0.97–1.00; I2 = 93.46%), thus suggesting extremely high accuracy for ruling out favorable outcomes. Despite substantial heterogeneity among studies (I2 > 90%), cEEG remains widely used in clinical practice for prognostic evaluation after CA (Figure 3).
Figure 3

The combined sensitivity and specificity of cEEG for diagnostic purposes; cEEG, continuous electroencephalography.
3.4.2 Diagnostic performance of rEEG
Based on the pooled analysis of eight studies (39–46), the diagnostic performance of rEEG for predicting unfavorable outcomes after CA had a combined sensitivity of 0.50 (95% CI: 0.42–0.58; I2 = 93.02%) and a combined specificity of 0.97 (95% CI: 0.92–0.99; I2 = 90.97%) (Figure 4).
Figure 4

The combined sensitivity and specificity of rEEG for diagnostic purposes; rEEG, routine electroencephalography.
3.4.3 SROC curve analysis
To comprehensively evaluate the overall diagnostic performance of cEEG and rEEG for the prediction of unfavorable outcomes after CA, we plotted SROC curves and calculated the AUC to reflect overall diagnostic accuracy; values closer to 1.0 indicated higher levels of performance. The AUC of the cEEG SROC curve was 0.85 (95% CI: 0.81–0.87), trending toward the upper-left corner, thus indicating good overall diagnostic accuracy. The AUC of the rEEG SROC curve was 0.75 (95% CI: 0.71–0.78), with a trajectory similar to that of cEEG, thus indicating moderately high discriminative ability (Figure 5).
Figure 5
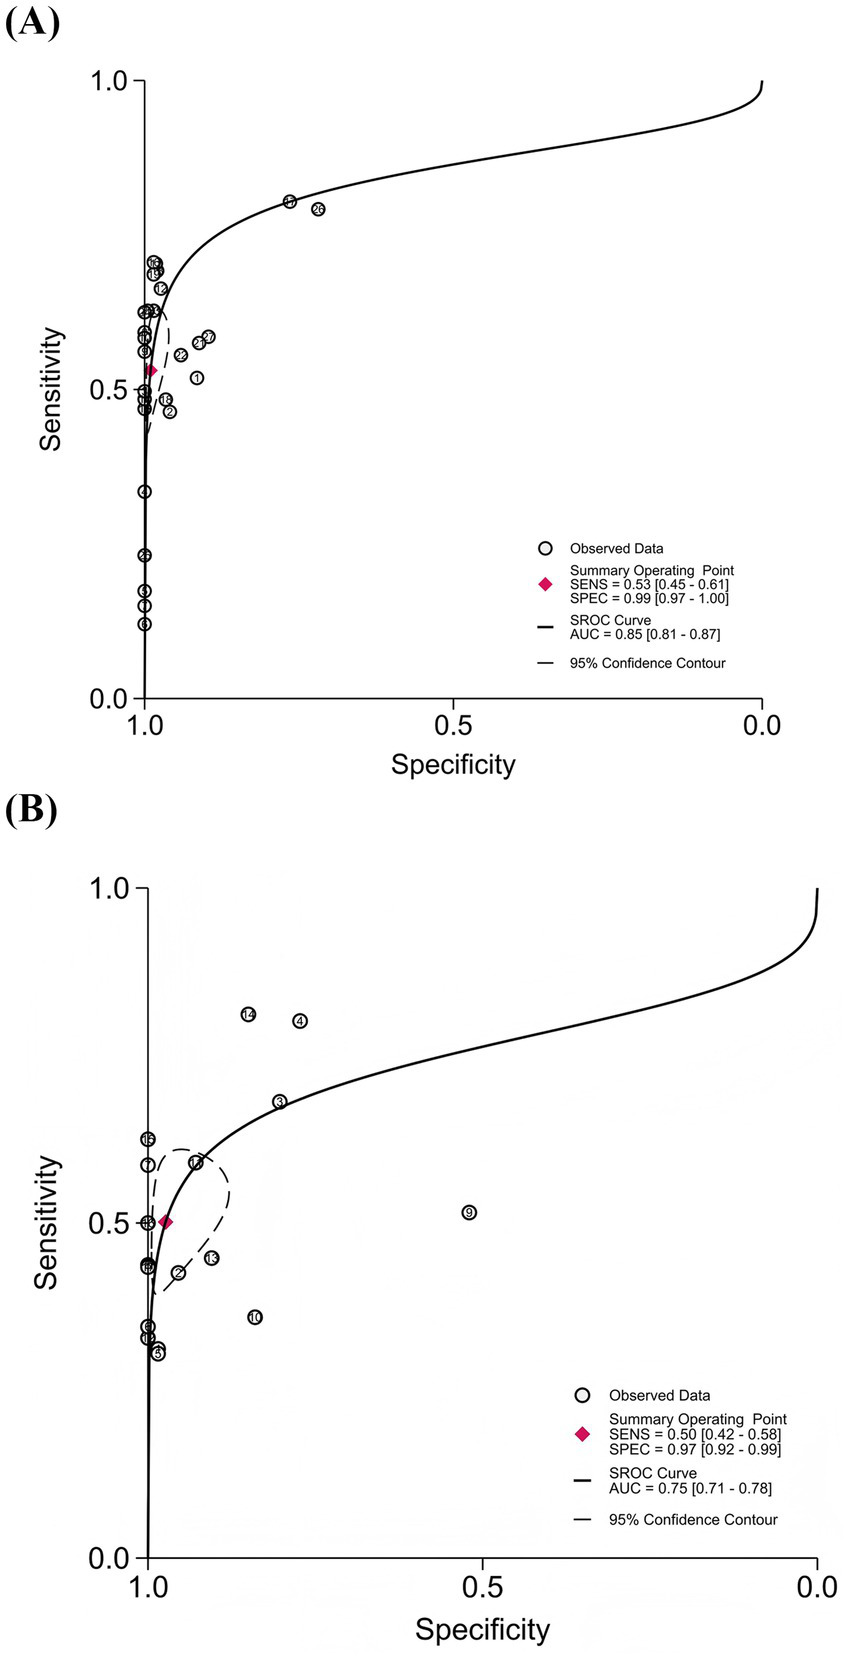
Summary receiver operating characteristic (SROC) curves for cEEG and rEEG in predicting unfavorable outcomes after cardiac arrest. (A) cEEG: AUC = 0.85 (95% CI: 0.81–0.87); (B) rEEG: AUC = 0.75 (95% CI: 0.71–0.78).
3.5 Assessment of publication bias
Publication bias was assessed using Deeks’ test based on the studies included in this meta-analysis (Figure 6). The p values were 0.48 for cEEG (p > 0.05) and 0.05 for rEEG (p = 0.05), thus indicating no significant publication bias for cEEG and mild publication bias for rEEG.
Figure 6
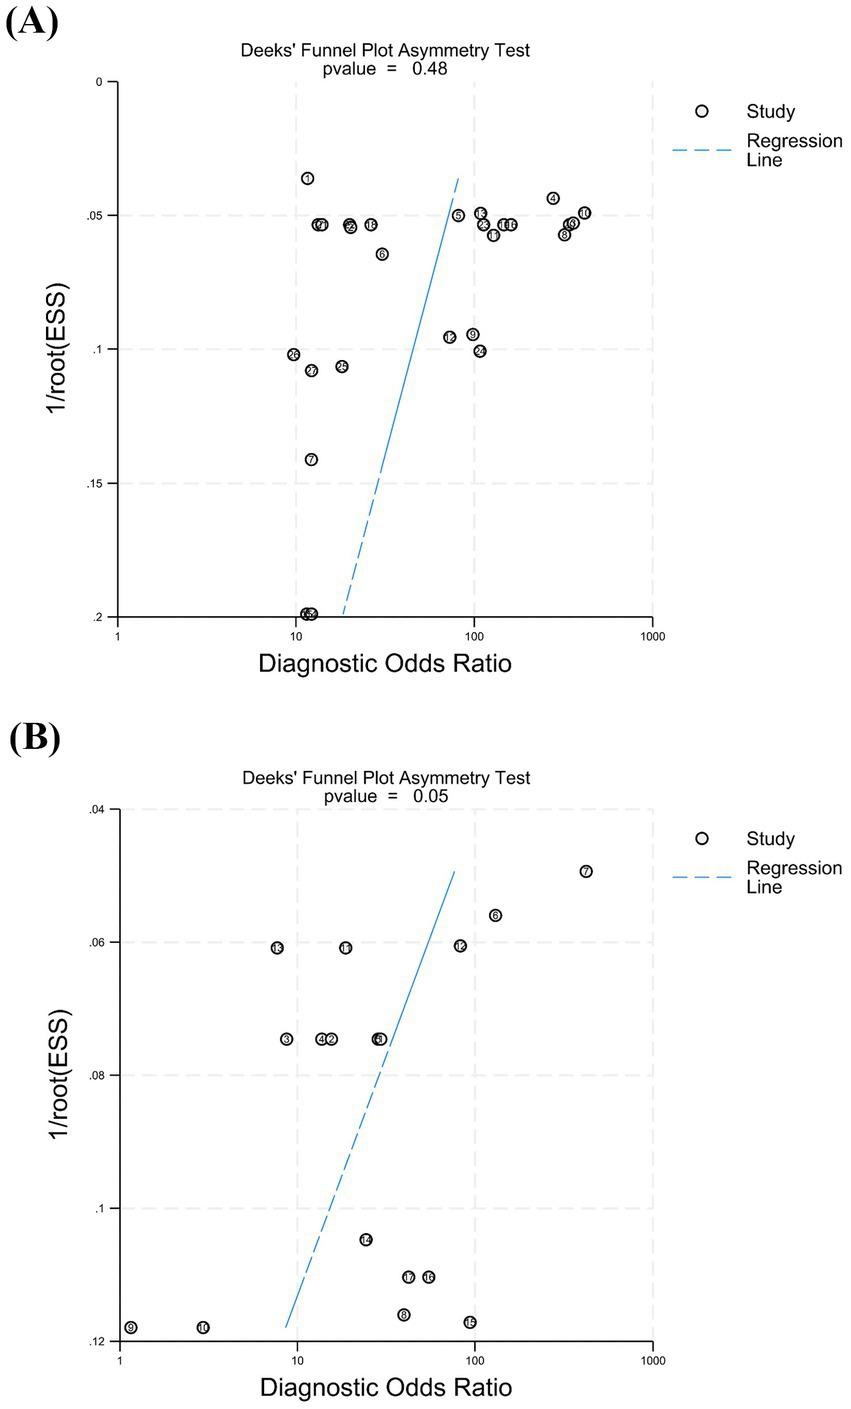
The Deeks’ test was performed to assess publication bias. (A) For cEEG, the p value was 0.48 (p > 0.05), indicating no significant publication bias. (B) For rEEG, the p value was 0.05 (p = 0.05), suggesting mild publication bias.
3.6 Sensitivity analysis
Sensitivity analyses revealed a pooled effect size for DOR of 40.89 (95% CI: 26.08–64.09) for cEEG and a DOR of 15.90 (95% CI: 8.72–28.99) for rEEG, thus indicating comparable diagnostic performance with robust results. The 95% CIs partially overlapped, suggesting no significant difference in predictive value. After sequentially omitting individual studies, point estimates remained within the overall CIs, thus indicating that conclusions did not depend on any single study (Figure 7).
Figure 7

Sensitivity analysis of diagnostic odds ratio (DOR) by sequential exclusion of individual studies. (A) cEEG: pooled DOR = 40.89 (95% CI: 26.08–64.09); (B) rEEG: pooled DOR = 15.90 (95% CI: 8.72–28.99). The consistent estimates after omitting each study indicate robust results.
4 Discussion
EEG is among the most extensively used prognostic tool complementing bedside clinical examination, as this technique enables the specific prediction of neurological outcomes by detecting abnormal neuronal activity (47–49). Prognostic evaluation after CA is central to clinical decision-making and can directly influence therapeutic strategies and informed consent. As an evaluative “gold standard” for post-CA brain function, cEEG has been increasingly used for neuro-monitoring in critically ill patients (47); the high specificity of this technique confers irreplaceable value in the diagnosis of poor prognosis. However, the broad implementation of cEEG is limited by high cost, resource intensity, and low availability, preventing many patients from timely cEEG assessment. In this context, whether the more convenient and economical rEEG can achieve a diagnostic performance comparable to cEEG has become a pressing clinical question.
With increasing attention to post-CA neuroprognostication, the value of rEEG has been actively explored (50–52), yet findings remain inconsistent. To systematically evaluate and clarify the diagnostic performance and clinical utility of cEEG and rEEG, we conducted a meta-analysis of the literature to comprehensively assess both modalities for predicting unfavorable outcomes after CA.
Our meta-analysis revealed that cEEG had a pooled sensitivity of 0.53, a specificity of 0.99, and an AUC of 0.85. In contrast, rEEG had a pooled sensitivity of 0.50, a specificity of 0.97, and an AUC of 0.75. Collectively, these results indicate that both EEG modalities exhibited very high specificity, supporting their reliability for ruling out favorable outcomes and assisting clinical decision-making. However, both techniques demonstrated only moderate sensitivity, highlighting limitations in the identification of patients with unfavorable outcomes. From an overall perspective, both AUCs exceeded the 0.75 threshold, thus indicating good discriminative capacity. Notably, rEEG exhibited comparable pooled sensitivity to cEEG and can be completed over a shorter time without prolonged monitoring. This advantage affords an overall diagnostic performance for rEEG that is similar to cEEG in terms of rapid prognostic evaluation, thus suggesting its potential as a practical alternative in settings requiring prompt decisions or with limited monitoring resources.
Sensitivity analyses yielded an DOR of 40.89 for cEEG and an DOR of 15.90 for rEEG, with partially overlapping 95% CIs, thus indicating broadly similar overall effects and no significant difference in diagnostic performance. Publication-bias analysis yielded p = 0.48 for cEEG according to Deeks’ test, suggesting no significant bias, and p = 0.05 for rEEG, thus suggesting mild bias. Given the considerable heterogeneity across studies, including differences in patient populations, EEG acquisition windows, monitoring duration, interpretive criteria, clinical management, and statistical methods, such bias signal, may partly reflect methodological variation. Despite a mild bias signal for rEEG, sensitivity analyses indicated stable effect sizes and diagnostic performance comparable to cEEG, thus supporting the robustness of our findings.
This meta-analysis has limitations that need to be considered. First, heterogeneity among the included studies was substantial. Potential sources include variability in outcome definitions and thresholds, study designs and patient cohorts, EEG monitoring strategies and procedures, clinical management confounders, and statistical approaches, all of which may contribute to variability in our results. Second, direct head-to-head comparisons of cEEG and rEEG remain scarce; current evidence relies predominantly on indirect comparisons across different studies. Because insufficient research has applied both methods concurrently within the same cohort, we were unable to directly assess differences in diagnostic performance under identical clinical conditions, and residual confounding by population or setting cannot be ruled out. Accordingly, more rigorously designed diagnostic-accuracy studies employing direct comparisons are now needed to further investigate the relative value of cEEG and rEEG in post-CA prognostication.
In summary, rEEG demonstrates a core diagnostic performance that is highly consistent with that of cEEG for the prediction of unfavorable outcomes after CA. These findings provide key evidence to guide the rational selection of neuroprognostic monitoring strategies in resource-limited or rapid-assessment contexts, with important implications for optimizing resource allocation, expanding EEG use in neurocritical evaluation, and improving outcomes for patients after CA. rEEG may serve as an effective alternative or complement to cEEG and play a central role in broader clinical practice.
5 Nomenclature
5.1 Resource identification initiative
As this study is a systematic review and meta-analysis, no primary wet-lab reagents, cell lines, model organisms, or other physical biological resources were used or generated; therefore, there are no Research Resource Identifiers to report. To ensure reproducibility of the analyses, we provide detailed identification of all included studies (including original-study DOIs, PubMed IDs, or other database identifiers), the search strategy, inclusion/exclusion criteria, data extraction procedures, and the code and software versions used for statistical analyses; these materials and code are archived in a public repository with permanent links/DOIs for access and replication.
5.2 Life science identifiers
This manuscript does not involve taxonomic naming acts or registrations; therefore, no life science identifiers (LSIDs) are provided. If LSID-bearing records are cited in future work, we will include the relevant LSIDs and registry links in the appropriate sections and Supplementary materials as required.
Statements
Data availability statement
The original contributions presented in the study are included in the article/Supplementary material, further inquiries can be directed to the corresponding author/s.
Author contributions
JL: Conceptualization, Data curation, Investigation, Methodology, Project administration, Resources, Supervision, Validation, Visualization, Writing – original draft, Writing – review & editing. ZJ: Conceptualization, Data curation, Investigation, Methodology, Project administration, Resources, Software, Supervision, Visualization, Writing – original draft, Writing – review & editing. XL: Conceptualization, Methodology, Project administration, Resources, Validation, Visualization, Writing – review & editing. YY: Conceptualization, Methodology, Project administration, Resources, Validation, Visualization, Writing – review & editing. TZ: Writing – review & editing. HZ: Writing – review & editing. YiW: Writing – review & editing. YuW: Writing – review & editing. ZY: Writing – review & editing. HD: Funding acquisition, Resources, Supervision, Writing – review & editing. NH: Funding acquisition, Resources, Supervision, Visualization, Writing – review & editing.
Funding
The author(s) declared that financial support was received for this work and/or its publication. This research was funded by the National Key Research and Development Program of China (Nos. 2022YFC3601200 and 2022YFE0141300), and the National Natural Science Foundation of China (No. 81920108023).
Conflict of interest
The author(s) declared that this work was conducted in the absence of any commercial or financial relationships that could be construed as a potential conflict of interest.
Generative AI statement
The author(s) declared that Generative AI was not used in the creation of this manuscript.
Any alternative text (alt text) provided alongside figures in this article has been generated by Frontiers with the support of artificial intelligence and reasonable efforts have been made to ensure accuracy, including review by the authors wherever possible. If you identify any issues, please contact us.
Publisher’s note
All claims expressed in this article are solely those of the authors and do not necessarily represent those of their affiliated organizations, or those of the publisher, the editors and the reviewers. Any product that may be evaluated in this article, or claim that may be made by its manufacturer, is not guaranteed or endorsed by the publisher.
Supplementary material
The Supplementary material for this article can be found online at: https://www.frontiersin.org/articles/10.3389/fneur.2026.1760363/full#supplementary-material
- cEEG
Continuous Electroencephalography
- rEEG
Routine Electroencephalography
- QUADAS-2
Quality Assessment of Diagnostic Accuracy Studies 2
- QUADAS-C
Quality Assessment of Diagnostic Accuracy Studies-C
- SROC
Summary Receiver Operating Characteristic
- AUC
Area under the SROC Curve
- CI
Confidence Intervals
- CA
Cardiac Arrest
- ROSC
Return of Spontaneous Circulation
- CPC
The Cerebral Performance Category
- NCSE
Nonconvulsive Status Epilepticus
- VF
Ventricular Fibrillation
- PEA
Pulseless Electrical Activity
- EEG
Electroencephalography
- NSE
Neuron-specific Enolase
- ACNS
The American Clinical Neurophysiology Society
- PRISMA
Preferred Reporting Items for Systematic Reviews and Meta-Analyses
- GCS
Glasgow Coma Score
- TP
True Positives
- FP
False Positives
- FN
False Negatives
- TN
True Negatives
- RoB
Risk of bias
- DOR
Diagnostic Odds Ratio
- CI
The Confidence Intervals.
Glossary
References
1.
Monlezun DJ Sinyavskiy O Peters N Steigner L Aksamit T Girault MI et al . Artificial intelligence-augmented propensity score, cost effectiveness and computational ethical analysis of cardiac arrest and active cancer with novel mortality predictive score. Medicina. (2022) 58:1039. doi: 10.3390/medicina58081039,
2.
Wong CX Brown A Lau DH Chugh SS Albert CM Kalman JM et al . Epidemiology of sudden cardiac death: global and regional perspectives. Heart Lung Circ. (2019) 28:6–14. doi: 10.1016/j.hlc.2018.08.026,
3.
De Spoelstra- Man AME Elbers PWG Van Oudemans- Straaten HM . Making sense of early high-dose intravenous vitamin C in ischemia/reperfusion injury. Crit Care. (2018) 22:70. doi: 10.1186/s13054-018-1996-y,
4.
Sood N Sangari A Goyal A Sun C Horinek M Hauger JA et al . Do cardiopulmonary resuscitation real-time audiovisual feedback devices improve patient outcomes? A systematic review and meta-analysis. World J Cardiol. (2023) 15:531–41. doi: 10.4330/wjc.v15.i10.531,
5.
Lagebrant A Lang M Nielsen N Blennow K Dankiewicz J Friberg H et al . Brain injury markers in blood predict signs of hypoxic ischaemic encephalopathy on head computed tomography after cardiac arrest. Resuscitation. (2023) 184:109668. doi: 10.1016/j.resuscitation.2022.12.006,
6.
Sekhon MS Ainslie PN Griesdale DE . Clinical pathophysiology of hypoxic ischemic brain injury after cardiac arrest: a “two-hit” model. Crit Care. (2017) 21:90. doi: 10.1186/s13054-017-1670-9,
7.
Goto Y Maeda T Nakatsu-Goto Y . Neurological outcomes in patients transported to hospital without a prehospital return of spontaneous circulation after cardiac arrest. Crit Care. (2013) 17:R274. doi: 10.1186/cc13121,
8.
Vanat A Lee JW Elkhider H Novy J Ben-Hamouda N Oddo M et al . Multimodal prediction of favorable outcome after cardiac arrest: a cohort study. Crit Care Med. (2023) 51:706–16. doi: 10.1097/CCM.0000000000005841,
9.
Hill CE Blank LJ Thibault D Davis KA Dahodwala N Litt B et al . Continuous EEG is associated with favorable hospitalization outcomes for critically ill patients. Neurology. (2019) 92:e9–e18. doi: 10.1212/WNL.0000000000006689,
10.
Amorim E Rittenberger JC Zheng JJ Westover MB Baldwin ME Callaway CW et al . Continuous EEG monitoring enhances multimodal outcome prediction in hypoxic–ischemic brain injury. Resuscitation. (2016) 109:121–6. doi: 10.1016/j.resuscitation.2016.08.012,
11.
Berg KM Andersen LW . Should we try longer? Duration of cardiopulmonary resuscitation in the emergency department and association with survival. Resuscitation. (2015) 96:A5–6. doi: 10.1016/j.resuscitation.2015.07.001,
12.
Lee JW . EEG reactivity in coma after cardiac arrest: is it enough to wake up the dead?Epilepsy Curr. (2019) 19:369–71. doi: 10.1177/1535759719875134,
13.
Qing KY Forgacs PB Schiff ND . EEG pattern with spectral analysis can prognosticate good and poor neurologic outcomes after cardiac arrest. J Clin Neurophysiol. (2024) 41:236–44. doi: 10.1097/WNP.0000000000000958,
14.
Nguyen PL Alreshaid L Poblete RA Konye G Marehbian J Sung G . Targeted temperature management and multimodality monitoring of comatose patients after cardiac arrest. Front Neurol. (2018) 9:768. doi: 10.3389/fneur.2018.00768,
15.
Hirsch LJ Fong MWK Leitinger M LaRoche S Beniczky S Abend NS et al . American clinical neurophysiology society’s standardized critical care EEG terminology: 2021 version. J Clin Neurophysiol. (2021) 38:1–29. doi: 10.1097/WNP.0000000000000806,
16.
Fenter H Rossetti AO Beuchat I . Continuous versus routine electroencephalography in the intensive care unit: a review of current evidence. Eur Neurol. (2024) 87:17–25. doi: 10.1159/000535085,
17.
Rubinos C Alkhachroum A Der-Nigoghossian C Claassen J . Electroencephalogram monitoring in critical care. Semin Neurol. (2020) 40:675–80. doi: 10.1055/s-0040-1719073,
18.
Bitar R Khan UM Rosenthal ES . Utility and rationale for continuous EEG monitoring: a primer for the general intensivist. Crit Care. (2024) 28:244. doi: 10.1186/s13054-024-04986-0,
19.
Urbano V Alvarez V Schindler K Rüegg S Ben-Hamouda N Novy J et al Continuous versus routine EEG in patients after cardiac arrest: analysis of a randomized controlled trial (CERTA). Resuscitation, Ireland: 2022, 176: 68–73. doi: 10.1016/j.resuscitation.2022.05.017.
20.
Zafar A . Prevalence, electroclinical spectrum and effect on the outcome of non-convulsive status epilepticus in critically ill patients; the utility of routine electroencephalogram. Epilepsy Behav. (2023) 141:109144. doi: 10.1016/j.yebeh.2023.109144,
21.
Rossetti AO Schindler K Sutter R Rüegg S Zubler F Novy J et al . Continuous vs routine electroencephalogram in critically ill adults with altered consciousness and no recent seizure: a multicenter randomized clinical trial. JAMA Neurol. (2020) 77:1225–32. doi: 10.1001/jamaneurol.2020.2264,
22.
Fatuzzo D Beuchat I Alvarez V Novy J Oddo M Rossetti AO . Does continuous EEG influence prognosis in patients after cardiac arrest?Resuscitation. (2018) 132:29–32. doi: 10.1016/j.resuscitation.2018.08.023,
23.
Urbano V Novy J Schindler K Rüegg S Alvarez V Zubler F et al . Continuous versus routine EEG in critically ill adults: reimbursement analysis of a randomised trial. Swiss Med Wkly. (2021) 151:w20477. doi: 10.4414/smw.2021.20477,
24.
Willems LM Rosenow F Knake S Beuchat I Siebenbrodt K Strüber M et al . Repetitive electroencephalography as biomarker for the prediction of survival in patients with post-hypoxic encephalopathy. J Clin Med. (2022) 11:6253. doi: 10.3390/jcm11216253,
25.
McInnes MDF Moher D Thombs BD McGrath TA Bossuyt PM Clifford T et al . Preferred reporting items for a systematic review and meta-analysis of diagnostic test accuracy studies: the PRISMA-DTA statement. JAMA. (2018) 319:388. doi: 10.1001/jama.2017.19163,
26.
Jacobs I Nadkarni V Bahr J Berg RA Billi JE Bossaert L et al . Cardiac arrest and cardiopulmonary resuscitation outcome reports: update and simplification of the Utstein templates for resuscitation registries: a statement for healthcare professionals from a task force of the international liaison committee on resuscitation (American Heart Association, European resuscitation council, Australian resuscitation council, New Zealand resuscitation council, Heart and Stroke Foundation of Canada, InterAmerican Heart Foundation, resuscitation councils of southern Africa). Circulation. (2004) 110:3385–97. doi: 10.1161/01.CIR.0000147236.85306.15,
27.
Moher D Liberati A Tetzlaff J Altman DG PRISMA Group . Preferred reporting items for systematic reviews and meta-analyses: the PRISMA statement. Open Med. (2009) 3:e123–30. doi: 10.1371/journal.pmed.1000097,
28.
Whiting PF Rutjes AWS Westwood ME Mallett S Deeks JJ Reitsma JB et al . QUADAS-2: a revised tool for the quality assessment of diagnostic accuracy studies. Ann Intern Med. (2011) 155:529–36. doi: 10.7326/0003-4819-155-8-201110180-00009,
29.
Yang B Mallett S Takwoingi Y Davenport CF Hyde CJ Whiting PF et al . QUADAS-C: a tool for assessing risk of Bias in comparative diagnostic accuracy studies. Ann Intern Med. (2021) 174:1592–9. doi: 10.7326/M21-2234,
30.
Higgins JPT . Measuring inconsistency in meta-analyses. BMJ. (2003) 327:557–60. doi: 10.1136/bmj.327.7414.557,
31.
Greiner M Pfeiffer D Smith RD . Principles and practical application of the receiver-operating characteristic analysis for diagnostic tests. Prev Vet Med. (2000) 45:23–41. doi: 10.1016/S0167-5877(00)00115-X,
32.
Glimmerveen AB Ruijter BJ Keijzer HM Tjepkema-Cloostermans MC van Putten M Hofmeijer J . Association between somatosensory evoked potentials and EEG in comatose patients after cardiac arrest. Clin Neurophysiol. (2019) 130:2026–31. doi: 10.1016/j.clinph.2019.08.022,
33.
Kim YJ Kim MJ Kim YH Youn CS Cho IS Kim SJ et al . Background frequency can enhance the prognostication power of EEG patterns categories in comatose cardiac arrest survivors: a prospective, Multicenter, observational cohort study. Crit Care. (2021) 25:398. doi: 10.1186/s13054-021-03823-y,
34.
Turella S Dankiewicz J Ben-Hamouda N Nilsen KB Düring J Endisch C et al . EEG for good outcome prediction after cardiac arrest: a multicentre cohort study. Resuscitation. (2024) 202:110319. doi: 10.1016/j.resuscitation.2024.110319,
35.
Admiraal MM Horn J Hofmeijer J Hoedemaekers CWE Van Kaam C Keijzer HM et al . EEG reactivity testing for prediction of good outcome in patients after cardiac arrest. Neurology. (2020) 95:e653–61. doi: 10.1212/WNL.0000000000009991,
36.
Rossetti AO Tovar Quiroga DF Juan E Novy J White RD Ben-Hamouda N et al . Electroencephalography predicts poor and good outcomes after cardiac arrest: a two-Center study. Crit Care Med. (2017) 45:e674–82. doi: 10.1097/CCM.0000000000002337,
37.
Peluso L Boisdenghien T Attanasio L Annoni F Mateus Sanabria L Severgnini P et al . Multimodal approach to predict neurological outcome after cardiac arrest: a single-Center experience. Brain Sci. (2021) 11:888. doi: 10.3390/brainsci11070888,
38.
Keijzer HM Verhulst MML Meijer FJA Tonino BAR Bosch FH Klijn CJM et al . Prognosis after cardiac arrest: the additional value of DWI and FLAIR to EEG. Neurocrit Care. (2022) 37:302–13. doi: 10.1007/s12028-022-01498-z,
39.
Park JS Kim EY You Y Min JH Jeong W Ahn HJ et al . Combination strategy for prognostication in patients undergoing post-resuscitation care after cardiac arrest. Sci Rep. (2023) 13:21880. doi: 10.1038/s41598-023-49345-1,
40.
Bang HJ Youn CS Sandroni C Park KN Lee BK Oh SH et al . Good outcome prediction after out-of-hospital cardiac arrest: a prospective Multicenter observational study in Korea (the KORHN-PRO registry). Resuscitation. (2024) 199:110207. doi: 10.1016/j.resuscitation.2024.110207,
41.
Backman S Cronberg T Friberg H Ullén S Horn J Kjaergaard J et al . Highly malignant routine EEG predicts poor prognosis after cardiac arrest in the target temperature management trial. Resuscitation. (2018) 131:24–8. doi: 10.1016/j.resuscitation.2018.07.024,
42.
Scarpino M Lolli F Lanzo G Carrai R Spalletti M Valzania F et al . Neurophysiology and neuroimaging accurately predict poor neurological outcome within 24 hours after cardiac arrest: the ProNeCA prospective multicentre prognostication study. Resuscitation. (2019) 143:115–23. doi: 10.1016/j.resuscitation.2019.07.032,
43.
Westhall E Rossetti AO Van Rootselaar AF Wesenberg Kjaer T Horn J Ullén S et al . Standardized EEG interpretation accurately predicts prognosis after cardiac arrest. Neurology. (2016) 86:1482–90. doi: 10.1212/WNL.0000000000002462,
44.
Broman NJ Backman S Westhall E . Stimulus-induced EEG-patterns and outcome after cardiac arrest. Clin Neurophysiol Pract. (2021) 6:219–24. doi: 10.1016/j.cnp.2021.07.001,
45.
Barth R Zubler F Weck A Haenggi M Schindler K Wiest R et al . Topography of MR lesions correlates with standardized EEG pattern in early comatose survivors after cardiac arrest. Resuscitation. (2020) 149:217–24. doi: 10.1016/j.resuscitation.2020.01.014,
46.
Benghanem S Paul M Charpentier J Rouhani S Ben Hadj Salem O Guillemet L et al . Value of EEG reactivity for prediction of neurologic outcome after cardiac arrest: insights from the Parisian registry. Resuscitation. (2019) 142:168–74. doi: 10.1016/j.resuscitation.2019.06.009,
47.
Falsaperla R Scalia B Giaccone F Suppiej A Pulvirenti A Mailo J et al . aEEG vs cEEG’s sensivity for seizure detection in the setting of neonatal intensive care units: a systematic review and meta-analysis. Acta Paediatr. (2022) 111:916–26. doi: 10.1111/apa.16251,
48.
Wang X Trabatti C Weeke L Dudink J Swanenburg de Veye H Eijsermans RMJ et al . Early qualitative and quantitative amplitude-integrated electroencephalogram and raw electroencephalogram for predicting long-term neurodevelopmental outcomes in extremely preterm infants in the Netherlands: a 10-year cohort study. Lancet Digit Health. (2023) 5:e895–904. doi: 10.1016/S2589-7500(23)00198-X,
49.
Zheng WL Amorim E Jing J Wu O Ghassemi M Lee JW et al . Predicting neurological outcome from electroencephalogram dynamics in comatose patients after cardiac arrest with deep learning. IEEE Trans Biomed Eng. (2022) 69:1813–25. doi: 10.1109/TBME.2021.3139007,
50.
Lin Y Zhang G Wang Y Chai J Jiang X Li C et al . Prognostic evaluation of child patients with infectious encephalitis through AEEG and REEG. Exp Ther Med. (2018) 16:5243–7. doi: 10.3892/etm.2018.6882,
51.
Loser V Rossetti AO Rasic M Novy J Schindler KA Rüegg S et al . Relevance of continuous EEG versus routine EEG for outcome prediction after traumatic brain injury. Eur Neurol. (2024) 87:306–11. doi: 10.1159/000541335,
52.
Tayeb HO Yaghmoor BE Basheikh M Alyoubi RA Zamzami AM Almalki AA et al . The diagnostic yield of the routine EEG at a tertiary Care Center in Saudi Arabia: a retrospective study. Epilepsy Res. (2020) 166:106366. doi: 10.1016/j.eplepsyres.2020.106366,
Summary
Keywords
cardiac arrest, EEG, electroencephalography, meta-analysis, prognostic
Citation
Lin J, Ji Z, Lin X, Yan Y, Zheng T, Zhang H, Wu Y, Wang Y, Yu Z, Di H and Hu N (2026) cEEG and rEEG detection rates of prognostic indicators in cardiac arrest patients: a systematic review and diagnostic meta-analysis. Front. Neurol. 17:1760363. doi: 10.3389/fneur.2026.1760363
Received
04 December 2025
Revised
24 January 2026
Accepted
29 January 2026
Published
18 February 2026
Volume
17 - 2026
Edited by
Mikhail Sinkin, Research Institute of Emergency Care, Russia
Reviewed by
Muhammad Adnan Haider, Mission Hospitals–Mission Campus, United States
Amayak Broutian, Research Center of Neurology, Russia
Updates
Copyright
© 2026 Lin, Ji, Lin, Yan, Zheng, Zhang, Wu, Wang, Yu, Di and Hu.
This is an open-access article distributed under the terms of the Creative Commons Attribution License (CC BY). The use, distribution or reproduction in other forums is permitted, provided the original author(s) and the copyright owner(s) are credited and that the original publication in this journal is cited, in accordance with accepted academic practice. No use, distribution or reproduction is permitted which does not comply with these terms.
*Correspondence: Haibo Di, dihaibo19@aliyun.com; Nantu Hu, hunt@hznu.edu.cn
†These authors have contributed equally to this work and share first authorship
Disclaimer
All claims expressed in this article are solely those of the authors and do not necessarily represent those of their affiliated organizations, or those of the publisher, the editors and the reviewers. Any product that may be evaluated in this article or claim that may be made by its manufacturer is not guaranteed or endorsed by the publisher.